Abstract
Human health is dependent on the Indoor Air Quality (IAQ) of residential and public buildings, where people spend a substantial amount of time. Part of IAQ parameters, like temperature or humidity influence the thermal comfort of users, whereas too high carbon dioxide concentration (CO2) could cause various complaints or diseases. In buildings like offices and schools, where we have a brush with a high density of users, the main source of CO2 is simply people. The type of their activity brings higher or lower carbon dioxide gains, that must be taken into account to design and properly use room ventilation, allowing recommended CO2 levels not to be exceeded. This paper presents an approach to marking human CO2 generation off by using an experimental method. The method was verified based on measuring results of six test series conducted in different types of rooms at Bialystok University of Technology (Poland) during lectures, meetings, projects and laboratories. Carbon dioxide gains were comparable with an average value of 0.0045 L/s, which corresponds to theoretical CO2 generation rates that are symptomatic of males and females, between 16 and 30 years old, with low physical activity.
1. Introduction
Indoor Air Quality (IAQ) is an important indicator in the sustainability analysis of a building, included in social benefit and usability categories [1], but also in economic aspects, due to its possible influence on the ventilation of the building and the corresponding energy consumption.
Maintaining a proper quality of indoor air in buildings is very important for their users. There are lots of factors that influence IAQ, as shown in [1]: including physical, chemical, and biological parameters as well as inadequate ventilation, indoor sources of air pollution like HVAC (heating, ventilation and air conditioning) systems, building equipment, furnishings, and human activities.
As described in the literature [2,3,4,5], a long-term staying in an environment with a bad IAQ results in the occurrence of different complaints: headaches, eyes and skin irritation, nausea, dizziness etc. The main reason for the poor IAQ in buildings is the high CO2 concentration in rooms, produced by the high human occupancy and inadequate ventilation.
The sick building syndrome (SBS) symptoms noted among the users of multi-story building exhibited a strong association with carbon dioxide (CO2) concentrations, that during the research were in a range between 467 to 2800 ppm [6]. Authors found that tiredness and dizziness were associated with CO2 level, CO2 concentrations was irrelevant to respiratory, eye or skin symptoms. On the other hand, results described by Apte et al., [7] indicated association between CO2 concentration and the SBS symptoms like sore throat, stuffy nose, chest tightness and wheezing. Therefore, even though carbon dioxide concentration, is not considered particularly dangerous as such its high level could result in a room occupants becoming drowsy, fatigued and with insufficient ability to concentrate. A review of the literature conducted by Johnsona et al., [8] showed that there was an association between low-level exposure to CO2 beginning at 700 ppm and building-related symptoms, whereas respiratory symptoms were indicated in children in a case of indoor CO2 concentrations higher than 1000 ppm. However it was not possible to eliminate other causes of health problems. As highlighted by Meciarova et al., [9], CO2 is not considered a pollutant of concern, but as an indicator of how well other people-related pollutants are controlled—particularly odor-causing compounds. As underlined by Lu et al., [6], the concentration of CO2 in office buildings is primarily dependent on occupant density and ventilation rates. It is worth noting that CO2 concentration is often found above recommendations in buildings with high people density and insufficient ventilation, especially schools [10,11,12,13,14,15,16,17]. Problems with CO2 concentration in residential buildings were discussed by Mainka et al., [18].
Nowadays, the ASHRAE (American Society of Heating, Refrigerating and Air Conditioning Engineers) standard [19] recommends indoor CO2 concentrations less than 700 ppm above the outdoor concentration, giving also a guideline of 1000 ppm. Thus, the CO2 recommended level is significantly lower than several years ago. As analyzed by Persily et al., [20] in 1981 the CO2 limit of 4500 mg/m3 (2500 ppm) was proposed in an appendix, while in 1989 the value was decreased by 60% to 1800 mg/m3 (1000 ppm) and such a level was maintained in the 1999 and 2001 versions of the Standard 62.
Sufficiently high ventilation is needed to remove air pollutants, including CO2, and avoid health problems. However, high ventilation and ACH (air change rates per hour) increases the energy consumption of the building. Thus a proper ventilation design as well as its regulation during operation process is crucial, with an optimal air flow that allows reasonable energy consumption in buildings also to established, in times of an adequate CO2 concentration, as well as maintaining a proper microclimate for occupants of the building.
There are different methods for estimation of building ventilation, including ACHs and air flow. A large part of them is based in the measurement of CO2 produced by occupants as a tracer gas [21,22,23]. This type of methods needs the knowledge of CO2 gain from people. A better knowledge of this parameter will allow us to have better information about the ventilation and air renovation rate in the building and improve the design and regulation of the ventilation systems.
Currently, the CO2 gains from people are estimated from a metabolic approach (see Section 2). In this approach, CO2 gains depend on age, gender, activity and metabolism. In a big group with diverse age and gender composition, the variability of occupants could affect to the accuracy of results. Uncertainties of activity and metabolism can have even greater influence as evidenced by Batterman et al., [24]. Batterman et al., also studied the influence of prior activity on the method. So, a method is needed to obtain more realistic estimates of CO2 gains and which could also be representative for each condition.
To the best knowledge of the authors, contrary to the widely established methods based on metabolic calculations, there is a lack of experimental methods that can be used with the purpose of obtaining direct representatives CO2 gains from people in buildings and allow the obtained results to be compared with the theoretical metabolic values in each condition.
This work presents a new experimental method for the determination of this CO2 gain based on measurements of the dependence of CO2 concentration on time. The method was tested in six educational rooms with different size, occupancy and age. Results are compared with metabolic values given in the literature.
2. Theoretical CO2 Gains from People
The changes of carbon dioxide concentration in buildings occupied by many users are mainly influenced by CO2 gains from people, that depend on their activity.
As shown in the literature [24,25,26], a metabolic rate depends on many factors, for example: temperature and its variation, gender or garbing type. According to Ainsworth et al., [27] we can estimate the CO2 gains from people from the Equation (1):
where: RQ is the respiratory ratio, BMR is a basal metabolic rate in MJ/day that is the amount of energy that one’s body needs to accomplish its most basic life-sustaining functions, and M is the metabolic rate in MET [28,29].
g[L/s] = 0.000569 RQ BMR M
Table 1 shows the BMR and CO2 gains from a person in L/s for adults with ages between 16 and 60 years old in sedentary activity, M = 1.3 MET.

Table 1.
Basal metabolic rate (BMR) and CO2 gains from 16 to 60 years old (y.o.) people with a metabolic rate of M = 1.3 MET.
Some authors use RQ = 0.85, while others, following recommendations given in papers [8,24] and assuming RQ = 0.83, use an expression for CO2 volumetric generation rate g for school age children (the Equation (2)):
where S is the Dubois surface area in m2, depending on height and weight, and MET is the metabolic rate per unit of surface area in W/m2 (1.4 for children and 1.7 for adults).
g = 1.4304 S MET
Factors influencing MET value and errors in its estimations were discussed by Kozey et al., [30] and Plowman and Smith [31].
CO2 gains from children were estimated as 0.216–0.217 L/min, while the values for adult males and females were found to be 0.500 and 0.442 L/min, respectively [8].
It is worth noting, that as presented by Qi et al., [32], widely used methods require good estimates of human CO2 generation rates because some indicators in the equations are not valid. Results of their research on Chinese people at positions of quiet sitting and relaxed standing, showed an over-prediction of CO2 generation rates, that could be corrected with a factor of 0.75 for Chinese females and of 0.85 for Chinese males. This example shows that more research in this field is needed.
3. Materials and Method
3.1. Method for Determination of CO2 Gains from People
Our method is based on the evolution of CO2 concentration in indoor air. Previous studies have been described in [33,34] and presented as a useful e-tool [35]:
where ACH is the air change rate in h−1, t is time in h, P is pressure in Pa, CCO2in and CCO2out are carbon dioxide concentrations in indoor and outdoor air, respectively, in ppm, V is the room volume in m3, g are CO2 human gains in g/(h person), N is the number of occupants, T is the temperature in K, while R and μCO2 are constants, the gas constant and CO2 molar mass respectively.
According this equation, CO2 concentration in a building is continuously for low ventilation. Higher ventilation produces a reduction of this concentration and stabilization at a given value (Figure 1a). As a result of multiplying the CO2 concentration by a factor (1 + ACH t) a linear dependence on time is obtained (Equation (4)) when indoor temperature and pressure remain approximately constant (large rooms) (Figure 1b):
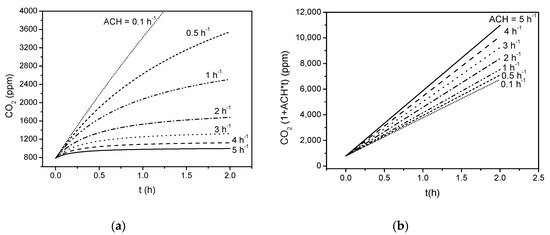
Figure 1.
Theoretical time variation of CO2 concentration (a) and CO2 concentration multiplied by the factor (1 + ACH t), (b) for different ACH values.
The slope of this linear dependence on time, m, is given by Equation (5):
3.2. Experimental Measurement Method
To verify the method, we conducted measurements in several rooms located in different parts of a building that belongs to the Faculty of Environmental and Civil Engineering (Bialystok University of Technology, Poland). The experiment was carried out in the meeting rooms, computer classrooms, a project room and a workshop classroom (Figure 2). Physical activity was sedentary in every case, from passive participation in lectures to a slight locomotion during workshops. In the experiment as many men as women took part.
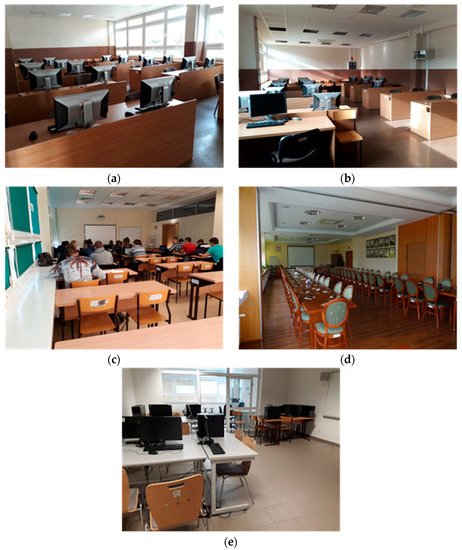
Figure 2.
Photos of tested rooms: (a) Computer classroom 1, (b) Computer classroom 2, (c) Project Room, (d) Meeting Room, (e) Workshop classroom.
There was a natural ventilation in the meeting, computer and project rooms, thus air inflow was in the area of external windows (in all cases windows occupied one external wall) and air exhaust was provided by outlets in the opposite walls, near ceilings. In order to determine the effect of ventilation on the results of the methods, rooms had variation in the quality and tightness of windows, in the location in terms of cardinal directions and in the wind power, however the range of ACH was in a range from 0.3 h−1 to 0.55 h−1. Thus, an additionally workshop room with mechanical ventilation (ceilings diffusers and extractors) was selected. It allowed a higher ACH (1.15 h−1), constant during both test series, to be obtained. During the tests the ACH was estimated based on airflow (measurements of exhaust air velocity and area of the stack ventilation grids) and room volume.
Also, measurements with a different density of occupants (from 0.066 to 0.191 people/m3) and volume (from 88.9 to 308.8 m3) are presented and analyzed. Finally, the method was repeated twice under similar experimental conditions, to determinate its repeatability. Characteristics of the tested rooms are shown in Table 2.
Table 2.
Parameters of tested rooms.
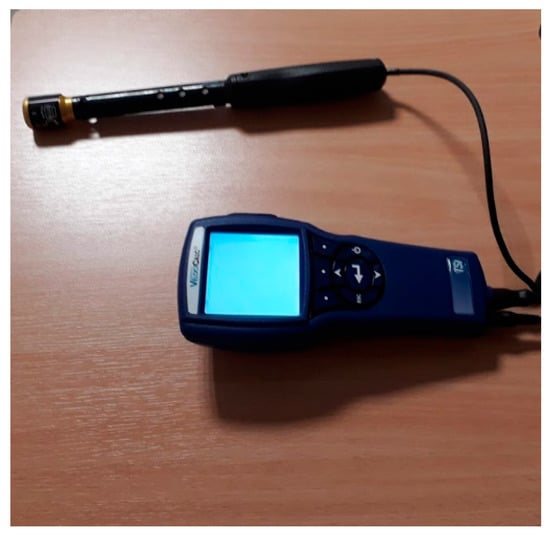
Figure 3.
Multi-function meter TSI 9565.
Table 3.
Basic parameters of the multi-function meter.
The equipment location was fixed after taking into account recommendations of Brulinska et al., [36] that claimed the most favourable positioning of the carbon dioxide sensor to be in the centre of the room, far from heat sources like radiators, walls etc. Also, Oliveira et al., [37] demonstrated that CO2 concentration measurements in different sensor positions revealed low variability, that is always lower that the sensibility of the sensor. This fact confirms that this central position is representative of CO2 concentration inside the room, thus, the multi-function meter was placed on a stand in the room center, about 1.0 m above the floor.
The multifunction meter was also used to determined atmospheric conditions during measurements: indoor, and outdoor pressure and temperature, outdoor CO2 concentration, etc., which were necessary to determine the CO2 gains by people according to Equations 5. Values of these parameters are shown in Table 4.
Table 4.
Atmospheric conditions during measurements.
4. Results and Discussion
Temporal variations of CO2 concentrations and the variation corrected by multiplication of the factor (1 + ACH t) for five rooms are presented in Figure 4, Figure 5, Figure 6, Figure 7 and Figure 8 together with linear fitting. In the case of the workshop classroom, measurements were repeated twice with similar conditions in order to determine the method of reproducibility.
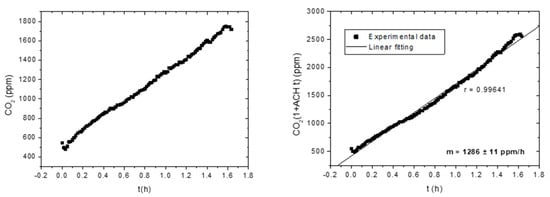
Figure 4.
Temporal variations of CO2 concentrations and variation corrected by the factor (1+ ACH t) for the computer classroom 1.
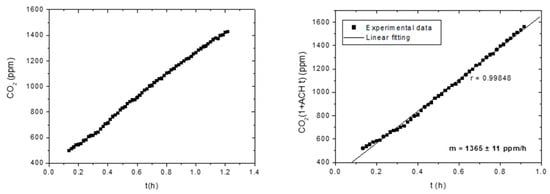
Figure 5.
Temporal variation of CO2 concentrations and variation corrected by the factor (1+ ACH t) for the computer classroom 2.
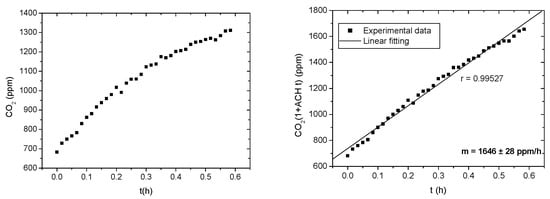
Figure 6.
Temporal variation of CO2 concentrations and this variation corrected the factor (1+ ACH t) for the project room.
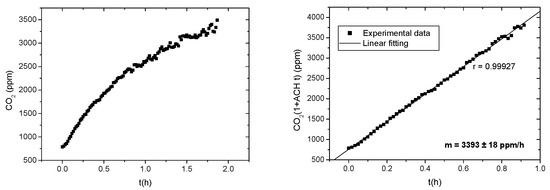
Figure 7.
Temporal variation of CO2 concentrations and this variation corrected the factor (1+ ACH t) for the meeting room (Source: Rodero and Krawczyk [34]).
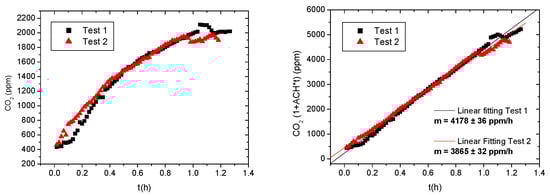
Figure 8.
Temporal variation of CO2 concentrations and this variation corrected by the factor (1+ACHt) for the workshop classroom. Test 1 and 2 represent repetition of measurements to study method reproducibility.
It is apparent that the time variation of CO2 concentration has a linear behaviour in the case of low ventilation, but when ACH is increased this growing behaviour tends to stabilize with the effect of air change. In spite of this, when corrections of ACH are made, the linear behaviour predicted by Equation (3) is fulfilled for all cases. The correlation factor is higher at 0.99 in six measurements. A slope of the linear fitting, m, allows us to obtain the CO2 gains g from Equation (5).
Results for six measurements are shown in Table 5. The slope of linear dependence of the corrected CO2 concentration increases with higher occupant density and ACH, but when CO2 gains are calculated from this slope similar values are obtained in all cases from 0.0043 to 0.0048 L/s, and agree with the theoretical value of Table 1 for young university students (18–25 year old) with sedentary activity (M = 1.3 MET) with similar male and female contribution.
Table 5.
Results of CO2 gains from a person (g) calculations.
The study of the method reproducibility in the workshop classroom, shows a high discrepancy between the results of both measurements (0.044 vs. 0.048 L/s). The cause of this discrepancy could be the different activity of room occupants before beginning of measurements. According to Batterman et al., [24], type of previous activity can have a significant effect on cumulative methods as s prior activity has a high effect in accumulative methods, as the purpose of this paper. Both repeated measurements were not made at the same instant. They were performed during two consecutive one hour classes with a break between them. A comparison of the measured data of Figure 8 shows that it is at the beginning where both curves have different behaviors.
A way to solve this problem is to consider only the times after the first 15 min, where the situation has stabilized. Results of the repetition of the method with this modification are shown in Table 6.
Table 6.
Results of CO2 gains from a person (g) calculations considering times above 15 min.
In this case, the discrepancy in the results is reduced drastically, which confirms that prior physical activity could be the main reason for the discrepancy in this method
Representative values of g gains by person in conditions of sedentary activity in an educational building can be obtained from the average value of the values obtained in Table 5. This values is <g> = 0.00447 L/s with standard deviation s = 0.00008 L/s. that agrees with the theoretical value for young students with ages between 18 and 25 year old, with similar male and female contribution. Similar g values were obtained for rooms with young students with ages between 16–25 years and adults between 30–60 years old.
Results of this paper demonstrate that the proposed method is useful to obtain experimental values of CO2 gain from people. Its application to in different conditions and activities could help to obtain realistic values that could be translated into standards of IAQ.
5. Conclusions
In the paper an experimental method to determine CO2 gains from people in buildings based on measurements of the temporal evolution of CO2 concentrations was developed. This method was verified based on data from five classrooms with occupants with low physical activity. Various ACH conditions were selected for this study.
Despite a different temporal evolution under each condition, the results of CO2 gains obtained are similar in all cases. Results of g values agree with the theoretical estimation given in the literature for young students with similar male and female contribution, g = 0.0045 L/s. Results obtained from the method did not demonstrate differences between the g value for young students with ages between 18 and 25 years old (classrooms) and adults between 30–65 years old (meeting room). A study of reproducibility was done. High discrepancy in the results was found, due to the big influence of the prior physical activity before each measurement.
Results of the analysis showed that the developed method can be useful for determination of CO2 gains from people with sedentary activity and low-medium ACH of the rooms. Therefore it can be applied for the analysis of the microclimate in such cases and would be helpful in maintaining optimal conditions for humans. Further research will be focused on the usefulness of this method in the estimations for rooms with other conditions of activity, metabolic rate and ventilation.
Author Contributions
Conceptualization, A.R. and D.A.K.; Methodology and Validation, A.R.; Formal Analysis, A.R. and D.A.K.; Investigation and Data Curation, D.A.K.; Writing—Original Draft Preparation, A.R. and D.A.K.; Visualization, A.R. and D.A.K.
Funding
Research was founded by “BUT InterAcademic Partnerships” (PPI/APM/2018/1/00033/DEC/1) project and WZ/WBiIS/9/2019 scientific grant at Bialystok University of Technology.
Acknowledgments
The study was carried out under the scientific project realized by Bialystok University of Technology and School of Engineering Sciences of Belmez, University of Córdoba “BUT InterAcademic Partnerships (PPI/APM/2018/1/00033/DEC/1) and the project “The possibility of the renewable energy sources usage in the context of improving energy efficiency and air quality in buildings and civil constructions”. It was implemented from the resources of the Ministry of Science and Higher Education of Poland References WZ/WBiIS/9/2019.
Conflicts of Interest
The authors declare no conflict of interest.
References
- Risholt, B.; Time, B.; Hestnes, A.G. Sustainability assessment of nearly zero energy renovation of dwellings based on energy, economy and home quality indicators. Energy Build. 2013, 60, 217–224. [Google Scholar] [CrossRef]
- Jurado, S.R.; Bankoff, A.D.P.; Sanchez, A. Indoor Air Quality in Brazilian Universities. Int. J. Environ. Res. Public Health 2014, 11, 7081–7093. [Google Scholar] [CrossRef] [PubMed]
- Śmiełowska, M.; Marć, M.; Zabiegała, B. Indoor air quality in public utility environments-a review. Environ. Sci. Pollut. Res. Int. 2017, 24, 11166–11176. [Google Scholar] [CrossRef]
- Mainka, A.; Zajusz-Zubek, E. Indoor Air Quality in Urban and Rural Preschools in Upper Silesia, Poland: Particulate Matter and Carbon Dioxide. Int. J. Environ. Res. Public Health 2015, 12, 7697–7711. [Google Scholar] [CrossRef] [PubMed]
- Wong, L.-T.; Mui, K.-W.; Tsang, T.-W. Evaluation of Indoor Air Quality Screening Strategies: A Step-Wise Approach for IAQ Screening. Int. J. Environ. Res. Public Health 2016, 13, 1240. [Google Scholar] [CrossRef]
- Lu, C.-Y.; Lin, J.-M.; Chen, Y.-Y.; Chen, Y.-C. Building-Related Symptoms among Office Employees Associated with Indoor Carbon Dioxide and Total Volatile Organic Compounds. Int. J. Environ. Res. Public Health 2015, 12, 5833–5845. [Google Scholar] [CrossRef]
- Apte, M.G.; Fisk, W.J.; Daisey, J.M. Associations between indoor CO2 concentrations and sick building syndromes in U.S. office buildings: An analysis of the 1994–1996 BASE study data. Indoor Air 2000, 10, 246–257. [Google Scholar] [CrossRef]
- Johnsona, D.L.; Lynch, R.A.; Floyda, E.L.; Wang, J.; Bartels, J.N. Indoor air quality in classrooms: Environmental measures and effective ventilation rate modeling in urban elementary schools. Build. Environ. 2018, 136, 185–197. [Google Scholar] [CrossRef]
- Meciarova, L.; Vilcekova, S.; Burdova, E.K.; Kapalo, P.; Mihalova, N. The real and subjective indoor environmental quality in schools. Int. J. Environ. Res. Public Health 2018, 28, 102–123. [Google Scholar]
- Kapalo, P.; Meciarova, L.; Vilcekova, S.; Kridlova Burdova, E.; Domnita, F.; Bacotiu, C.; Peterfi, K.E. Investigation of CO2 production depending on physical activity of students. Int. J. Environ. Health Res. 2019, 29, 31–44. [Google Scholar] [CrossRef]
- Kapalo, P.; Domnita, F.; Bacotiu, C.; Podolak, M. The influence of occupants’ body mass on carbon dioxide mass flow rate inside a university classroom—case study. Int. J. Environ. Health Res. 2018, 28, 432–447. [Google Scholar] [CrossRef] [PubMed]
- Muscatiello, N.; McCarthy, A.; Kielb, C.; Hsu, W.-H.; Hwang, S.-A.; Lin, S. Classroom conditions and CO2 concentrations and teacher health symptom reporting in 10 New York State Schools. Indoor Air 2014, 25, 157–167. [Google Scholar] [CrossRef] [PubMed]
- Ruggieri, S.; Longo, V.; Perrino, C.; Canepari, S.; Drago, G.; L’Abbate, L.; Balzan, M.; Cuttitta, G.; Scaccianoce, G.; Minardi, R.; et al. Indoor air quality in schools of a highly polluted south Mediterranean area. Indoor Air 2019, 29, 276–290. [Google Scholar] [CrossRef] [PubMed]
- Fisk, W.J. The ventilation problem in schools: Literature review. Indoor Air 2017, 27, 1039–1051. [Google Scholar] [CrossRef] [PubMed]
- Azuma, K.; Kagi, N.; Yanagi, U.; Osawa, H. Effects of low-level inhalation exposure to carbon dioxide in indoor environments: A short review on human health and psychomotor performance. Environ. Int. 2018, 121 Pt 1, 51–56. [Google Scholar] [CrossRef]
- Kapalo, P.; Klymenko, H.; Zhelykh, V.; Adamski, M. Investigation of Indoor Air Quality in the Selected Ukraine Classroom—Case Study. Available online: https://link.springer.com/chapter/10.1007/978-3-030-27011-7_21 (accessed on 17 October 2019).
- Krawczyk, D.; Wądołowska, B. Analysis of indoor air parameters in an education building. Energy Procedia 2018, 147, 96–103. [Google Scholar] [CrossRef]
- Mainka, A.; Zajusz-Zubek, E. Keeping Doors Closed as One Reason for Fatigue in Teenagers—A Case Study. Appl. Sci. 2019, 9, 3533. [Google Scholar] [CrossRef]
- ASHRAE Standard 62-2001 Ventilation for Acceptable Indoor Air Quality. Available online: https://www.ashrae.org/File%20Library/Technical%20Resources/Standards%20and%20Guidelines/Standards%20Addenda/62-2001/62-2001_Addendum-n.pdf (accessed on 10 October 2019).
- Persily, A. Challenges in Developing Ventilation and Indoor Air Quality Standards: The Story of ASHRAE Standard 62. Build. Environ. 2015, 91, 61–69. [Google Scholar] [CrossRef]
- Gougha, H.L.; Luob, Z.; Haliosa, C.H.; Kingc, M.-F.; Noakesc, C.J.; Grimmonda, C.S.B.; Barlowa, J.F.; Hoxeyd, R.; Quinn, A.D. Field measurement of natural ventilation rate in an idealised full-scale building located in a staggered urban array: Comparison between tracer gas and pressure-based methods. Build. Environ. 2018, 137, 246–256. [Google Scholar] [CrossRef]
- Reminon, G.; Moujalled, B.; El Mankibi, M. Review of tracer gas-based methods for the characterization of natural ventilation performance: Comparative analysis of their accuracy. Build. Environ. 2019, 160. [Google Scholar] [CrossRef]
- Duarte, R.; Gomes, M.G.; Rodrigues, A.M. Estimating ventilation rates in a window-aired room using Kalman filtering and considering uncertain measurements of occupancy and CO2 concentration. Build. Environ. 2018, 143, 691–700. [Google Scholar] [CrossRef]
- Batterman, S. Review and Extension of CO2-Based Methods to Determine Ventilation Rates with Application to School Classrooms. Int. J. Environ. Res. Public Health 2017, 14, 145. [Google Scholar] [CrossRef] [PubMed]
- Luo, M.; Zhou, X.; Zhu, Y.; Sundell, J. Revisiting an overlooked parameter in thermal comfort studies, the metabolic rate. Energy Build. 2016, 118, 152–159. [Google Scholar] [CrossRef]
- Orava, J.; Nuutila, P.; Lidell, M.; Oikonen, V.; Noponen, T.; Viljanen, T.; Scheinin, M.; Taittonen, M.; Niemi, T.; Enerbäck, S.; et al. Different Metabolic Responses of Human Brown Adipose Tissue to Activation by Cold and Insulin. Cell Metab. 2011, 14, 272–279. [Google Scholar] [CrossRef] [PubMed]
- Persiliy, A.; de Jonge, L. Carbon dioxide generation rates for building occupants. Indoor Air 2017, 27, 868–879. [Google Scholar] [CrossRef] [PubMed]
- Ainsworth, B.E.; Haskell, W.L.; Whitt, M.C.; Irwin, M.L.; Swartz, A.M.; Strath, S.J.; O’Brien, W.L.; Bassett, D.R., Jr.; Schmitz, K.H.; Emplaincourt, P.O.; et al. The Compendium of Physical Activities Tracking Guide. Available online: https://sites.google.com/site/compendiumofphysicalactivities/ (accessed on 10 September 2019).
- Ainsworth, B.E.; Haskell, W.L.; Herrmann, S.D.; Meckes, N.; Bassett, D.R., Jr.; Tudor-Locke, C.; Greer, J.L.; Vezina, J.; Whitt-Glover, M.C.; Leon, A.S. Compendium of physical activities: A second update of codes and met values. Med. Sci. Sports Exerc. 2011, 43, 1575–1581. [Google Scholar] [CrossRef] [PubMed]
- Kozey, S.; Lyden, K.; Staudenmayer, J.; Freedson, P. Errors in MET estimates of physical activities using 3.5 ml kg−1 min−1 as the baseline oxygen consumption. J. Phys. Act. Health 2010, 7, 508–516. [Google Scholar] [CrossRef]
- Plowman, S.; Smith, D. Exercise Physiology for Health, Fitness, and Performance; Lippincott Williams & Wilkins: Philadelphia, PA, USA, 2014. [Google Scholar]
- Qi, M.W.; Li, X.F.; Weschler, L.B.; Sundell, J. CO2 generation rate in Chinese people. Indoor Air 2014, 24, 559–566. [Google Scholar] [CrossRef]
- Krawczyk, D.A.; Rodero, A.; Gładyszewska-Fiedoruk, K.; Gajewski, A. CO2 concentration in naturally ventilated classrooms located in different climates– measurements and simulations. Energy Build. 2016, 129, 491–498. [Google Scholar] [CrossRef]
- Rodero, A.; Krawczyk, D.A. Method for Estimation of CO2 Gains from Persons in Buildings. Multidiscip. Digit. Publ. Inst. Proc. 2018, 2, 1309. [Google Scholar] [CrossRef]
- VIPSKILLS project (Virtual and Intensive Course Developing Practical Skills of Future Engineers. Strategic Partnerships Erasmus +)—e-Laboratories. Available online: http://vipskills.pb.edu.pl/e-labs (accessed on 5 August 2019).
- Brulinska, A.; Popiolek, Z.; Brulinski, Z. Experimentally validated CFD analysis on sampling region determination of average indoor carbon dioxide concentration in occupied space. Build. Environ. 2014, 72, 319–331. [Google Scholar] [CrossRef]
- Oliveira, R.; Kämpf, J.; Vicente, R.; Almeida, R.; Figueiredo, A. CO2 experimental measurements towards the development of a predictive framework using user actions in smart buildings. J. Phys. Conf. Ser. 2019, 1343, 012061. [Google Scholar] [CrossRef]


© 2019 by the authors. Licensee MDPI, Basel, Switzerland. This article is an open access article distributed under the terms and conditions of the Creative Commons Attribution (CC BY) license (http://creativecommons.org/licenses/by/4.0/).