Article

Vertical Distribution of Particulates within the Near-Surface Layer of Dry Bulk Port and Influence Mechanism: A Case Study in China

1
College of Civil and Transportation Engineering, Hohai University, No.1 Xikang Road, Nanjing 210098, China
2
Key Laboratory of Integrated Regulation and Resource Development on Shallow Lakes, Ministry of Education, College of Environment, Hohai University, No.1 Xikang Road, Nanjing 210098, China
3
College of Habour, Coastal and Offshore Engineering, Hohai University, No.1 Xikang Road, Nanjing 210098, China
*
Author to whom correspondence should be addressed.
Sustainability 2019, 11(24), 7135; https://doi.org/10.3390/su11247135
Submission received: 8 November 2019 / Revised: 4 December 2019 / Accepted: 10 December 2019 / Published: 12 December 2019

Abstract

:
Knowing the vertical distribution of ambient particulate matter (PM) will help port authorities choose the optimal dust-suppression measures to reduce PM concentrations. In this study, we used an unmanned aerial vehicle (UAV) to assess the vertical distribution (0–120 m altitude) of PM in a dry bulk port along the Yangtze River, China. Total suspended particulates (TSP), PM10, and PM2.5 concentrations at different altitudes were measured at seven sites representing different cargo-handling sites and a background site. Variations in results across sites make it not suitable to characterize the vertical distribution of PM concentration at this port using simple representative distributions. Bulk cargo particle size, fog cannon use, and porous fence all affected the vertical distribution of TSP concentrations but had only minor impacts on PM10 and PM2.5 concentrations. Optimizing porous fence layout according to weather conditions and cargo demand at port have the most potential for mitigating PM pollution related to port operation. As ground-based stations cannot fully measure vertical PM distributions, our methods and results represent an advance in assessing the impact of port activities on air quality and can be used to determine optimal dust-suppression measures for dry bulk ports.

1. Introduction

Ports are a critical node in the global logistics supply chain, playing an increasingly important role in economic integration and handling more than 80% of global commodity trading [1,2]. The strong demand for bulk commodities such as iron ore, grain, and coal has become the primary driver of global trade and demand for port services [3]; 53.3% of the 10.7 billion t of seaborne cargo handled by global ports in 2018 was dry bulk [4]. However, dust and smoke emissions during loading, storage, and transportation of bulk materials can increase the atmospheric particulate matter (PM) concentration in ports and surrounding population areas [5,6,7]. The PM in the atmosphere is a complex mixture of organic and inorganic substances and was one of six principal air pollutants identified by the U.S. environmental protection agency (EPA) [8]. According to China’s ambient air quality standard (CAAQS), PM can be categorized to the main fractions such as total suspended particulates (TSP, particles with aerodynamic diameters smaller than 100 μm), PM10 (particles with aerodynamic diameters smaller than 10 μm), and PM2.5 (particles with aerodynamic diameters smaller than 2.5 μm) [9]. Depending on the physical and chemical composition of particles, PM can reduce visibility, contribute to acid rain, and affect the diversity of ecosystems [10]. Besides, PM pollution exposure can directly cause a variety of health problems. Fine particles, with an aerodynamic diameter less than 10 microns, can get deep into the lungs, even get into the bloodstream, and cause severe acute or chronic disease [11]. Considering the potential effects on the health of nearby residents [12,13,14,15], the environmental impact of port activities has become one of the main challenges of port development [16]. This fact has compelled the need to monitor PM concentrations in and near dry bulk ports, to design mitigation measures aimed at the green and sustainable development of the port [17,18,19].
Traditionally, quantifying PM concentrations and estimating impacts on ambient air has relied on data from ground-based measurement stations. For example, Perez et al. [20] used such data from Barcelona, Spain to determine that port activities contributed ~50%–55% of local PM10 and PM2.5 levels. Jeong et al. [21] analyzed PM2.5 samples from a measurement station ~12 m above the ground, showing that port activity was the dominant contributor to PM2.5 levels in Busan, South Korea. Mousavi et al. [22] analyzed samples collected by three stationary measurement stations to show that emissions from ship, locomotive, and heavy-duty vehicle operation accounted for 16% ± 3% of the overall ambient PM0.25 levels in the ports of Los Angeles and Long Beach, California. Previous studies showed that, to a certain extent, ground-based measurement stations could reveal the contributions of port activities to ambient PM levels. However, they cannot fully characterize the vertical change of this effect. Actually, the PM concentrations have proven to vary greatly with altitude [23]. Thence, it is more valuable to monitor PM concentrations at different altitudes than ground-based measurement stations when studying the generation, transport, accumulation, and diffusion of PM throughout the atmospheric column [24,25].
The ongoing development of unmanned aerial vehicles (UAVs) provides a new mobile sensor platform capable of studying the vertical distribution characteristics of atmospheric pollutants; the application of UAVs to environmental data collection has grown exponentially in the past few years [26]. UAVs are a class of aircraft that can fly without human pilots on board, and there are different classifications for the UAVs based on different parameters and no one uniform standard to classify them [27]. Compared to ground-based approaches or other aerial methods, UAVs are safer, cheaper, and more convenient to obtain accurate information on pollution distribution throughout the atmospheric column and easier to understand air quality in specific atmospheric layers [28]. Typically, in the context of air quality monitoring, fixed-wing and rotary UAVs are always selected, while Villa et al. [29] showed that rotary UAVs could more easily obtain ambient air quality data near pollution sources through their hovering ability. Besides, Villa et al. [30] showed that hexacopter UAVs provided a larger payload capacity and more flight stability than quadrotor UAVs, making them more suitable for air quality studies over complex terrains. Recently, rotary UAVs have been used to analyze the vertical distribution of PM concentrations in urban street canyons [31], to collect high-spatial-resolution images above roads [32], and to analyze gas and particle samples above a military ordnance open-burning area [33]. However, to the best of our knowledge, few research efforts have focused on the use of UAVs to measure PM concentrations and vertical distribution characteristics within the near-surface layer of ports, particularly in dry bulk ports.
One objective of this study is to measure the vertical PM concentration profiles using a sensor-equipped hexacopter UAV over a dry bulk port in the city of Zhenjiang, China. The other objective is to characterize dispersion and variation patterns within the near-surface layer and analyze factors affecting vertical fluctuations in PM concentration. The rest of the paper is structured as follows. Section 2 describes the measurement sites and methods, Section 3 analyzes the vertical distribution characteristics and relevant influencing factors of PM level within the near-surface layer, and Section 4 presents the main conclusions.

2. Materials and Methods

2.1. Measurement Sites

Zhenjiang is located in southern Jiangsu Province, China, on the south bank of the Yangtze River (Figure 1a). The Port of Zhenjiang (ZJP) is one of 43 main hub ports in China and is a valuable trading location along the lower Yangtze River Delta, extends over 33.8 km of shoreline with seven main areas. Of these, Dagang port area (DGP, Figure 1b) mainly undertakes service functions including the loading, trading, and warehousing of cargos including coal, minerals, building materials, and timber using two berths of 70,000 t and three berths of 50,000 t. The DGP’s main trading partners include more than 280 ports in more than 70 countries and regions including the United States, Japan, South Korea, and Brazil.
In Figure 1c, the DGP can be divided into four zones handling mainly (1) containers (Z1), (2) chrome and iron ore (Z2), (3) a ferry-place (Z3), and (4) coal (Z4). Based on cargo type and different dust suppression measures, we selected two sites in Z2 (Figure 1d) and five sites in Z4 (Figure 1e) to measure PM concentrations.
In Z2, Site 1 stored chrome ore (shipped from South Africa) generally with a particle size <1 mm (Figure 2a), while Site 2 stored iron ore (shipped from Australia) generally with a particle size of 6–40 mm (Figure 2b). In Z4, PM emissions from coal piles were managed using continuously spraying fog cannons (Figure 2c) and porous fence ~16 m tall around the yard (Figure 2d). If it can be proved that those measures can well suppress the dust emissions, the port authorities will extend these dust suppression measures to other port areas.
We measured PM concentrations on January 22, 2019, a sunny day with ground temperatures of 6–9 °C and a northwest wind averaging 3 m/s. The measurement sites in Z4 were arranged from northwest to southeast in consideration of the wind (Figure 1e). Site 3 was located closest to the Yangtze River, outside the porous fence. Site 4 was located inside the porous fence at the northernmost end of the yard, with Sites 5 and 6 progressively further south. Site 7 was still located inside the porous fence but offset to the south from the other sites. In addition, we used Yinshan Park (~3 km from Z4) as a background site (Figure 1f) for simultaneous PM measurements.

2.2. Ambient Particulate Matter (PM) Standards

Rapid industrialization and associated environmental problems in China have led to various severe respiratory and pulmonary diseases caused by PM10 and PM2.5 as well as severe haze caused by TSP [34]. Such issues led China to formulate its first Ambient Air Quality Standards (CAAQS) in 1982, later revised in 1996, 2000, and 2012; these standards use TSP, PM10, and PM2.5 as indicators for PM pollution (Table 1) and thus these were adopted in this study.
To reduce air pollution caused by the fast urbanization and industrialization processes, the Ministry of Ecology and Environment of China has continuously amended the ambient air quality standards over the past three decades to tighten the concentration thresholds of PM. In Table 1, it can intuitively perceive that PM standards of WHO are stricter than other countries’ to protect health. As shown in Table 1, it can clearly unearth that there are some significant differences in PM standards among China and other developed countries or regions. Above all, as some proportion of TSP consists of particles too large to directly affect human health, TSP is not a good indicator of health-related exposure, and TSP was not used in the PM standards in the US and EU. However, in China’s latest PM standards, the TSP is still an essential indicator for evaluating air quality. Moreover, the PM10 standard (24-hr) of the EU, WHO, and California are the same as China’s Grade-1, but they are more severe than those of China’s Grade-2. Interestingly, the PM10 standard (annual) of California, WHO, EU, and China are all stricter than those in the US. Besides, the PM2.5 standards of China’s Grade-1 are almost the same with the US’s and more severe than that in the EU, while those of China’s Grade-2 are relatively loose compared to the US, California, and WHO. In general, compared with developed countries, China has implemented almost the same PM standards for residential areas (Grade-1) and relatively loose PM standards for commercial and industrial areas (Grade-2). So, it is required for the government of China to strengthen efforts and implement stricter PM standards to improve environmental quality and reduce the morbidity of workers exposed to high concentrations of PM in commercial and industrial areas [9].

2.3. Unmanned Aerial Vehicle (UAV) Based Measurement Platform

Recently, rotary UAVs equipped with different sensors have been widely used to quickly and comprehensively collect air quality data near pollution sources. Although the UAV propellers can cause a dispersion effect on the pollutant concentration, Alvarado [26] and Villa [30] have proven that adequately setting the mounting position of the sensors and the hovering times of the UAVs can reduce the error between the measured and the real-world data. Thus, it is feasible to measure PM concentrations by the UAV-based measurement platform in time and space.
In this study, based on previous research, we used a DJI M600 Pro hexacopter UAV measuring 727 mm in height (including the undercarriage), 1518 mm in width, with a total span of 1668 mm and total weight of 10 kg (Figure 3a). Six lithium-polymer batteries with a capacity of 5700 mAh provided a flight time of about 30 min. The UAV’s flight was controlled manually using a radio transmitter with an approximate velocity of 0.5 m/s at an altitude range of 0–120 m (flight height was subject to Chinese aviation regulations). We conducted vertical transects at each measurement site, with a hover time of ~3 s at each measurement point and a vertical interval between adjacent measurement points of ~5 m. Altogether, we conducted three up-and-down flights at each measurement site and a total of 24 flights.
The integrated measurement components weighed about 700 g (Figure 3b) and were powered by the UAV battery. These comprised a GPS antenna (NEO-M8N GPS Module, ISO/TS 16949 certified, U-Blox AG), a wireless network modem with a data transmission antenna (Digi XBee-PRO 900HP, FCC certification, Digi International Inc.), and sensors for TSP, PM10, PM2.5, humidity, and temperature (Figure 3c). All data were paired with time and location from the GPS and sent to a ground-based data receiver through the wireless transmission module in real-time. The PM sensors using the principle of laser scattering were able to measure TSP, PM10, and PM2.5. Particularly, the sensor for TSP (Nova SDS198, FCC certification, Nova Fitness Co., Ltd.) can measure TSP concentrations between 0–20 mg/m3 with an accuracy of ±15%. The sensor for PM10 and PM2.5 (Nova SDS011, FCC certification, Nova Fitness Co., Ltd.) can measure PM10 and PM2.5 concentrations between 0–999.9 μg/m3 with an accuracy of ±10%, and the sensor for humidity and temperature (Digital Humidity Sensor SHT85, CE certification, Sensirion AG) can measure relative humidity between 0%–100% with an accuracy of ±1.5%, and measure temperature between −40–105 °C with an accuracy of ±0.1 °C. Note that the sensors for TSP, PM10, PM2.5, humidity, and temperature were calibrated before leaving the factory. Additionally, the UAV-based measurement platform was calibrated via the data using the ground-based measurement at the environmental monitoring station of the ZJP before this study.

3. Results and Discussion

3.1. Distribution of PM Concentrations

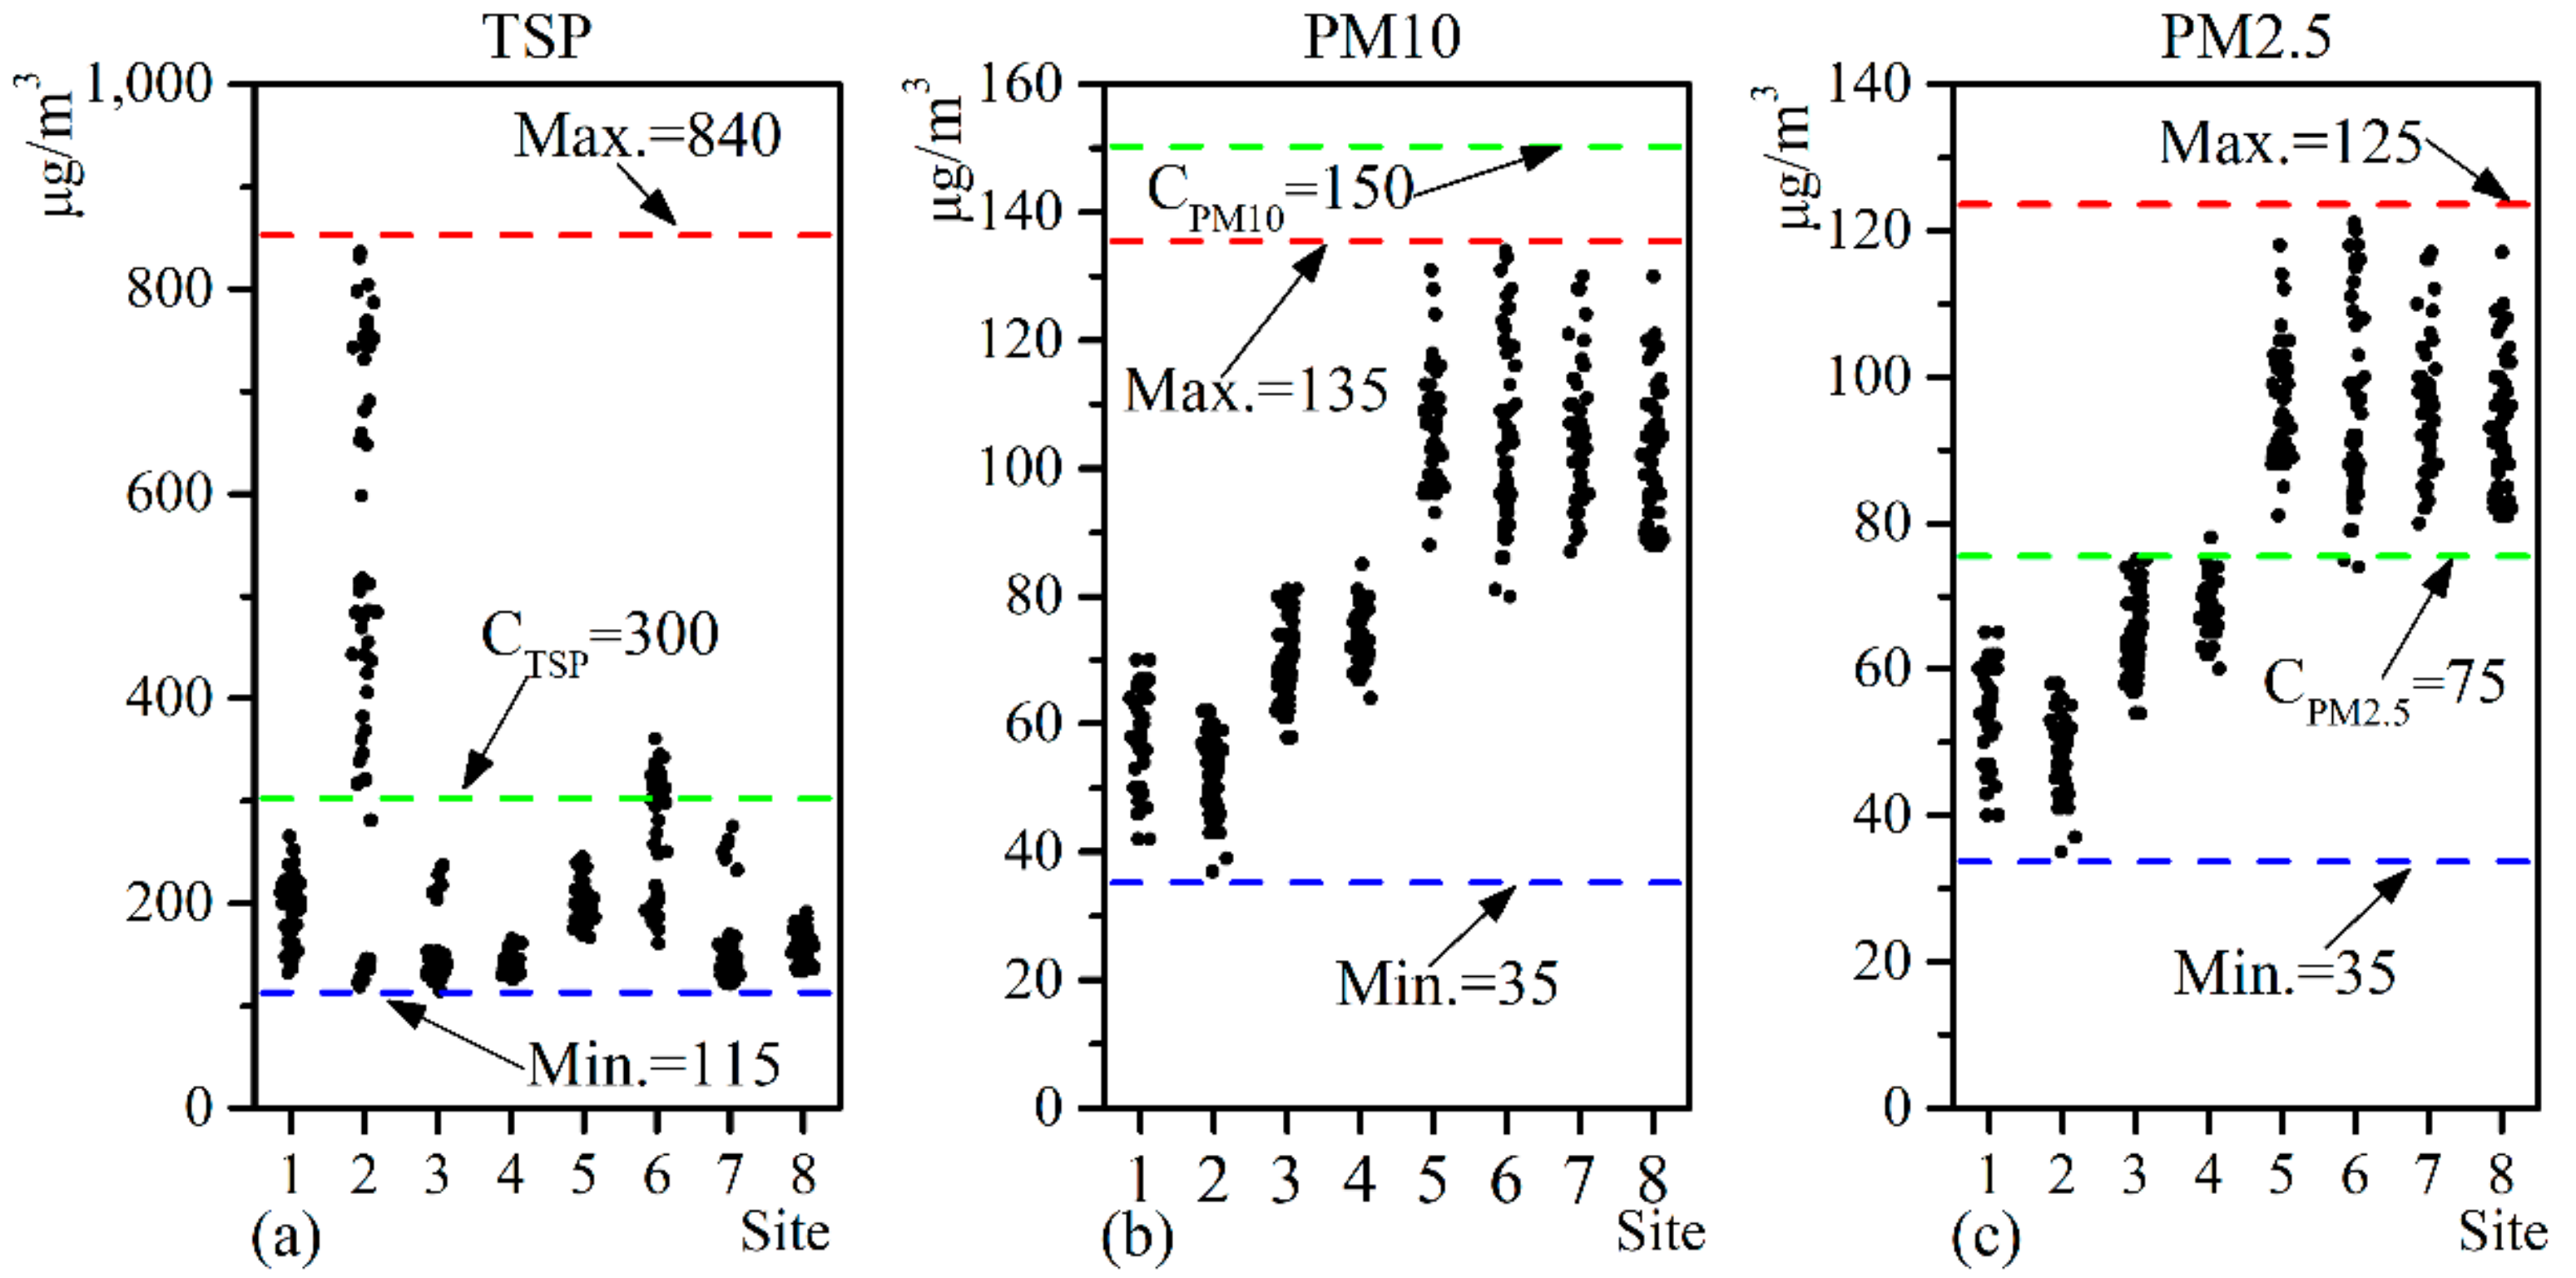
For all eight sites, TSP concentrations ranged from 115–840 μg/m3, PM10 concentrations ranged from 35–135 μg/m3, and PM2.5 concentrations ranged from 35–125 μg/m3 (Figure 4). TSP concentrations measured at Sites 2 and 6 (Figure 4a) and PM2.5 concentrations measured at Sites 5, 6, 7, and 8 (Figure 4c) all exceeded the average values specified in PM concentration standards (Table 1), but PM10 levels were all below these standards.
There were significant differences between the distributions of PM concentration measured at different sites. For example, the maximum TSP concentration measured at Site 2 was more than twice that measured elsewhere, while the maximum PM10 and PM2.5 levels measured at Sites 1–4 were essentially equivalent to the minimums at Sites 5–8. We used the coefficient of variation (CV) to further quantify the distribution of PM concentrations at different sites [35]:
V ( X i ) = σ ( X i ) X ¯ i
where V ( X i ) is the CV of PM concentration data measured at site X , i represents the type of PM (TSP, PM10, or PM2.5), σ ( X i ) is the standard deviation of PM concentration data measured at site X , and X ¯ i is the average value of PM concentration data measured at site X .
The maximum CV for TSP (0.49 at Site 2) was the highest value for any of the three PM types at any measurement site, while the minimum CV for TSP (0.07, Site 2) was only 14.3% as large (Table 2). The maximum CV for both PM10 and PM2.5 was measured at Site 6 (0.14 and 0.13, respectively), while the minimum CV for both (0.05, Site 4) was just 36% and 38%, respectively, of the maximum at Site 6. The CVs of PM10 and PM2.5 were consistently similar for each site but lower than for TSP. For example, at Site 2, the CVs of the PM10 and PM2.5 concentrations were only 22.45% of that for TSP.
When assessing the TSP concentrations by altitude with reference to the background site (Site 8), those under 10 m altitude were similar, but above that level concentrations at Sites 1, 2, 5, and 6 all consistently exceeded the background site, with a considerable gap at Site 2 (Figure 5a). This suggests that TSP concentrations above 10 m altitude should be of particular concern. PM10 and PM2.5 concentrations at Sites 1–4 were consistently lower than at the background site (Figs. 5b, 5c). Below 10 m altitude, PM10 and PM2.5 concentrations at Sites 5–7 were similar to the background site. From 10–120 m altitude, Sites 5 and 6 fluctuated above and below the background level while Site 7 remained consistently higher and increased noticeably at high altitude.
It can be obtained that, within the near-surface layer, under the influence of various factors, the dispersion of PM concentrations in dry bulk port has a significant difference. On the contrary, at the background site, the dispersion of the PM concentrations is minor due to fewer interference factors form the outside. Apparently, in Z2, cargo types bring about the difference in PM concentration distribution above Site 1–2. Almeida et al. [36] also suggest that the granular nature of some cargos might affect PM emissions from ports. In Area 4, fog cannons and the installation of porous fence all have a significant influence on the dispersion of PM concentrations. Actually, the use of fog cannons changes the local temperature and humidity, accelerating deposition and inhibiting transport [37], while porous fence reduces local wind velocity and turbulence intensity with similar results [38]. Besides, at the height of fewer than 10 m, there is no significant difference in the PM concentrations at all measurement points. However, at the height of more than 10 m, the PM concentration in the area where the dust suppression measures are taken is lower than that of other locations and even less than the value measured at the background site. Therefore, the UAV measurement can better judge the effect of the dust suppression measures on controlling the dust concentration in the port.

3.2. Vertical Distribution of PM Concentrations

The distribution of TSP concentrations by altitude at different measurement sites followed different patterns (Figure 6). At Sites 1 and 7, TSP followed a unimodal pattern in which the minimum concentrations at ground level (100 ug/m3 and 140 ug/m3, respectively) increased to a single major peak at 40 m and 10 m (620 μg/m3 and 300 μg/m3, respectively), then declined to a new stable level with further altitude.
At Sites 2, 5, and 6, TSP followed a bimodal pattern with two clear maxima. All started with low concentrations at ground level followed by first peaks appeared at 18 m, 25 m, and 32 m (480 μg/m3, 240 μg/m3, and 305 μg/m3, respectively) while the second peaks appeared at 85 m, 91 m, and 95 m (840 μg/m3, 240 μg/m3, and 320 μg/m3, respectively). The minimum concentrations were measured at ground level (100 μg/m3, 180 μg/m3, and 170 μg/m3, respectively). Site 4 also followed a bimodal pattern with peak values at 45 m and 75 m (155 μg/m3 and 145 μg/m3, respectively). However, unlike Sites 2, 5, and 6, here the concentration at ground level started very high (162 μg/m3) and rapidly declined by 10 m, after which the pattern was similar to Sites 5 and 6.
At Site 3, TSP fluctuated regularly within 135 ± 5 μg/m3 with no major maxima or minima. At Site 8, TSP was stable around 160 μg/m3 from 0–30 mm after which it continually fluctuated within an overall declining trend from 30–12 m. Overall, TSP concentrations exceeded the air quality standards (Table 1) above 35 m at Site 1, above 10 m at Site 2, and above 30 m at Site 6.
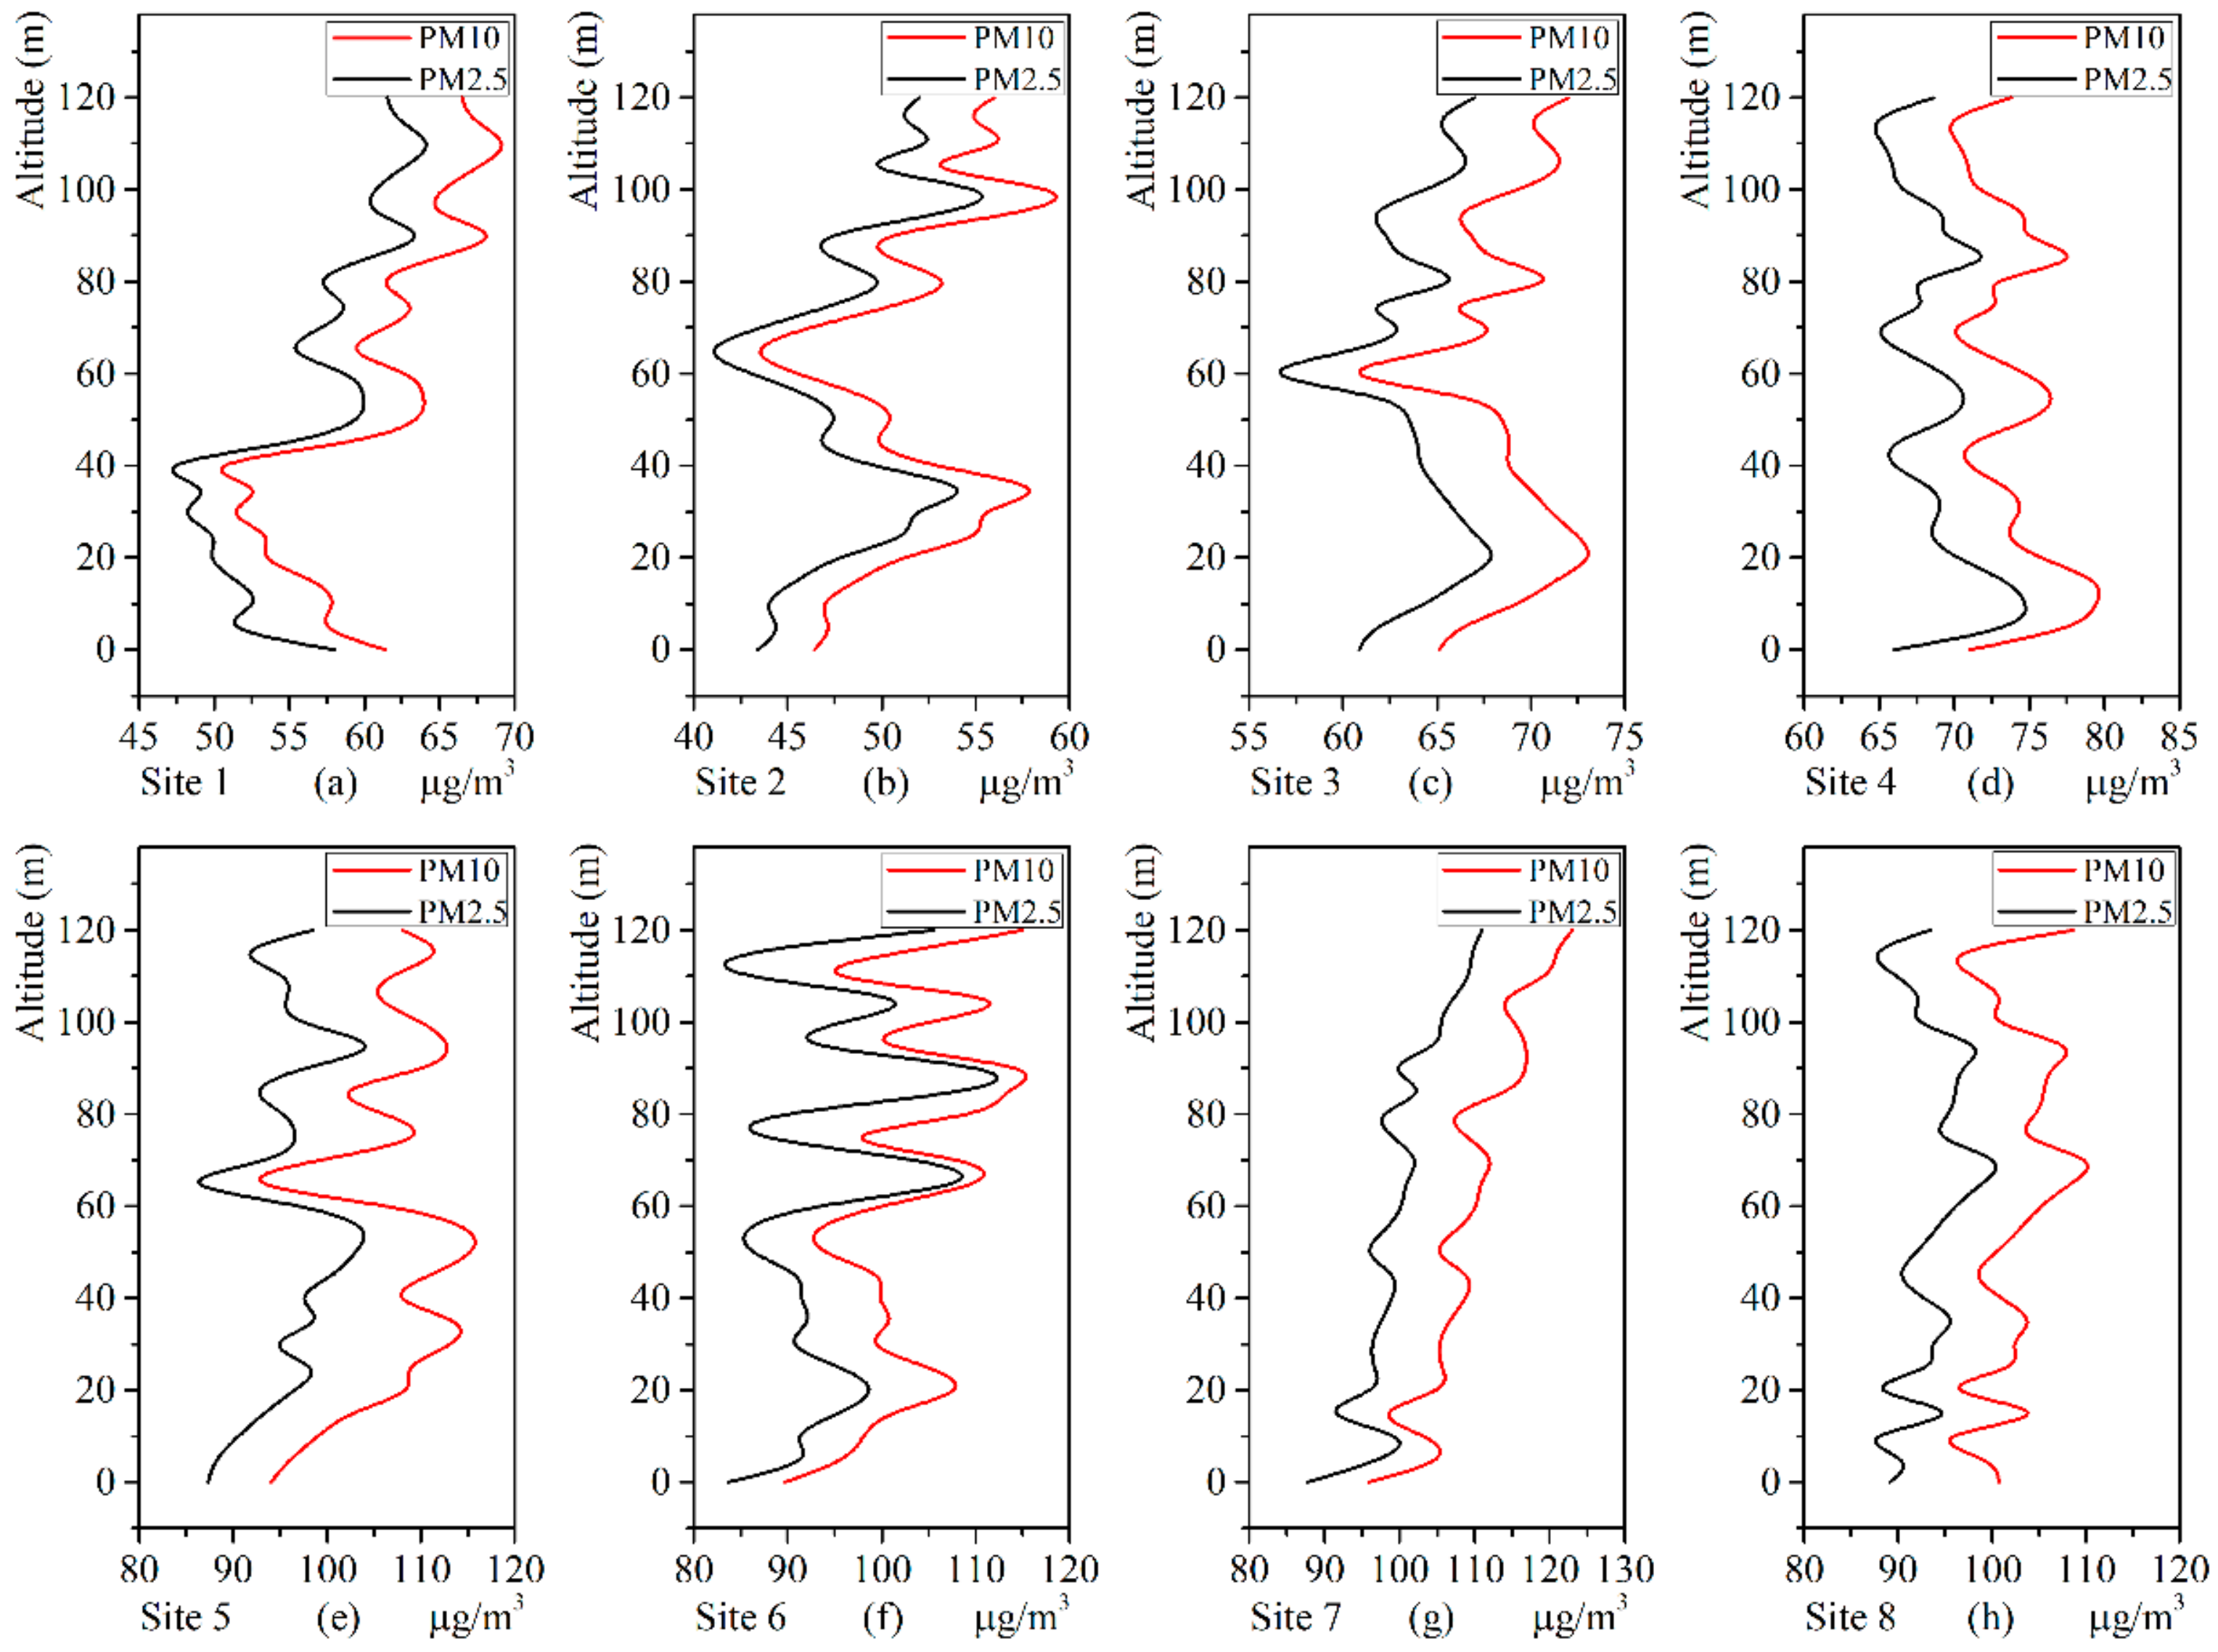
The vertical distributions of PM10 and PM2.5 concentrations were very similar at all sites, with PM2.5 consistently accounting for ~90% of PM10 (Figure 7). However, their patterns were distinctly different from those for TSP. At Site 1, PM10 and PM2.5 initially decreased in a fluctuating pattern from ground level (61 μg/m3 and 58 μg/m3, respectively) to their minimums at 40 m (50 μg/m3 and 47 μg/m3, respectively), followed by a fluctuating increase to 120 m.
Sites 2 and 3 peaked around 35 m and 20 m, respectively, followed by a decline to their minima at 65 m and 60 m, respectively, followed by a subsequent fluctuating increase toward 120 m. Site 5 had a similar peak around 50 m, but its higher-altitude values fluctuated around a steadier value instead of increasing and its minimum occurred at ground level.
PM2.5 and PM10 fluctuated stably with a narrow range at Sites 4 (68 ± 5 μg/m3 and 74 ± 5 μg/m3, respectively) and 8 (94 ± 5 μg/m3 and 103 ± 5 μg/m3, respectively). At Site 6, these fluctuated across a broader range (90–115 μg/m3 and 83–112 μg/m3, respectively) with the fluctuations increasing at higher altitudes. At Site 7, these fluctuated in a steadily increasing pattern within 87–110 μg/m3 and 95–122 μg/m3, respectively.
Previous results for vertical PM2.5 distribution in Hangzhou [24,25] showed that concentrations decreased with altitude. However, in our results only Site 1 showed a decrease in PM2.5 and PM10 from 0–40 m and most vertical distribution patterns showed distinct peaks within a specific range. Due to the unique conditions, the concentrations of PM within the near-surface layer above the dry bulk port areas have unique vertical distribution characteristics. Although past studies have argued that the vertical distribution of PM concentrations can be characterized by an exponential model [31], it would be very challenging to characterize our results within the near-surface layer (~0–120m above the ground level) using a unified mathematical model.
Besides, the analysis results clearly show that using ground-based measurement stations (usually below 10 m altitudes) is insufficient to adequately determine ambient PM distributions at higher elevations, as near-ground results could produce unrepresentative high or low levels. Previous research has shown that high cost limits the number of continuous measurement instruments, which makes it impossible to fully reveal the spatial inhomogeneity of PM concentrations [39]. The CAAQS uses 24 hr and annual average values of PM concentration as evaluation standards. So, the results obtained by UAV measurements were not sufficient for air quality assessment. However, the uses of UAV measurement can fully evaluate the spatial variation characteristics of PM concentration. And through data measured by UAV, we could analyze the vertical distribution characteristics of the PM concentration in the dry bulk port and locate continuous measurement instruments at the inflection point of the distribution. On this basis, combined with spatial analysis and regression techniques [40], we can adequately and reliably evaluate the environmental quality of the port.
Moreover, previous studies [15,20,24,25,37] have shown that the PM concentrations can be influenced by factors including air temperature, relative humidity, air pressure, height, wind, and harbor activities. It should be pointed out that this study cannot prove whether the vertical distribution of PM concentrations has the same pattern in different seasons and meteorological parameters. We will analyze it in the future to bridge the gaps based on the data from the UAV-based measurement platform and ground-based measurement stations.

3.3. Effect of Cargo Type on PM Concentrations

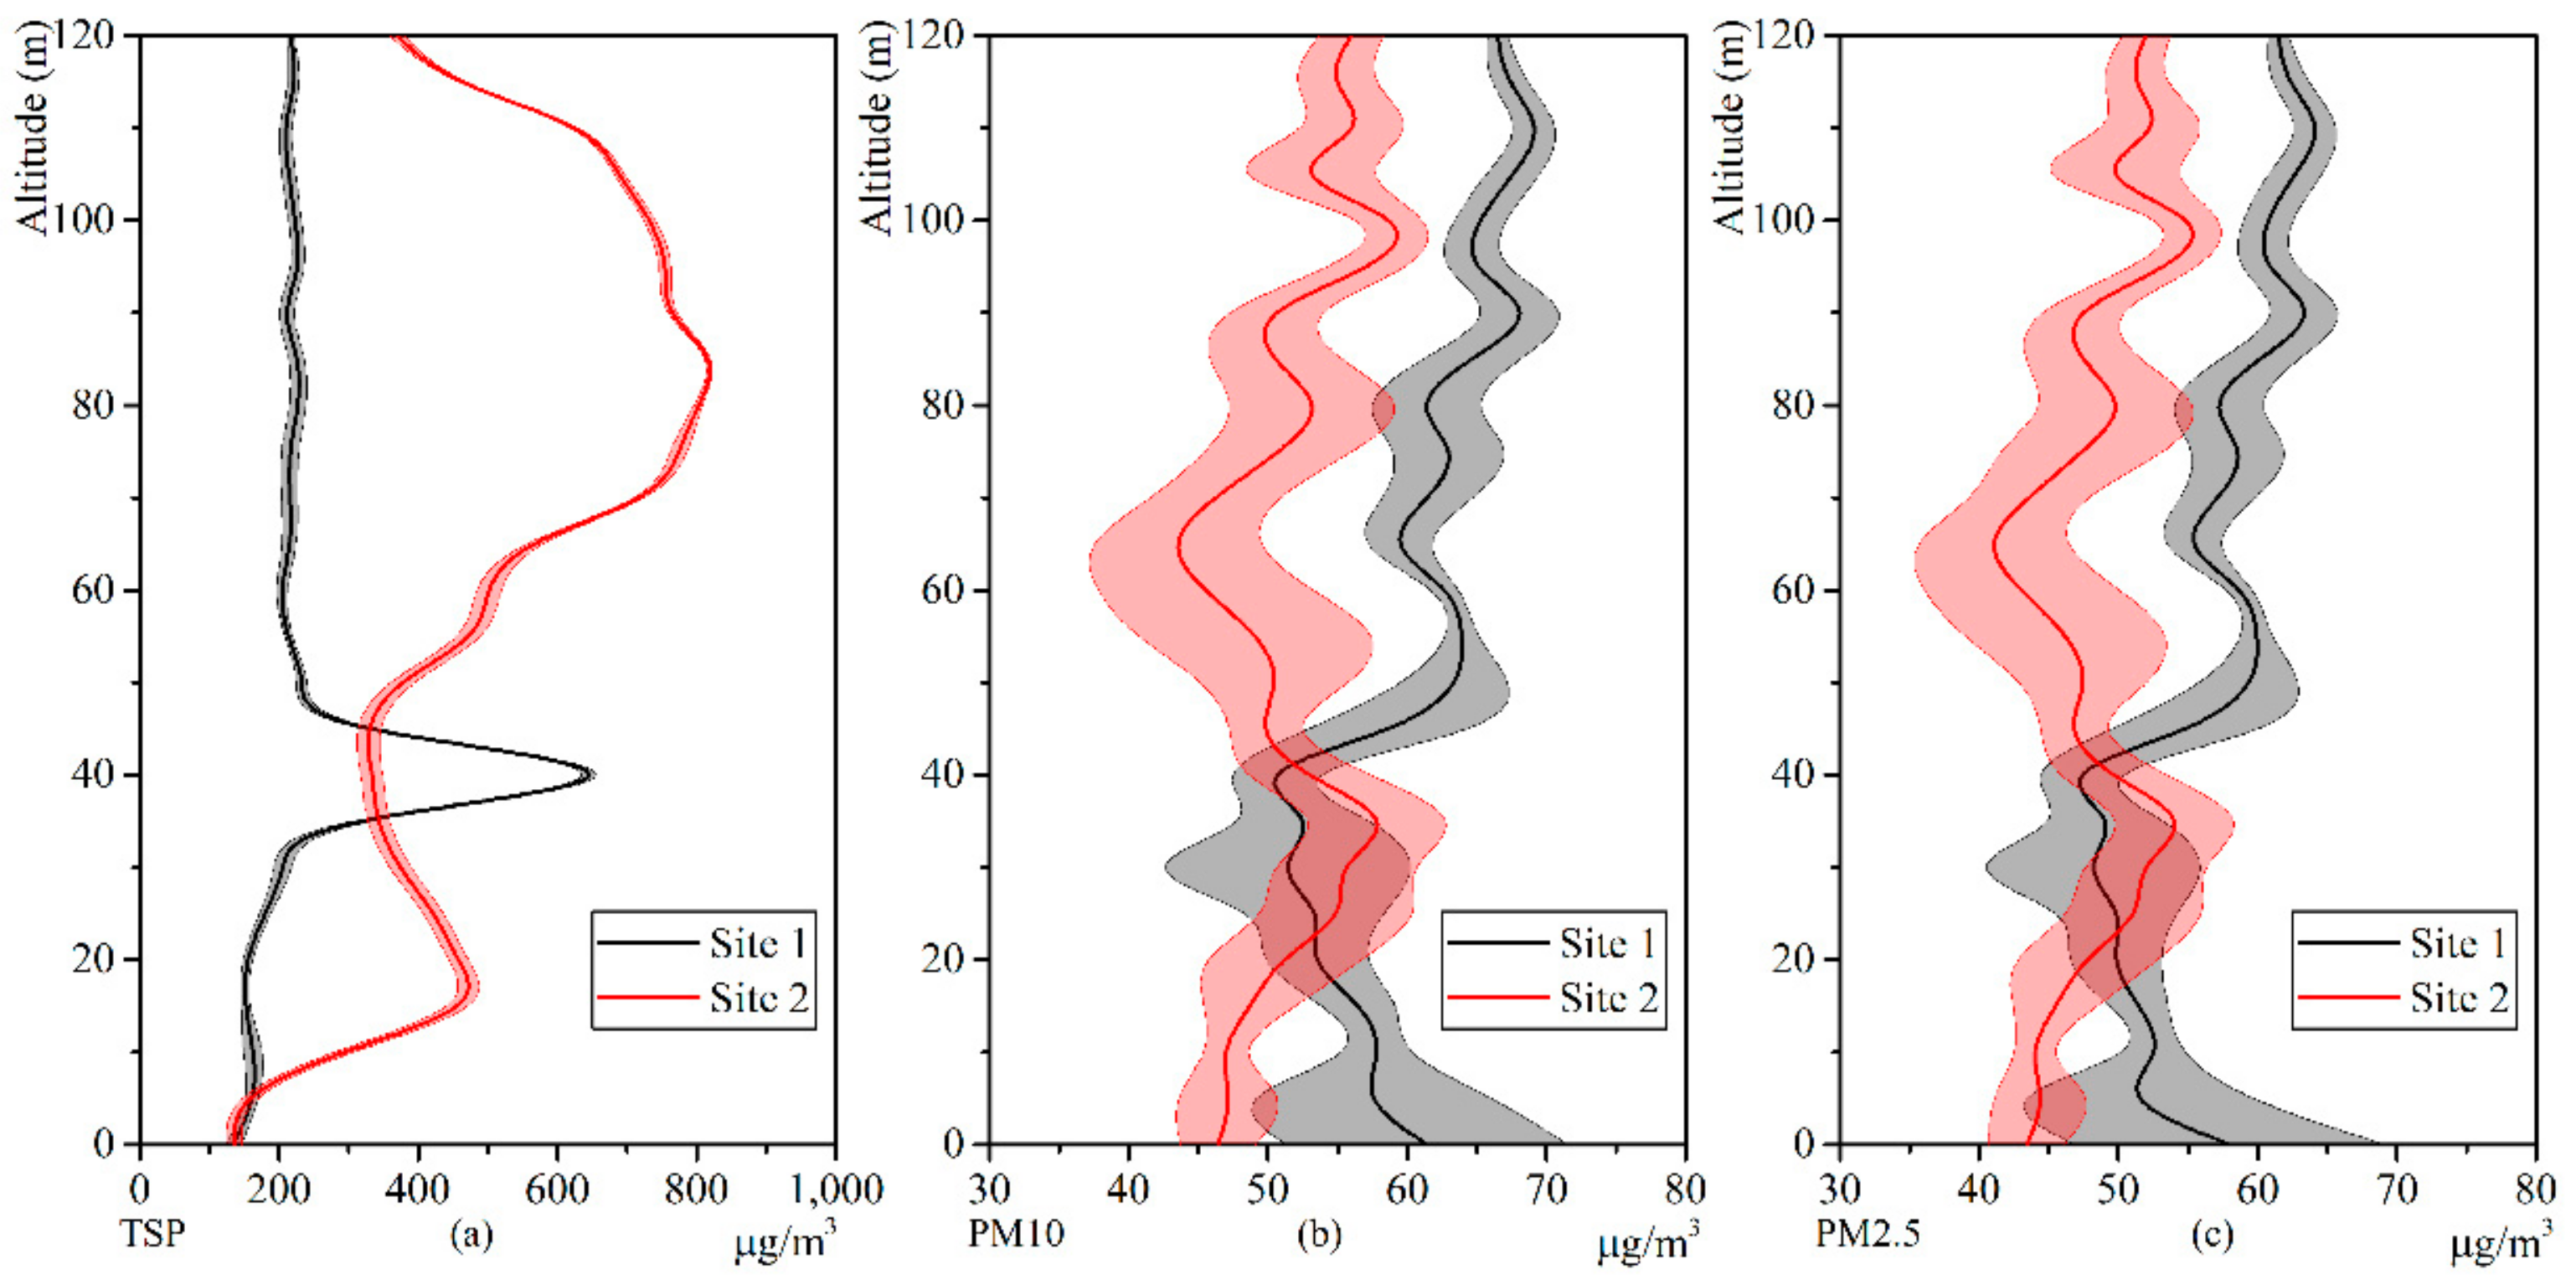
The cargo types at Site 1 (fine chrome ore, 0–1 mm) and Site 2 (coarse iron ore, 6–40 mm) had a clear effect on PM distribution (Figure 8). The vertical distribution of TSP was unimodal at Site 1 and bimodal mode at Site 2, with peaks at very different altitudes. At Site 1, PM10 and PM2.5 decreased from 0–22 m, whereas at Site 2 these started lower and increased. From 22–40 m, PM10 and PM2.5 were higher at Site 2 than Site 1, but from 40–120 m, PM10 and PM2.5 were again higher for Site 1 than Site 2 with PM2.5 accounting for ~80% of PM10. It seems clear that different cargo types have a noticeable effect on the vertical distribution of TSP, and have a minor impact on the vertical distribution of PM10 and PM2.5.
In Figure 7, the distribution of particulate concentrations for PM10 and PM2.5 showed clear similar patterns. We used the Pearson correlation coefficient (PCC) to quantitatively analyze the correlations between PM distributions at different measurement sites and determine the strength of the relationship between different variables [35]:
ρ ( X i , X j ) = C o v ( X i , X j ) σ ( X i ) σ ( X j )
where ρ ( X i , X j ) is the PCC of the concentrations of different PM types (TSP, PM10, or PM2.5) measured at site X , i and j represent the two selected types, C o v ( X i , X j ) is the covariance of the two types measured at site X , and σ ( X i ) is the standard deviation the two types measured at site X . The PCC has a value between 0 and 1, where 1 indicates a positive linear correlation between two different PM concentration distributions and 0 indicates no direct relationship.
In Table 3, the PM10 and PM2.5 concentration data showed a strong linear correlation with PCC values close to 1. However, the relationship between TSP and either PM10 or PM2.5 was very weak, with a maximum PCC of 0.44 at Site 6, ~14 times the minimum measured at Site 7.
Direct comparisons between our results and other research are impossible as the vertical distributions of PM concentrations within the near-surface layer at dry bulk ports have not been previously reported. Besides, since the real-time analysis of the PM chemical components is challenging [41], we cannot analyze the composition and the source of the PM at different sites by UAV-based measurement. However, previous research has shown that PM10 levels in ports mainly relates to traffic [42], with land-based emissions contributing ~80% of surface PM10 concentrations in these settings [43]. Table 3 shows PM10 and PM2.5 concentration data have a strong linear correlation, and Figure 7 shows PM2.5 accounted for ~80%–90% of PM10 throughout the dry bulk port area of ZJP. It could conclude that PM10 in dry bulk ports is mainly composed of PM2.5 and the primary emission source is the docked ships, loading and unloading machinery and transport vehicles. Also, due to the different effects of cargo types on PM concentrations, port authorities should adopt specific measures to control the PM levels in the port effectively.

3.4. Effect of Fog Cannons on PM Concentrations

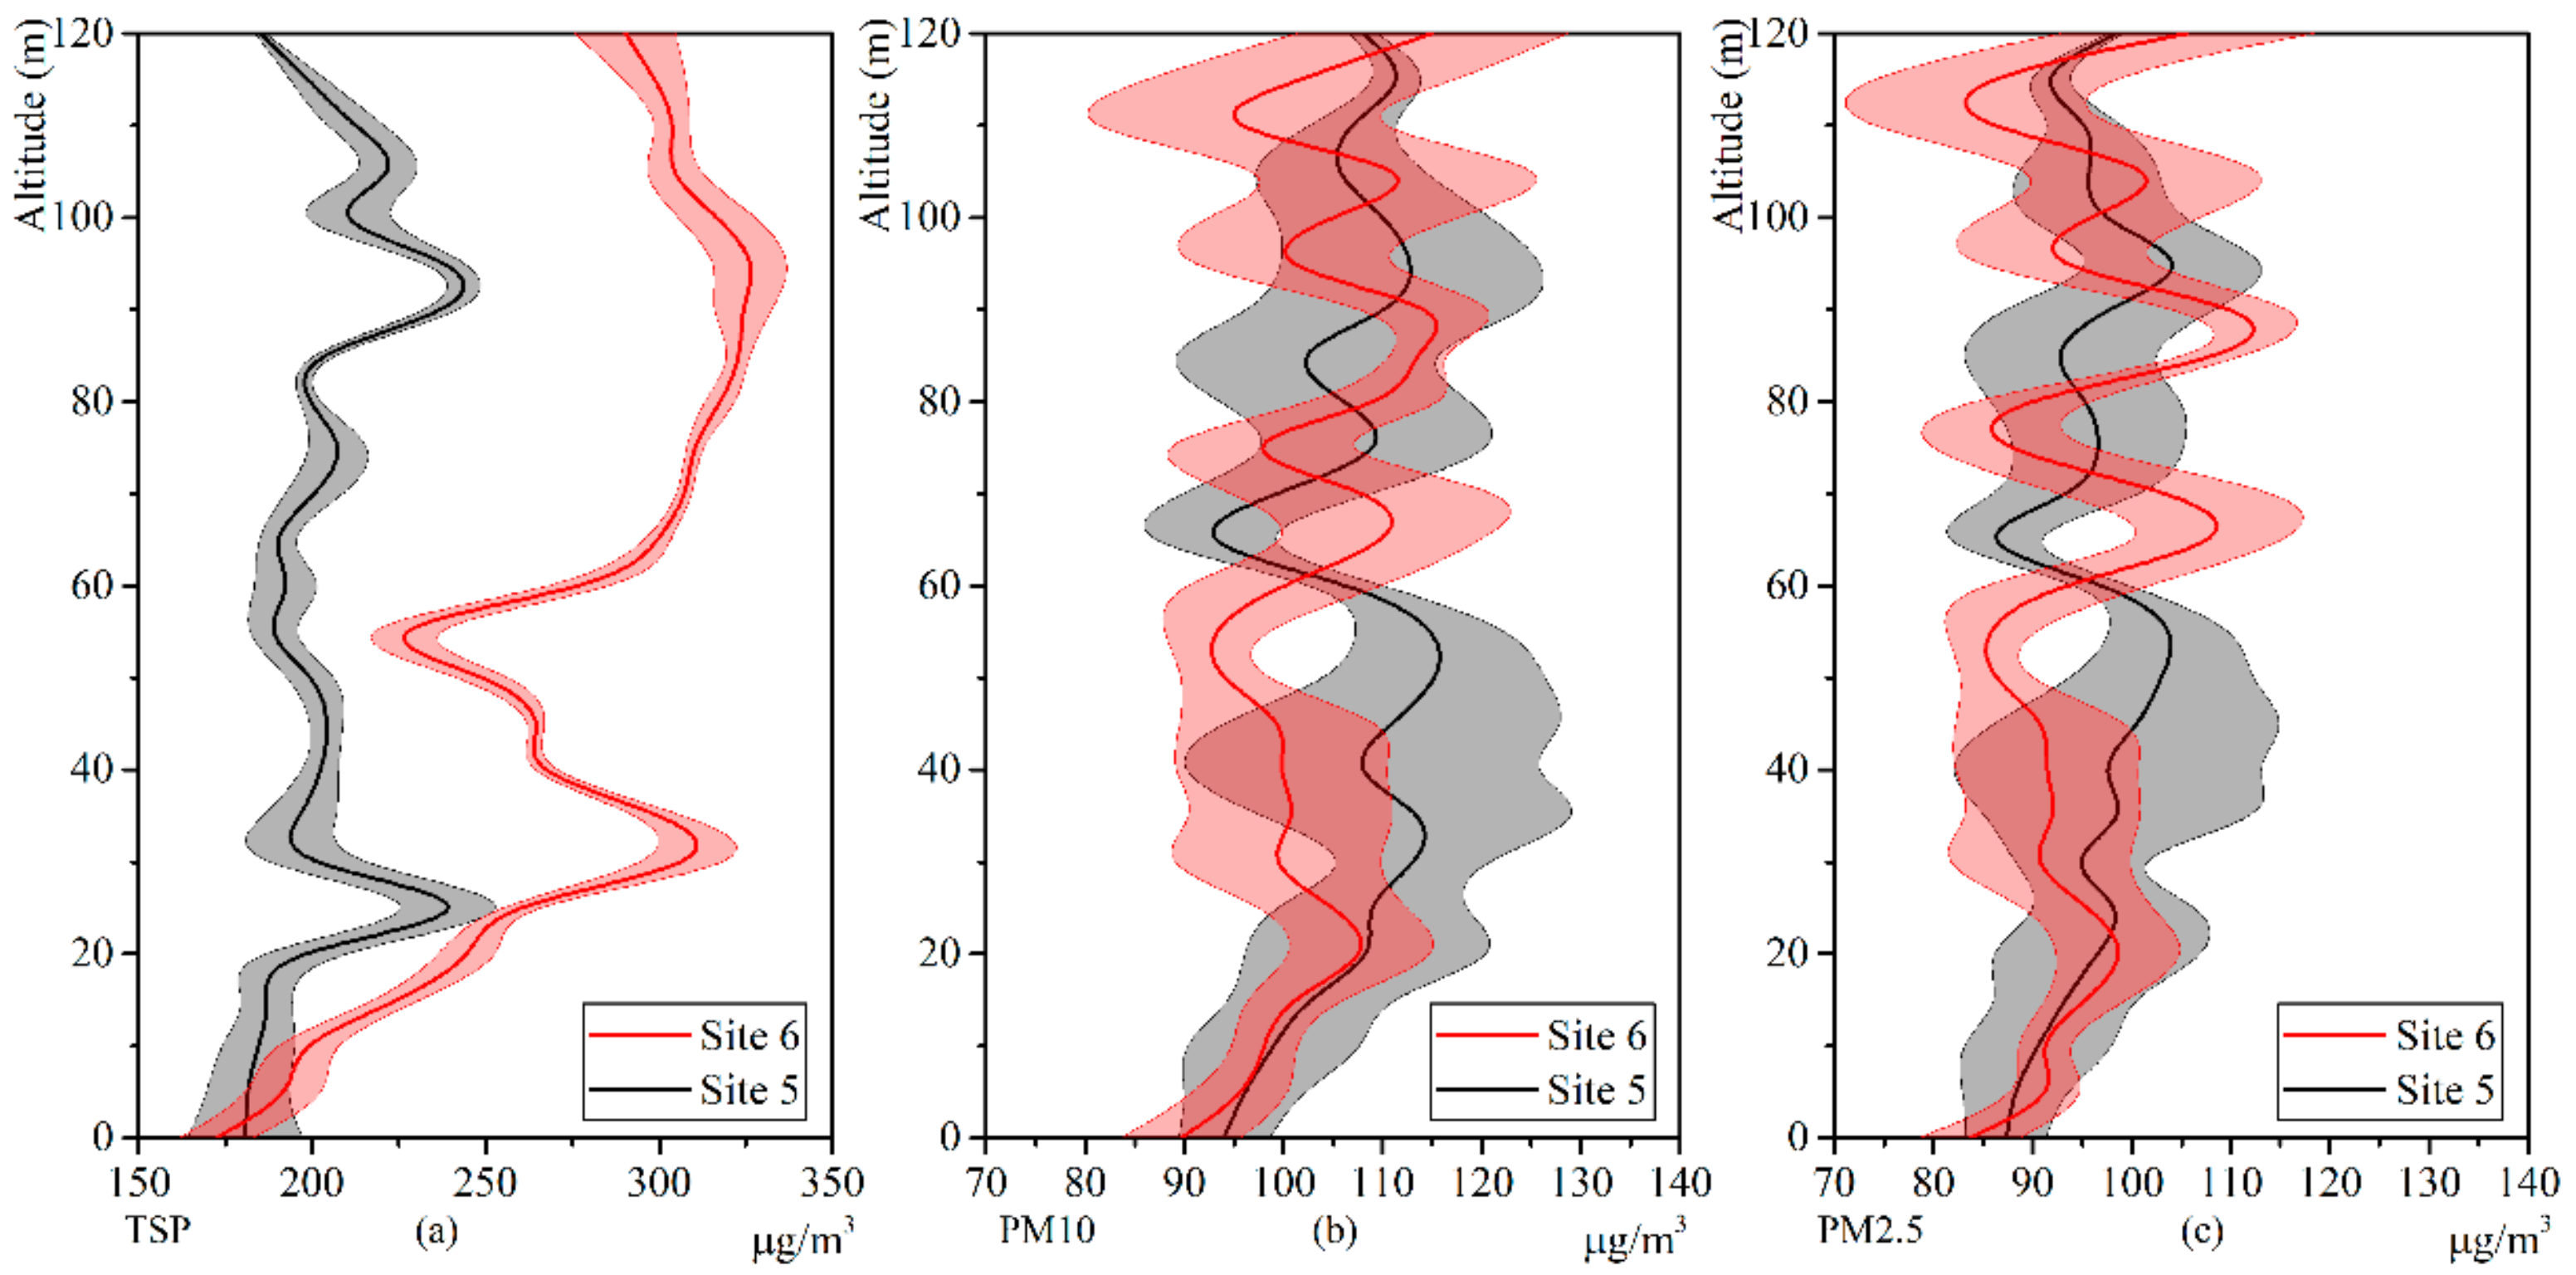
Although both Sites 5 and 6 stored coal, fog cannons were only in use at the former, allowing a direct comparison of this method’s effects (Figure 9). TSP showed a bimodal pattern at both sites; Site 6 peaked at 32 m and 90 m (305 μg/m3 and 320 μg/m3, respectively) while Site 5 peaked at 25 m and 90 m (both 240 μg/m3). PM10 and PM2.5 had a similar vertical distribution at Sites 5 and 6. Both increased from 0–22 m, then fluctuated within a stable range from 22–120 m.
Figure 9 suggests that fog cannons had a significant impact on peak concentrations of TSP as these were ~25% lower at Site 5. At present, the port authorities generally accept that the use of fog cannons to increase air humidity can reduce PM concentrations in the atmosphere. And the view was supported by Olszowski et al. [44], who found that a linear model can describe the reduction in the PM10 concentration relative to the type of precipitation and the water vapor content in the air. However, our study shows there was only a minor effect on the vertical distribution of PM10 and PM2.5. Interestingly, Štrbová et al. [45] also stated that the relationship between the vertical vary of PM concentration and meteorological parameters is not apparent, and they require more sophisticated analysis to achieve a more accurate interpretation. Previous studies showed that the relative humidity affected the adsorption ability of the PM [46]. The spray intensity also has significant impacts on the interaction between the PM and water droplets [47]. Both of the relative humidity and spray intensity can lead to changes in the PM concentrations, which might affect the measurement accuracy of PM concentration. However, it is difficult to quantify the contribution of relative humidity and the spray intensity on the vary of PM concentrations using the data from the UAV-based measurement platform. Thus, in the future, it is necessary to study the effects of spray intensity and relative humidity further and analyze the correlation with the vertical distribution of particulate matter concentration. And through detailed and sufficient quantitative analysis can the port authorities be provided with the most effective spray solution.

3.5. Effect of Porous Fence on PM Concentrations

Sites 3, 4, and 7 were closest to the porous fence, so we used their vertical profiles to assess the effects of this control method (Figure 10). At sites 3 and 4, with the porous fence on their upwind side, all three PM types fluctuated within a narrow range that changed little with altitude; the ranges of PM10 and PM2.5 were centered on 70 μg/m3 and 65 μg/m3, respectively.
At Site 7, it is close to the porous fence on the south side and is ~50 m away from the north side, and PM concentrations were far higher. TSP peaked at 10 m (300 μg/m3), ~2.2 times the average TSP at Sites 3 and 4, before declining to a stable but mostly higher level. PM10 and PM2.5 were consistently higher than at Sites 3 and 4, increasingly slowly with altitude with ranges of 95–122 μg/m3 and 90–110 μg/m3, respectively.
These results suggest that the porous fence is an effective dust suppression measure for dry bulk ports. However, along the wind direction, as the distance between the measurement site and the porous fence increases, the effect of the porous fence on the vertical distribution of PM concentration will be significantly decreased. Generally, with the distance from the porous fence increased the capability to reduce wind velocity decreases, yet there is no unified conclusion regarding the actual shelter performances of porous fences.
Above all, the port wind conditions could significantly affect the dust suppression outcome of the porous fence [48]. And the effective shelter range of the fence can reach ~6–7th consecutive stockpiles [38]. Besides, when installing the porous fence, we should consider the effect of multiple-fence arrays and porosity distribution on wind speed reduction [49]. In particular, the interval and the height of wind fences will directly impact the effectiveness of dust suppression [50]. Therefore, combining with meteorological characteristics and port demand, it is essential to study the influence of different porous fence layout program on the vertical distribution of PM concentration. And through this way, we can provide the port authorities with the optimal configuration and location of the porous fence to reduce PM levels effectively.

4. Conclusions

We used a hexacopter UAV to measure vertical profiles of PM concentrations at eight sites in or near a Chinese dry bulk port. TSP concentrations had a far wider range and maximum value than PM10 and PM2.5 concentrations. The maximum concentration for TSP was about seven times the minimum. TSP, PM10, and PM2.5 levels at 0–10 m altitude were mostly lower within the port area than at a nearby background site, while the reverse pattern was found from 10–120 m. PM10 and PM2.5 concentrations were strongly correlated with each other, but less so with TSP. Coarser cargo particles produced higher TSP but lower PM10 and PM2.5 at higher altitudes as compared to finer cargo particles; with overall stronger effects on TSP. The use of fog cannons reduced TSP concentrations above coal piles by 25%, with only minor influence on PM10 and PM2.5. In contrast, porous fence had a more significant effect on PM10 and PM2.5, though its useful scope is limited.
Under existing conditions, it is a challenge to analyze the elemental composition of PM using the data measured by UAV to determine the primary emission source. However, our results can be used to inform the proper location of ground-based measurement stations for improved monitoring. Besides, we clearly show how cargo type and suppression measures affect vertical and horizontal PM distribution, providing useful context for improved design and operation of dry bulk ports.

Author Contributions

This article is the result of joint work by all authors. All authors collaborated in analyzing data, preparing the data, and writing the paper. All authors discussed and agreed to submit the manuscript.

Funding

This research was funded by National Natural Science Foundation of China (Grant No. 51808187), Natural Science Foundation of Jiangsu Province (Grant No. BK20170879), Fundamental Research Funds for the Central Universities (Grant No. 2019B13514, and 2019B42314) and Jiangsu Planned Projects for Postdoctoral Research Funds (Grant No. 1701086B).

Acknowledgments

This study would not be possible without the valuable support from the Port of Zhenjiang.

Conflicts of Interest

The authors declare no conflict of interest.

References

  1. Wan, C.; Zhang, D.; Yan, X.; Yang, Z. A novel model for the quantitative evaluation of green port development-A case study of major ports in China. Transp. Res. Part D Transp. Environ. 2018, 61, 431–443. [Google Scholar] [CrossRef]
  2. Grote, M.; Mazurek, N.; Gräbsch, C.; Zeilinger, J.; Le Floch, S.; Wahrendorf, D.; Höfer, T. Dry bulk cargo shipping-An overlooked threat to the marine environment? Mar. Pollut. Bull. 2016, 110, 511–519. [Google Scholar] [CrossRef] [PubMed]
  3. Van Vianen, T.; Ottjes, J.; Lodewijks, G. Simulation-based determination of the required stockyard size for dry bulk terminals. Simul. Model. Pract. Theory 2014, 42, 119–128. [Google Scholar] [CrossRef]
  4. Hoffmann, J.; Asariotis, R.; Assaf, M.; Benamara, H. Review of Maritime Transport; United Nations Publications: New York, NY, USA, 2018; pp. 3–80. [Google Scholar]
  5. Merico, E.; Dinoi, A.; Contini, D. Development of an integrated modelling-measurement system for near-real-time estimates of harbour activity impact to atmospheric pollution in coastal cities. Transp. Res. Part D Transp. Environ. 2019, 73, 108–119. [Google Scholar] [CrossRef]
  6. Lin, Y.; Yan, L.; Wang, Y. Performance Evaluation and Investment Analysis for Container Port Sustainable Development in China: An Inverse DEA Approach. Sustainability 2019, 11, 4617. [Google Scholar] [CrossRef] [Green Version]
  7. Santos, M.; Radicchi, E.; Zagnoli, P. Port’s Role as a Determinant of Cruise Destination Socio-Economic Sustainability. Sustainability 2019, 11, 4542. [Google Scholar] [CrossRef] [Green Version]
  8. Mueller, D.; Uibel, S.; Takemura, M.; Klingelhoefer, D.; Groneberg, D.A. Ships, ports and particulate air pollution—An analysis of recent studies. J. Occup. Med. Toxicol. 2011, 6, 31–37. [Google Scholar] [CrossRef] [Green Version]
  9. Zhao, B.; Su, Y.; He, S.; Zhong, M.; Cui, G. Evolution and comparative assessment of ambient air quality standards in China. J. Integr. Environ. Sci. 2016, 13, 85–102. [Google Scholar] [CrossRef] [Green Version]
  10. Bachmann, J. Will the Circle Be Unbroken: A History of the U.S. National Ambient Air Quality Standards. J. Air Waste Manag. 2012, 57, 652–697. [Google Scholar] [CrossRef]
  11. Cao, J.; Chow, J.C.; Lee, F.S.C.; Watson, J.G. Evolution of PM2.5 Measurements and Standards in the U.S. and Future Perspectives for China. Aerosol Air Qual. Res. 2013, 13, 1197–1211. [Google Scholar] [CrossRef]
  12. Lam, J.; Yap, W. A Stakeholder Perspective of Port City Sustainable Development. Sustainability 2019, 11, 447. [Google Scholar] [CrossRef] [Green Version]
  13. Borriello, F. The Sustainability of Mediterranean Port Areas: Environmental Management for Local Regeneration in Valencia. Sustainability 2013, 5, 4288–4311. [Google Scholar] [CrossRef] [Green Version]
  14. Cerreta, M.; De Toro, P. Strategic Environmental Assessment of Port Plans in Italy: Experiences, Approaches, Tools. Sustainability 2012, 4, 2888–2921. [Google Scholar] [CrossRef] [Green Version]
  15. Saraga, D.E.; Tolis, E.I.; Maggos, T.; Vasilakos, C.; Bartzis, J.G. PM2.5 source apportionment for the port city of Thessaloniki, Greece. Sci. Total Environ. 2019, 650, 2337–2354. [Google Scholar] [CrossRef]
  16. Yang, L.; Cai, Y.; Zhong, X.; Shi, Y.; Zhang, Z. A Carbon Emission Evaluation for an Integrated Logistics System—A Case Study of the Port of Shenzhen. Sustainability 2017, 9, 462. [Google Scholar] [CrossRef] [Green Version]
  17. Bermúdez, F.M.; Laxe, F.G.; Aguayo-Lorenzo, E. Assessment of the tools to monitor air pollution in the Spanish ports system. Air Qual. Atmos. Health 2019, 12, 651–659. [Google Scholar] [CrossRef]
  18. Bjerkan, K.Y.; Seter, H. Reviewing tools and technologies for sustainable ports: Does research enable decision making in ports? Transp. Res. Part D Transp. Environ. 2019, 72, 243–260. [Google Scholar] [CrossRef]
  19. Woo, J.; Moon, D.S.H.; Lam, J.S.L. The impact of environmental policy on ports and the associated economic opportunities. Transp. Res. Pt. A Policy Pract. 2018, 110, 234–242. [Google Scholar]
  20. Perez, N.; Pey, J.; Reche, C.; Cortes, J.; Alastuey, A.; Querol, X. Impact of harbour emissions on ambient PM10 and PM2.5 in Barcelona (Spain): Evidences of secondary aerosol formation within the urban area. Sci. Total Environ. 2016, 571, 237–250. [Google Scholar] [CrossRef]
  21. Jeong, J.; Shon, Z.; Kang, M.; Song, S.; Kim, Y.; Park, J.; Kim, H. Comparison of source apportionment of PM 2.5 using receptor models in the main hub port city of East Asia: Busan. Atmos. Environ. 2017, 148, 115–127. [Google Scholar] [CrossRef]
  22. Mousavi, A.; Sowlat, M.H.; Hasheminassab, S.; Polidori, A.; Shafer, M.M.; Schauer, J.J.; Sioutas, C. Impact of emissions from the Ports of Los Angeles and Long Beach on the oxidative potential of ambient PM 0.25 measured across the Los Angeles County. Sci. Total Environ. 2019, 651, 638–647. [Google Scholar] [CrossRef] [PubMed]
  23. Zhang, J.; Ji, Y.; Zhao, J.; Zhao, J. Optimal location of a particulate matter sampling head outside an unmanned aerial vehicle. Particuology 2017, 32, 153–159. [Google Scholar] [CrossRef]
  24. Peng, Z.; Wang, D.; Wang, Z.; Gao, Y.; Lu, S. A study of vertical distribution patterns of PM 2.5 concentrations based on ambient monitoring with unmanned aerial vehicles: A case in Hangzhou. China Atmos. Environ. 2015, 123, 357–369. [Google Scholar] [CrossRef]
  25. Li, X.; Wang, D.; Lu, Q.; Peng, Z.; Wang, Z. Investigating vertical distribution patterns of lower tropospheric PM2.5 using unmanned aerial vehicle measurements. Atmos. Environ. 2018, 173, 62–71. [Google Scholar] [CrossRef]
  26. Alvarado, M.; Gonzalez, F.; Erskine, P.; Cliff, D.; Heuff, D. A methodology to monitor airborne PM10 dust particles using a small unmanned aerial vehicle. Sensors 2017, 17, 343. [Google Scholar] [CrossRef]
  27. Watts, A.C.; Ambrosia, V.G.; Hinkley, E.A. Unmanned Aircraft Systems in Remote Sensing and Scientific Research: Classification and Considerations of Use. Remote Sens. 2012, 4, 1671–1692. [Google Scholar] [CrossRef] [Green Version]
  28. Elston, J.; Argrow, B.; Stachura, M.; Weibel, D.; Lawrence, D.; Pope, D. Overview of small fixed-wing unmanned aircraft for meteorological sampling. J. Atmos. Ocean. Tech. 2015, 32, 97–115. [Google Scholar] [CrossRef]
  29. Villa, T.F.; Gonzalez, F.; Miljievic, B.; Ristovski, Z.D.; Morawska, L. An overview of small unmanned aerial vehicles for air quality measurements: Present applications and future prospectives. Sensors 2016, 16, 1072. [Google Scholar] [CrossRef] [Green Version]
  30. Villa, T.F.; Salimi, F.; Morton, K.; Morawska, L.; Gonzalez, F. Development and validation of a UAV based system for air pollution measurements. Sensors 2016, 16, 2202. [Google Scholar] [CrossRef] [Green Version]
  31. Kuuluvainen, H.; Poikkimaki, M.; Jarvinen, A.; Kuula, J.; Irjala, M.; Dal Maso, M.; Keskinen, J.; Timonen, H.; Niemi, J.V.; Ronkko, T. Vertical profiles of lung deposited surface area concentration of particulate matter measured with a drone in a street canyon. Environ. Pollut. 2018, 241, 96–105. [Google Scholar] [CrossRef]
  32. Sheng, Q.; Zhang, Y.; Zhu, Z.; Li, W.; Xu, J.; Tang, R. An experimental study to quantify road greenbelts and their association with PM2.5 concentration along city main roads in Nanjing, China. Sci. Total Environ. 2019, 667, 710–717. [Google Scholar] [CrossRef] [PubMed]
  33. Aurell, J.; Mitchell, W.; Chirayath, V.; Jonsson, J.; Tabor, D.; Gullett, B. Field determination of multipollutant, open area combustion source emission factors with a hexacopter unmanned aerial vehicle. Atmos. Environ. 2017, 166, 433–440. [Google Scholar] [CrossRef] [PubMed]
  34. Yang, S.; Chen, B.; Fath, B. Trans-boundary total suspended particulate matter (TSPM) in urban ecosystems. Ecol. Model. 2015, 318, 59–63. [Google Scholar] [CrossRef]
  35. Grami, A. Probability, Random Variables, Statistics, and Random Processes, 1st ed.; John Wiley & Sons, Inc.: Hoboken, NJ, USA, 2019; pp. 241–257. [Google Scholar]
  36. Almeida, S.M.; Silva, A.V.; Freitas, M.C.; Marques, A.M.; Ramos, C.A.; Silva, A.I.; Pinheiro, T. Characterization of dust material emitted during harbour activities by k0-INAA and PIXE. J. Radioanal. Nucl. 2012, 291, 77–82. [Google Scholar] [CrossRef]
  37. Li, Y.; Chen, Q.; Zhao, H.; Wang, L.; Tao, R. Variations in PM 10, PM 2.5 and PM 1.0 in an urban area of the sichuan basin and their relation to meteorological factors. Atmosphere 2015, 6, 150–163. [Google Scholar] [CrossRef] [Green Version]
  38. Cong, X.C.; Du, H.B.; Peng, S.T.; Dai, M.X. Field measurements of shelter efficacy for installed wind fences in the open coal yard. J. Wind Eng. Ind. Aerod. 2013, 117, 18–24. [Google Scholar] [CrossRef]
  39. Johnson, K.K.; Bergin, M.H.; Russell, A.G.; Hagler, G.S.W. Field test of several low-cost particulate matter sensors in high and low concentration urban environments. Aerosol Air Qual. Res. 2018, 18, 56–578. [Google Scholar] [CrossRef]
  40. Sajjadi, S.A.; Zolfaghari, G.; Adab, H.; Allahabadi, A.; Delsouz, M. Measurement and modeling of particulate matter concentrations: Applying spatial analysis and regression techniques to assess air quality. MethodsX 2017, 4, 372–390. [Google Scholar] [CrossRef]
  41. Gozzi, F.; Della Ventura, G.; Marcelli, A. Mobile monitoring of particulate matter: State of art and perspectives. Atmos. Pollut. Res. 2016, 7, 228–234. [Google Scholar] [CrossRef]
  42. Alastuey, A.; Moreno, N.; Querol, X.; Viana, M.; Artíñano, B.; Luaces, J.A.; Basora, J.; Guerra, A. Contribution of harbour activities to levels of particulate matter in a harbour area: Hada Project-Tarragona Spain. Atmos. Environ. 2007, 41, 6366–6378. [Google Scholar] [CrossRef]
  43. Sorte, S.; Arunachalam, S.; Naess, B.; Seppanen, C.; Rodrigues, V.; Valencia, A.; Borrego, C.; Monteiro, A. Assessment of source contribution to air quality in an urban area close to a harbor: Case-study in Porto, Portugal. Sci. Total Environ. 2019, 662, 347–360. [Google Scholar] [CrossRef] [PubMed]
  44. Olszowski, T.; Ziembik, Z. An alternative conception of PM 10 concentration changes after short-term precipitation in urban environment. J. Aerosol Sci. 2018, 121, 21–30. [Google Scholar] [CrossRef]
  45. Štrbová, K.; Raclavská, H.; Bílek, J. Impact of fugitive sources and meteorological parameters on vertical distribution of particulate matter over the industrial agglomeration. J. Environ. Manag. 2017, 203, 1190–1198. [Google Scholar] [CrossRef] [PubMed]
  46. Zhou, Q.; Qin, B.; Wang, J.; Wang, H.; Wang, F. Experimental investigation on the changes of the wettability and surface characteristics of coal dust with different fractal dimensions. Colloids Surf. A Physicochem. Eng. Asp. 2018, 551, 148–157. [Google Scholar] [CrossRef]
  47. Peng, H.; Nie, W.; Yu, H.; Cheng, W.; Bai, P.; Liu, Q.; Liu, Z.; Yang, S.; Xu, C.; Hua, Y.; et al. Research on mine dust suppression by spraying: Development of an air-assisted PM10 control device based on CFD technology. Adv. Powder Technol. 2019, 30, 2588–2599. [Google Scholar] [CrossRef]
  48. Cong, X.C.; Cao, S.Q.; Chen, Z.L.; Peng, S.T.; Yang, S.L. Impact of the installation scenario of porous fences on wind-blown particle emission in open coal yards. Atmos. Environ. 2011, 45, 5247–5253. [Google Scholar] [CrossRef]
  49. Hong, S.; Lee, I.; Seo, I. Modelling and predicting wind velocity patterns for windbreak fence design. J. Wind Eng. Ind. Aerod. 2015, 142, 53–64. [Google Scholar] [CrossRef]
  50. Kim, R.; Lee, I.; Kwon, K.; Yeo, U.; Lee, S.; Lee, M. Design of a windbreak fence to reduce fugitive dust in open areas. Comput. Electron. Agric. 2018, 149, 150–165. [Google Scholar] [CrossRef]
Figure 1. Study area and sampling sites: (a) Location of the city of Zhenjiang and the port of Zhenjiang (ZJP); (b) location of the Dagang port area (DGP), one of the seven main areas within ZJP; (c) the four zones within the DGP; (d) detail measurement sites of Z2; (e) detail measurement sites of Z4; (f) detail of background measurement site.
Sustainability 11 07135 g001
Figure 2. Characteristics of measurement sites: (a) Particle size characteristics of chrome ore at Site 1; (b) particle size characteristics of iron ore at Site 2; (c) fog cannon, and (d) porous fence controlling coal dust in Z4.
Sustainability 11 07135 g002
Figure 3. (a) Particulate matter (PM) measurement platform, including a hexacopter unmanned aerial vehicle (UAV) (a1), the integrated measurement components (a2), and a radio controller (a3). (b) The integrated measurement components, including a GPS antenna (b1), a data transmission antenna (b2), and the sensor package (b3). (c) Sensor package details, including a sensor for PM10 and PM2.5 (c1), a sensor for total suspended particulates (TSP) (c2), a wireless network modem (c3), and a sensor for humidity, and temperature (c4).
Sustainability 11 07135 g003
Figure 4. Distribution of PM concentrations for all altitudes (0–120 m) by site for (a) TSP; (b) PM10; and (c) PM2.5. Blue and red lines indicate minimum and maximum concentrations for all sites; green lines indicate air quality standards for PM in industrial sites (Table 1).
Sustainability 11 07135 g004
Figure 5. PM concentrations by altitude for the seven ZJP measurement sites relative to the background site (black line) for (a) TSP; (b) PM10; and (c) PM2.5.
Sustainability 11 07135 g005
Figure 6. Vertical distribution of TSP concentrations by site.
Sustainability 11 07135 g006
Figure 7. Vertical distribution of PM10 and PM2.5 concentrations by site
Sustainability 11 07135 g007
Figure 8. Vertical distribution of (a) TSP, (b) PM10, and (c) PM2.5 above Sites 1 and 2; thick central line is the average value and thin outer lines define the range.
Sustainability 11 07135 g008
Figure 9. Vertical distribution (a) TSP, (b) PM10, and (c) PM2.5 above Sites 5 and 6; thick central line is the average value and thin outer lines define the range.
Sustainability 11 07135 g009
Figure 10. Vertical distributions of PM concentrations at Sites 3, 4, and 7.
Sustainability 11 07135 g010
Table 1. Comparison of latest particulate matter (PM) standards in different countries and organizations.
IndicatorAveraging PeriodChina (µg/m3)US
(µg/m3)
California
(µg/m3)
EU
(µg/m3)
WHO
(µg/m3)
Grade-1Grade-2
TSP24-hr 120300NoneNoneNoneNone
Annual80200NoneNoneNoneNone
PM1024-hr 50150None505050
Annual4070150204020
PM2.524-hr 357535NoneNone25
Annual153512122510
Notes: Grade-1: Residential areas; Grade-2: Commercial and industrial areas.
Table 2. CV of PM concentrations by site.
PM TypeSite 1Site 2Site 3Site 4Site5Site 6Site 7Site 8
TSP0.170.490.190.070.100.190.230.10
PM100.130.110.080.050.090.140.100.10
PM2.50.130.110.080.050.080.130.090.09
Table 3. PCC for TSP, PM10, and PM2.5 concentrations by site.
Site1Site2Site3
TSPPM10PM2.5TSPPM10PM2.5TSPPM10PM2.5
TSP1.000.250.261.000.240.231.000.370.35
PM10 1.000.99 1.000.99 1.000.99
PM2.5 1.000 1.00 1.00
Site4Site5Site6
TSPPM10PM2.5TSPPM10PM2.5TSPPM10PM2.5
TSP1.000.060.121.000.310.321.000.440.44
PM10 1.000.99 1.000.99 1.000.99
PM2.5 1.00 1.000 1.00
Site7Site8
TSPPM10PM2.5TSPPM10PM2.5
TSP1.000.030.031.000.310.32
PM10 1.000.99 1.000.99
PM2.5 1.00 1.00