Flow Analysis and Damage Assessment for Concrete Box Girder Based on Flow Characteristics
Abstract
:1. Introduction
2. Basic Concepts of Flow Analysis
2.1. Definition and Classification of Flow
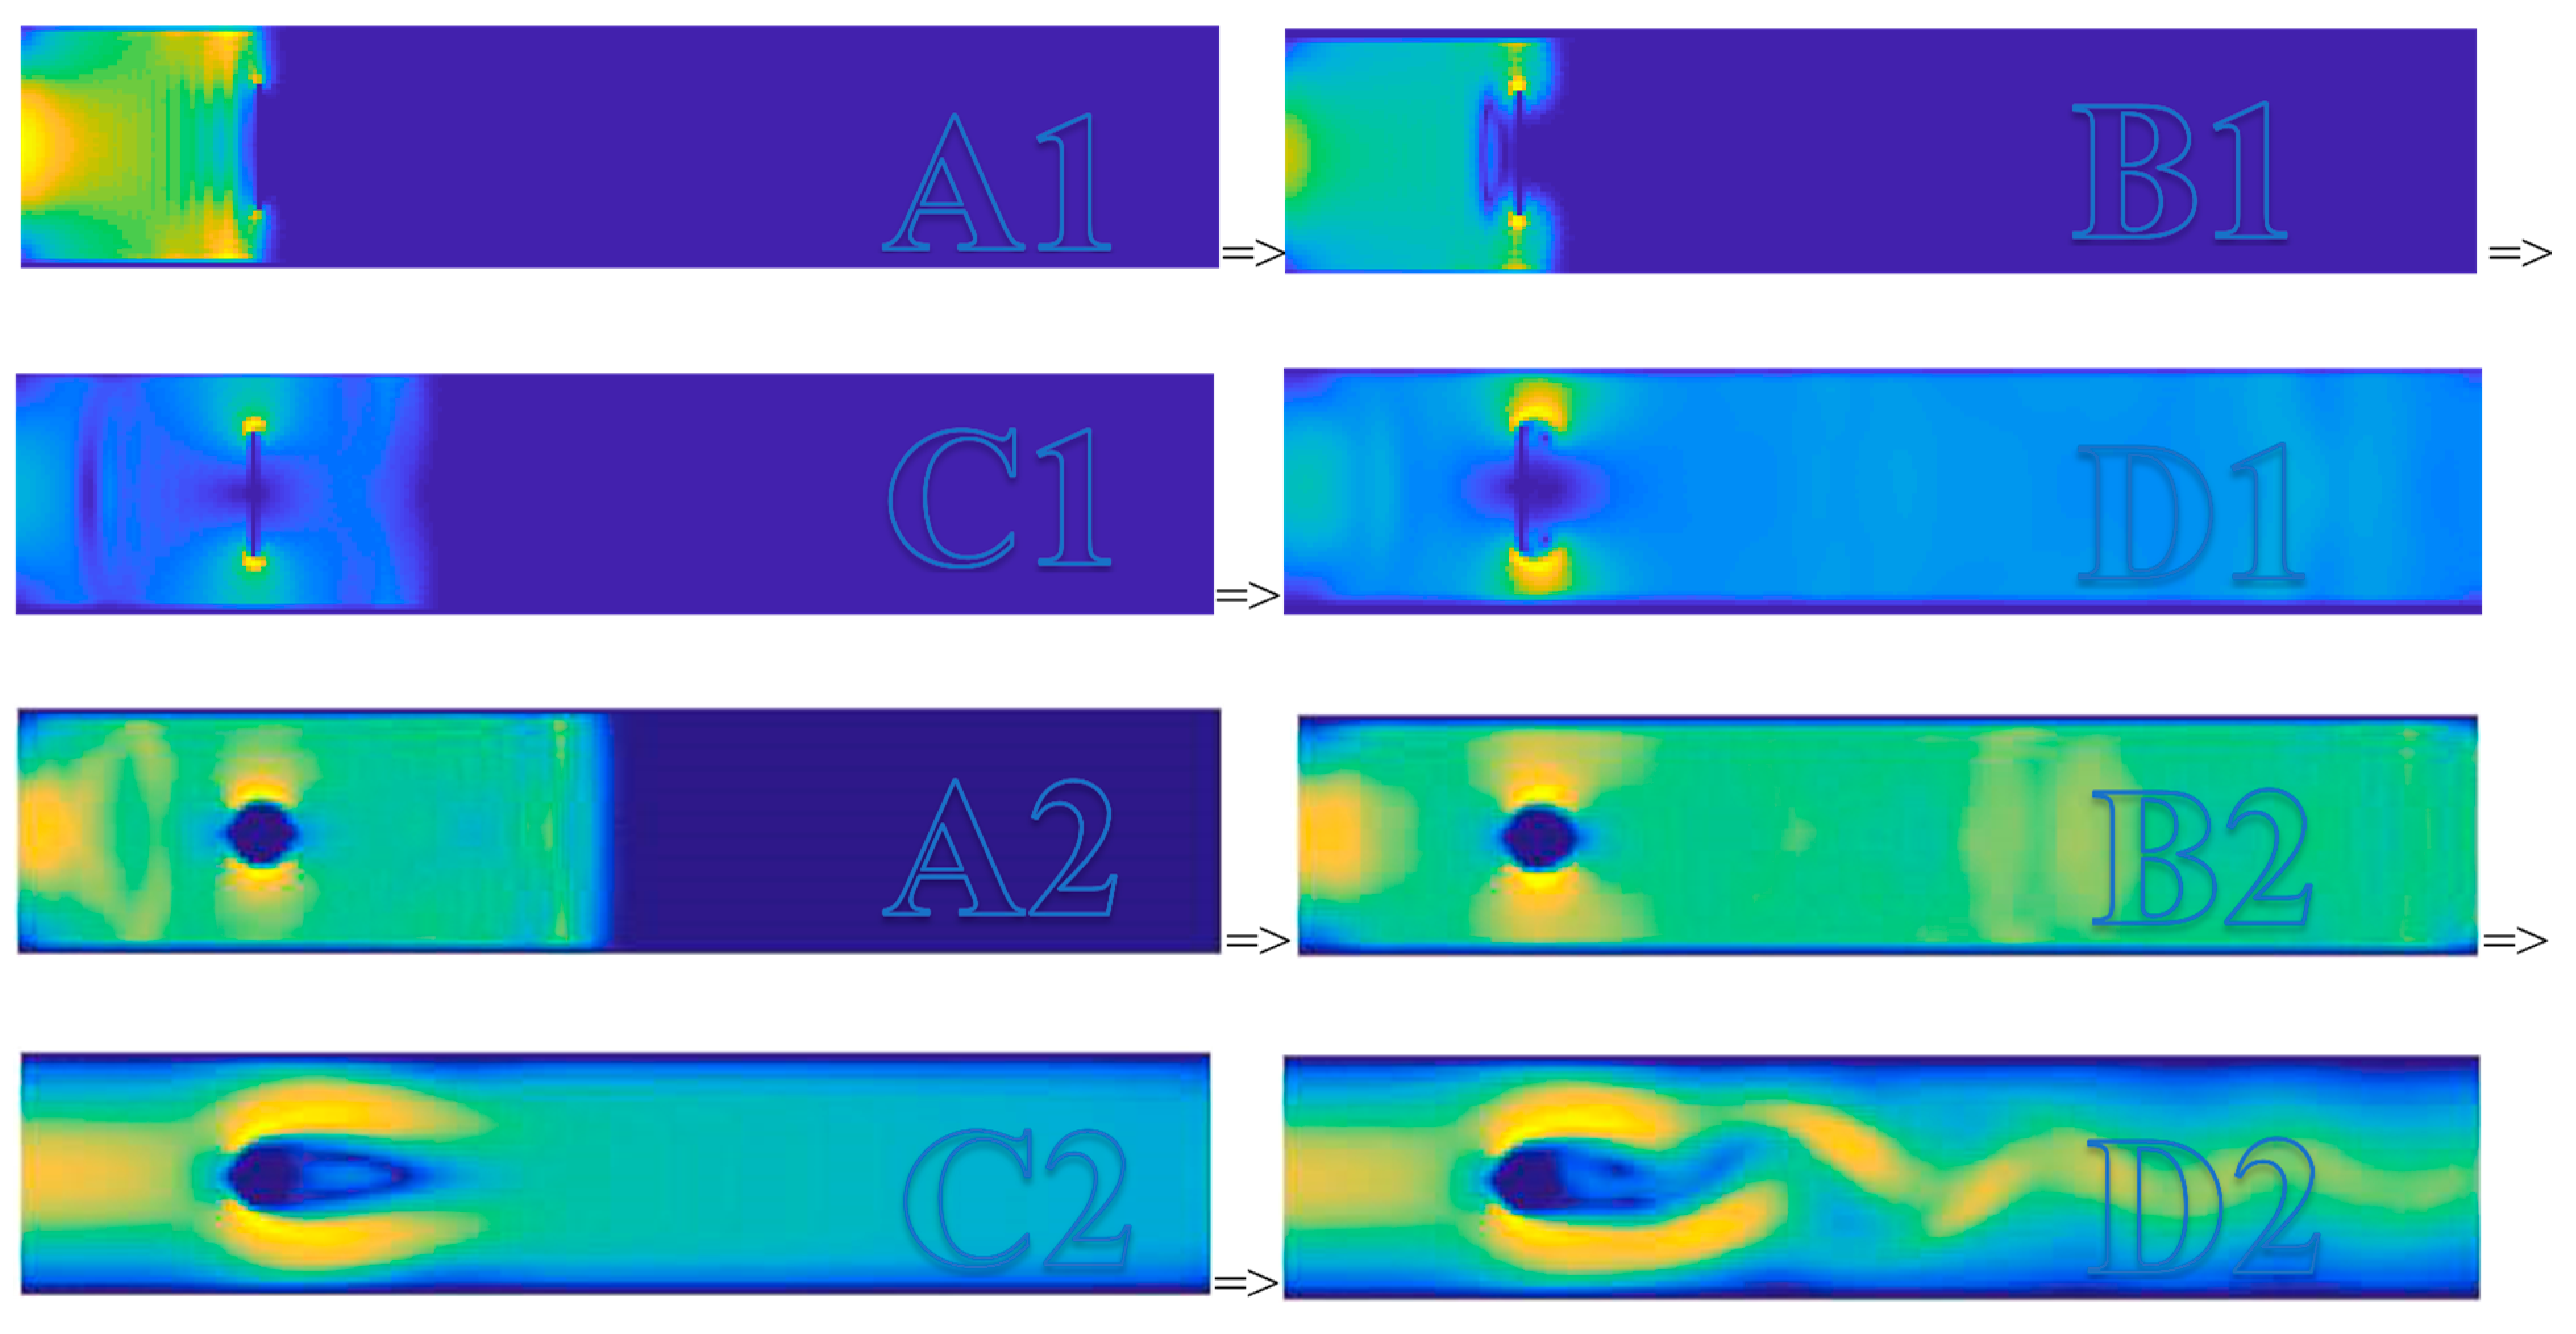
- In the microscopic view, it mainly focuses on the phonon (a phonon is a quantum mechanical description of an elementary vibrational motion in which a lattice of atoms or molecules uniformly oscillates at a single frequency) and the formation mechanism of flow (here, wave and flow have the same meaning).
- In the mesoscopic view, it mainly concentrates on the evolution mechanism of basic flow, and how the basic flow (wave) joins to a swarm (here, the flow is treated as the swarm behavior of simple harmonic waves).
- In the macroscopic view, the research is mainly for statistical mechanism and pattern recognition for the flow (usually, the flow is of turbulence, which is hard to describe using the analytical wave functions).
2.2. Flow Characteristics-Based (FC-based) Method
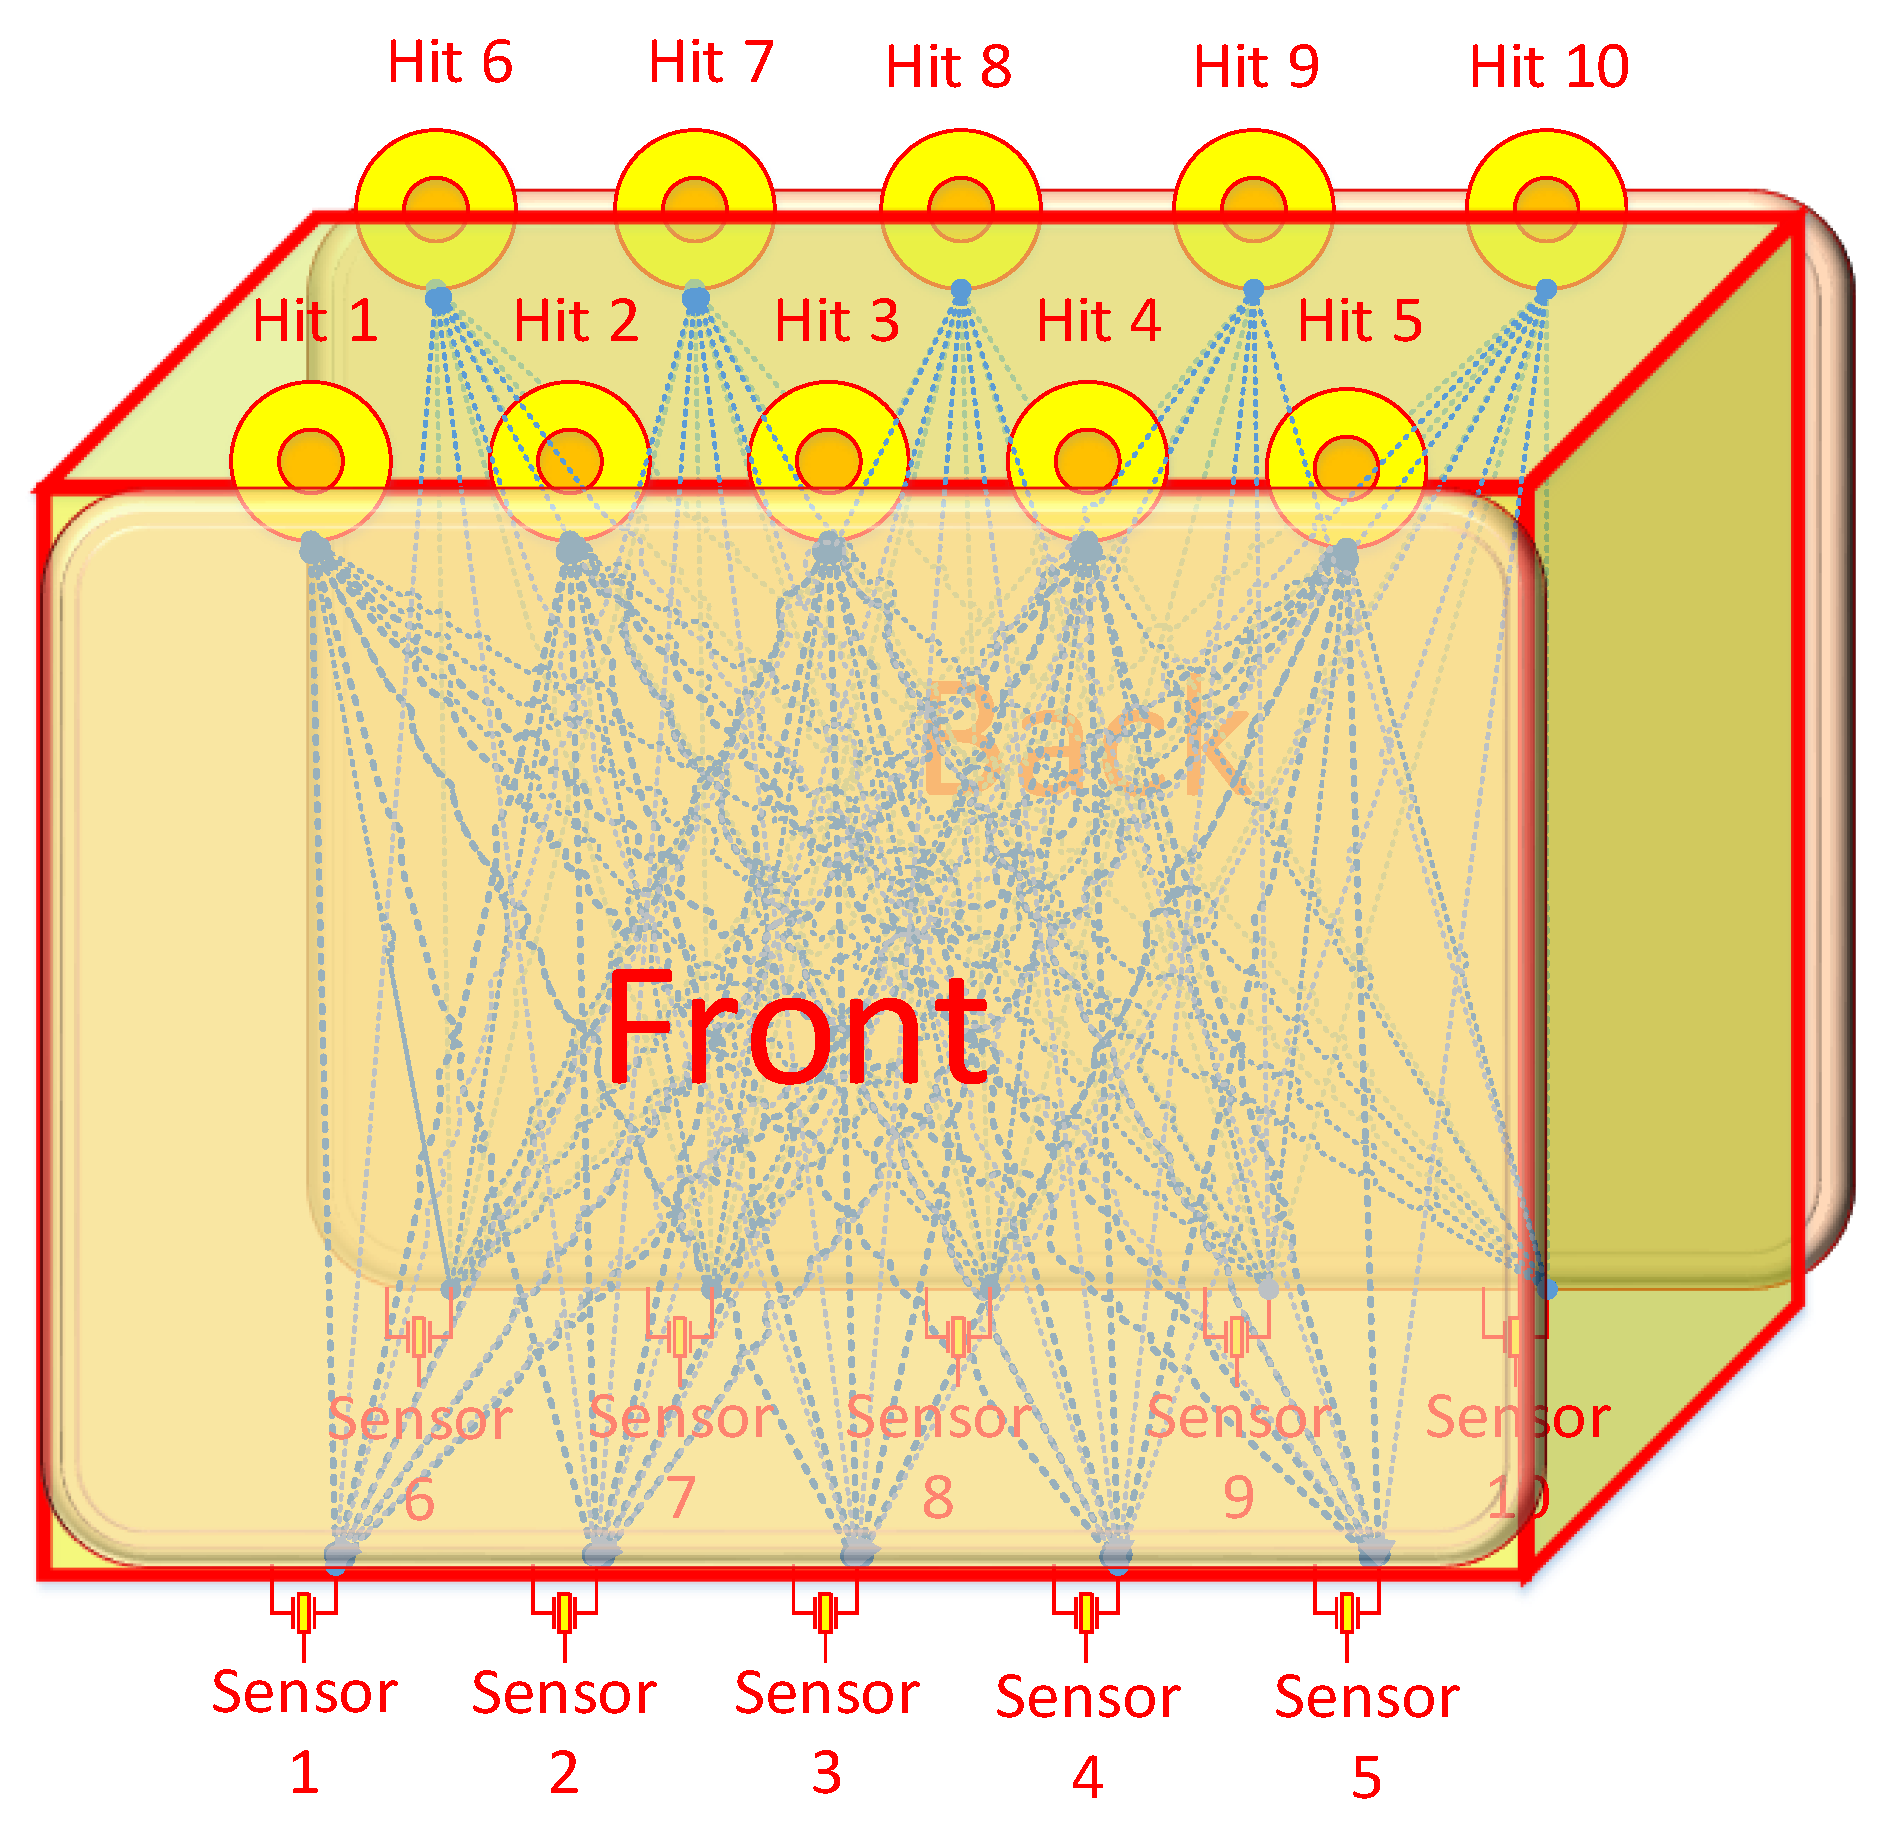
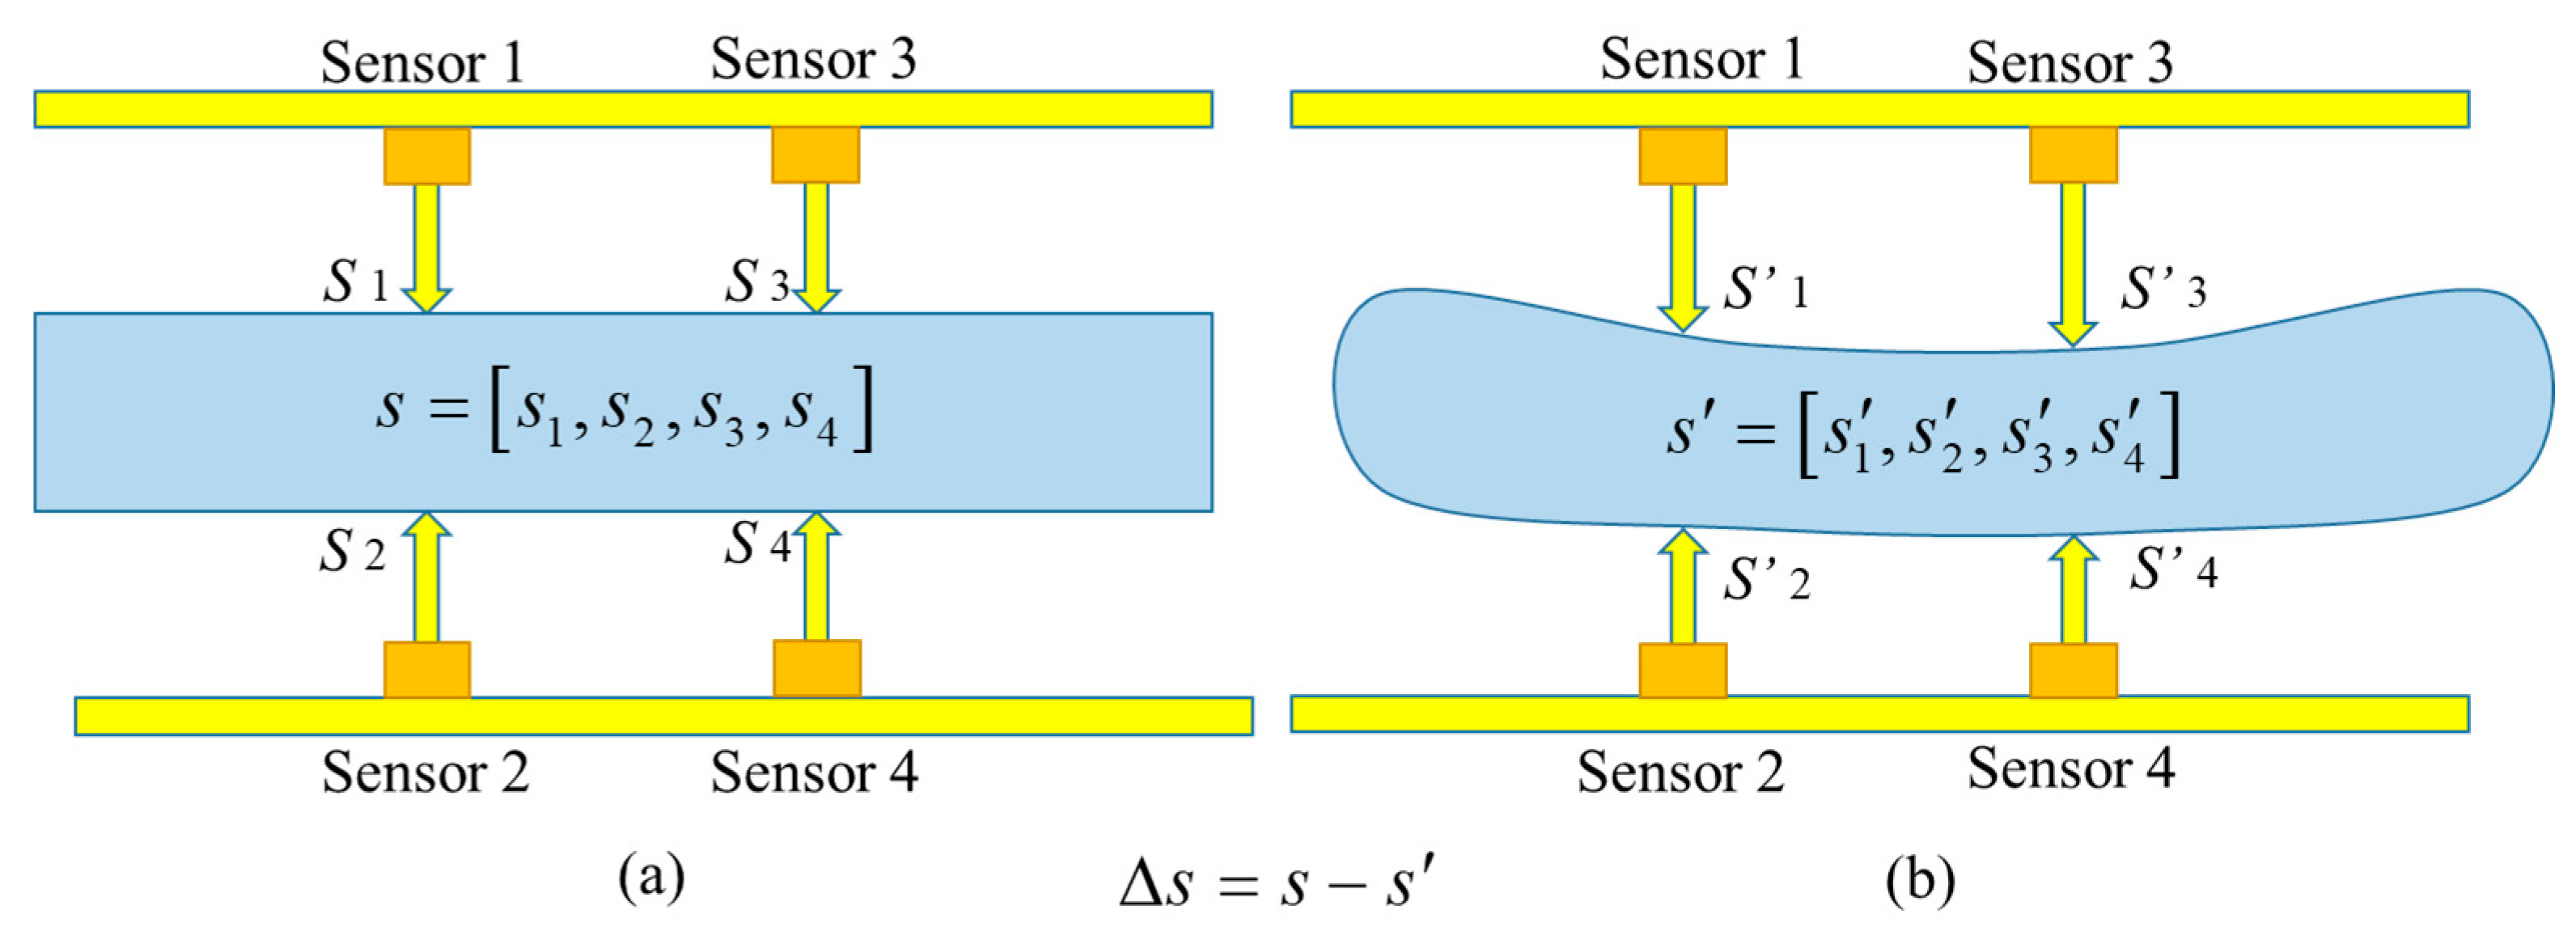
- Suppose for a system Φ, is the surface of this system. The system can store or release the same flow as the flow of input, and the flow stored or released by Φ is flowΦ.
- h(t) and h(t,Φ) represent the input and output, respectively, and we record the input and output in the same period , the effective input period , and output period :in which j1 and j2 are the flux at the differential surface of the input and output, respectively, which is the function of time and system, . For the same flow, the input lasts for and the output lasts for . Then, to calculate the flowΦ, here is its function, f (Φ):
- Class 1:
- Spread of flow: The characteristics to describe the spread of flow in the system, such as acceleration, speed, travel or propagation time, displacement, etc.
- Class 2:
- Channel for flow: The characteristics to describe the channel that the flow goes through. It is about the distribution of flow in the system and the route of flow in the system, such as its topology, hierarchy, fractal dimension, cross-sectional area, etc.
- Class 3:
- Flow amount in the channel of flow: The characteristics to describe the amount of flow, such as mass, quantity, intensity, strength, etc.
- Class 4:
- Expansion of flow in the flow system: The characteristics to describe the expansion of flow in a specific system or systems with or without clear boundaries, such as lifetime and propagation region (depth, width, or boundary).
3. Experiment and Analysis of Artificial Damage
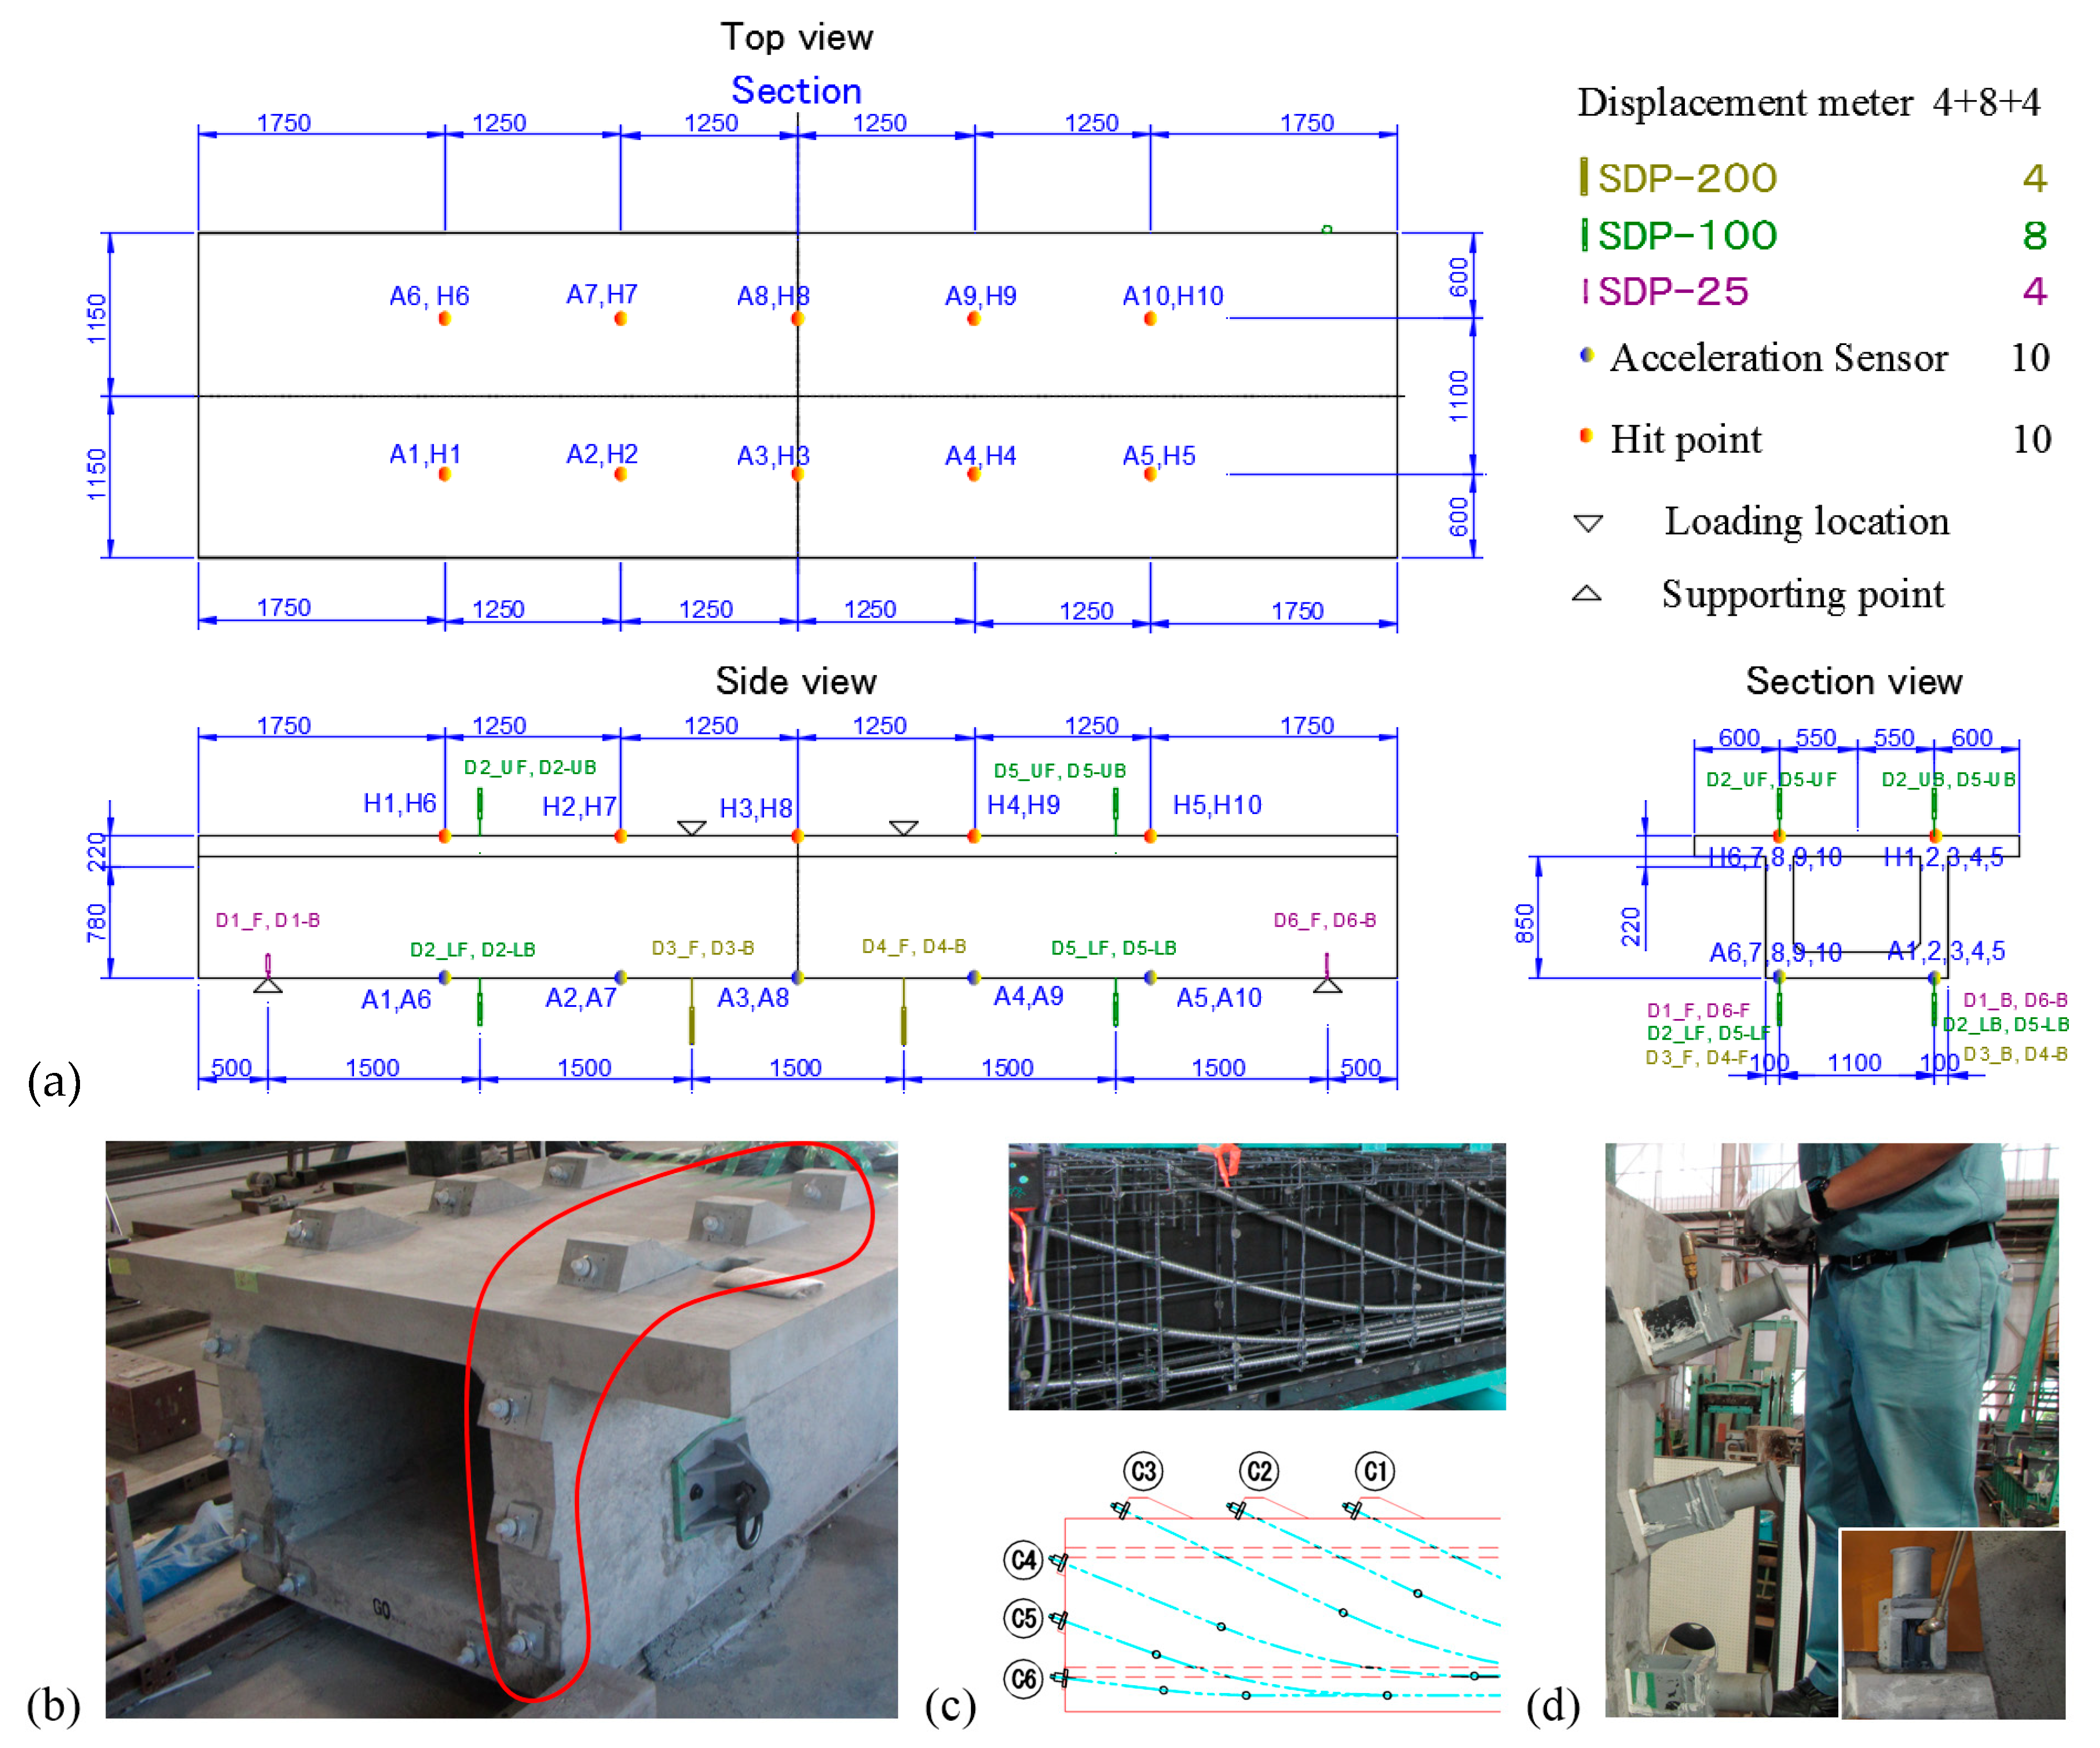
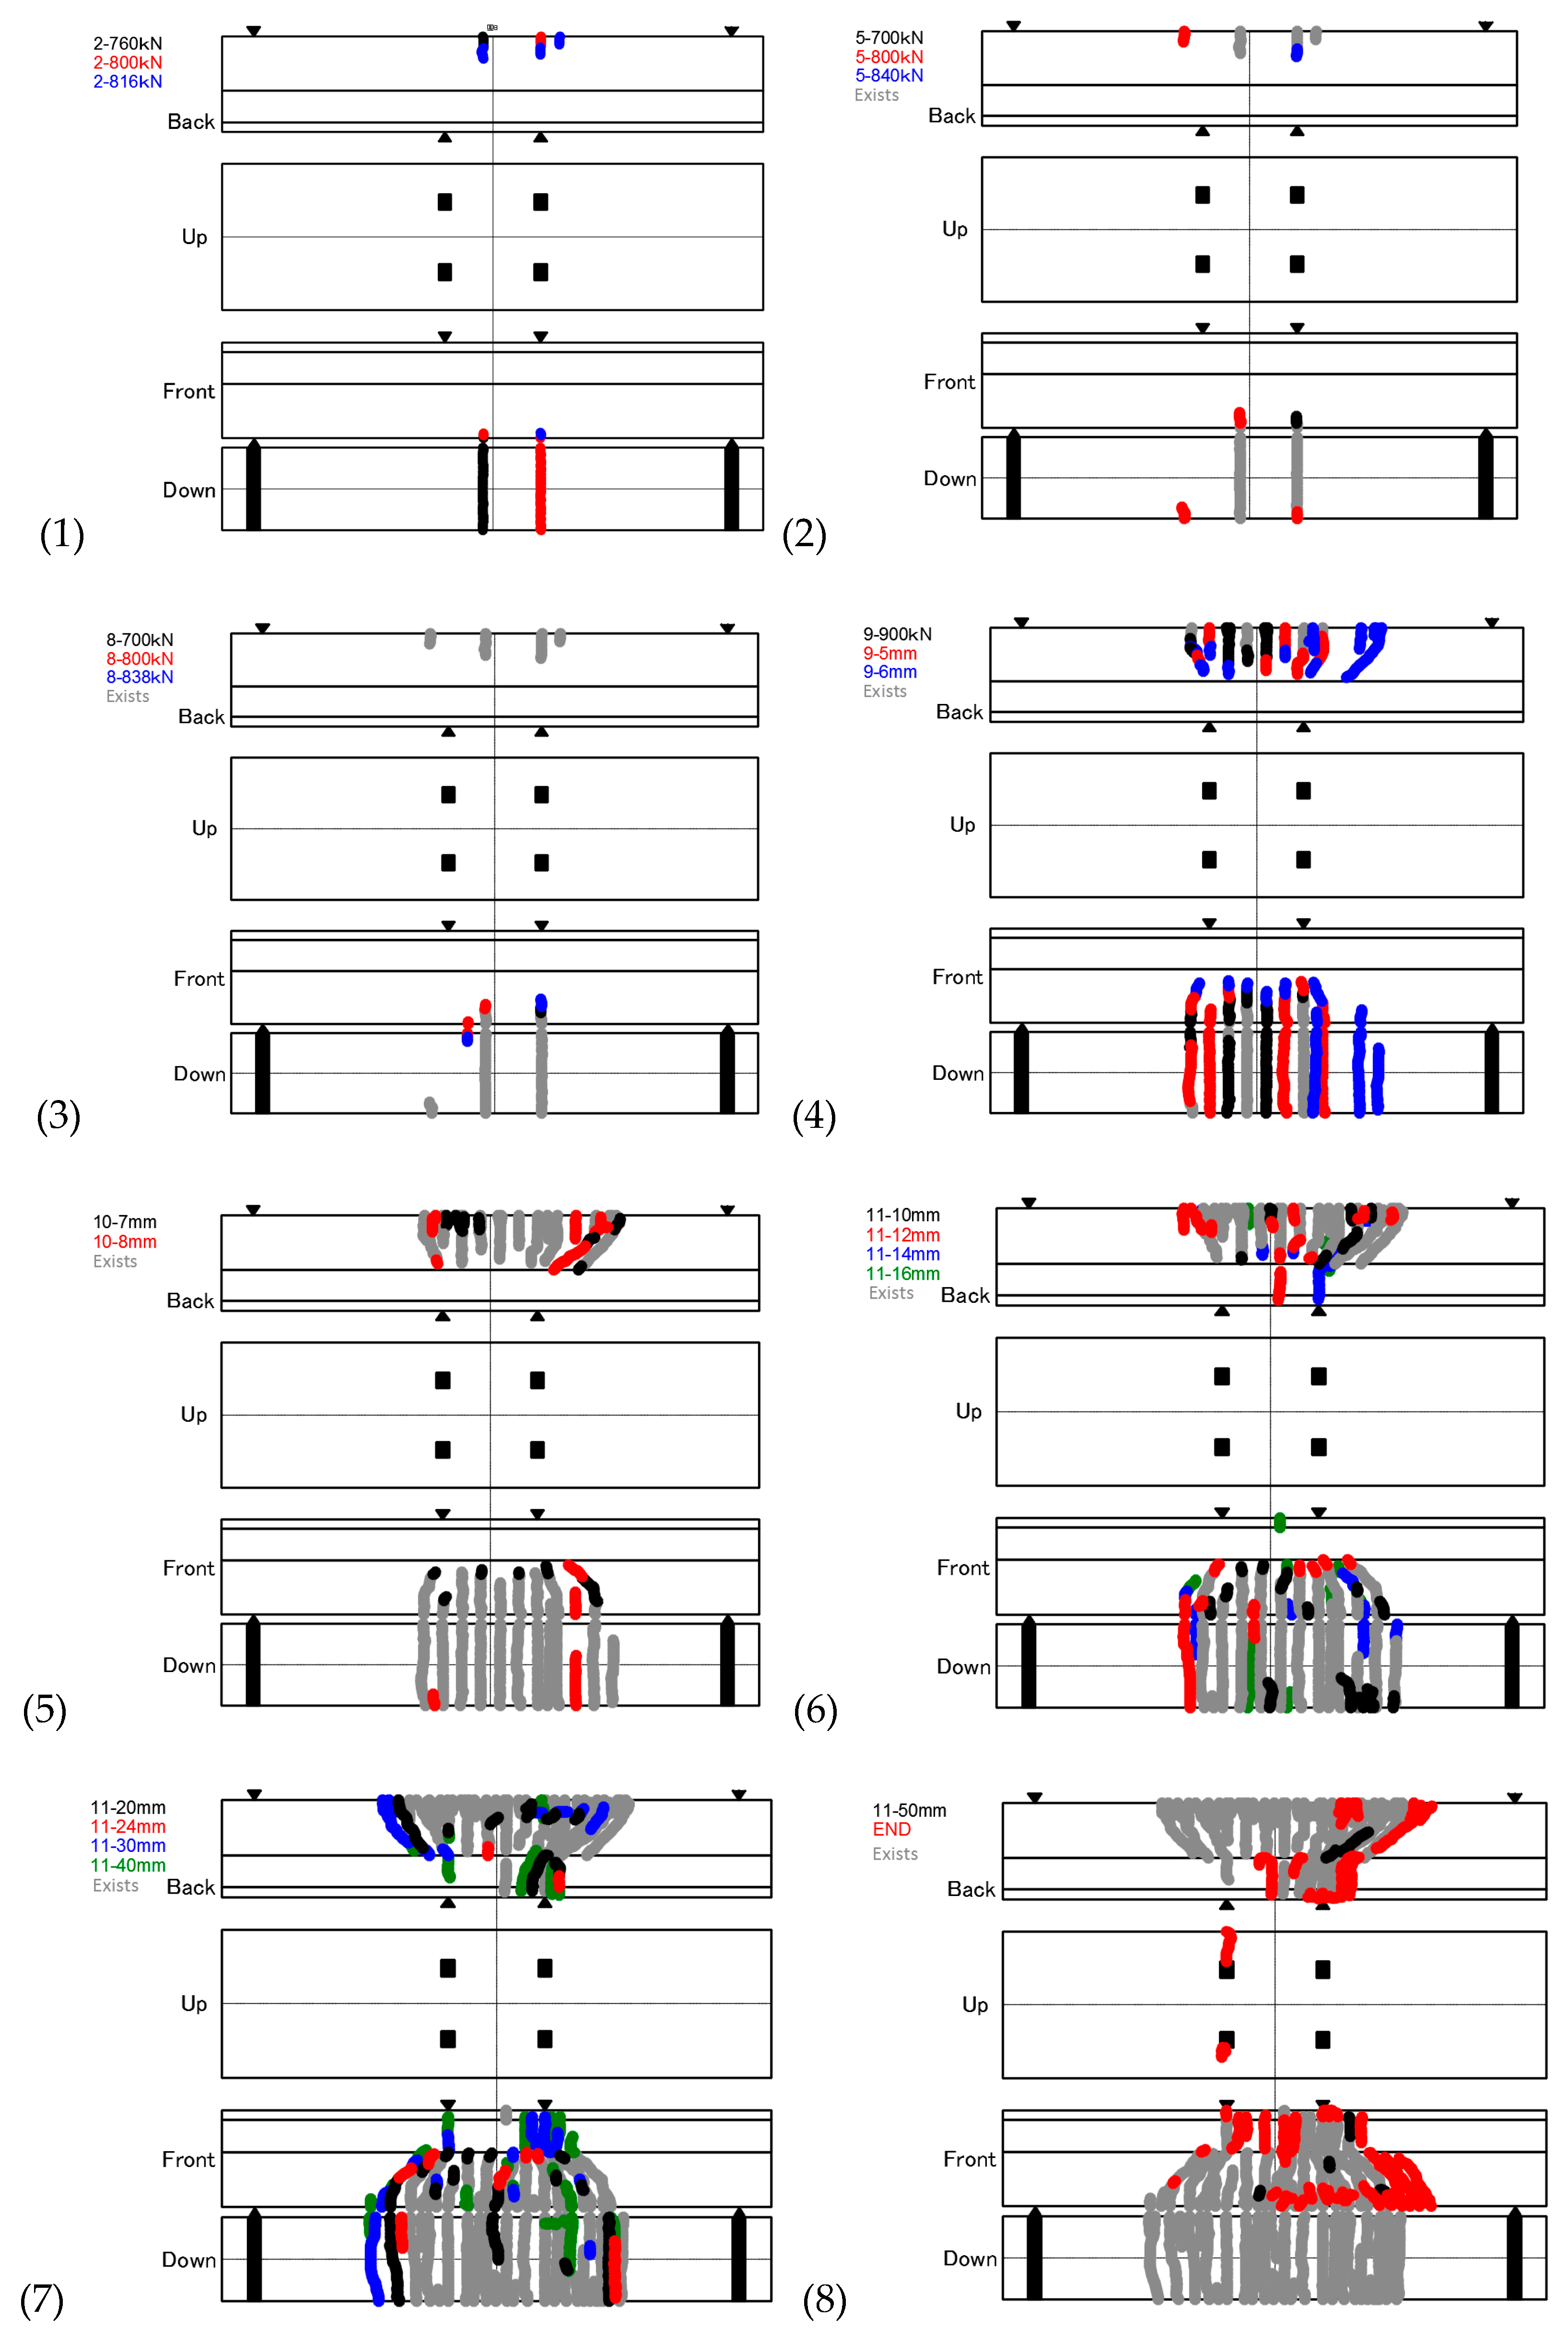
3.1. Introduction to the Experimental Design and Process
3.2. Experimental Data Analysis
- Determinant of the status matrix (if it is a square matrix)Determinant can be treated as the scaling factor of the transformation from a status matrix.For a column (n), row (n) matrix, its determinant can be defined by the Leibniz formula or the Laplace formula. Here in this paper, we use the Leibniz formula [41]:Here, all permutations δ are calculated as a summation of the set {1,2,3,…,n}.
- Norm of the status matrix; the matrix norm extends the notion from vector norm to the matrix. For a matrix, when it meets these conditions, it can have the matrix norm:The calculation of status matrix norm is thus .In this research, we use the 2-order norm (Euclidean norm):; where M* is the conjugate transpose of M.
- Max eigen or spectral radius of the status matrix, spectral radius: SR(M) = max(|λi|).
- 2D correlation coefficient (2D-CC) between every considered status matrix and initial status matrix.The 2D-CC is usually used to distinguish the status matrix change between the initial state (reference) and the state considered (test) in this research. The definition of this technology is as follows:where and ; means the expectation of all data in this matrix (data at every row and column).
- Distance between every considered status matrix and initial status matrixThere are many methods to get the distance between two status matrices; here is an example:where Mi,j means the data in the matrix of row i and column j.
- Procrustes analysis between every considered status matrix and initial status matrix
- 1)
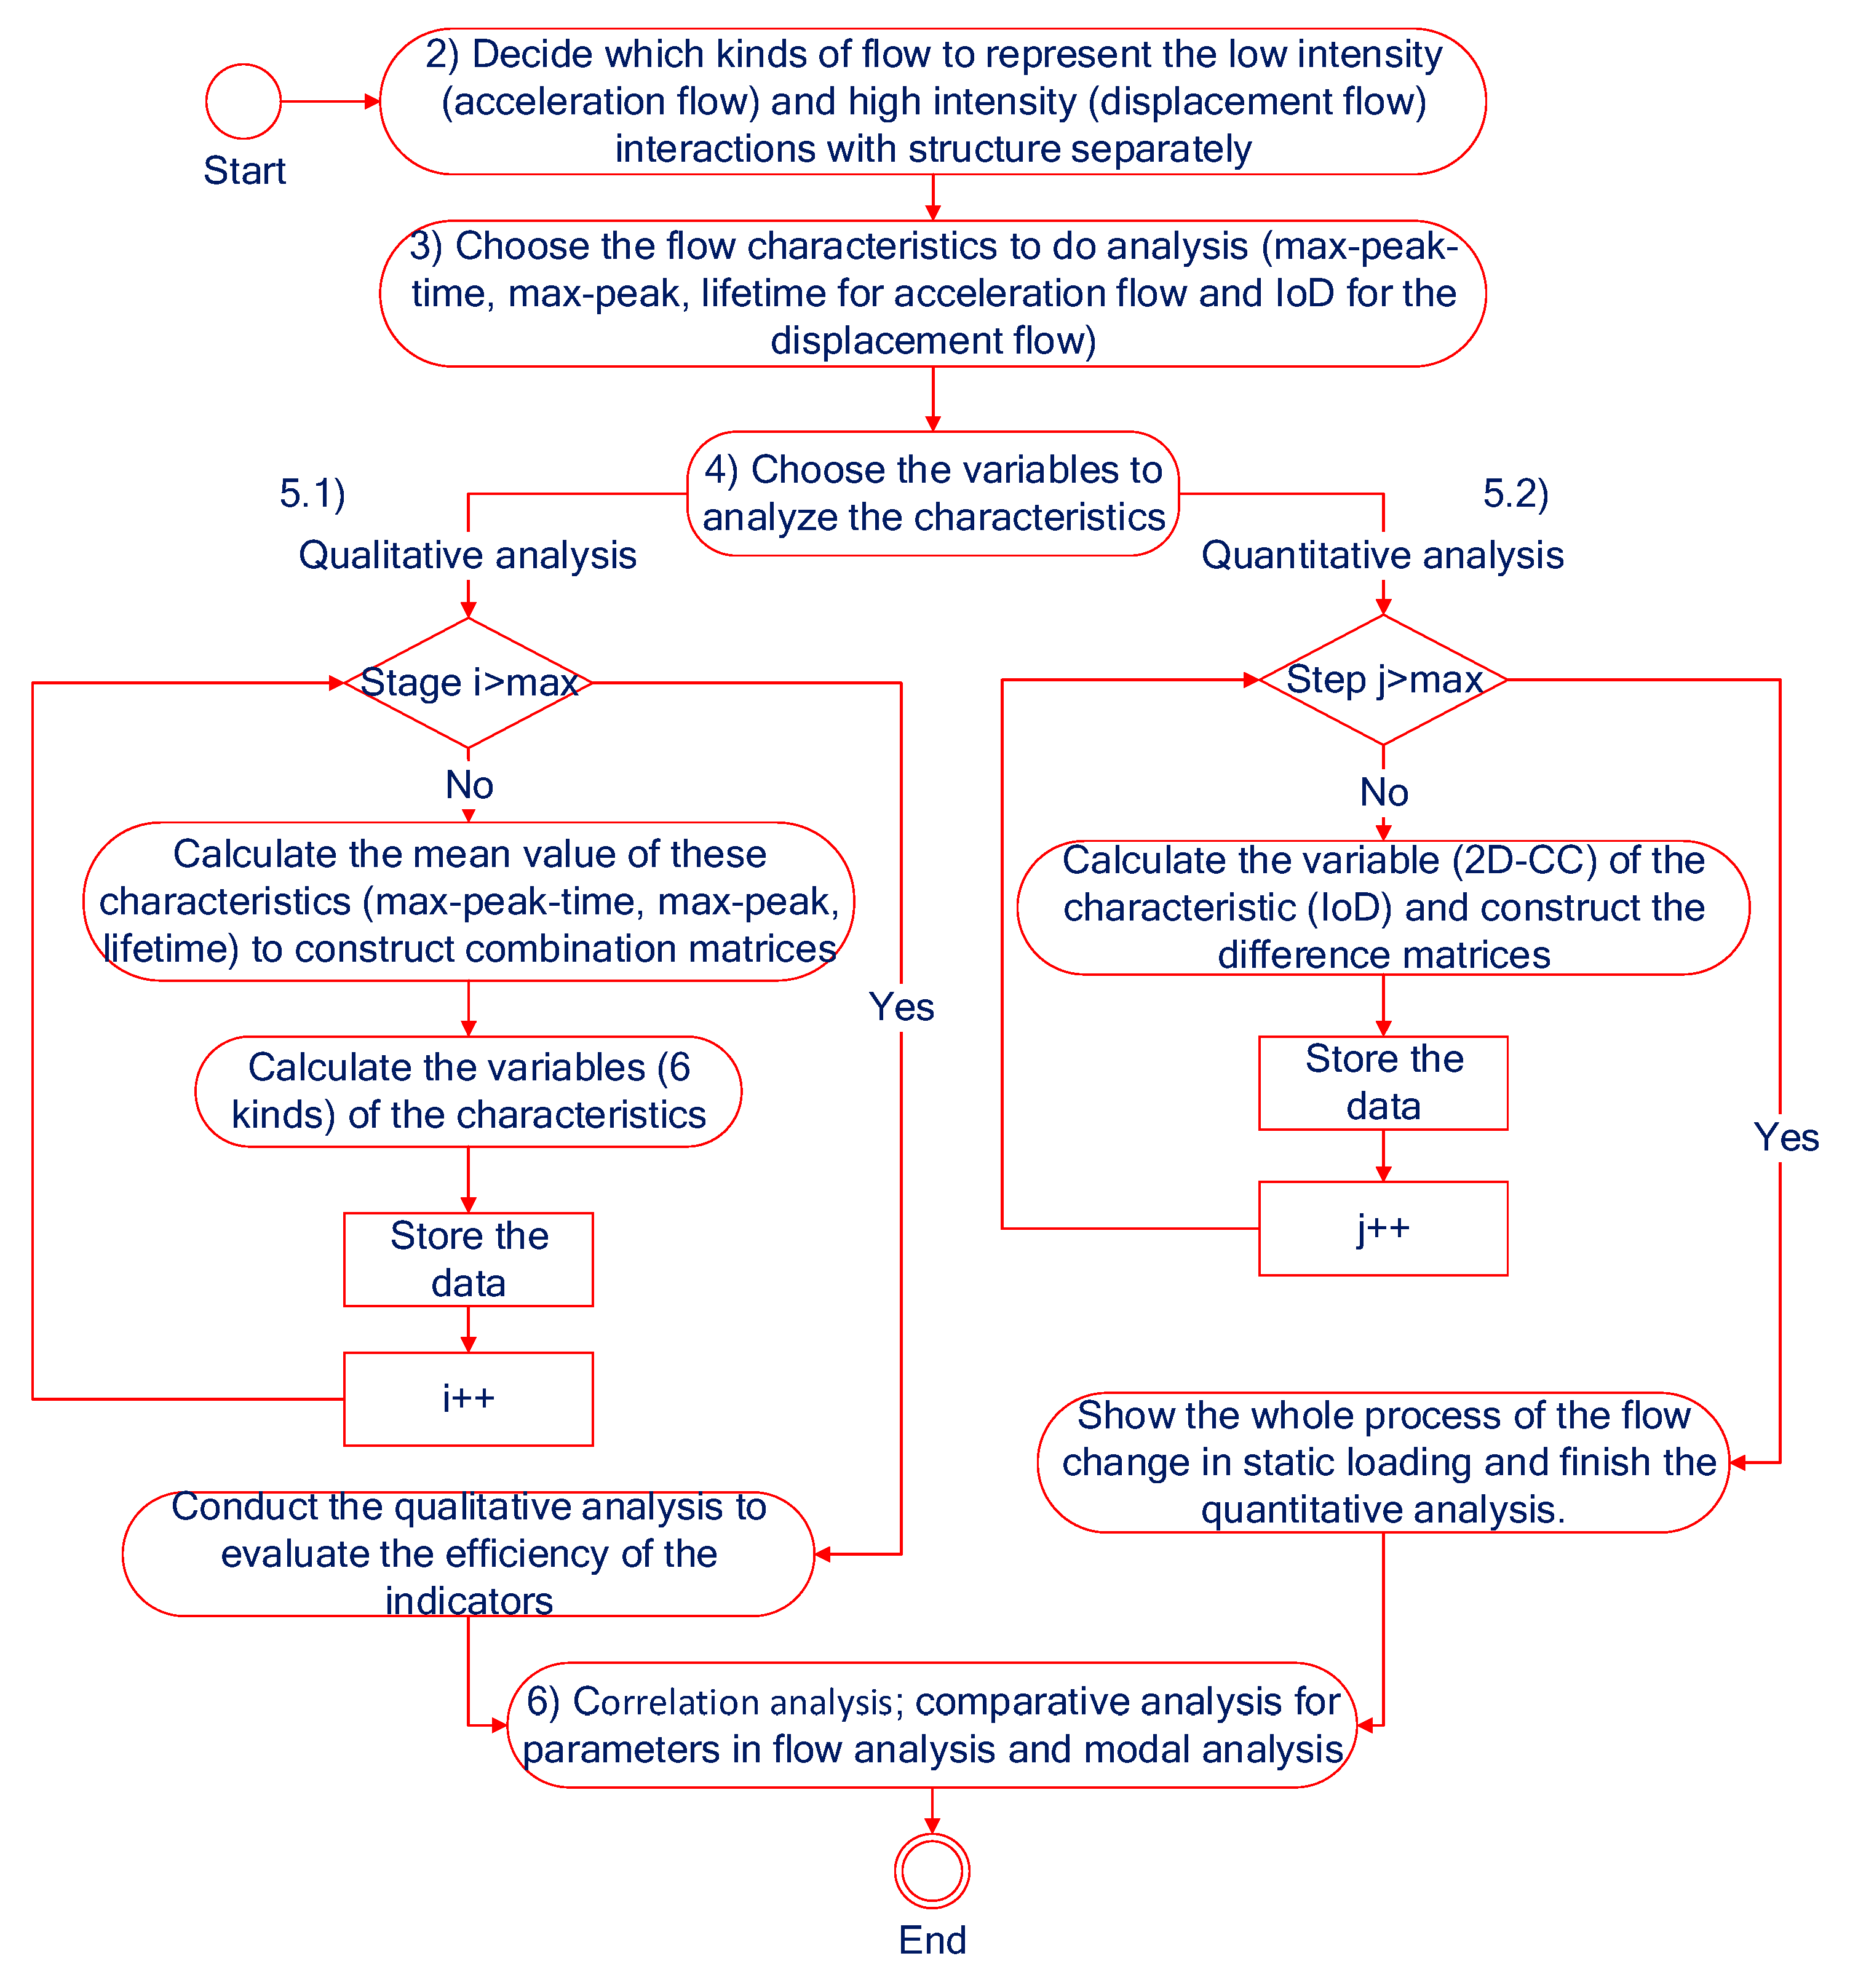
- Start of the data analysis.
- 2)
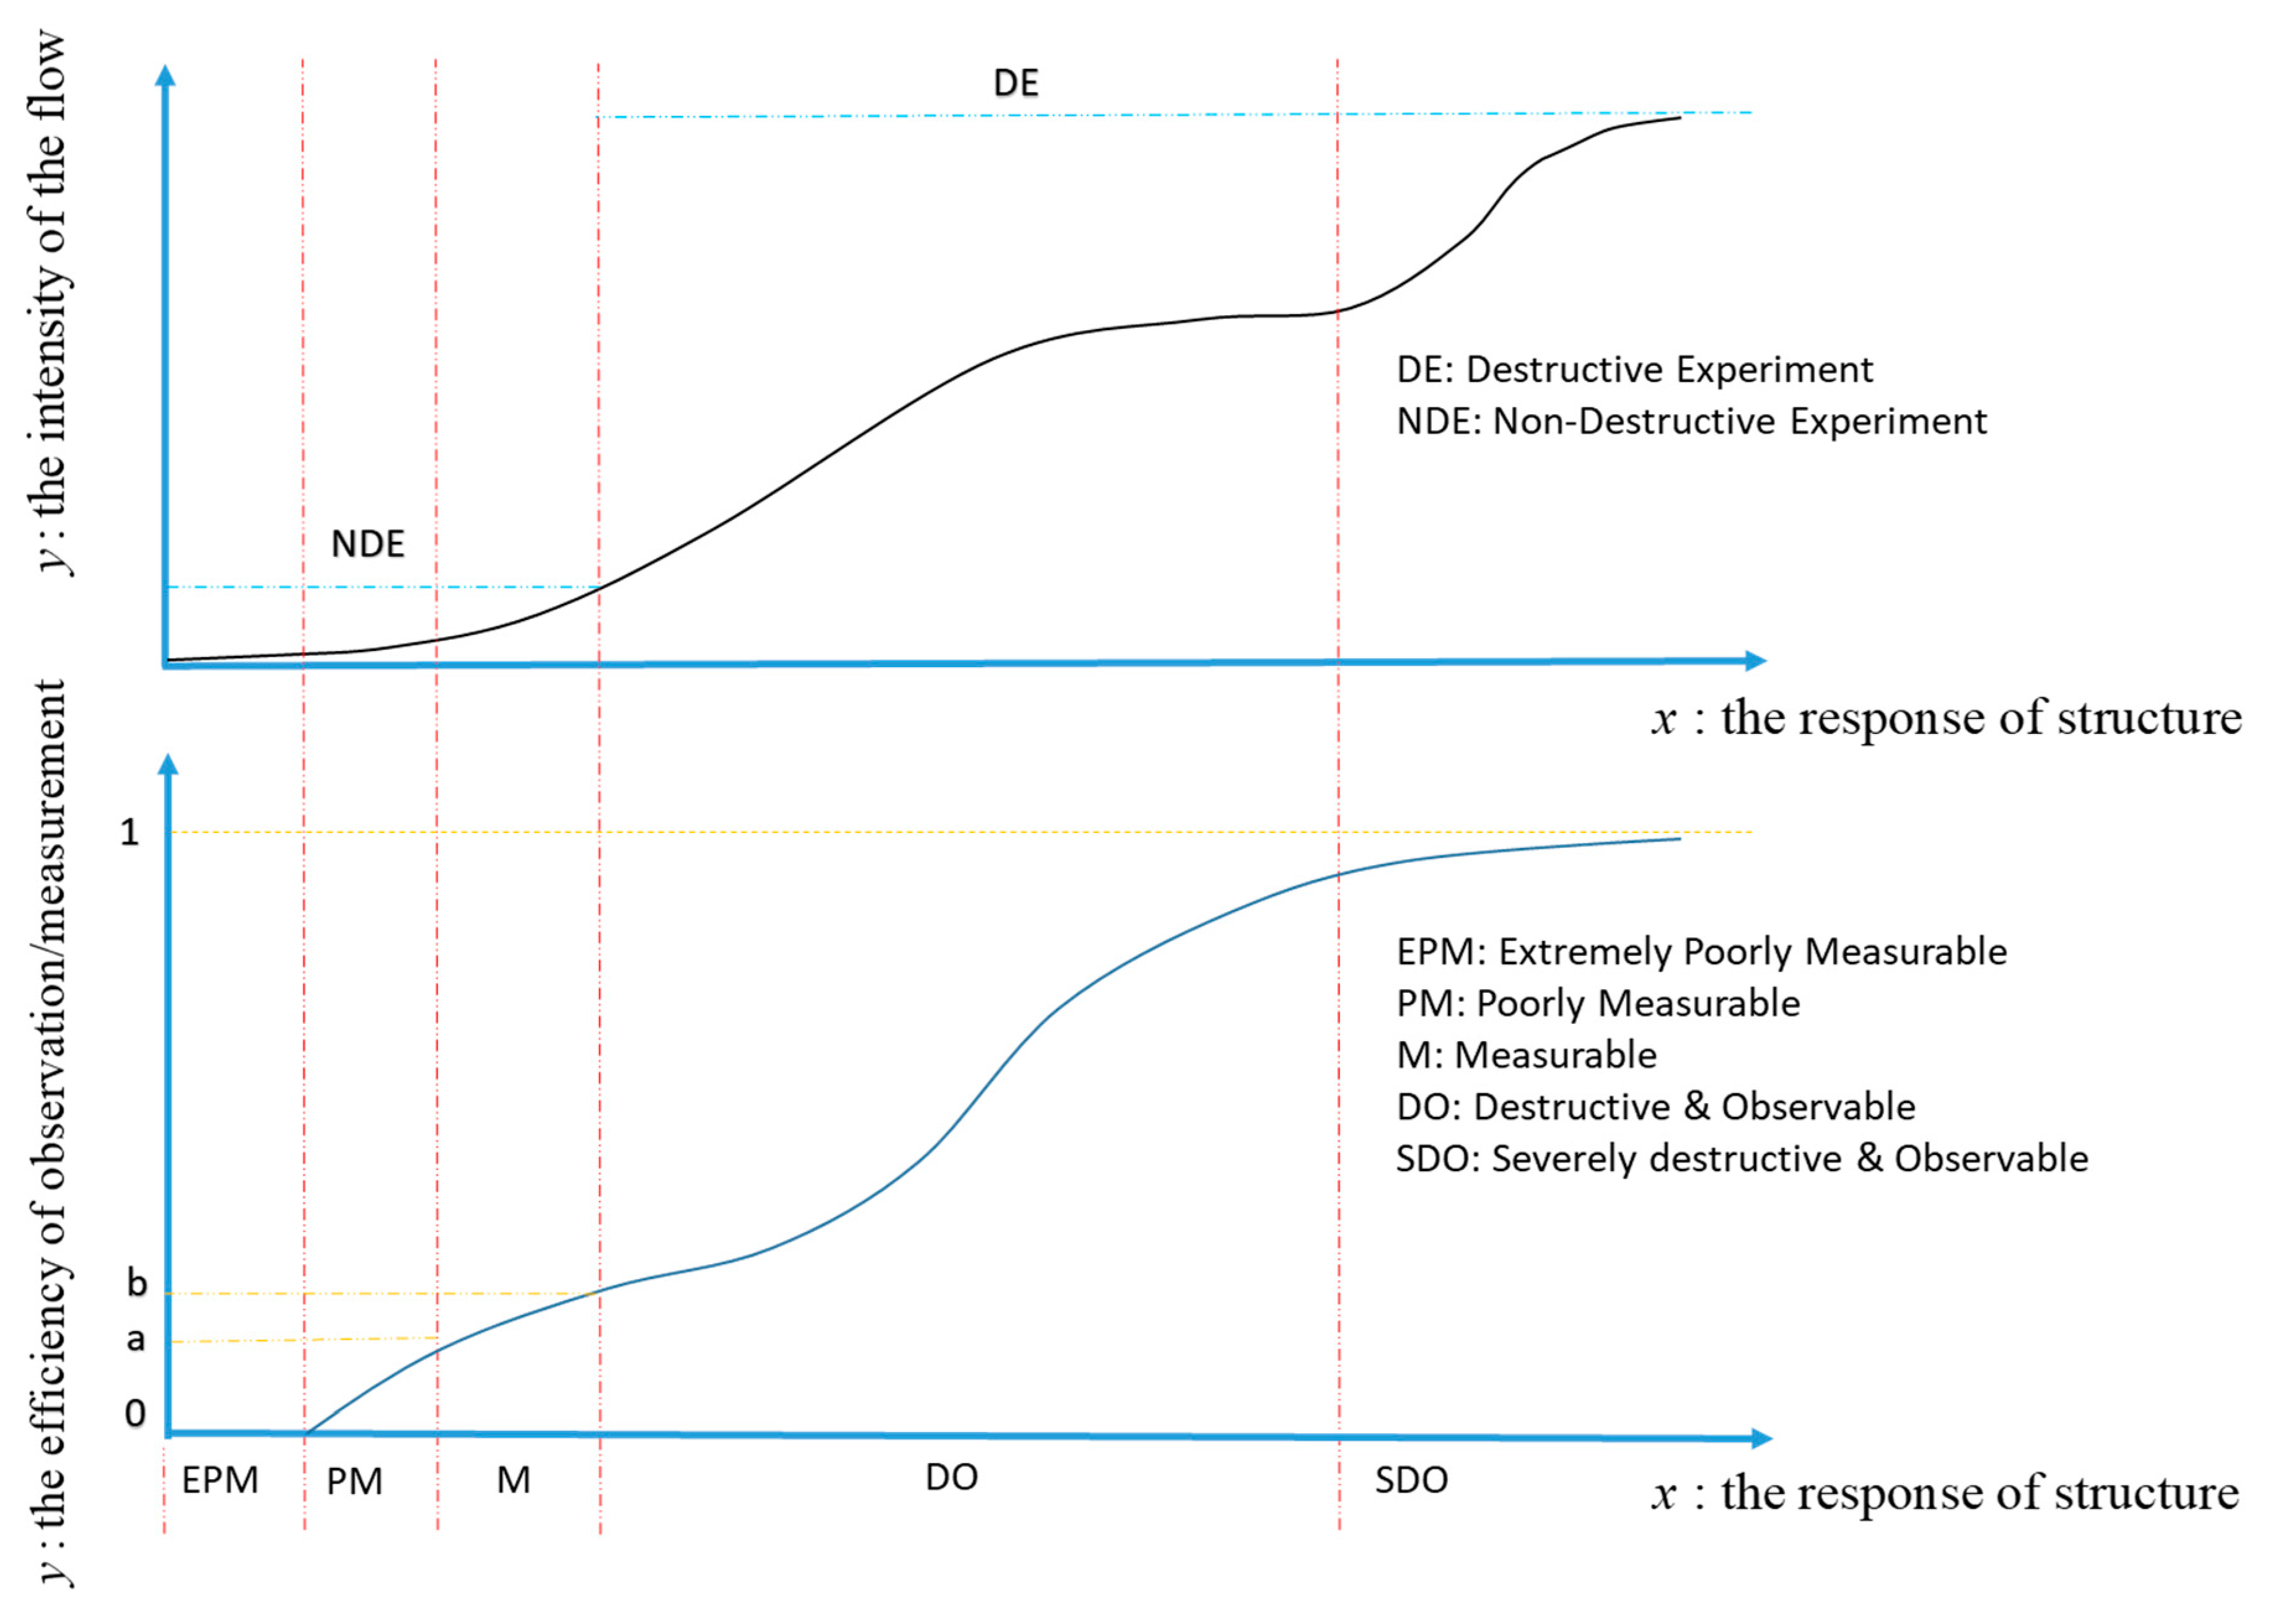
- Choose the flows to analyze (in this paper, we choose the displacement flow to represent the flow of high intensity and the acceleration flow to represent the flow of low intensity, respectively).
- 3)
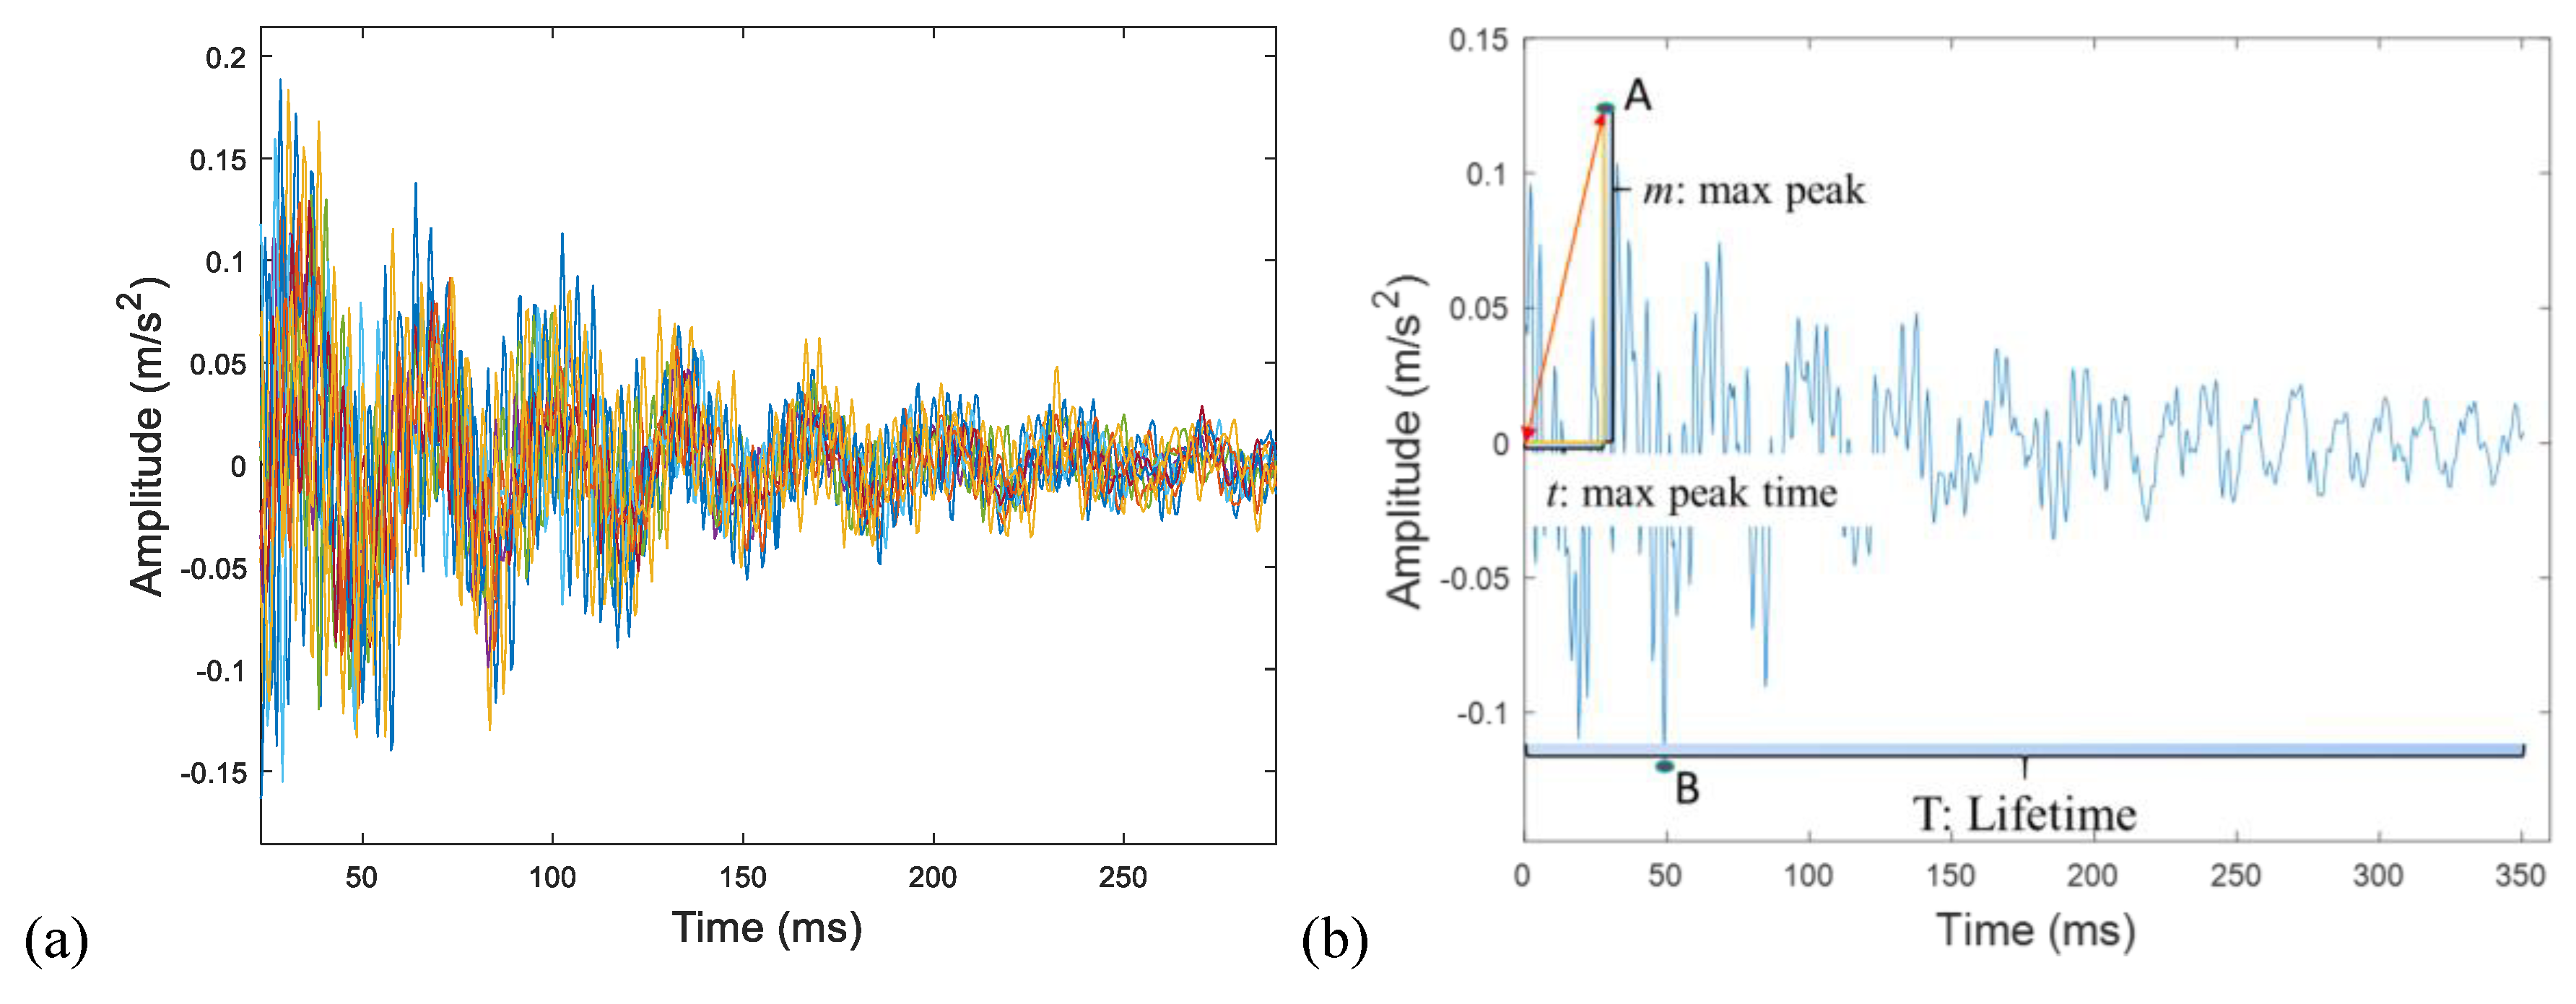
- Choose the flow characteristics (max-peak-time from class 1, max-peak from class 3, and lifetime from class 4 are chosen for acceleration flow, and IoD from class 3 is chosen for displacement flow).
- 4)
- Choose the variables to represent the flow’s characteristic matrices (6 kinds of variables will be used in the analysis, in which “determinant, norm, max eigen, 2D correlation coefficient, distance, Procrustes” are for acceleration flow and “2D correlation coefficient” is for displacement flow).
- 5)
- Data analysis.
- 5.1)
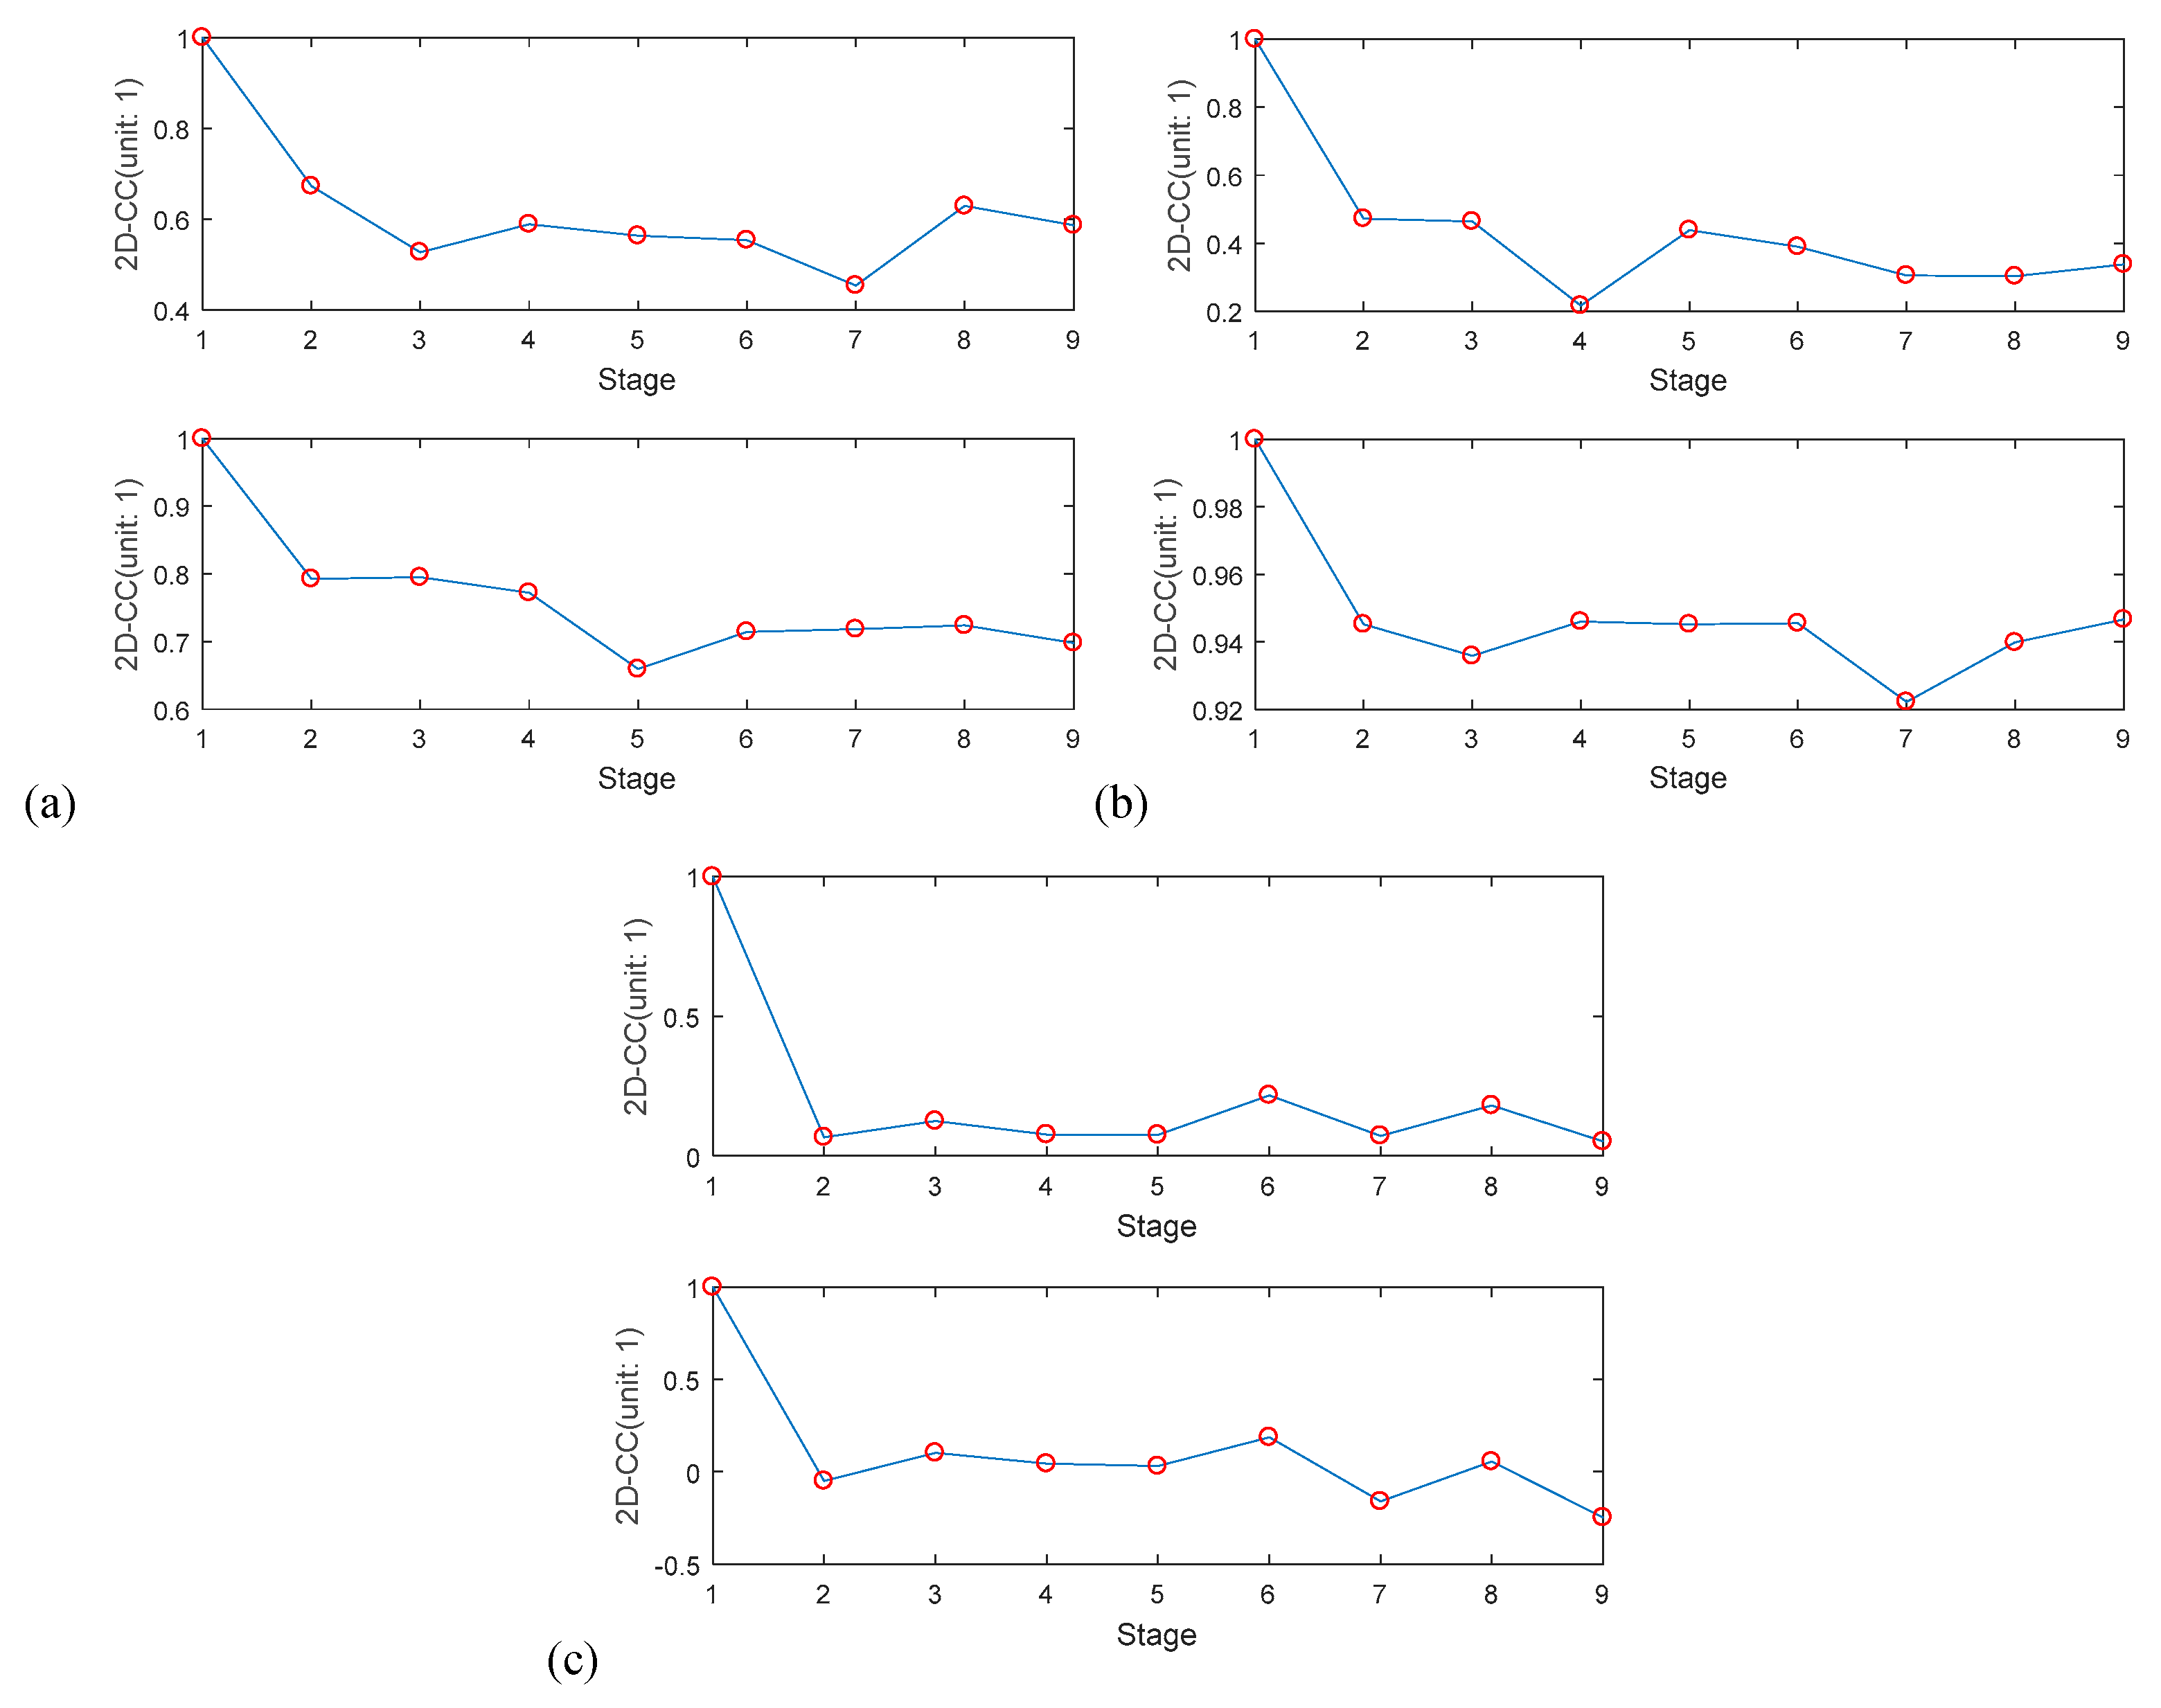
- Do the qualitative analysis for the acceleration flow. There are 9 stages (maximum amount = 9) in this data processing. Calculate the expectation of characteristics from the times recorded by different acceleration sensors. Construct the combination matrices. Calculate the variables to evaluate the characteristics. Conduct the qualitative analysis.
- 5.2)
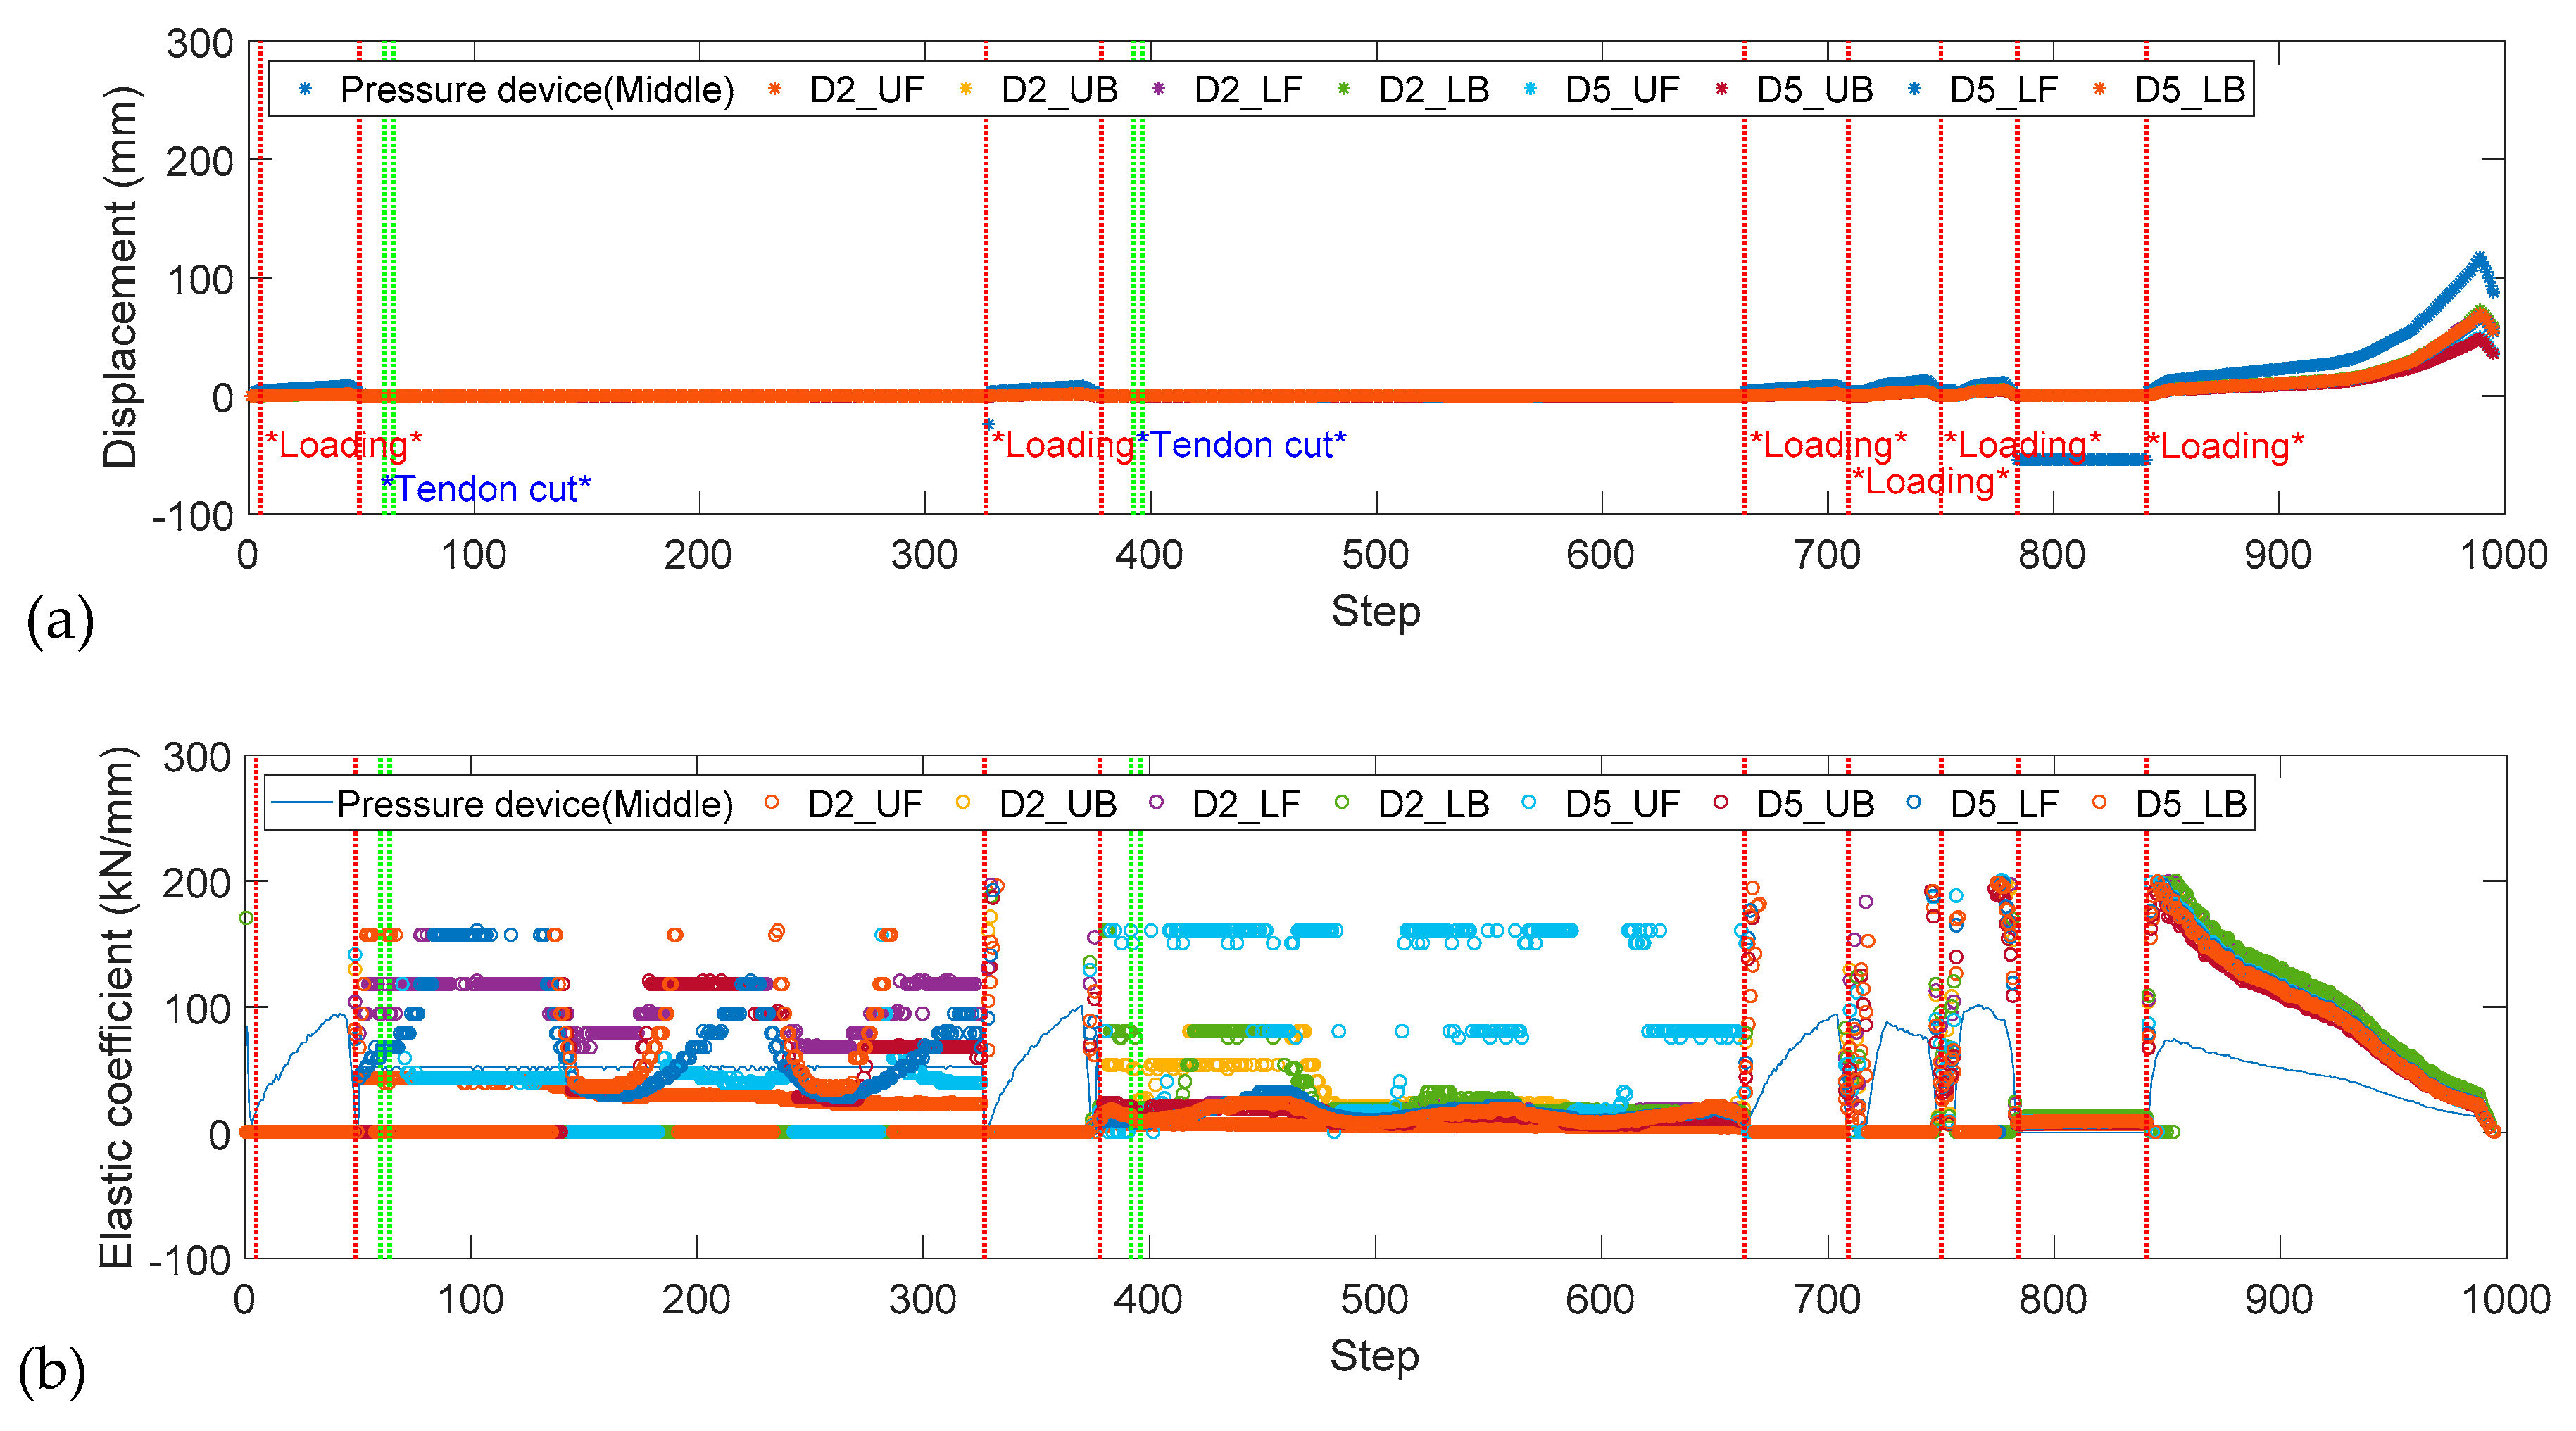
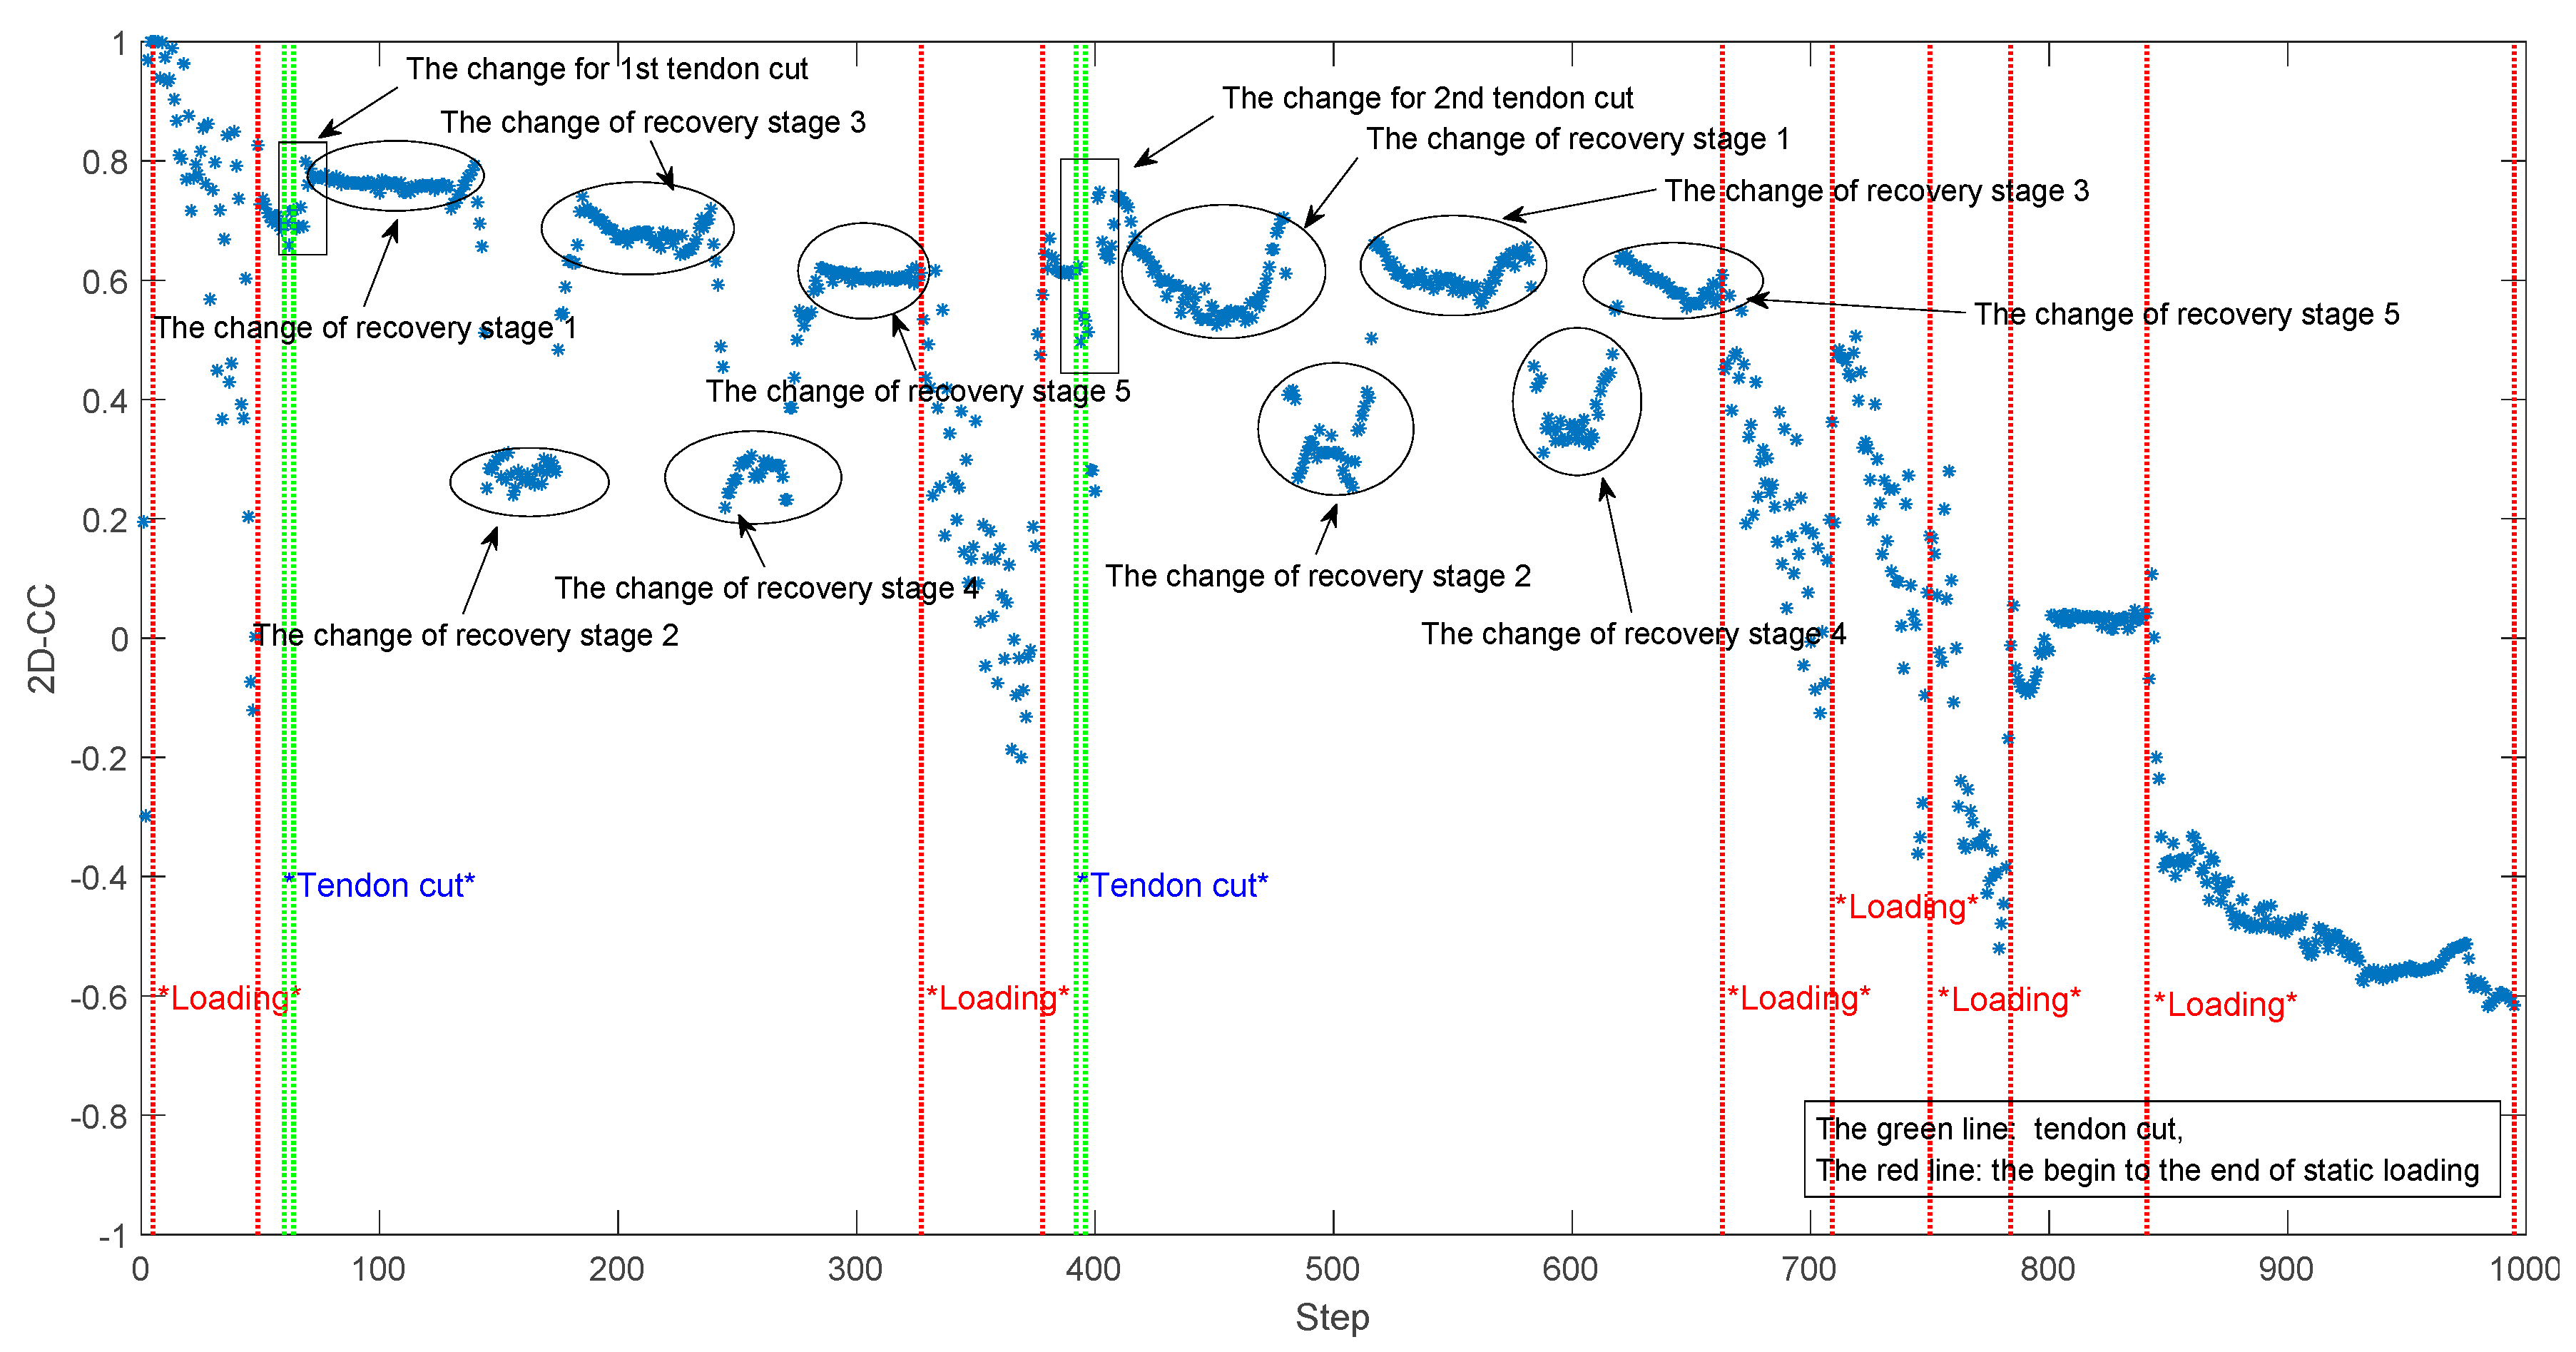
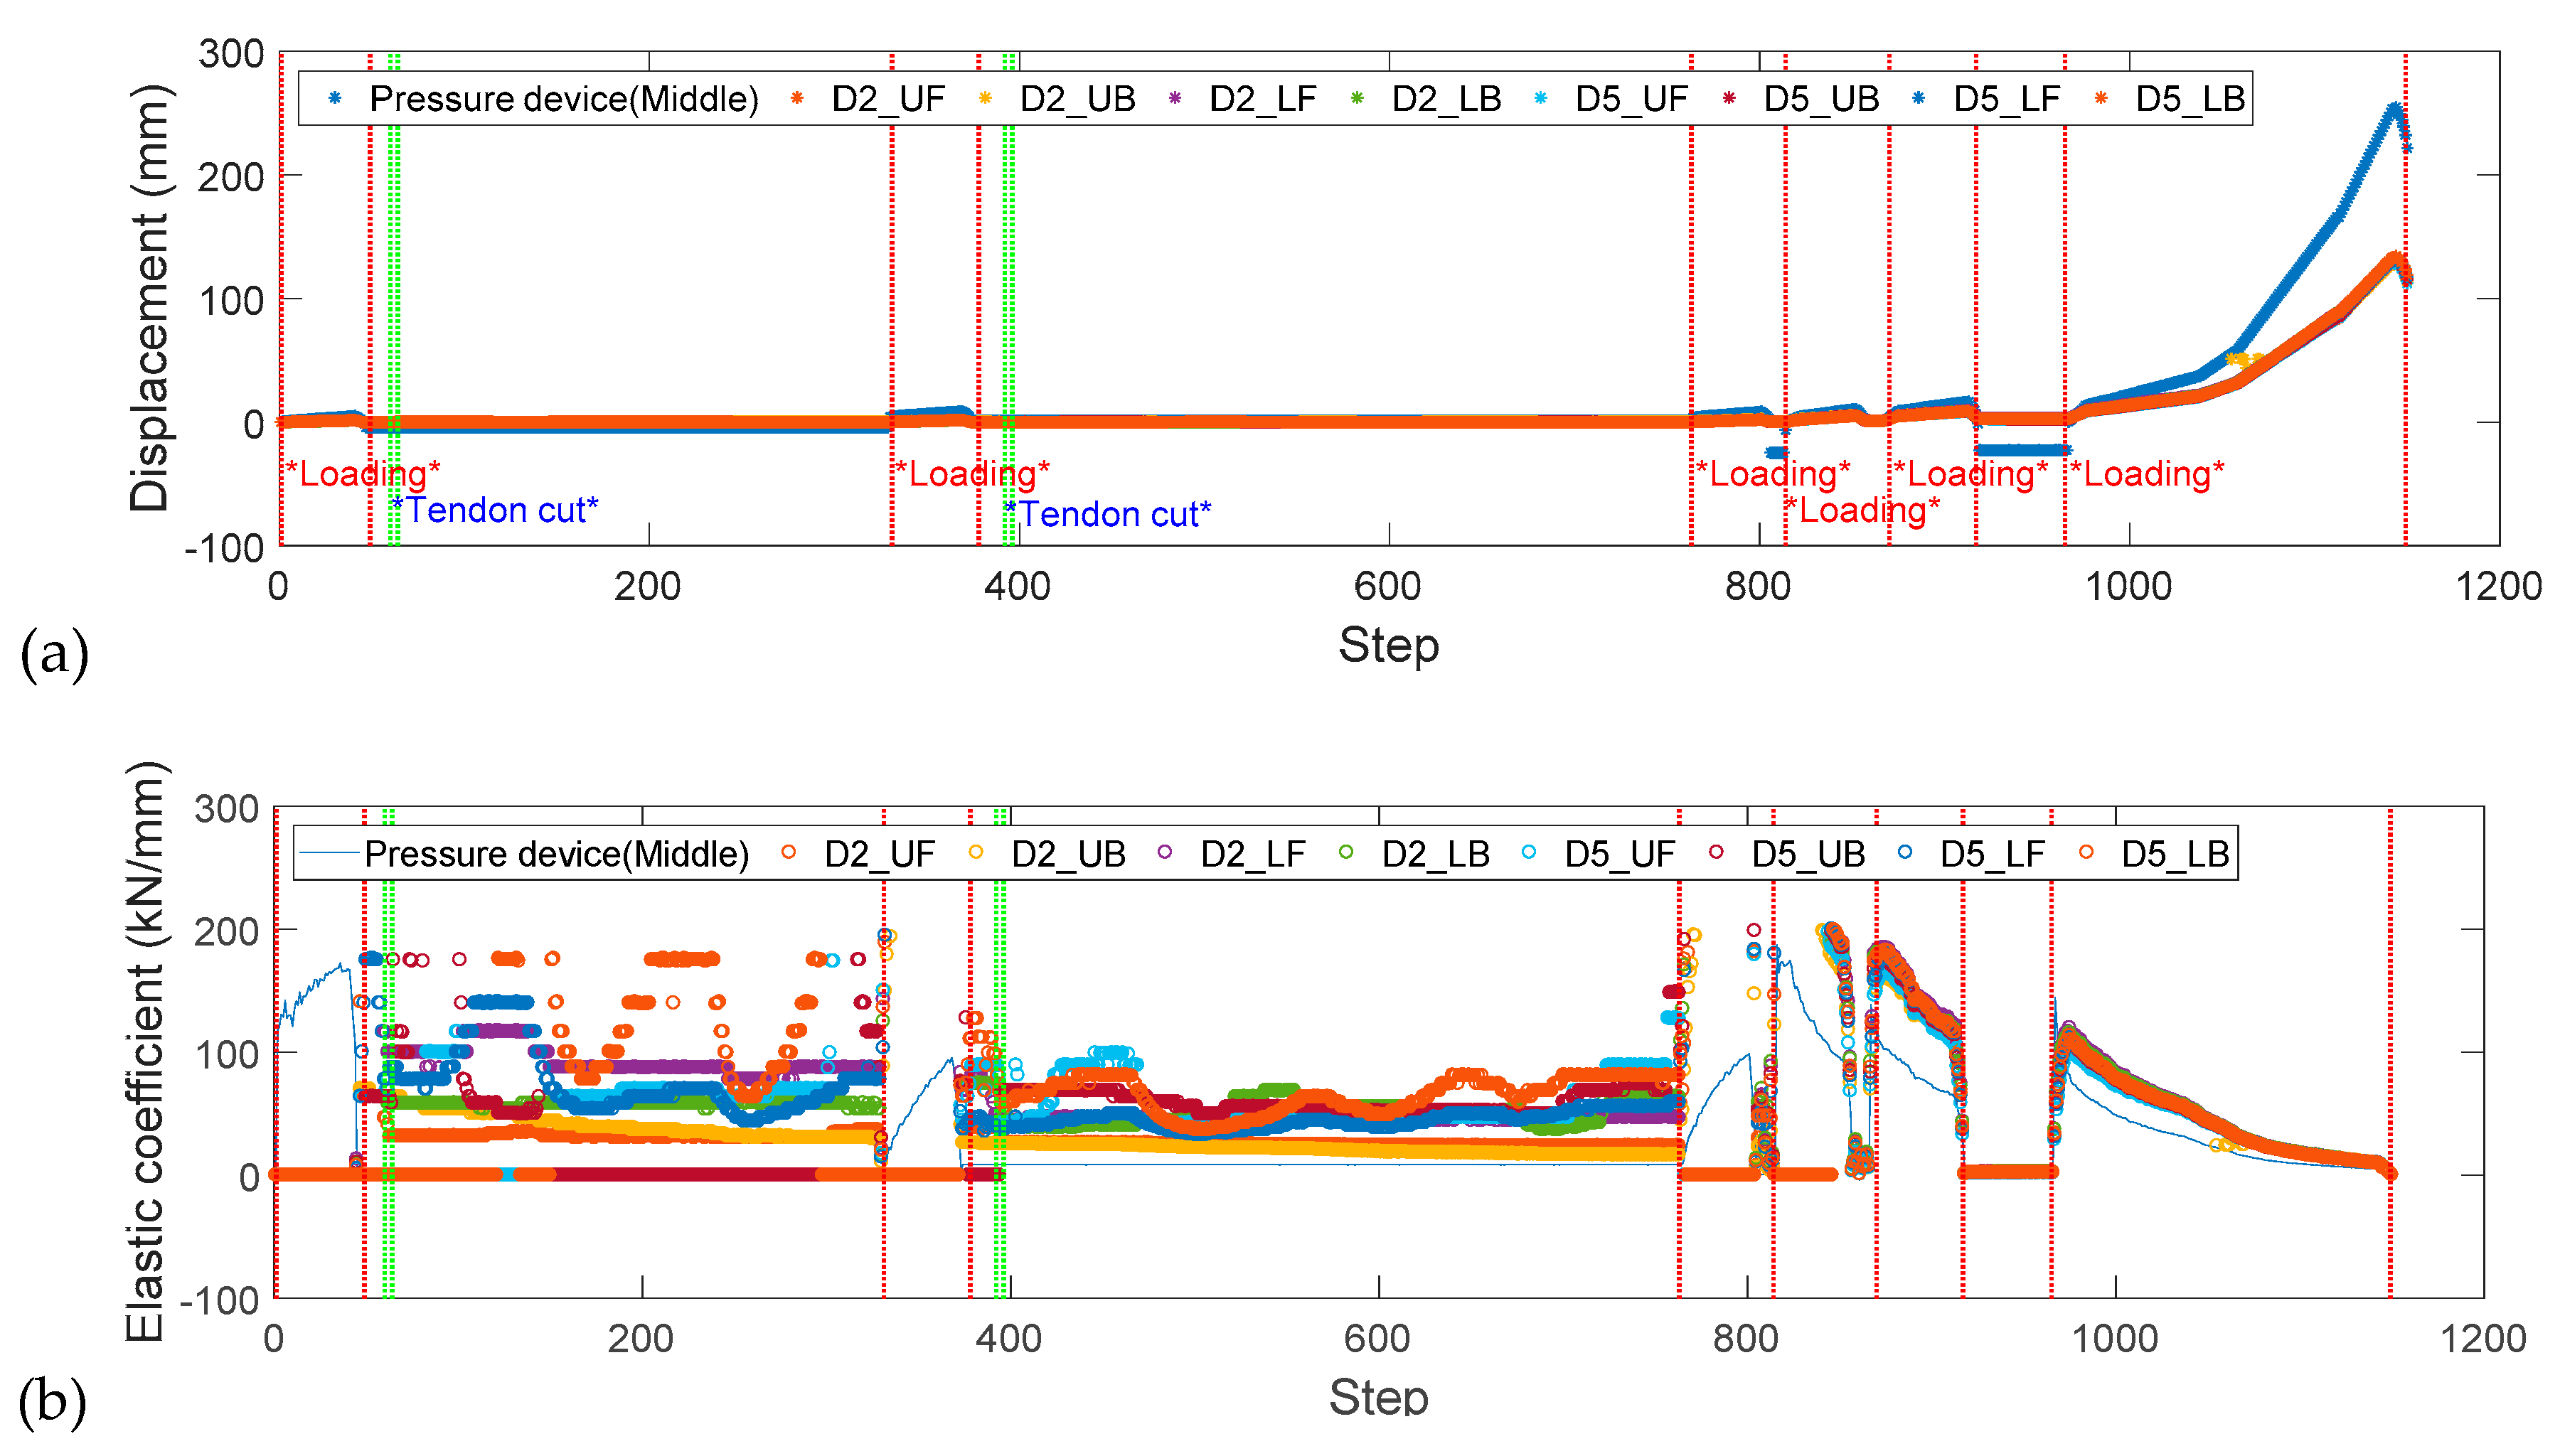
- Do the quantitative analysis for the displacement flow. There are 11 stages (maximum amount = 11), or more than 1000 steps in this data processing. Collect the data recorded by different acceleration sensors at the same moment as arrays (loading ID, step). Construct the difference matrices. Calculate the variable (2D-CC) to evaluate the characteristics. Conduct the quantitative analysis.
- 6)
- Conduct correlation analysis and comparative analysis with modal analysis.
- 6.1)
- Calculate the correlation coefficient and conduct the correlation analysis for kinds of flow characteristics.
- 6.2)
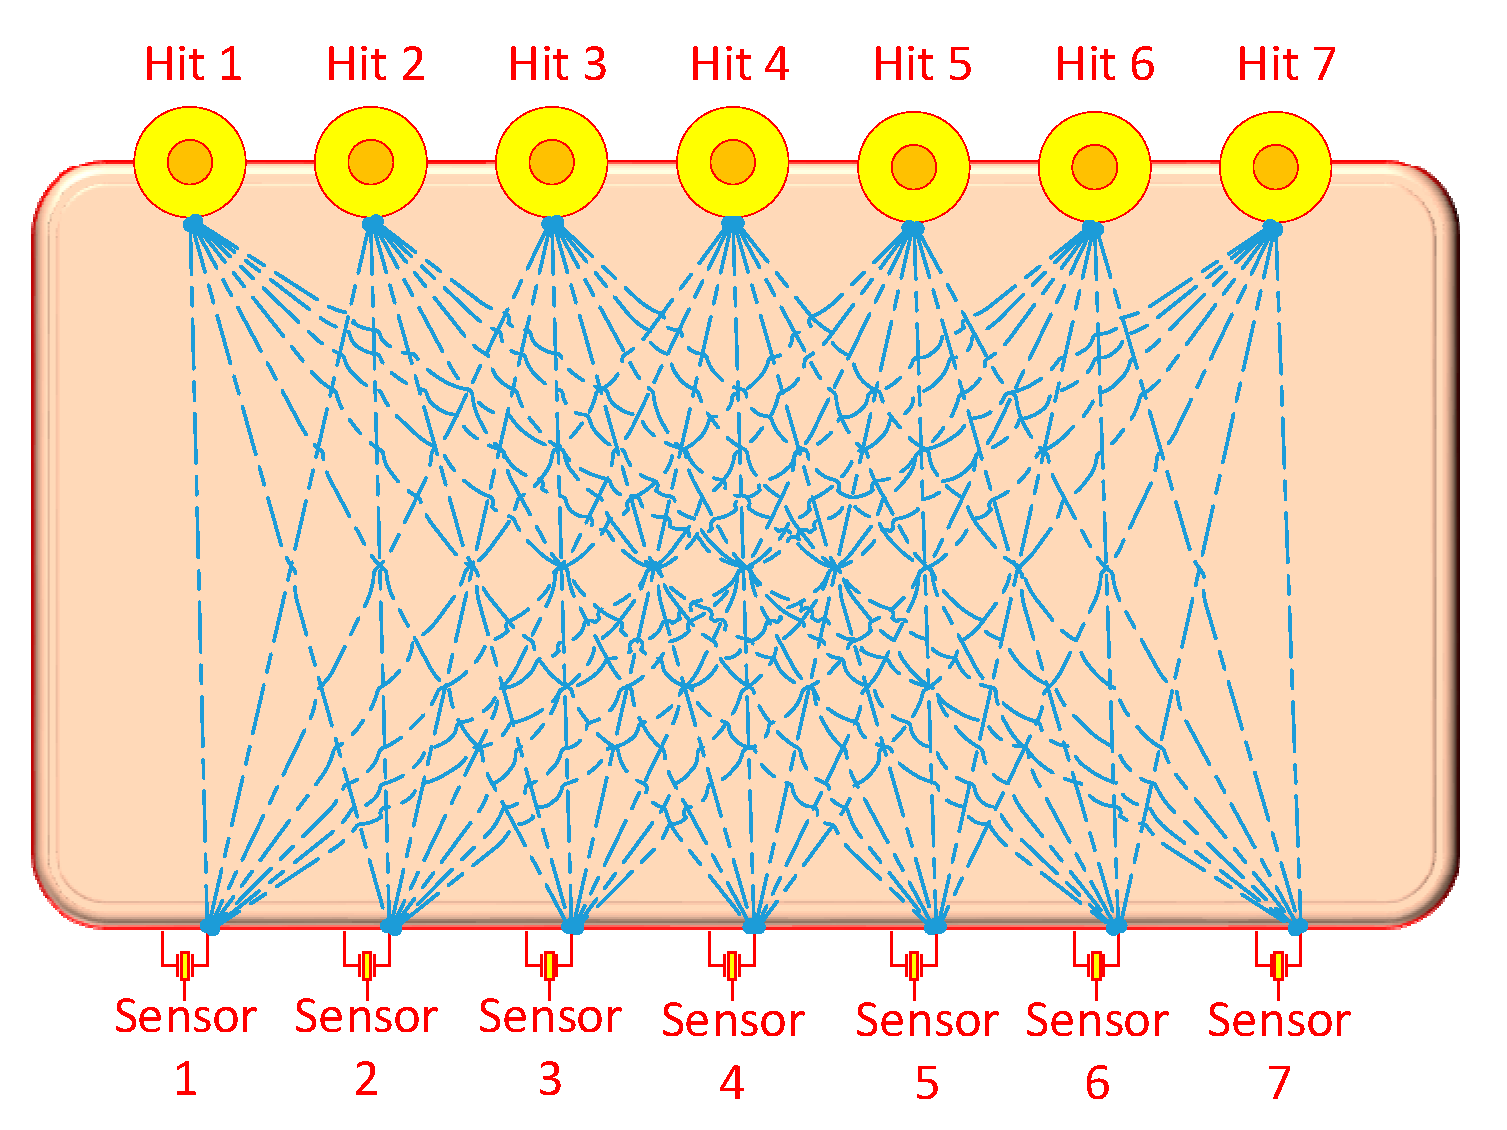
- Compare the (acceleration) flow characteristics with the structural characteristics in modal analysis. These characteristics of both flow and structure all are using the same original data.
- 7)
- End of the data analysis.
4. Results and Discussions
4.1. Calculation Method of Variables for Characteristics Matrices
4.2. Quantitative Study of the Displacement Flow
4.3. Qualitative Study of the Acceleration Flow
4.4. Comprehension between Flow Characteristics and Structural Dynamic Characteristics
- Once the crack has emerged, it will not disappear, and the depth and length will not shrink.
- The redistribution of internal forces will change the strengths of associations among substructures as well as the width of cracks.
- In statics, the energy dissipation is depending on the length of the route that the flow goes.
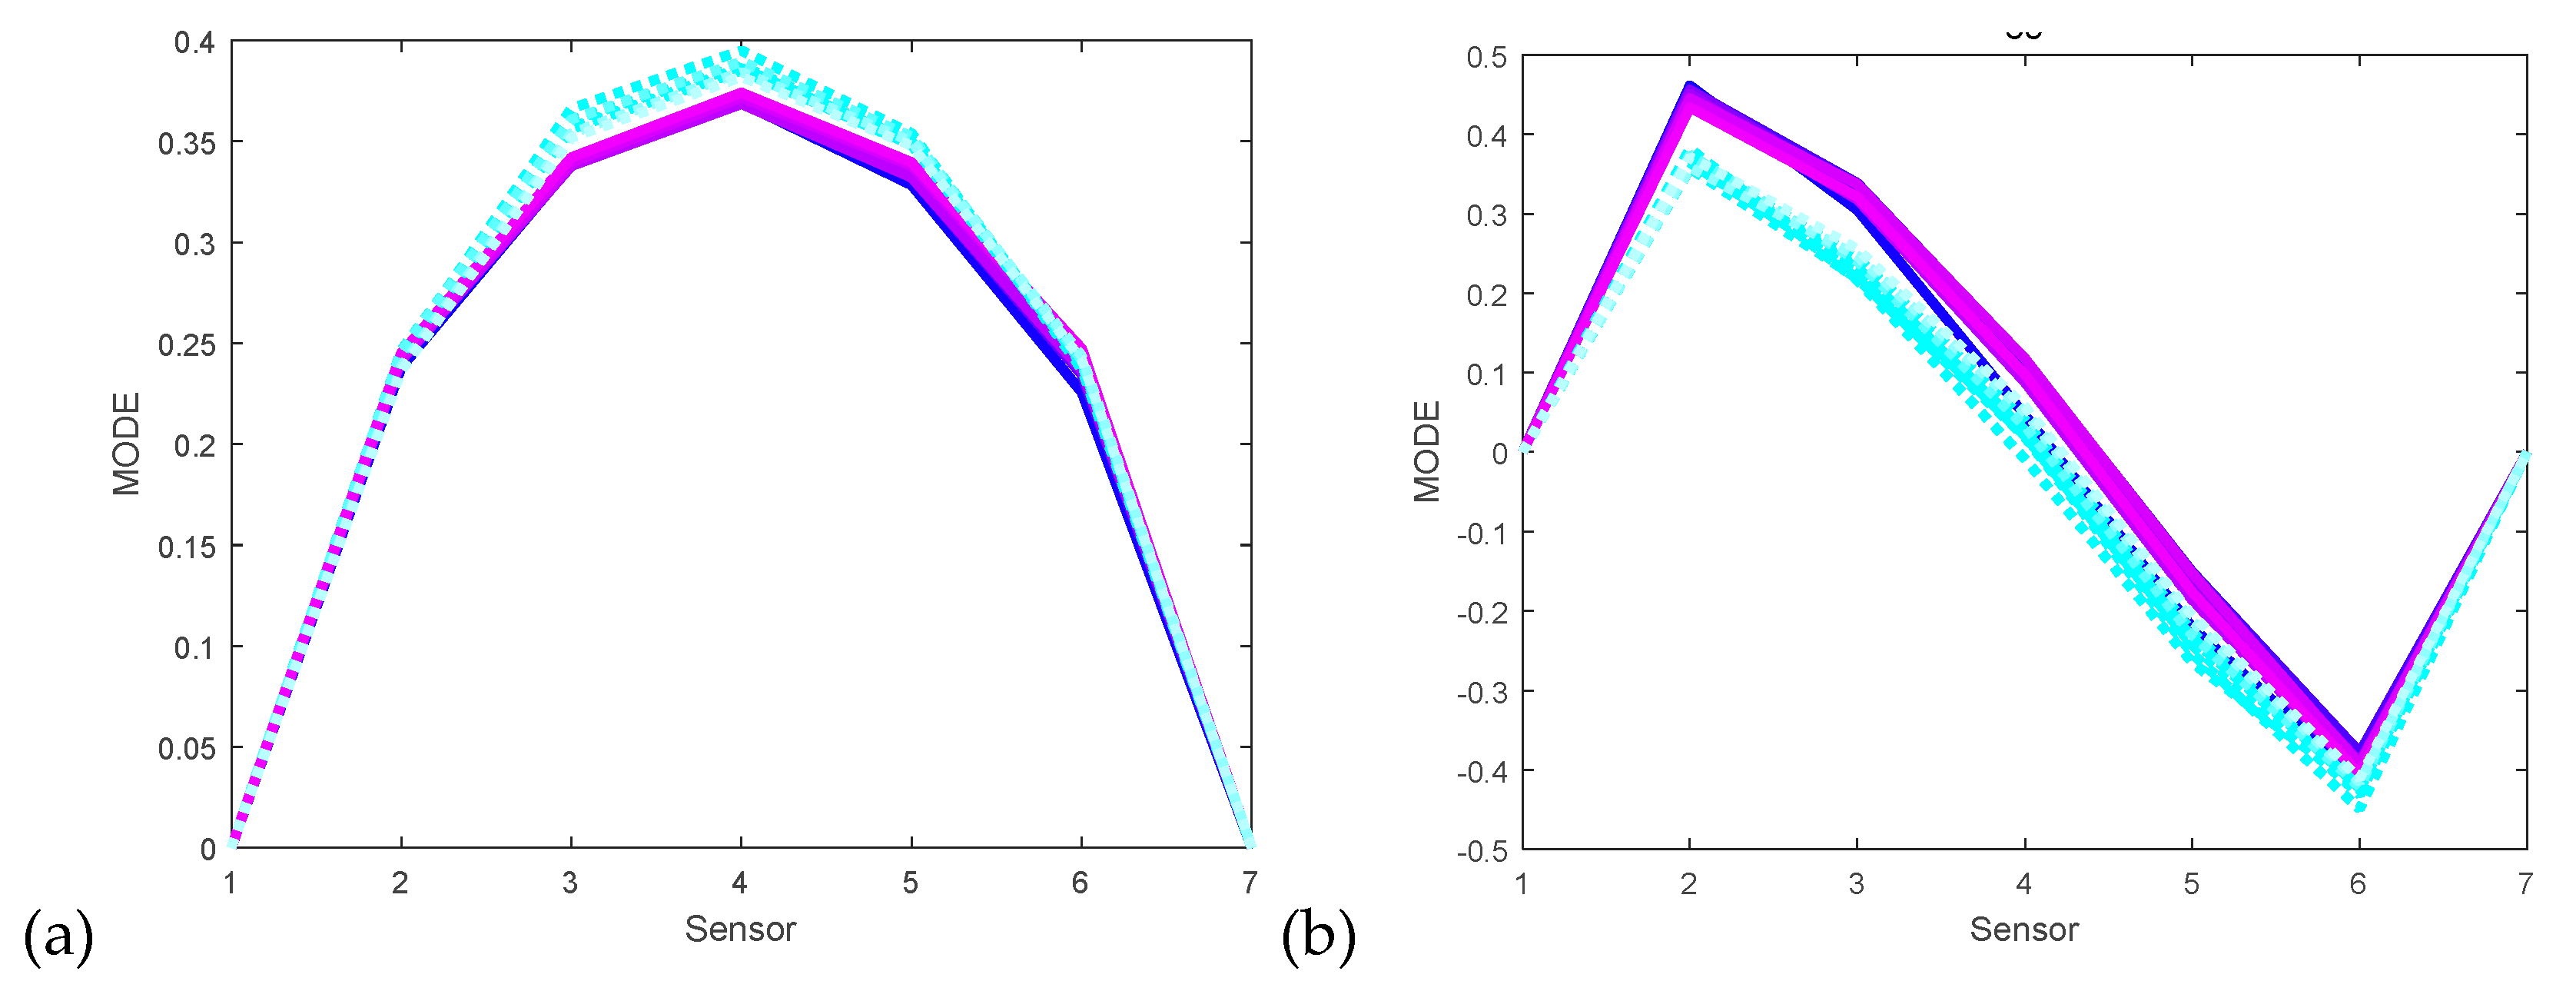
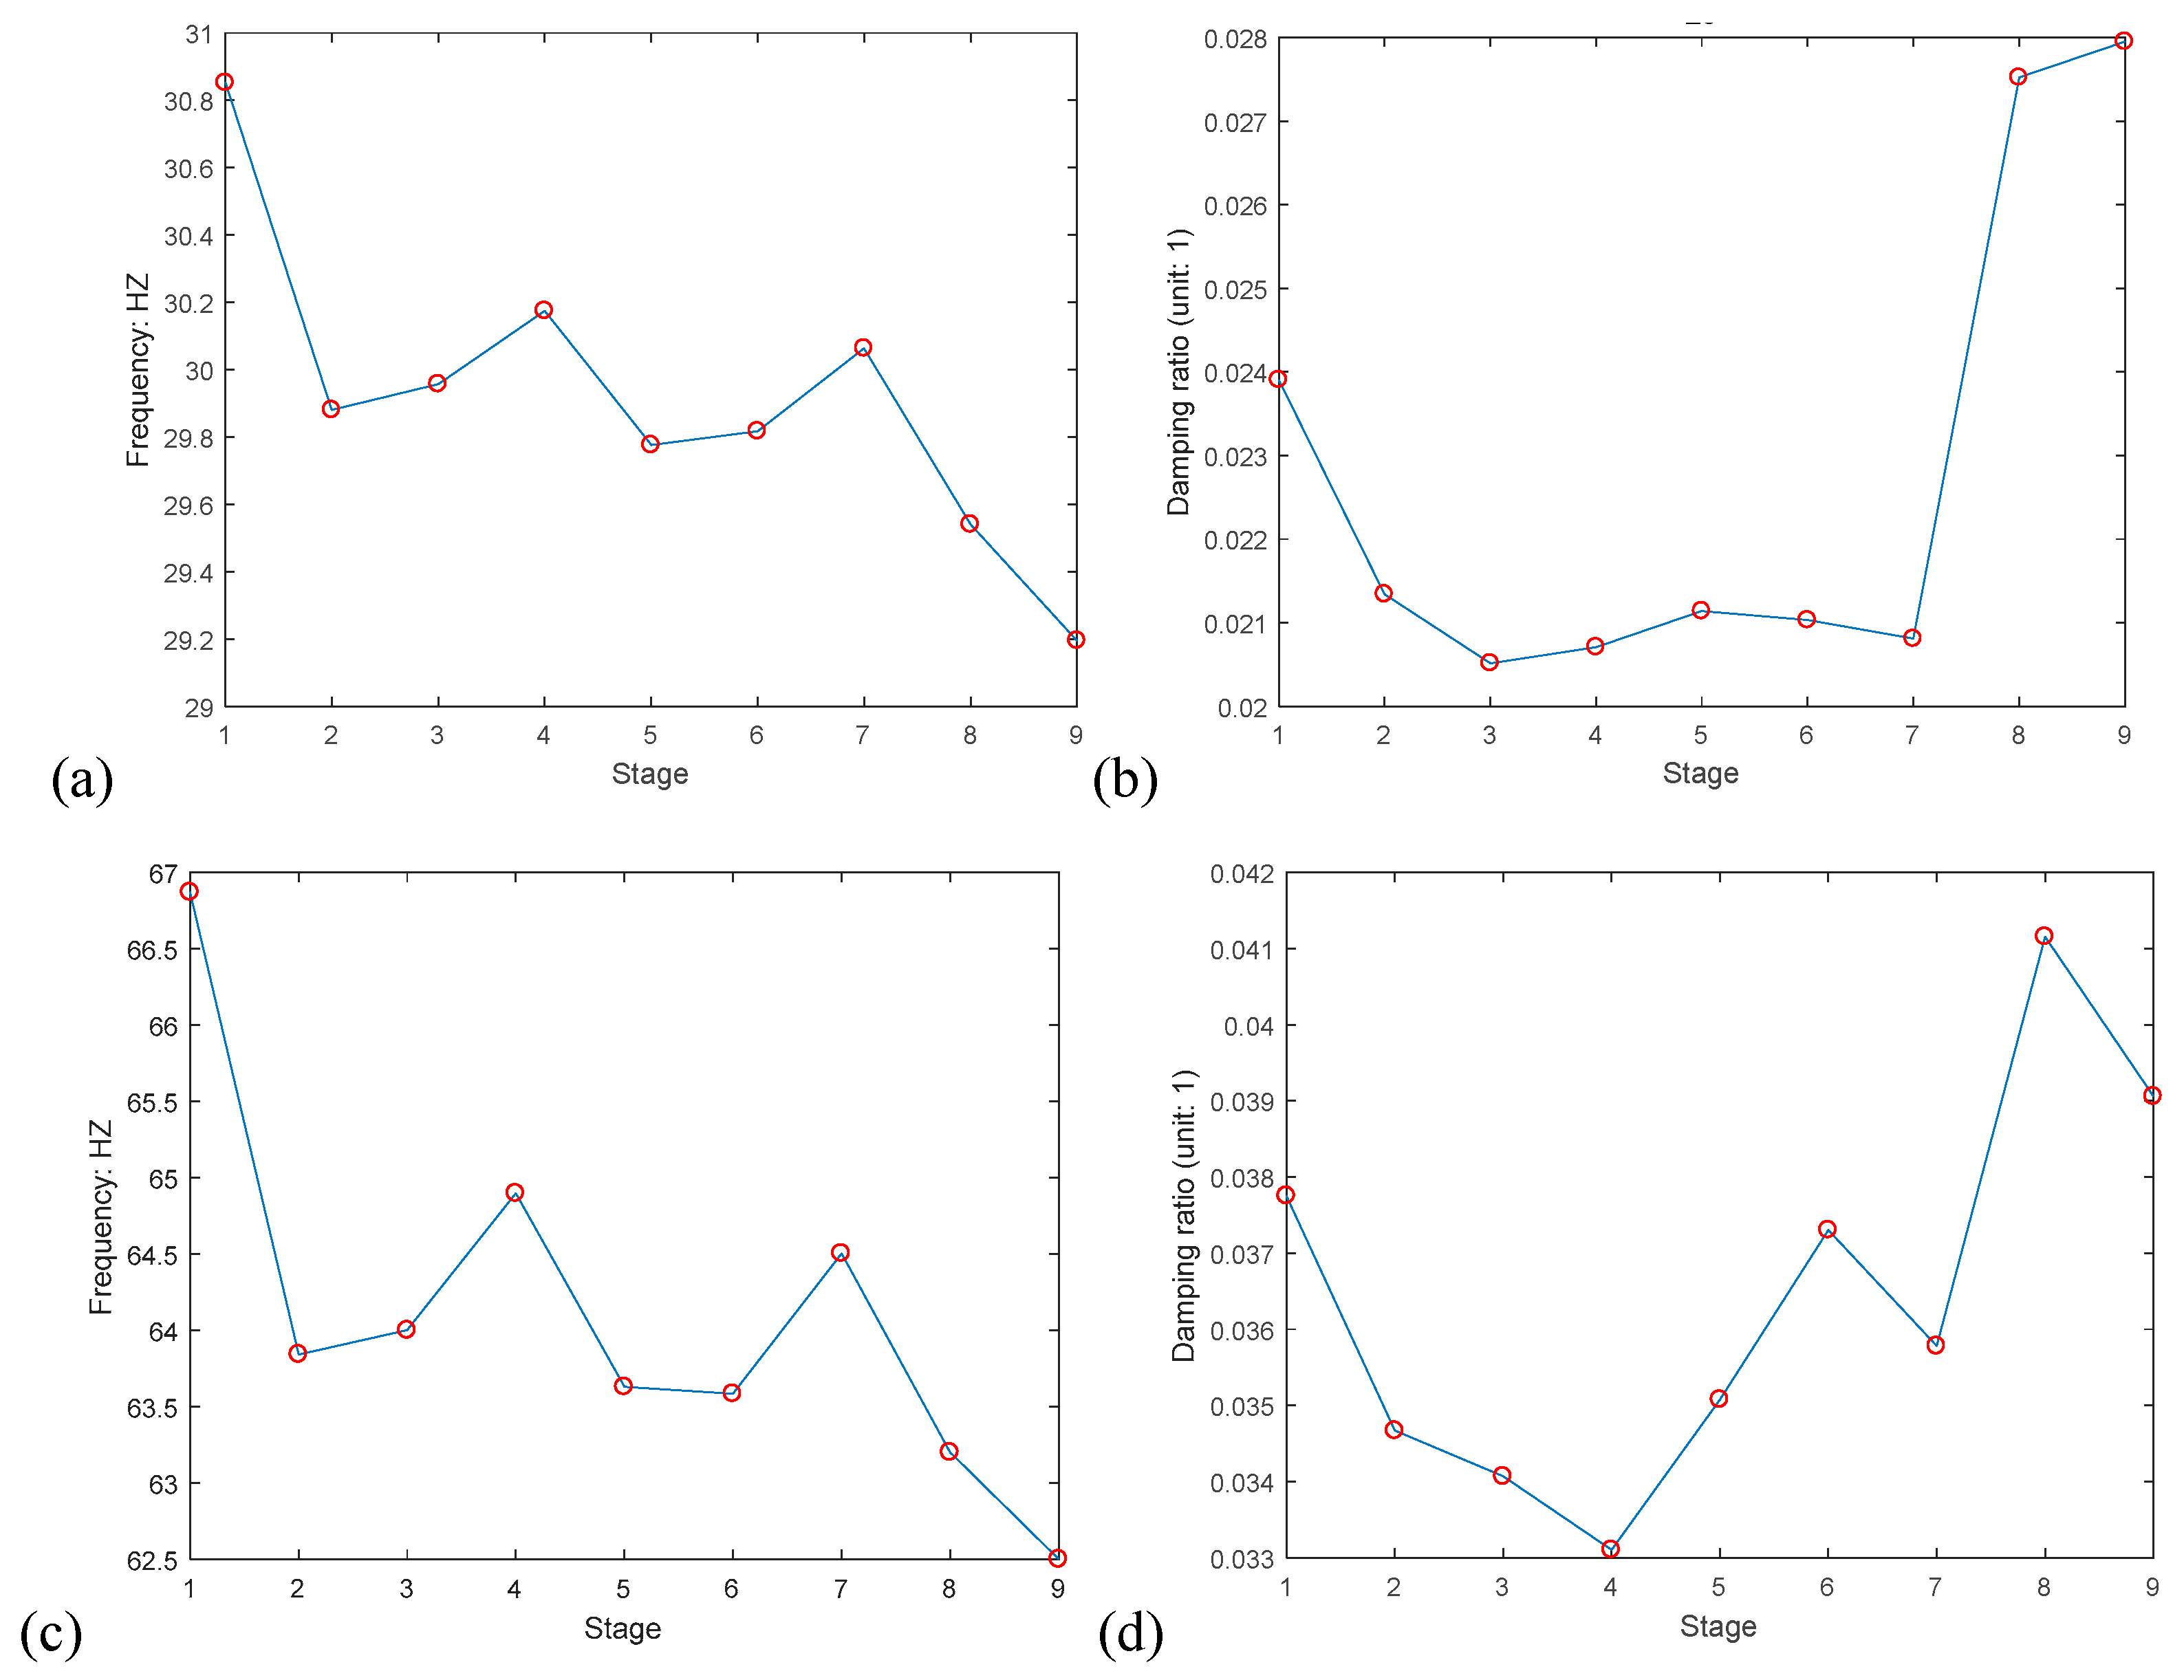
- The natural frequency is determined by the structure itself, and the elastic modulus or coefficient of stiffness will directly influence the change of the natural frequency. Natural frequency in the experimental data processing using SSI is a holistic concept of the structure.
- Global change is determined by the sum of the local changes.
4.5. Measurement, Sampling, and Error
4.6. The Application of the Flow Analysis in Practice
5. Conclusions
Author Contributions
Funding
Acknowledgments
Conflicts of Interest
Appendix A
| Wave Characteristics (Flow) | Damage Diagnosis | ||
|---|---|---|---|
| Sound (Voice, Song) | Wave (Flow) | Analyzing Methods | Data Processing |
| Loudness | Amplitude/wavelength | Flow characteristics, Structural characteristics, etc. Frequency response, Time–history response, etc. Extreme analysis, pattern recognition, analysis of similarity/difference, etc. | The data in flow analysis are often in a matrix, evaluated by determinant, norm, max eigen, 2D correlation coefficient, distance, and Procrustes; for statistics: expectation, variance, mode, median; For other data forms, there are some other evaluation methods. |
| Acoustic pressure | Distance, sound pressure or intensity, damping | ||
| Auditory impression | direction and speed of sound (velocity) | ||
| Tone | Frequency | ||
| Musical sound or noise | Harmonic wave | ||
| Timbre | Wave pattern | ||
| Pitch interval | Wave interval | ||
| Concerto, Symphony | Principal component analysis, association analysis, etc. | ||
| Method | Stage | Stage 1 | Stage 2 | Stage 3 | Stage 4 | Stage 5 | Stage 6 | Stage 7 | Stage 8 | Stage 9 |
|---|---|---|---|---|---|---|---|---|---|---|
| Modal Analysis | Fr_29 | 30.8520 | 29.8801 | 29.9573 | 30.1747 | 29.7761 | 29.8173 | 30.0631 | 29.5403 | 29.1955 |
| Fr_65 | 66.8703 | 63.8428 | 64.0005 | 64.8976 | 63.6303 | 63.5853 | 64.5042 | 63.2012 | 62.5008 | |
| DR_29 | −0.0284 | −0.0241 | −0.0229 | −0.0240 | −0.0238 | −0.0242 | −0.0240 | −0.0311 | −0.0314 | |
| DR_65 | −0.0493 | −0.0486 | −0.0502 | −0.0474 | −0.0496 | −0.0535 | −0.0492 | −0.0584 | −0.0577 | |
| Flow Analysis using 2D-CC | IoD | 1.0000 | 0.7368 | 0.7223 | 0.6059 | 0.6199 | 0.2811 | 0.5612 | 0.1408 | −0.3431 |
| Max-peak | 1.0000 | 0.7929 | 0.7951 | 0.7722 | 0.6594 | 0.7146 | 0.7184 | 0.7239 | 0.6980 | |
| Max-peak-time | 1.0000 | 0.9453 | 0.9359 | 0.9461 | 0.9453 | 0.9456 | 0.9223 | 0.9399 | 0.9467 | |
| Lifetime | 1.0000 | 0.1936 | 0.2128 | 0.2512 | 0.0047 | -0.0276 | 0.2502 | 0.4485 | 0.3660 |
References
- Enright, M.P.; Frangopol, D.M. Survey and evaluation of damaged concrete bridges. J. Bridge Eng. 2000, 5, 31–38. [Google Scholar] [CrossRef]
- Okeil, A.M.; Cai, C.S. Survey of Short and Medium-Span Bridge Damage Induced by Hurricane Katrina. J. Bridge Eng. 2008, 13, 377–387. [Google Scholar] [CrossRef]
- Watanabe, E.; Furuta, H.; Yamaguchi, T.; Kano, M. On longevity and monitoring technologies of bridges: A survey study by the Japanese Society of Steel Construction. Struct. Infrastruct. Eng. 2014, 10, 471–491. [Google Scholar] [CrossRef]
- Ph Papaelias, M.; Roberts, C.; Davis, C.L. A review on non-destructive evaluation of rails: State-of-the-art and future development. Proc. Inst. Mech. Eng. Part F J. Rail Rapid Transit 2008, 222, 367–384. [Google Scholar] [CrossRef]
- Bayraktar, A.; Türker, T.; Tadla, J.; Kurşun, A.; Erdiş, A. Static and dynamic field load testing of the long span nissibi cable-stayed bridge. Soil Dyn. Earthq. Eng. 2017, 94, 136–157. [Google Scholar] [CrossRef]
- Song, W.; Chunguang, X.U.; Pan, Q.; Song, J. Nondestructive testing and characterization of residual stress field using an ultrasonic method. Chin. J. Mech. Eng. 2016, 29, 365–371. [Google Scholar] [CrossRef]
- Stepanova, L.; Roslyakov, P. Multi-parameter description of the crack-tip stress field: Analytic determination of coefficients of crack-tip stress expansions in the vicinity of the crack tips of two finite cracks in an infinite plane medium. Int. J. Solids Struct. 2016, 100, 11–28. [Google Scholar] [CrossRef]
- Prigogine, I. Moderation et transformations irreversibles des systemes ouverts. Bull. De La Cl. Des Sci. Acad. R. Belg 1945, 31, 600–606. [Google Scholar]
- Nicolis, G.; Prigogine, I. Self-Organization in Nonequilibrium Systems; Wiley: New York, NY, USA, 1977. [Google Scholar]
- Prigogine, I.; René, L. Theory of dissipative structures. In Synergetics; Vieweg+ Teubner Verlag: Wiesbaden, Germany, 1977; Volume 1973, pp. 124–135. [Google Scholar]
- Jeong, S.; Hou, R.; Lynch, J.P.; Sohn, H.; Law, K.H. An information modeling framework for bridge monitoring. Adv. Eng. Softw. 2017, 114, 11–31. [Google Scholar] [CrossRef]
- Khajavi, R. A novel stiffness/flexibility-based method for euler–bernoulli/timoshenko beams with multiple discontinuities and singularities. Appl. Math. Model. 2016, 40, 7627–7655. [Google Scholar] [CrossRef]
- Ralbovsky, M.; Flesch, S.D.R. Frequency changes in frequency-based damage identification. Struct. Infrastruct. Eng. 2010, 6, 611–619. [Google Scholar] [CrossRef]
- Dammika, A.J. Experimental-Analytical Framework for Damping Change-Based Structural Health Monitoring of Bridges. Ph.D. Thesis, Saitama University, Saitama, Japan, 2014. [Google Scholar]
- Pei, C.; Qi, S.; Tang, J. Structural damage identification with multi-objective DIRECT algorithm using natural frequencies and single mode shape. Soc. Photo-Opt. Instrum. Eng. 2017, 10170, 101702H. [Google Scholar]
- Manuele, F.A. Hazard Analysis and Risk Assessment. In On the Practice of Safety, 3rd ed.; John Wiley & Sons, Inc.: Hoboken, NJ, USA, 2005; pp. 251–271. [Google Scholar]
- Fadeyi, M.O. The role of building information modeling (BIM) in delivering the sustainable building value. Int. J. Sustain. Built Environ. 2017, 6, 711–722. [Google Scholar] [CrossRef]
- Bajzecerová, V.; Kanócz, J. The Effect of Environment on Timber-concrete Composite Bridge Deck. Procedia Eng. 2016, 156, 32–39. [Google Scholar] [CrossRef] [Green Version]
- Armbruster, D.; Martin, S.; Thatcher, A. Elastic and inelastic collisions of swarms. Phys. D Nonlinear Phenom. 2017, 344, 45–57. [Google Scholar] [CrossRef]
- Sagasta, F.; Zitto, M.E.; Piotrkowski, R.; Benavent-Climent, A.; Suarez, E.; Gallego, A. Acoustic emission energy b-value for local damage evaluation in reinforced concrete structures subjected to seismic loadings. Mech. Syst. Signal Process. 2018, 102, 262–277. [Google Scholar] [CrossRef]
- Mesnil, O.; Leckey, C.A.; Ruzzene, M. Instantaneous and local wavenumber estimations for damage quantification in composites. Struct. Health Monit. 2014, 14, 193–204. [Google Scholar] [CrossRef]
- Wang, T.; Cheng, I.; Basu, A. Fluid vector flow and applications in brain tumor segmentation. IEEE Trans. Biomed. Eng. 2009, 56, 781–789. [Google Scholar] [CrossRef]
- Metzger, R.J. The ergodic theory of Axiom A flows. Invent. Math. 2000, 29, 181–202. [Google Scholar]
- Gottschalk, W.H. A survey of minimal sets. Ann. Inst. Fourier 1964, 14, 53–60. [Google Scholar] [CrossRef]
- Glasner, S. Proximal Flows//Proximal Flows; Springer: Berlin/Heidelberg, Germany, 1976; pp. 17–29. [Google Scholar]
- Iseli, A.; Wildrick, K. Iterated function system quasiarcs. Conform. Geom. Dyn. Am. Math. Soc. 2017, 21, 78–100. [Google Scholar] [CrossRef] [Green Version]
- Sloan, E.D. Clathrate hydrate measurements: Microscopic, mesoscopic, and macroscopic. J. Chem. Thermodyn. 2003, 35, 41–53. [Google Scholar] [CrossRef]
- Wiener, N. Cybernetics or Control and Communication in the Animal and the Machine; MIT Press: Cambridge, MA, USA, 1961. [Google Scholar]
- Selleri, F. (Ed.) Wave-Particle Duality; Plenum Press: London, UK, 1992. [Google Scholar]
- Shapiro, A.H. The Dynamics and Thermodynamics of Compressible Fluid Flow; John Wiley & Sons: Hoboken, NJ, USA, 1953. [Google Scholar]
- Galbis, A.; Maestre, M. Vector Analysis Versus Vector Calculus; Springer: New York, NY, USA, 2012. [Google Scholar]
- Reynolds, O. Papers on Mechanical and Physical Subjects, Volume 3, The Sub-Mechanics of the Universe; Cambridge University Press: Cambridge, UK, 1903. [Google Scholar]
- Pascal, J.C.; Carniel, X.; Li, J.F. Characterisation of a dissipative assembly using structural intensity measurements and energy conservation equation. Mech. Syst. Signal Process. 2006, 20, 1300–1311. [Google Scholar] [CrossRef]
- Von Bertalanffy, L. The theory of open systems in physics and biology. Science 1950, 111, 23–29. [Google Scholar] [CrossRef] [PubMed]
- Haag, M.G.; Haag, L.C. The Reconstructive Aspects of Class Characteristics and a Limited Universe // Shooting Incident Reconstruction; Elsevier Inc.: Amsterdam, The Netherlands, 2011; Volume 2011, pp. 35–54. [Google Scholar]
- Von Bertalanffy, L. General System Theory; George Braziller, lnc.: Manhattan, NY, USA, 1968; Volume 41973, p. 40. [Google Scholar]
- Blanchard, B.S.; Fabrycky, W.J.; Fabrycky, W.J. Systems Engineering and Analysis; Prentice Hall: Englewood Cliffs, NJ, USA, 1990. [Google Scholar]
- Hassiotis, S. Identification of Stiffness Reductions Using Natural Frequencies. J. Eng. Mech. 1995, 121, 1106–1113. [Google Scholar] [CrossRef]
- Yamaguchi, H.; Matsumoto, Y.; Kawarai, K.; Dammika, A.J.; Shahzad, S.; Takanami, R. Damage detection based on modal damping change in bridges. In Proceedings of the ICSBE’12, Kandy, Sri Lanka, 14–16 December 2013. [Google Scholar]
- Ye, X.F.; Ogai, H.; Kim, C.W. Discrepancy Analysis of Load–Displacement in the Combination Space for Concrete Box Girder Assessment. Strength Mater. 2018, 50, 695–701. [Google Scholar] [CrossRef]
- Poole, D. Linear Algebra: A Modern Introduction; Brooks/Cole: Boston, MA, USA, 2011. [Google Scholar]
- Goodall, C. Procrustes methods in the statistical analysis of shape. J. R. Stat. Society. Ser. B 1991, 1991, 285–339. [Google Scholar] [CrossRef]
- Tao, L.; Wang, H.B. Detecting and locating human eyes in face images based on progressive thresholding// IEEE International Conference on Robotics and Biomimetics. IEEE Xplore 2008, 2008, 445–449. [Google Scholar]
- Xu, Z.D.; Wu, Z. Simulation of the effect of temperature variation on damage detection in a long-span cable-stayed bridge. Struct. Health Monit. 2007, 6, 177–189. [Google Scholar] [CrossRef]
- Ho RT, H.; Ng, S.M.; Ho DY, F. The Sage Handbook of Qualitative Research// The SAGE Handbook of Qualitative Research; Sage Publications: Newcastle upon Tyne, UK, 2005; Volume 2005, pp. 277–279. [Google Scholar]
- Chong, O.; Sheng, O. Investigating Predictive Power of Stock Micro Blog Sentiment in Forecasting Future Stock Price Directional Movement. In Proceedings of the International Conference on Information Systems, Icis 2011, Shanghai, China, 4–7 December 2011. [Google Scholar]
- Wang, D.; Lu, H.; Bo, C. Visual tracking via weighted local cosine similarity. IEEE Trans. Cybern. 2017, 45, 1838–1850. [Google Scholar] [CrossRef] [PubMed]
- Wang, J.Q.; Wu, J.T.; Wang, J.; Zhang, H.Y.; Chen, X.H. Multi-criteria decision-making methods based on the hausdorff distance of hesitant fuzzy linguistic numbers. Soft Comput. 2016, 20, 1621–1633. [Google Scholar] [CrossRef]
- Princen, J.; Bradley, A. Analysis/synthesis filter bank design based on time domain aliasing cancellation. IEEE Trans. Acoust. Speechand Signal Process. 1986, 34, 1153–1161. [Google Scholar] [CrossRef]



| Sensor | Type (Max Value) | Number | Purpose | Direction and Location | |
|---|---|---|---|---|---|
| Displacement meter | SDP-200 (200 mm) | 4 | For deflection | Vertical | Under the girder |
| SDP-100 (100 mm) | 8 | For deflection | Vertical | Both under and up the girder | |
| SDP-25 (25mm) | 4 | Subsidence at the fulcrum | Vertical | Fulcrum of the girder | |
| Acceleration sensor | 10 | Vibration at the fulcrum | Vertical | Under the girder | |
| Object | Loading Stage | Pretest | Initial Load | Intermediate Load | Damage Load | |||||||
|---|---|---|---|---|---|---|---|---|---|---|---|---|
| Box Girder 2 | Stage | 1 | 2 | 3 | 4 | 5 | 6 | 7 | 8 | 9 | 10 | 11 |
| Loading (kN) | - | 816.1 | - | - | 840.1 | - | - | 838.4 | 973.9 | 1033.4 | 1427.3 | |
| Box Girder 3 | Stage | 1 | 2 | 3 | 4 | 5 | 6 | 7 | 8 | 9 | 10 | 11 |
| Loading (kN) | - | 804.0 | - | - | 776.5 | - | - | 816.3 | 980.4 | 1051.00 | 1351.7 | |
| Stage | Determinant | Norm | Max Eigen | 2D-CC | Distance | Procrustes |
|---|---|---|---|---|---|---|
| Initial Stage | 12.000 | 6.059 | 6.000 | 1.000 | 0.000 | 0.000 |
| Considered Stage | 12.000 | 6.059 | 6.000 | 0.833 | 1.414 | 0.1875 |
| Stage | Determinant | Norm | Max Eigen | 2D-CC | Distance | Procrustes |
|---|---|---|---|---|---|---|
| Initial Stage | 279.000 | 16.946 | 16.690 | 1.000 | 0.000 | 0.000 |
| Considered Stage | 124.325 | 16.910 | 16.595 | 0.948 | 4.179 | 0.060 |
| (a) | ||||||||||
| Characteristic | Matrix Type | Stage | Sum Data | |||||||
| 1→2 | 2→3 | 3→4 | 4→5 | 5→6 | 6→7 | 7→8 | 8→9 | QDI | ||
| Max-peak-time | Order | −1 | −1 | +1 | −1 | 0 | –1 | +1 | –1 | 3/8 |
| Value | −3 | 0 | −3 | −3 | +3 | −3 | 0 | −3 | 4/8 | |
| Max-value | Order | −1 | −1 | −1 | +1 | −1 | −1 | −1 | +1 | 4/8 |
| Value | −3 | −3 | +3 | −3 | 0 | −3 | +3 | +3 | 1/8 | |
| Lifetime | Order | −1 | −1 | −1 | +1 | +1 | +1 | +1 | −1 | 0/8 |
| Value | −3 | 0 | 0 | −3 | −3 | +3 | +3 | −3 | 2/8 | |
| Average | - | −1 | −1 | −1 | −1 | 0 | −1 | +1 | −1 | - |
| Accumulation | - | −1 | −2 | −3 | −4 | −4 | −5 | −4 | −5 | 5/8 |
| (b) | ||||||||||
| Variable | Original Trend | Stage | Sum Data | |||||||
| 1→2 | 2→3 | 3→4 | 4→5 | 5→6 | 6→7 | 7→8 | 8→9 | QDI | ||
| Determinant | Increase | −1 | −1 | −1 | −1 | 0 | +1 | −1 | −1 | 5/8 |
| Norm | Decrease | −1 | −1 | −1 | +1 | −1 | +1 | 0 | 0 | 2/8 |
| Max eigen | Decrease | −1 | −1 | +1 | +1 | −1 | −1 | +1 | +1 | 1/8 |
| 2D-CC | Decrease | −1 | −1 | −1 | −1 | 0 | −1 | +1 | −1 | 5/8 |
| Distance | Increase | −1 | −1 | −1 | −1 | +1 | +1 | +1 | −1 | 2/8 |
| Procrustes | Increase | −1 | −1 | +1 | −1 | +1 | +1 | 0 | −1 | 1/8 |
| Average | - | −1 | −1 | −1 | −1 | 0 | +1 | +1 | −1 | |
| Accumulation | - | −1 | −2 | −3 | −4 | −4 | −3 | −2 | -3 | final QDI 3/8 |
| (a) | ||||||||||
| Variable | Matrix Type and Original Trend | Stage | Sum Data | |||||||
| 1→2 | 2→3 | 3→4 | 4→5 | 5→6 | 6→7 | 7→8 | 8→9 | QDI | ||
| Determinant | Order (Increase) | –1 | −1 | +1 | −1 | −1 | +1 | −1 | +1 | 2/8 |
| Value (Increase) | −3 | −3 | −3 | −3 | +3 | +3 | −3 | −3 | 4/8 | |
| Norm | Order (Decrease) | +1 | −1 | +1 | −1 | +1 | −1 | +1 | −1 | 0/8 |
| Value (Decrease) | −3 | −3 | −3 | +3 | −3 | +3 | −3 | +3 | 3/8 | |
| Max eigen | Order (Decrease) | 0 | 0 | 0 | 0 | 0 | 0 | 0 | 0 | 0/8 |
| Value (Decrease) | −3 | +3 | −3 | +3 | −3 | +3 | −3 | +3 | 0/8 | |
| 2D-CC | Order (Decrease) | −1 | −1 | +1 | −1 | 0 | −1 | +1 | −1 | 3/8 |
| Value (Decrease) | −3 | 0 | −3 | −3 | +3 | −3 | 0 | −3 | 4/8 | |
| Distance | Order (Increase) | −1 | −1 | +1 | −1 | −1 | +1 | −1 | +1 | 2/8 |
| Value (Increase) | −3 | −3 | −3 | −3 | +3 | +3 | −3 | −3 | 4/8 | |
| Procrustes | Order (Increase) | −1 | +1 | −1 | +1 | −1 | +1 | +1 | −1 | 0/8 |
| Value (Increase) | −3 | −3 | 0 | +3 | −3 | 0 | 0 | 0 | 2/8 | |
| Average | - | −1 | −1 | −1 | −1 | −1 | +1 | −1 | −1 | |
| Accumulation | - | −1 | −2 | −3 | −4 | −5 | −4 | −5 | −6 | QDI 6/8 |
| (b) | ||||||||||
| Variable | Stage | Sum Data | ||||||||
| 1→2 | 2→3 | 3→4 | 4→5 | 5→6 | 6→7 | 7→8 | 8→9 | QDI | ||
| Max-peak-time | −1 | −1 | −1 | −1 | −1 | +1 | −1 | −1 | 6/8 | |
| Max-peak | −1 | −1 | +1 | −1 | −1 | −1 | +1 | −1 | 4/8 | |
| Lifetime | −1 | −1 | +1 | −1 | −1 | +1 | −1 | −1 | 4/8 | |
| Average | −1 | −1 | +1 | −1 | −1 | +1 | −1 | −1 | ||
| Accumulation | −1 | −2 | −1 | −2 | −3 | −2 | −3 | −4 | final QDI is 4/8 | |
| Type of flow | Stage | Summary | |||||||
|---|---|---|---|---|---|---|---|---|---|
| 1→2 | 2→3 | 3→4 | 4→5 | 5→6 | 6→7 | 7→8 | 8→9 | QDI | |
| Acceleration Flow | −1 | −1 | −1 | −1 | 0 | −1 | +1 | −1 | 5/8 |
| Displacement Flow | −1 | −1 | −1 | 0 | −1 | +1 | −1 | −1 | 5/8 |
| Type of Flow | Characteristics | Displacement Flow | Acceleration Flow | ||
|---|---|---|---|---|---|
| IoD | Max-peak-time | Max-peak | Lifetime | ||
| Displacement Flow | IoD | 1.0000 | 0.6257 | 0.3700 | 0.2325 |
| Acceleration Flow | Max-peak-time | 0.6257 | 1.0000 | 0.8175 | 0.8221 |
| Max-peak | 0.3700 | 0.8175 | 1.0000 | 0.7663 | |
| Lifetime | 0.2325 | 0.8221 | 0.7663 | 1.0000 | |
| Variable | Stage | QDI | |||||||
|---|---|---|---|---|---|---|---|---|---|
| 1→2 | 2→3 | 3→4 | 4→5 | 5→6 | 6→7 | 7→8 | 8→9 | ||
| Frequency | −1 | +1 | +1 | −1 | +1 | +1 | −1 | −1 | 0/8 |
| Damping Ratio | −1 | −1 | +1 | +1 | −1 | −1 | +1 | +1 | 0/8 |
| Variable | Stage | QDI | |||||||
|---|---|---|---|---|---|---|---|---|---|
| 1→2 | 2→3 | 3→4 | 4→5 | 5→6 | 6→7 | 7→8 | 8→9 | ||
| Frequency | −1 | +1 | +1 | −1 | −1 | +1 | −1 | −1 | 2/8 |
| Damping Ratio | −1 | −1 | −1 | +1 | +1 | −1 | +1 | −1 | −2/8 |
| Method | Characteristics | Displacement Flow | Acceleration Flow | |||||
|---|---|---|---|---|---|---|---|---|
| Fr_29 | Fr_65 | DR_29 | DR_65 | Max-peak-time | Max-peak | Lifetime | ||
| Modal Analysis | Fr_29 | 1.0000 | 0.9861 | 0.3227 | 0.8637 | 0.8255 | 0.6292 | 0.5490 |
| Fr_65 | 0.9861 | 1.0000 | 0.1858 | 0.7919 | 0.8564 | 0.6910 | 0.6575 | |
| DR_29 | 0.3227 | 0.1858 | 1.0000 | 0.6102 | −0.0929 | −0.3238 | −0.5776 | |
| DR_65 | 0.7067 | 0.6379 | 0.7949 | 0.8552 | 0.3604 | 0.1273 | −0.0547 | |
| Flow Analysis using 2D-CC | Max-peak-time | 0.8255 | 0.8564 | −0.0929 | 0.6257 | 1.0000 | 0.8175 | 0.8221 |
| Max-peak | 0.6292 | 0.6910 | −0.3238 | 0.3700 | 0.8175 | 1.0000 | 0.7663 | |
| Lifetime | 0.5490 | 0.6575 | −0.5776 | 0.2325 | 0.8221 | 0.7663 | 1.0000 | |
© 2019 by the authors. Licensee MDPI, Basel, Switzerland. This article is an open access article distributed under the terms and conditions of the Creative Commons Attribution (CC BY) license (http://creativecommons.org/licenses/by/4.0/).
Share and Cite
Ye, X.-F.; Chang, K.-C.; Kim, C.-W.; Ogai, H.; Oshima, Y.; Luna Vera, O.S. Flow Analysis and Damage Assessment for Concrete Box Girder Based on Flow Characteristics. Sustainability 2019, 11, 710. https://doi.org/10.3390/su11030710
Ye X-F, Chang K-C, Kim C-W, Ogai H, Oshima Y, Luna Vera OS. Flow Analysis and Damage Assessment for Concrete Box Girder Based on Flow Characteristics. Sustainability. 2019; 11(3):710. https://doi.org/10.3390/su11030710
Chicago/Turabian StyleYe, Xiong-Fei, Kai-Chun Chang, Chul-Woo Kim, Harutoshi Ogai, Yoshinobu Oshima, and O.S. Luna Vera. 2019. "Flow Analysis and Damage Assessment for Concrete Box Girder Based on Flow Characteristics" Sustainability 11, no. 3: 710. https://doi.org/10.3390/su11030710
APA StyleYe, X.-F., Chang, K.-C., Kim, C.-W., Ogai, H., Oshima, Y., & Luna Vera, O. S. (2019). Flow Analysis and Damage Assessment for Concrete Box Girder Based on Flow Characteristics. Sustainability, 11(3), 710. https://doi.org/10.3390/su11030710


