Article

Performance Evaluation of Distance Measurement Methods for Construction Noise Prediction Using Case-Based Reasoning

1
Department of Architectural Engineering, Hanyang University, Ansan 15588, Korea
2
Department of Architecture and Architectural Engineering, Seoul National University, Seoul 08826, Korea
*
Author to whom correspondence should be addressed.
Sustainability 2019, 11(3), 871; https://doi.org/10.3390/su11030871
Submission received: 3 January 2019 / Revised: 2 February 2019 / Accepted: 3 February 2019 / Published: 7 February 2019

Abstract

:
Concerns over environmental issues have recently increased. Particularly, construction noise in highly populated areas is recognized as a serious stressor that not only negatively affects humans and their environment, but also construction firms through project delays and cost overruns. To deal with noise-related problems, noise levels need to be predicted during the preconstruction phase. Case-based reasoning (CBR) has recently been applied to noise prediction, but some challenges remain to be addressed. In particular, problems with the distance measurement method have been recognized as a recurring issue. In this research, the accuracy of the prediction results was examined for two distance measurement methods: The weighted Euclidean distance (WED) and a combination of the Jaccard and Euclidean distances (JED). The differences and absolute error rates confirmed that the JED provided slightly more accurate results than the WED with an error ratio of approximately 6%. The results showed that different methods, depending on the attribute types, need to be employed when computing similarity distances. This research not only contributes an approach to achieve reliable prediction with CBR, but also contributes to the literature on noise management to ensure a sustainable environment by elucidating the effects of distance measurement depending on the attribute types.

1. Introduction

Environmental issues are a growing concern, and environmental pollution is globally recognized as a serious problem in modern society that adversely affects people and their surroundings [1,2,3,4,5,6,7,8]. Because of environmental pollution and nuisances, a number of related complaints and disputes have arisen [3,9,10,11,12,13]. In particular, noise from construction projects is considered a principal pollutant that causes harmful effects to neighboring residents and the surrounding environment [7,9,14,15]. Chronic exposure to noise can lead to significant health problems, such as depression [5,8,16,17], hearing impairment [5,18,19], cardiovascular disease [3,20], impaired cognitive performance [1,4], interference of communication [2], general understanding [4], hypertension [2,8,10,20], mental disturbances [3,4,8,16,18], short-term memory impairments [1,2,4], and sleep disorders [2,3,20]. Such damages are not only restricted to residents, but may also cause economic losses to construction companies through cost overruns and schedule delays [8,10,14,21]. According to the National Environmental Conflicts Resolution Commission (NECRC) in Korea [15], disputes related to construction noise accounted for over 80% of all noise-related disputes. This indicates that noise is one of the most pervasive stressors and needs to be properly managed. Noise damage can be divided into six types: Mental (35%), building and mental (25%), livestock (11%), farm (6%), building (4%), aquatic products (3%), and others (16%) [15]. The statistics of the NECRC [15] demonstrated that most residents have primarily experienced mental damage [5,8,15,22]. In addition, most of the damage is concentrated in densely populated regions [7,23].
Considering these situations, several studies have been conducted to develop methods for the reduction of damage caused by construction and the building of a sustainable environment. These studies considered various approaches, including noise annoyance [24,25,26], noise assessment [13,27,28], noise mapping [29], noise measurement and simulation [30,31,32], noise prediction [22,33,34], health effects [1,2,3,4,6,7,18,19,35], and noise-related risk assessment [8,9,36]. However, the existing approaches have limited abilities to predict and evaluate the noise coming from a site, especially during the preconstruction phase [22], making it difficult for contractors to manage the noise [8,22,37]. Thus, a number of noise-related problems frequently occur. This problem appears to occur because of a lack of adequate data or methodologies for noise prediction in the preconstruction phase [14]. Meanwhile, noise on project sites is commonly managed via approaches, such as using noise barriers, enclosures, and silencers along the boundary of the sites [22,33,38]. These approaches have limited abilities for reducing noise-related problems because the noise is propagated to areas adjacent to construction sites owing to divergence, diffraction, and reflection [5,9,36,39]. Thus, noise-related complaints and disputes continue to arise. Inappropriate noise management may lead to more serious situations and increase expenditure in the form of compensation costs, schedule delays, cost overruns, and even interruptions of the project as well as health problems to residents [5,8,22]. Therefore, construction noise should be adequately managed. As a first step for noise management, noise prediction during the preconstruction phase needs to be properly performed [22]. Construction noise can be successfully managed by understanding how loud the noises are that are produced by equipment in the preconstruction phase. This will help realize a sustainable environment and life for residents in site-adjacent areas. Predictions during the preconstruction phase can be utilized as a basis for establishing preventive noise plans and measures [8,22].
Case-based reasoning (CBR) has recently been applied in various fields, such as construction cost estimation [40,41,42,43,44], construction planning [45,46], decision making [47,48], litigation resolution [49], market selection [50], performance prediction [51], scheduling [45], and noise prediction [22,37] in the preconstruction phase. CBR is an intelligent approach that uses information and knowledge extracted from past similar projects to deal with an existing problem [22,40,41]. CBR provides reliable results and accurate predictions [40,52]. Thus, CBR is widely utilized for making predictions in diverse fields. Despite its benefits and applicability, some challenges remain to be addressed, such as a normalization method, selection and weighting of attributes, and a distance measurement method [40,49,52,53]. In particular, the distance measurement method is a recurring issue that should be logically addressed for the CBR process [40,41,54]. In an effort to cope with these issues, some research has been conducted to find an appropriate distance measurement method. However, most previous research applied the equivalent similarity distance method with insufficient consideration of the characteristics of the attributes. In general, a database includes various types of attributes (e.g., numeric, nominal, interval, and ordinal variables). Depending on the distance measurement method, the prediction results can change, which may affect the accuracy or reliability [40]. Therefore, the influence of the distance measurement method depending on the type of attribute needs to be considered when calculating the similarity distance between a given case and previous cases.
In this research, a model is developed for the examination of the prediction accuracy of CBR depending on the distance measurement method. The scope is limited to a comparison of the results predicted from the weighted Euclidean distance (WED) and a combination of the Jaccard and Euclidean distances (JED) measurement methods. This research is organized as follows. First, previous research on noise prediction is reviewed to investigate existing methods for the prediction of noise during the preconstruction phase and to confirm the current limitations of these methods. Next, preliminary research on the CBR methodology and similarity measurements is carried out, and CBR is selected as the primary approach for addressing the identified problems. Furthermore, the WED and JED methods are considered to address the effects of the distance measurement methods as these have important roles in case retrieval.
The developed model for the prediction of the noise level during the preconstruction phase consists of three sub-modules: (1) Case-base establishment, (2) attribute weighting, and (3) case retrieval. First, a qualified case-base is essential to ensuring the reliability of the developed model. The case-base is established from past cases regarding noise-related disputes collected from the NECRC and construction firms. Second, attributes are selected from the case-base and weighted to compute the similarity distance between the cases. Case similarities are determined with the WED and JED methods. Then, cases similar to the given case are extracted, and the noise level during the preconstruction phase is predicted from the retrieved cases. Finally, the developed model is validated by comparing the values predicted from the retrieved cases with those of the test cases. In addition, leave-one-out cross-validation (LOOCV) is employed to determine the overall effect of the distance measurement methods. The proposed model demonstrates the effect of the similarity distance measurement on the prediction results. This model should help improve noise prediction accuracy in the preconstruction phase, which will help in the management of noise onsite and the establishment of noise-related measures in advance. The results of this research can be useful not only for construction noise management, but also for cost estimation, market selection, facility maintenance, medical diagnosis, and risk analysis in which CBR is applicable.

2. Preliminary Research

2.1. Literature Review

The distance measurement has received considerable concerns because it affects the performance and case retrieval of CBR [40,49,55]. Much research has been performed to confirm the effect of the distance measurement and improve the accuracy of the derived outcomes, as described in Table 1.
Ahn et al. [40] investigated the effect of covariance when computing the similarity distance. They thought that the undesirable impacts of the covariance among the attributes may decrease the estimation accuracy and conducted comparative research to identify the covariance effect on the estimated cost. In particular, they focused on the weighted Mahalanobis distance because this method can cover the covariance among attributes. Their research is especially remarkable because they examined a more specific effect of the covariance based on various distance measurements (i.e., the Euclidean distance, Mahalanobis distance, fractional function, and arithmetic summation). They found that the weighted Mahalanobis distance may not be an effective distance measurement as compared to the Euclidean distance, but can still provide an acceptable estimation performance depending on the data conditions. Ding et al. [51] proposed a model for the evaluation of project performance. In their research, three distance algorithms were employed for the measurement of the similarity distance depending on the types of attributes. The research is notable in that they applied three algorithms to calculate case similarities according to the variable type. However, they focused on a wide prediction range and thus could not validate their model owing to the lack of data. Doğan et al. [56] compared the accuracy of cost estimation based on three different weighting methods (i.e., feature counting, gradient descent, and genetic algorithm). The Euclidean distance was used for the calculation of case similarity. The results showed that the costs estimated using the genetic algorithm were more accurate than those determined using gradient descent and feature counting. Du and Bormann [57] suggested an enhanced similarity measurement method to address the nonlinearity between feature and solution spaces and the multicollinearity among input attributes. They applied an artificial neural network (ANN) to deal with the nonlinearity and principal component analysis (PCA) to deal with multicollinearity. Their results showed that the relationship between the feature space and output space is significant for case retrieval with regard to quantitative estimation. However, limited consideration of the correlation can make it difficult to deal with changes in the input attributes. Jin et al. [42] used a multiple regression analysis method to develop a cost prediction model that specifically focused on the revision phase of CBR. They performed a case study in which the revised model demonstrated enhanced accuracy. They considered a limited distance measurement method for nominal variables (i.e., the similarity score was set to 1 if the attributes in the text of the test case were equivalent to those of the collected case and 0 otherwise). Kim and Kim [43] attempted to enhance the accuracy of cost estimation. They used a genetic algorithm to deal with uncertainties according to the judgment of experts. However, they merely computed attribute weights with inadequate consideration of the similarity measurements. Similar to Jin et al. [42], text attributes were assigned a similarity score of 0 for a non-match and 100 for a complete match. When the attribute was numeric, the similarity score was set to 100 if the variation with the given case was smaller than a specific level and 0 otherwise. Kwon et al. [22] proposed a noise prediction model for noise management based on CBR. They utilized the Euclidean distance as a similarity measure and the analytic hierarchy process (AHP) to weight attributes. They conducted experiments to validate the applicability of the developed model, and the results showed that the model could be applied to noise prediction during the preconstruction phase when there is insufficient noise-related information, with an acceptable error ratio of below 5%. Kwon et al. [37] developed a model for the estimation of compensation costs pertaining to noise based on CBR. The Euclidean distance was used as the distance measurement method and fuzzy-AHP was used for weighting attributes. They estimated the compensation noise based on the noise level and damage days using CBR through experiments. The results were validated with an accuracy of approximately 11.8%. However, further research in this regard is needed because they applied equivalent similarity measurements for nominal and numeric variables. Leśniak and Zima (2010) developed a model that estimates the project cost of a sports field. In their research, factors, such as the environmental impact of the construction activities, impact of construction activities on site-adjacent areas, and materials used, were considered. Depending on the characteristics of the variables, four different equations were employed to compute the case similarity. The verification results showed that the estimation has a mean absolute error ratio (MAER) of approximately 14%. Zhang et al. [46] developed a new model to improve the CBR performance for technical planning of foundation work. They employed the Minkowski distance for computing the similarity among cases and AHP as an attribute weighting method. The performance of CBR was validated, and the accuracy was compared with other methods. Their results showed that the proposed model was outstanding at retrieving similar cases regarding technical planning for foundation work. Despite these benefits, their research had limitations because they applied the same similarity measures to calculate the similarity for case retrieval.
Some researchers developed a model for the prediction of environmental noise based on statistical and scientific approaches, such as machine learning, feature selection, PCA, and multiple regression analysis. Torija and Ruiz [58] proposed a model for the estimation of environmental noise pollution with a specific alternative. To achieve their purpose, they employed three machine-learning approaches, including (1) multilayer perceptron (MLP), (2) sequential minimal optimization (SMO), and (3) Gaussian processes for regression (GPR). In addition, the research used two feature selection methods, namely (1) correlation-based feature-subset selection (CFS) and (2) wrapper for feature-subset selection (WFS), owing to a number of input attributes. Furthermore, PCA was utilized as a method to reduce the complexity of the data. Through those approaches, 12 different models were constructed. Then, the noise levels estimated using these models were compared with the measured levels. The results demonstrated that the machine-learning regression model outperformed the multiple linear regression (MLR) model [58]. Moreover, the estimation results based on the WFS approach were more accurate than those based on CFS, even though WFS involved more computational costs. This work is very significant because the researchers attempted to estimate environmental noise based on scientific approaches, such as machine learning and feature selection methods. Gagliardi et al. [3] evaluated the critical factors affecting aircraft noise based on the coefficients of the regression model. They used PCA with multiple linear regression to determine the relationships between aircraft-related parameters (flight, take off weights, and weather) and noise levels. Results based on PCA indicated that the percentage of the variance was approximately 77%, implying that the converted variables were sufficient to estimate aircraft noise levels. The developed model was validated by comparing training sets and test sets. This research indicated that parameters, such as the altitude, take-off weight, and ground speed, considerably affected noise levels. In summary, most studies have commonly utilized the equivalent distance measurement method for computing the similarity distance among cases. Such approaches have limited abilities for the extraction of similar cases, which may adversely influence the performance and accuracy of CBR. Cases in the database include various types of attributes, such as nominal, ordinal, interval, and numeric. Therefore, it is necessary to examine the effect of distance measurement methods according to the attribute types to achieve more reliable outcomes.

2.2. Similarity Distance Measurement with CBR

In this research, the CBR methodology is employed to predict the level of construction noise during the preconstruction phase. CBR originates from cognitive science and is based on how human reasoning works [40,59]. CBR provides solutions to current problems by using knowledge and experience based on previous similar cases or historical data [22,44,54,55]. This methodology is useful because it can be applied when relevant datasets are limited or inadequate, even if the problems are not well-organized [60,61]. CBR has been used in a variety of fields, such as cost estimation, safety diagnosis, maintenance, and duration estimation [37,40,51]. In general, CBR comprises four steps: Case retrieval, case reuse, case revision, and case retention [14,20,33,35]. Similar cases are retrieved from the case-base when a given case is matched with previously collected cases. Then, the similar cases are reused as a solution to the given problem. If the retrieved similar cases are not suitable for the given problem, the solution needs to be revised to solve the problem. This is because an inappropriate solution may decrease the reliability and accuracy of the results. Finally, the revised solution is stored as a new case in the case-base [40,55].
Several studies have focused on case retrieval because this is considered the most important phase of CBR [15,19,36]. Two retrieval methods are commonly used: Nearest-neighbor retrieval and inductive retrieval [22,37]. Nearest-neighbor retrieval is the most commonly used approach for CBR, where one or more similar cases are extracted based on the similarity distance between previous cases and the target case [22,62]. Inductive retrieval determines which attributes are the best selections for differentiating cases and creates a decision tree structure to organize cases [55]. Similar cases are retrieved according to decisions made at the input level. The retrieval is very effective when the search objectives are well defined and is faster at retrieving similar cases than nearest-neighbor retrieval. However, its weakness is that the searching of similar cases can be impossible if data are omitted or missing [46,55]. Therefore, the k-nearest-neighbor algorithm is used in this research because it can extract similar cases even when the data are insufficient.
Cases similar to a given case are retrieved according to a similarity score [63,64]. Therefore, measuring the similarity distance among cases is important [41,54,56]. Various distance measurement methods are available, such as the Euclidean distance, Mahalanobis distance, Manhattan distance, arithmetic summation, fractional function, Minkowski distance, Cosine distance, and Jaccard distance [40,46,64]. The Mahalanobis distance refers to a distance between two points in multivariate space, which is widely adopted in the cluster and classification analysis [40,65] because the distance can consider correlated relationships among attributes. The Minkowski distance is considered as a generalization of the Manhattan distance (dimension=1) and Euclidean distance (dimension=2) in a normed space. Cosine distance measures a similarity based on the angle between two non-zero vectors that is often used in information retrieval. In addition, arithmetic summation and fractional function-based similarity is calculated by the format of ( r d ) / r and r / ( r + d ) , respectively [40]. Either of these two similarity measures can be applied to the interval and ratio attributes [40]. Among them, the Euclidean distance is the most common similarity measurement method [40,63,66], and the Jaccard distance is effective for the calculation of the similarity of cases that include attributes, such as binary or text formats [64,67]. Thus, this research considers WED and JED to examine the differences in case similarity depending on the types of attributes and to confirm the effect of distance measurement on the prediction results.

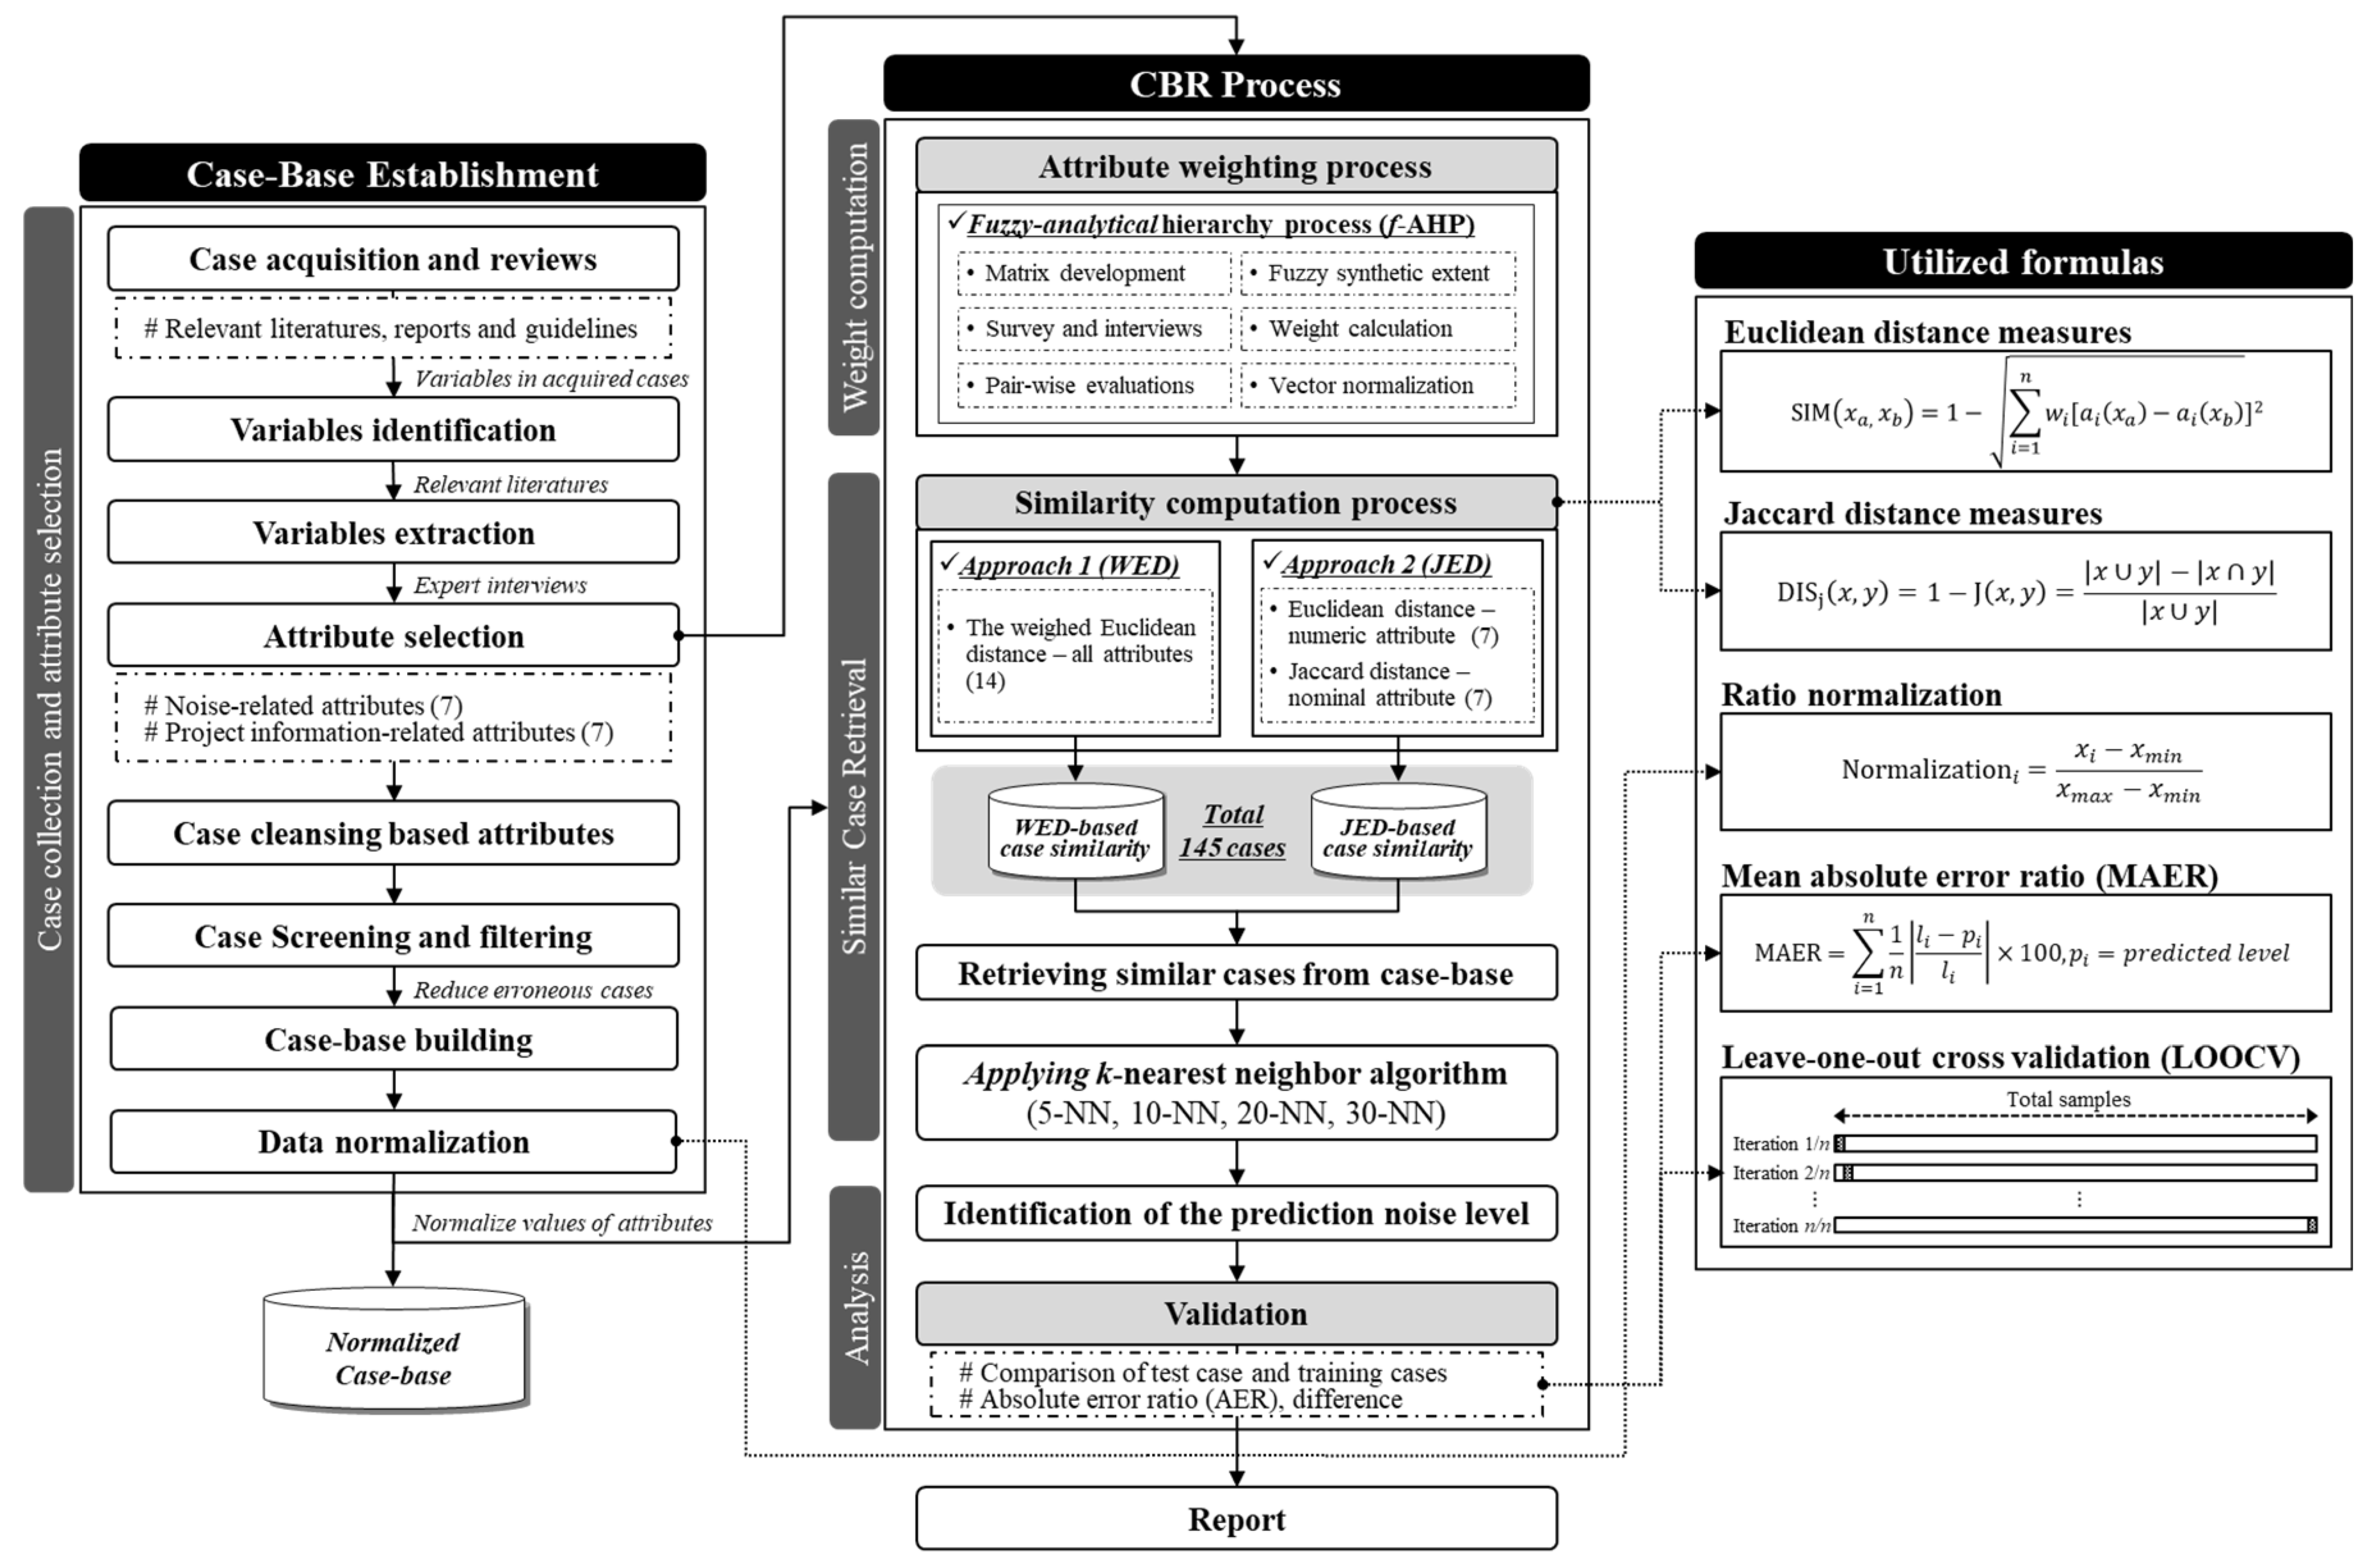
3. Model Development

This research involves the development of a model to confirm the accuracy of the prediction results depending on the distance measurement method, with a particular focus on the WED and JED methods. As illustrated in Figure 1, the model comprises three modules: (1) Case-base establishment, (2) attribute weighting, (3) and similar case retrieval. First, a case-base is established with cases are acquired from past projects. The collected cases need to be reviewed because the cases are critical to the performance when estimating the results [37,40,56,66]. Then, related literature, reports, and guidelines are extensively reviewed to identify the variables for the noise prediction. Based on expert interviews, the key attributes for predicting noise using CBR are extracted and selected. Subsequently, the collected cases are reorganized based on the attributes and screened to avoid the accuracy of the results from decreasing owing to erroneous data or cases. Then, the data are normalized to represent the equivalent scale via ratio normalization.
The fuzzy-AHP, weighted Euclidean distance, and Jaccard distance measurements are used as the major methodologies for this research. More specifically, the fuzzy-AHP method is employed to compute attribute weights based on the work of Kwon et al. [37], which are used to calculate a case similarity. The case similarity is then computed to search for cases most similar to the test cases. Computing the similarity among cases is essential to predict noise levels using CBR. During this process, the WED (approach 1) and JED (approach 2) are utilized to compute the similarity between cases because this research focuses on examining the impact of the distance measurements on the predicted results depending on the type of attributes. Using these two similarity distance measurements, the k-most similar cases are retrieved from the case-base according to the priority of the case similarity. Based on the output of the retrieved cases, the noise levels are predicted in the preconstruction phase. Finally, the predicted values are compared and validated in terms of two aspects: (1) A comparison between the results of the test case and retrieved cases and (2) LOOCV.

3.1. Establishment of the Case-Base

The developed model is based on the concept of utilizing past cases to predict the potential noise during the preconstruction phase. This section describes the process of constructing the case-base and weighting the attributes. This requires collecting reliable data or cases because CBR-based predictions are case-sensitive. If cases that include inappropriate data or information are utilized, the results may be unreliable and inaccurate [22,63]. Thus, a literature review was performed on various studies, reports, and guidelines, and a case-base was established from noise-related cases provided by construction companies and the NECRC. The NECRC is a recognized trustworthy institution that resolves various environment-related issues, including noise problems [22]. The case-base was established by analyzing construction documents and noise-related dispute cases. The documents include the type and degree of damage, evaluation results, arbitration results, and other related information.
The acquired cases are suitable for CBR-based prediction during the preconstruction phase because they include various data regarding the projects performed by various construction companies [5,37]. The collected cases are comprehensively analyzed and filtered because erroneous data or omitted information can influence similar case retrieval and decrease the reliability of the output. Next, the data from the collected cases are standardized because attributes were evaluated under equivalent conditions or scales when the similarity between the given case and previous cases was determined [5,40,53]. Furthermore, the data should be normalized to comparable or identical scales. Normalization allows for the maintenance of relatively equivalent distances between the converted and original values [22,63]. Thus, the raw data are rescaled as follows:
R a t i o   N o r m a l i z a t i o n i = x i x m i n x m a x x m i n
where xi, xmin, and xmax are the value of attribute i and the minimum and maximum values of the attributes, respectively. The normalized data are then used to compute the similarity scores among cases.

3.2. Attribute Weighting

This section describes the attribute weighting process. The attributes determined by Kwon et al. [37] are utilized to retrieve similar cases. In total, 14 input attributes related to noise (excavator, dump truck, auger, pump car, concrete mixer, breaker, and crusher) and projects in general (project duration, site area, gross area, number of floors, working days, distance, and barrier height) are considered [22,37]. These attributes could be reliably weighted because they were extracted based on an extensive literature review and interviews with experts that have experienced careers in construction projects. To weight the attributes, the opinions of experts properly aware of the site conditions need to be considered because the noise at a site is associated with interactions among various factors [13,22,24]. The qualitative assessment provided by experts can be converted into numerical values through AHP. The AHP was devised and developed originally by Thomas Saaty in the early 1970s, and is commonly used in decision-making processes, including multi-criteria attributes [22,51,68]. The AHP technique is one of the most useful tools for handling difficult problems with several criteria; furthermore, it is suitable for reflecting the opinions and experience of experts and examining the relative weights of interrelated and complex attributes [22,68,69]. The technique determines the weights between attributes by making paired comparisons. The pair-wise comparisons are mainly conducted via surveys or interviews with respondents using a fundamental scale, which allows the respondents to concentrate on assessing attributes in each level. In general, the AHP is composed of four steps [68,69]: (1) Defining and structuring the problem, (2) constructing the pair-wise comparison matrix, (3) computing the weights in each level, and (4) calculating the consistency and synthesizing the weights. Here, it is essential to check the consistency ratio so that the consistency of the results evaluated by experts is validated, before synthesizing weights. This is because inconsistency can occur when a number of pair-wise comparisons are conducted. The acceptable consistency ratio should be less than 0.1 [22,68,69,70]. If the consistency ratio exceeds 0.1, the determined weights need to be re-evaluated to ensure consistency [68,69,70,71]. However, such evaluations may be ambiguous and uncertain depending on the linguistic expressions of the variables [37,51,72,73]. To address the limitations of conventional AHP, fuzzy-AHP is utilized to assign attributes. As listed in Table 2, the attributes are primarily classified into two types: Numeric and nominal. Project-related attributes consist of numeric data, and noise-related attributes are nominal data indicating whether equipment was used or not during construction. Even though the equipment being used is a nominal attribute (i.e., yes or no), this is a key attribute for the prediction of the noise level. This is because most noise-related conflicts are caused by the operation of equipment [8]. Therefore, the identification of the equipment that was used is essential for noise prediction.
Fuzzy-AHP based on triangular fuzzy numbers provided by Kaya and Kharaman [72] is employed to weight the attributes. The responded surveys are checked to confirm the consistency of the evaluation. Based on the 27 surveys that passed, the attribute weights are calculated. Attributes, such as the distance to neighbors (0.1117), working days (0.0983), barrier height (0.0873), and usage of breakers (0.0948), were found to be essential for retrieving cases similar to the given case (see Table 2). The weights are used to compute the case similarity using the WED and JED. The details on similar case retrieval are described in the following section.

3.3. Case Retrieval

The similar case retrieval module elaborates the process of retrieving similar cases by applying different distance measures. Based on the similarity, cases close to the given case are retrieved from the case-base. The retrieval of previous cases comprises two phases. First, different similarity measures are applied depending on the attribute type. The similarity among cases needs to be calculated because cases are extracted according to the similarity priority [22,74]. In CBR, similarity is defined as the relative distance between the test case and previous cases [41,56,63]. As noted previously, to examine the difference of the case similarities and prediction results depending on the attribute type, WED and JED are employed to measure the similarity distance. The WED is conceptualized in the mathematical domain as the shortest line segment between two points in Euclidean space [22,63,75]. The distance method is the most frequently used similarity measurement method [22,41,63,66]. The Euclidean distance is determined by the square root of the sum of the squares of the difference between variables [40,41,66] as follows:
SIM ( x a ,   x b ) = 1 DIS ( x a ,   x b ) = 1 i = 1 n w i [ a i ( x a ) a i ( x b ) ] 2
where SIM(xa, xb) is the weighted similarity between cases xa and xb [21,47]. DIS(xa, xb) is the weighted distance between the two cases, xa and xb, where ai is the value of the ith attribute of the case, n is the number of attributes, and wi is the attribute weight derived from AHP [41,63]. The k-nearest neighbor retrieval, which is a fundamental algorithm for the evaluation of the similarity between the test case and previous cases in CBR, is used to retrieve the k-nearest cases [22,41,55,66]. In addition, the Jaccard distance measurement called the Jaccard similarity coefficient is utilized to determine the similarity of cases, including attributes with a binary or text format [46,64,67]. This method enables the similarity distance among cases to be computed in a simple and fast manner without data redundancy [46,64]. The Jaccard coefficient was obtained in the range of 0–1 by determining the shared and different attributes in the datasets. Specifically, it can be calculated by dividing the size of the intersection by the size of the union. The Jaccard distance is defined by subtracting the Jaccard coefficient from 1:
DIS j ( x ,   y ) = 1 J ( x , y ) = | x   y | | x   y | | x   y |
If datasets share equivalent attributes, the Jaccard similarity is 1. In contrast, if they do not share any attributes, the similarity is 0. The distance measurements are used to calculate the similarity scores among cases, including a binary format (e.g., yes or no), and similar cases are then retrieved based on the scores. Based on the two similarity distance measurements (WED and JED), cases similar to the test case are retrieved from the case-base. The output included in the extracted similar cases are utilized to predict the noise levels. In the following section, the impact of the distance measurement methods on the predicted noise level is described specifically through an experiment.

4. Experiment

4.1. Experiment Design and Process

This research focused on examining the effect of distance measurement methods on the predicted results. A comparative experiment using the collected cases was conducted to test the applicability of the model as illustrated in Figure 2.
First, attributes were weighted with fuzzy-AHP to compute the similarity among the cases. Based on the weights, similar cases were retrieved from the case-base. In this research, experiments were performed using two different distance measurement methods to examine the difference in the prediction results. The attributes consisted of numeric and nominal attributes (see Table 2). The similarity based on the WED was first computed by applying the equivalent distance measures regardless of the attribute type. Next, the similarity based on the combination of the JED was determined. More specifically, the Jaccard distance measurement was applied to nominal attributes (e.g., use of equipment), and the weighted Euclidean distance was applied to project-related information consisting of numerical attributes (e.g., duration, site area, gross area, and number of floors). Based on the similarity determined using the WED and JED methods, similar cases were retrieved, and the noise levels were predicted in the preconstruction phase. Finally, the applicability of the model was confirmed considering two aspects: (1) Specific comparisons based on the results of randomly selected test cases, and (2) LOOCV of all acquired cases.

4.2. Results and Discussion

A comparative experiment was conducted to validate the applicability of the proposed model and examine the effect of distance measurements on the prediction results. The effect of distance measurement methods was confirmed through comparisons between the results of the test cases and retrieved cases and LOOCV. The experiment based on the test cases was performed first. The case similarity was computed, and cases similar to the test cases were retrieved. The 1-, 5-, 10-, 15-, 20-, 25-, and 30-nearest neighbor (NN) approaches were employed to confirm the differences in the results depending on the two distance measurements. Table 3 presents the inputs and profiles of the 10 randomly selected test cases that were utilized to confirm the applicability of the model. The similarity scores between the test cases and previous cases were calculated based on the WED and JED.
Table 4 presents the average similarities of the 1-, 5-, 10-, 15, 20-, 25-, and 30-NN approaches obtained with the WED and JED methods. Cases similar to the test cases were generally retrieved with a similarity score of over 80%. Similarity values based on the JED presented a higher similarity than those of the WED. However, some cases, such as Case 5, indicated a limited similarity below 80%. The similarity scores were lower than those of the other test cases. This can be explained by the lack of similar cases or the existence of outliers in the case base [22,37].
The predicted noise levels from the similar cases retrieved by the WED and JED methods were compared for their accuracy. Table 5 presents the predicted noise level and absolute error rate (AER) of the cases summarized by the 5-, 10-, 15-, 20-, 25-, and 30-NN approaches. The noise predicted based on the WED and JED methods was compared with the original noise level through the AER, which can be calculated as follows:
AER   ( % ) = {   i f   L o L P > 1 , then   [ ( L o L P ) 1 ] × 100   o t h e r w i s e ,   [ 1 ( L o L P ) ] × 100
where Lo and Lp indicate the original noise and predicted noise level, respectively. The AER is a measure of the accuracy that was employed to confirm the similarity between the predicted and original values [40].
Table 5 presents the average noise levels based on the WED and the JED methods. In most cases, both the distance measurement methods produced values similar to the original values with error rates of 5%—7%. The MAERs based on the WED for the 5-, 10-, 20-, and 30-NN approaches were 5.70%, 6.27%, 6.49%, and 6.16%, respectively. Meanwhile, the MAERs based on the JED were 5.70%, 5.72%, 5.74%, and 5.56%, respectively. Figure 3 compares the AERs based on the WED and JED methods, which indicates that the latter produced slightly more accurate results than the former. This appears to be because the JED method considers the type of attribute (i.e., nominal attributes). However, the predicted values obtained using the 1-, 5-, and 10-NN approaches in many cases were mostly similar to each other regardless of the distance measurement method. As the number of nearest neighbors increased, the differences and AERs based on the WED and JED methods diverged.
To confirm the overall effect of the distance measurement methods on the results, an additional experiment based on leave-one-out cross-validation (LOOCV) was conducted. The LOOCV is a special type of k-fold cross-validation where k equals the number of instances in the database. A single instance is used as a validation data and the remaining instances are set as training data. In the process, all datasets excluding a single test set are repeatedly trained. As presented in Table 6, the overall similarity scores ranged from approximately 78% to 95%. These similarities show that cases similar to the given case were extracted with a similarity of approximately 0.85, which ensures the reliability of the retrieved cases for prediction. Furthermore, the case similarities based on the JED were higher than those based on only the WED.
Table 7 presents the difference and absolute error rate (AER) between the predicted and original levels based on LOOCV. The AERs of the 5-, 10-, 20-, and 30-NN were 5.65%, 5.89%, 6.09%, and 6.02%, respectively, for the WED and 5.67%, 5.83%, 5.95%, and 5.97%, respectively, for the JED. Similar to the results obtained from the 10 test cases, outputs based on the JED were generally slightly more accurate than those based on the WED with an error ratio of approximately 6%. This is because the similarity measurement based on the JED helped improve the accuracy of the results, although the differences in the 5- and 10-NN approaches were marginal. As illustrated in Figure 4, the differences and AERs based on the WED and JED are observed to slightly differ as the number of nearest neighbors increases, even though the AERs for the 5-NN approach are mostly similar for the WED and JED methods. This may be because the two distance measurement methods had a limited effect on the retrieval of cases with considerably high similarities because of the limited number of collected cases.
Overall, case similarities based on the JED method were higher than those of the WED. This seems to be because JED took into account the type of attributes (nominal and numerical) within each case, which helped improve the case similarities. Accordingly, the results predicted using the JED method were slightly more accurate than those predicted using the WED. However, there were some cases where the WED method presented more accurate results than the JED, even though the similarities based on the WED presented low similarities. This indicates that a similarity measurement based on the JED method does not necessarily yield accurate results. Thus, this implies that the prediction results can change depending on the test cases and the number of nearest neighbors. In other words, this can be explained because CBR is case-sensitive or extreme cases can be retrieved from the database by a similarity score. Therefore, it is necessary to remove outliers in advance and collect reliable cases when CBR-based prediction is performed. This research demonstrated the effect of distance measurement on the output depending on the attribute type. More improved and reliable results should be achievable if more previous cases are collected. This research highlights issues regarding similarity measurements in the CBR process, which need to be addressed. Noise prediction during the preconstruction stage is essential to address noise-related problems to establish preventive measures and plans in advance. It is extremely challenging to predict the noise on construction sites, especially during the preconstruction stage. This is because the noise-related data of the project are insufficient during the preconstruction stage; it is the stage before construction equipment is actually used and most construction activities are yet to be carried out. In this regard, the predictive model based on CBR would help improve noise management at construction sites. Furthermore, the prediction based on distance measurements considering attribute types enables environment managers to practically predict the noise during the preconstruction phase with high reliability. Furthermore, this research is significant in terms of the following aspects. First, the proposed method is feasible to be tested because a database of cases was established based on actual past projects. Second, predictions obtained using CBR consider a variety of available attributes that help improve the reliability of the prediction results. Third, this research is expected to provide reliable and accurate results because the effects of the distance measurement methods depending on the attribute type were considered, in contrast to current approaches that employ equivalent distance measurement methods. Furthermore, the effect of the distance measurement methods on the results was demonstrated; this can be extended to research on the selection of the appropriate distance measurement method depending on the types of attributes.

5. Conclusions

A number of environment-related problems are a concern around the world. Specifically, construction noise is globally regarded as a major nuisance because of its harmful effects on human health and the environment [1,2,3,4,5,6,7,8,9,14,15]. Such noises may lead to serious risk and excessive expenditure caused by project delays for construction firms [8,10,22]. Therefore, construction noise should be carefully managed to ensure a sustainable environment for neighboring residents. As a first step toward noise management, the noise level that would be generated from a site needs to be identified in the preconstruction phase. Although various approaches have been attempted to predict noise, they showed limited abilities for predicting the noise level in a construction project because of uncertainties and irregularities arising from factors, such as site conditions, work activities, and adjacent areas [5,22].
CBR is extensively used for performing estimations in diverse areas, including noise prediction during the preconstruction phase. However, CBR has some challenging issues to be addressed, such as attribute weighting, normalization, and distance measurement. The present research focused on identifying the effect of the distance measurement methods on the output, specifically the WED and JED methods. A noise prediction model was developed to compare the accuracy and difference in outcomes based on distance measurements, such as the WED and JED. The model was validated by comparing the results obtained from 10 test cases and performing LOOCV for all the cases. The average similarities of the 5-NN to 30-NN approaches ranged from 0.7799 to 0.9247 with the WED and from 0.8914 to 0.9592 with the JED. The results indicated that the JED method provided a higher similarity score than the WED. Furthermore, the predicted values with the two distance measures were confirmed to be very similar to the original values. Specifically, the AERs of the 1-, 5-, 10-, 15-, 20-, 25-, and 30-NN approaches were 7.07%, 5.65%, 5.89%, 6.15%, 6.09%, 6.04%, and 6.02%, respectively, with the WED and 7.07%, 5.67%, 5.83%, 6.01%, 5.95%, 5.99%, and 5.97%, respectively, with the JED. The experimental results confirmed that the differences based on the distance measurement methods were insignificant. Despite such small differences, the results also confirmed that the JED provided marginally more accurate predictions that were closer to the original values than the WED, which validated the applicability of the developed model.
In summary, this research examined the impact of the distance measurement methods depending the type of attributes on the prediction results. This is because the case similarity can vary depending on the similarity of the distance measurements, which affects the accuracy or reliability of the results. In this research, the WED and JED measurement methods were used to compare the accuracy of the estimated results. The WED method is a more common and accurate distance measurement method than other methods (i.e., Mahalanobis distance, Minkowski distance, Manhattan distance, Cosine distance, arithmetic summation, and fractional function) [40,41,63,66]. In addition, the Jaccard distance is effective for the computation of the similarity of cases that have data with a binary or text format. This research examined sensitivities in terms of the case similarities, differences, and AERs of the predicted noise levels. The experimental results confirmed that the variations in the results (case similarity, differences and AERs) obtained based on the distance measurement methods were insignificant. Despite such small differences, the results also confirmed that the JED provided marginally more accurate predictions that were closer to the original values than the WED, which validated the applicability of the developed model. In order words, the experimental results demonstrated that the case similarities and prediction results can differ slightly according to the distance measurement method or cases tested in the experiment. Thus, different distance measurements need to be considered depending on the attribute type, when computing the similarity distance among cases in CBR. This research is academically significant in that the attribute type was considered in the distance measurement, in contrast to existing research with equal distance measurements. The developed model should improve the accuracy of current noise prediction approaches. By analyzing the effect of the distance measurement methods on the results, this research contributes toward achieving reliable predictions in various fields that utilize CBR and to the literature on construction noise management to ensure a sustainable environment. This research focused on not only a comparison of the results with different distance measurement methods, but also on the confirmation of the accuracy of the prediction results. However, there may be limitations in elaborating the differences resulting from the use of different distance measurement because only two distance measurement methods (WED and JED methods) were considered. Thus, further research is needed to address the effects of other distance measurement methods (e.g., Mahalanobis distance, Minkowski distance, Manhattan distance, Cosine distance, arithmetic summation, and fractional function) on the output to achieve more reliable outcomes. Furthermore, the performance of the similarity measurement can change depending on the attribute weights or features of the case-base used in the experiment [22,40,63]. Thus, various weighting methods need to be considered to improve the attribute weights. The accuracy of the predictions obtained using CBR depends on the output of the retrieved cases. In this research, cases from the NECRC were mainly utilized. More relevant cases need to be collected from various organizations. Finally, more cases or datasets need to be used in further experiments for the identification of more specific effects of the distance measurement methods on the predictions. The results of this research can be extended to research on selecting an appropriate similarity method depending on the characteristics of the attributes.

Author Contributions

Conceptualization, N.K. and Y.A.; Investigation, M.P.; Methodology, N.K., I.Y. and Y.A.; Supervision, J.L. and Y.A.; Validation, N.K. and I.Y.; Writing – original draft, N.K. and Y.A.; Writing – review & editing, N.K., J.L., M.P. and Y.A.

Funding

This research was funded by the Ministry of Science, ICT & Future Planning (No. 2015R1A5A1037548).

Acknowledgments

This research was supported by the Basic Science Research Program through the National Research Foundation of Korea (NRF).

Conflicts of Interest

The authors declare no conflict of interest.

References

  1. Chetoni, M.; Ascari, E.; Bianco, F.; Fredianelli, L.; Licitra, G.; Cori, L. Global noise score indicator for classroom evaluation of acoustic performances in LIFE GIOCONDA project. Noise Mapp. 2016, 3, 157–171. [Google Scholar] [CrossRef]
  2. Dratva, J.; Phuleria, H.C.; Foraster, M.; Gaspoz, J.M.; Keidel, D.; Künzli, N.; Liu, L.J.; Pons, M.; Zemp, E.; Gerbase, M.W.; et al. Transportation Noise and Blood Pressure in a Population-Based Sample of Adult. Environ. Health Perspect. 2012, 120. [Google Scholar] [CrossRef] [PubMed]
  3. Gagliardi, P.; Teti, L.; Licitra, G. A statistical evaluation on flight operational characteristics affecting aircraft noise during take-off. Appl. Acoust. 2018, 134, 8–15. [Google Scholar] [CrossRef]
  4. Minichilli, F.; Gorini, F.; Ascari, E.; Bianchi, F.; Coi, A.; Fredianelli, L.; Licitra, G.; Manzoli, F.; Mezzasalma, F.; Cori, L. Annoyance Judgment and Measurements of Environmental Noise: A Focus on Italian Secondary Schools. Int. J. Environ. Res. Public Health 2018, 15, 208. [Google Scholar] [CrossRef] [PubMed]
  5. Kwon, N.; Park, M.; Lee, H.S.; Ahn, J.; Shin, M. Construction Noise Management Using Active Noise Control Techniques. J. Constr. Eng. Manag. 2016, 142, 04016014. [Google Scholar] [CrossRef]
  6. Middel, H.; Verones, F. Making Marine Noise Pollution Impacts Heard: The Case of Cetaceans in the North Sea within Life Cycle Impact Assessment. Sustainability 2017, 9, 1138. [Google Scholar] [CrossRef]
  7. Park, T.; Kim, M.; Jang, C.; Choung, T.; Sim, K.A.; Seo, D.; Chang, S.I. The Public Health Impact of Road-Traffic Noise in a Highly-Populated City, Republic of Korea: Annoyance and Sleep Disturbance. Sustainability 2018, 10, 2947. [Google Scholar] [CrossRef]
  8. Kwon, N.; Song, K.; Lee, H.S.; Kim, J.; Park, M. Construction Noise Risk Assessment Model Focusing on Construction Equipment. J. Constr. Eng. Manag. 2018, 144, 04018034. [Google Scholar] [CrossRef]
  9. Eom, C.S.; Paek, J.H. Risk index model for minimizing environmental disputes in construction. J. Constr. Eng. Manag. 2009, 135, 34–41. [Google Scholar] [CrossRef]
  10. Fernández, M.D.; Quintana, S.; Chavarría, N.; Ballesteros, J.A. Noise exposure of workers of the construction sector. J. Appl. Acoust. 2009, 70, 753–760. [Google Scholar] [CrossRef]
  11. Kim, T.; Lim, H.; Kim, C.W.; Lee, D.; Cho, H.; Kang, K.I. The Accelerated Window Work Method Using Vertical Formwork for Tall Residential Building Construction. Sustainability 2018, 10, 456. [Google Scholar] [CrossRef]
  12. Ministry of Environment (MOE). Guidance of Noise and Vibration Control under Construction; MOE: Sejong City, Korea, 2006.
  13. Bunn, F.; Zannin, P.H.T. Assessment of railway noise in an urban setting. Appl. Acoust. 2016, 104, 16–23. [Google Scholar] [CrossRef]
  14. Çelik, T.; Kamali, S.; Arayici, Y. Social cost in construction projects. Environ. Impact Assess. Rev. 2017, 64, 77–86. [Google Scholar] [CrossRef]
  15. NECRC (National Environmental Conflict Resolution Commission in Korea). Environmental Dispute Mediation Status Report; NECRC: Seoul, Korea, 2018.
  16. Harris, C.M. Handbook of Acoustical Measurements and Noise Control; McGraw-Hill: New York, NY, USA, 1991. [Google Scholar]
  17. Hong, T.; Ji, C.; Park, J.; Leigh, S.; Seo, D. Prediction of environmental costs of construction noise and vibration at the preconstruction phase. J. Manag. Eng. 2014, 31, 04014079. [Google Scholar] [CrossRef]
  18. Muzet, A. Environmental noise, sleep and health. Sleep Med. Rev. 2007, 11, 135–142. [Google Scholar] [CrossRef] [PubMed]
  19. Passchier-Vermeer, W.; Passchier, W.F. Noise exposure and public health. J. Environ. Health. Perspect. 2000, 108, 123–131. [Google Scholar]
  20. Babisch, W.; Beule, B.; Schust, M.; Kersten, N.; Ising, H. Traffic Noise and Risk of Myocardial Infarction. Epidemiology 2005, 16, 33–40. [Google Scholar] [CrossRef]
  21. Matthews, J.C.; Allouche, E.N.; Sterling, R.L. Social cost impact assessment of pipeline infrastructure projects. Environ. Impact Assess. Rev. 2015, 50, 196–202. [Google Scholar] [CrossRef]
  22. Kwon, N.; Park, M.; Lee, H.S.; Ahn, J.; Kim, S. Construction Noise Prediction Model Based on Case-Based Reasoning in the Preconstruction Phase. J. Constr. Eng. Manag. 2017, 143, 04017008. [Google Scholar] [CrossRef]
  23. Kaewunruen, S.; Martin, V. Life Cycle Assessment of Railway Ground-Borne Noise and Vibration Mitigation Methods Using Geo synthetics, Metamaterials and Ground Improvement. Sustainability 2018, 10, 3753. [Google Scholar] [CrossRef]
  24. Jakovljevic, B.; Paunovic, K.; Belojevic, G. Road-traffic noise and factors influencing noise annoyance in an urban population. Environ. Int. 2009, 35, 552–556. [Google Scholar] [CrossRef]
  25. Licitra, G.; Fredianelli, L.; Petri, D.; Vigotti, M.A. Annoyance evaluation due to overall railway noise and vibration in Pisa urban areas. Sci. Total Environ. 2016, 568, 1315–1325. [Google Scholar] [CrossRef] [PubMed]
  26. Licitra, G.; Ascari, E.; Fredianelli, L. Prioritizing Process in Action Plans: A Review of Approaches. Curr. Pollut. Rep. 2017, 3, 151–161. [Google Scholar] [CrossRef]
  27. Kephalopoulos, S.; Paviotti, M.; Anfosso-Lédée, F.; Maercke, D.V.; Shilton, S.; Jones, N. Advances in the development of common noise assessment methods in Europe: The CNOSSOS-EU framework for strategic environmental noise mapping. Sci. Total Environ. 2014, 482–483, 400–410. [Google Scholar] [CrossRef] [PubMed]
  28. Ruiz-Padillo, A.; Ruiz, D.P.; Torija, A.J.; Ramos-Ridao, Á. Selection of suitable alternatives to reduce the environmental impact of road traffic noise using a fuzzy multi-criteria decision model. Environ. Impact Assess. 2016, 61, 8–18. [Google Scholar] [CrossRef]
  29. Iglesias-Merchan, C.; Diaz-Balteiro, L.; Soliño, M. Transportation planning and quiet natural areas preservation: Aircraft overflights noise assessment in a National Park. Transp. Res. D 2015, 41, 1–12. [Google Scholar] [CrossRef]
  30. Kerr, M.J.; Brosseau, L.; Johnson, C.S. Noise levels of selected construction tasks. AIHA J. 2002, 63, 334–339. [Google Scholar] [CrossRef]
  31. Neitzel, R.; Seixas, N.S.; Camp, J.; Yost, M. An assessment of occupational noise exposures in four construction trades. J. Am. Ind. Hyg. Assoc. 1999, 60, 807–817. [Google Scholar] [CrossRef] [PubMed]
  32. Cueto, J.L.; Petrovici, A.M.; Hernández, R.; Fernández, F. Analysis of the Impact of Bus Signal Priority on Urban Noise. Acta Acust. United Acust. 2017, 103, 561–573. [Google Scholar] [CrossRef]
  33. Gilchrist, A.; Allouche, E.N.; Cowan, D. Prediction and mitigation of construction noise in an urban environment. Can. J. Civ. Eng. 2003, 30, 659–672. [Google Scholar] [CrossRef]
  34. Morley, D.W.; de Hoogh, K.; Fecht, D.; Fabbri, F.; Bell, M.; Goodman, P.S.; Elliott, P.; Hodgson, S.; Hansell, A.L.; Gulliver, J. International scale implementation of the CNOSSOS-EU road traffic noise prediction model for epidemiological studies. Environ. Pollut. 2015, 206, 332–341. [Google Scholar] [CrossRef]
  35. Michaud, D.S.; Feder, K.; Keith, S.E.; Voicescu, S.A.; Marro, L.; Than, J.; Guay, M.; Denning, A.; McGuire, D.; Bower, T.; et al. Exposure to wind turbine noise: Perceptual responses and reported health effects. J. Acoust. Soc. Am. 2016, 139, 1443. [Google Scholar] [CrossRef] [PubMed]
  36. Seo, J.W.; Choi, H.H. Risk-based safety impact assessment methodology for underground construction projects in Korea. J. Constr. Eng. Manag. 2008, 134, 72–81. [Google Scholar] [CrossRef]
  37. Kwon, N.; Cho, J.; Lee, H.S.; Yoon, I.; Park, M. Compensation Cost Estimation Model for Construction Noise Claims Using Case-Based Reasoning. J. Constr. Eng. Manag. 2019. accepted. [Google Scholar]
  38. Elliott, S.J.; Nelson, P.A. Active Control of Sound; Academic: New York, NY, USA, 1993. [Google Scholar]
  39. Casanovas, M.M.; Armengou, J.; Ramos, G. Occupational risk index for assessment of risk in construction work by activity. J. Constr. Eng. Manag. 2013, 140, 04013035. [Google Scholar] [CrossRef]
  40. Ahn, J.; Park, M.; Lee, H.S.; Ahn, S.J.; Ji, S.H.; Song, K. Covariance effect analysis of similarity measurement methods for early construction cost estimation using case-based reasoning. Autom. Constr. 2017, 81, 254–266. [Google Scholar] [CrossRef]
  41. Ji, S.H.; Park, M.; Lee, H.S. Case adaptation method of case based reasoning for construction cost estimation in Korea. J. Constr. Eng. Manag. 2012, 138, 43–52. [Google Scholar] [CrossRef]
  42. Jin, R.; Cho, K.; Hyun, C.; Son, M. MRA-based revised CBR model for cost prediction in the early stage of construction projects. Expert Syst. Appl. 2012, 39, 5214–5222. [Google Scholar] [CrossRef]
  43. Kim, J.K.; Kim, K. Preliminary Cost Estimation Model Using Case-Based Reasoning and Genetic Algorithms. J. Comput. Civ. Eng. 2010, 24, 499–505. [Google Scholar] [CrossRef]
  44. Leśniak, A.; Zima, K. Cost Calculation of Construction Projects Including Sustainability Factors Using the Case Based Reasoning (CBR) Method. Sustainability 2018, 10, 1608. [Google Scholar] [CrossRef]
  45. Ryu, H.G.; Lee, H.S.; Park, M. Construction Planning Method Using Case-Based Reasoning (CONPLA-CBR). J. Comput. Civ. Eng. 2007, 21, 410–422. [Google Scholar] [CrossRef]
  46. Zhang, Y.; Ding, L.; Love, P.E.D. Planning of deep foundation construction technical specifications using improved case-based reasoning with weighted k-nearest neighbors. J. Comput. Civ. Eng. 2017, 31, 04017029. [Google Scholar] [CrossRef]
  47. Chua, D.K.H.; Li, D.Z.; Chan, W.T. Case-based reasoning approach in bid decision-making. J. Constr. Eng. Manag. 2001, 127, 35–45. [Google Scholar] [CrossRef]
  48. Morcous, G.; Rivard, H.; Hanna, A.M. Case-based reasoning system for modeling infrastructure deterioration. J. Comput. Civ. Eng. 2002, 16, 104–114. [Google Scholar] [CrossRef]
  49. Arditi, D.; Tokdemir, O.B. Comparison of case-based reasoning and artificial neural networks. J. Comput. Civ. Eng. 1999, 13, 162–169. [Google Scholar] [CrossRef]
  50. Ozorhon, B.; Dikmen, I.; Birgönül, M.T. Case-based reasoning model for international market selection. J. Constr. Eng. Manag. 2006, 132, 940–948. [Google Scholar] [CrossRef]
  51. Ding, J.; Jia, J.; Jin, C.; Wang, N. An Innovative Method for Project Transaction Mode Design Based on Case-Based Reasoning: A Chinese Case Study. Sustainability 2018, 10, 4127. [Google Scholar] [CrossRef]
  52. International Society of Parametric Analysts (ISPA). Parametric Estimating Handbook, 4th ed.; ISPA: Vienna, VA, USA, 2008. [Google Scholar]
  53. Koo, C.; Hong, T.; Hyun, C.; Koo, K. A CBR-based hybrid model for predicting a construction duration and cost based on project characteristics in multi-family housing projects. Can. J. Civ. Eng. 2010, 37, 739–752. [Google Scholar] [CrossRef]
  54. Aamodt, A.; Plaza, E. Case-based reasoning: Foundational issues, methodological variations, and system approaches. AI Commun. 1994, 7, 39–59. [Google Scholar]
  55. Watson, I. Applying Case-based Reasoning: Techniques for Enterprise System; Morgan Kaufmann: San Francisco, CA, USA, 1997. [Google Scholar]
  56. Doğan, S.Z.; Arditi, D.; Günaydin, H.M. Determining Attribute Weights in a CBR Model for Early Cost Prediction of Structural Systems. J. Constr. Eng. Manag. 2006, 132, 1092–1098. [Google Scholar] [CrossRef]
  57. Du, J.; Bormann, J. Improved similarity measure in case-based reasoning with global sensitivity analysis: An example of construction quantity estimating. J. Comput. Civ. Eng. 2014, 28, 04014020. [Google Scholar] [CrossRef]
  58. Torija, A.J.; Ruiz, D.P. A general procedure to generate models for urban environmental-noise pollution using feature selection and machine learning methods. Sci. Total Environ. 2015, 505, 680–693. [Google Scholar] [CrossRef] [PubMed]
  59. Richter, M.M.; Weber, R.O. Case-Based Reasoning: A Textbook; Springer: Berlin/Heidelberg, Germany, 2013. [Google Scholar]
  60. Kim, B.; Hong, T. Revised case-based reasoning model development based on multiple regression analysis for railroad bridge construction. J. Constr. Eng. Manag. 2011, 138, 154–162. [Google Scholar] [CrossRef]
  61. Pereira, E.; Hermann, U.; Han, S.U.; AbouRizk, S. Case-based reasoning approach for assessing safety performance using safety-related measures. J. Constr. Eng. Manag. 2018, 144, 04018088. [Google Scholar] [CrossRef]
  62. Everitt, B.S.; Landau, S.; Leese, M.; Stahl, D. Miscellaneous Clustering Methods in Cluster Analysis, 5th ed.; John Wiley & Sons: Chichester, UK, 2011. [Google Scholar]
  63. Ahn, J.; Ji, S.H.; Park, M.; Lee, H.S.; Kim, S.; Suh, S.W. The attribute impact concept: Applications in case-based reasoning and parametric cost estimation. Autom. Constr. 2014, 43, 195–203. [Google Scholar] [CrossRef]
  64. Salleh, S.S.; Aziz, N.A.A.; Mohamad, D.; Omar, M. Combining Mahalanobis and Jaccard Distance to Overcome Similarity Measurement Constriction on Geometrical Shapes. IJCSI 2012, 9, 124–132. [Google Scholar]
  65. McLachlan, G.J. Discriminant Analysis and Statistical Pattern Recognition; Wiley & Sons: Hoboken, NJ, USA, 1992. [Google Scholar]
  66. Pal, S.K.; Shiu, S.C. Foundations of Soft Case-Based Reasoning; John Wiley & Sons: Hoboken, NJ, USA, 2004. [Google Scholar]
  67. Niwattanakul, S.; Singthongchai, J.; Naenudorn, E.; Wanapu, S. Using of jaccard coefficient for keywords similarity. In Proceedings of the International Multi Conference of Engineers and Computer Scientists, Hong Kong, China, 13–15 March 2013. [Google Scholar]
  68. Saaty, T.L. How to make a decision: The analytic hierarchy process. Eur. J. Oper. Res. 1990, 48, 9–26. [Google Scholar] [CrossRef]
  69. Saaty, T.L. Decision making with the analytic hierarchy process. Int. J. Serv. Sci. 2008, 1, 83–98. [Google Scholar] [CrossRef]
  70. Al Harbi, K. Application of AHP in project management. Int. J. Proj. Manag. 2001, 19, 19–27. [Google Scholar] [CrossRef]
  71. Shapira, A.; Goldenberg, M. AHP-based equipment selection model for construction projects. J. Constr. Eng. Manag. 2005, 131, 1263–1273. [Google Scholar] [CrossRef]
  72. Kaya, T.; Kahraman, C. Multi-criteria renewable energy planning using an integrated fuzzy VIKOR & AHP methodology: The case of Istanbul. Energy 2010, 35, 2517–2527. [Google Scholar]
  73. Pan, N. Fuzzy AHP approach for selecting the suitable bridge construction method. Autom. Constr. 2008, 17, 958–965. [Google Scholar] [CrossRef]
  74. Burkhard, H.D. Similarity and distance in case based reasoning. J. Fundam. Inf. 2001, 47, 201–215. [Google Scholar]
  75. Dattorro, J. Convex Optimization & Euclidean Distance Geometry; Meboo Publishing: Palo Alto, CA, USA, 2008. [Google Scholar]
Figure 1. CBR-based noise prediction model considering distance measurements.
Sustainability 11 00871 g001
Figure 2. Experiment design.
Sustainability 11 00871 g002
Figure 3. Absolute Error Rate (5, 10, 20-NN) comparison for 10 test cases depending on distance measurements.
Sustainability 11 00871 g003
Figure 4. Summary of error rates (5, 10, 20-NN) for noise prediction depending on distance measurements.
Sustainability 11 00871 g004
Table 1. Distance measurement methods employed in previous research.
AuthorsResearch Objective
and Scope
Attribute WeightingAttribute
Types
Consideration of AttributesSimilarity Distance MeasurementsValidation
Ahn et al. 2017To confirm the estimation accuracy and similarity with case retrievalGA, HFFNominal,
numeric
LCEuclidean distance, Arithmetic summation, Fractional function, Mahalanobis distanceLeave-one-out cross-validation
Ding et al. 2018To develop a framework for a project transaction mode design based on CBRAHPNominal,
numeric
PCThree-level scoring, Variable interpolation scoring
Euclidean distance
Comparison with retrieved cases
Doğan et al. 2006To compare the accuracy of the optimization techniquesFC, GA, GDNominal,
numeric
LCEuclidean distanceComparison with retrieved cases
Du and Bormann 2014To improve traditional similarity measures for quantity takeoff based on CBR SA, ANNNominal,
numeric
LCWeighted Mahalanobis distanceK-fold cross-validation
Jin et al. 2012To improve the cost estimation performance based on CBRMRANumericPCNearest neighbor matchingComparison with retrieved cases
Kim and Kim (2010)To propose a CBR-based preliminary cost prediction model using a genetic algorithmGANominal,
numeric
LCMultiplication of weight and attribute similarityComparison with retrieved cases
Kwon et al. 2017To predict the noise and vibration coming from construction based on CBRAHPNumericLCEuclidean distanceComparison with retrieved cases
Kwon et al. 2019To estimate a compensation cost related to noise based on CBRFuzzy-AHPNumericLCEuclidean distanceComparison with retrieved cases
Leśniak and Zima (2018)To estimate a cost considering environmental impact of the building based on CBRMRANominal,
numeric
PCFuzzy-based local similarityComparison with retrieved cases
Ryu et al. 2007To develop a construction planning system based on CBRInterviews Nominal,
numeric
LCNearest neighbor matchingComparison with retrieved cases
Zhang et al. 2017To propose a framework for searching the optimal process for deep foundation constructionAHPNominal,
numeric
LCMinkowski distanceK-fold cross-validation
Note: 1 AHP = analytic hierarchy process, ANN = artificial neural network, FC = feature counting, GA = genetic algorithm, GD = gradient descent, HFF = hypothesis fitness function, MRA = multi regression analysis, SA = sensitivity analysis. 2 VLC = Very limited consideration, LC = Limited consideration, PC = Proper consideration.
Table 2. Configuration of case features and weights modified from Kwon et al. (2019).
Data TypeAttributeAttribute TypeMeasurement ScaleAttribute Weight
Project-related general dataProject duration (day)NumericReal number0.0702
Site area (m2)NumericReal number0.057
Gross area (m2)NumericReal number0.0561
Number of floorsNumericInteger0.0615
Working days (day)NumericReal number0.0983
Distance with neighbors (m)NumericReal number0.1117
Height of noise barrier (m)NumericReal number0.0873
Nose-related dataExcavatorNominalYes or No0.0536
Dump truckNominalYes or No0.0497
AugerNominalYes or No0.0684
Pump carNominalYes or No0.0646
Concrete mixerNominalYes or No0.0499
BreakerNominalYes or No0.0948
crusherNominalYes or No0.0767
Table 3. Input and profiles of 10 selected test cases.
Case NumberBuilding TypeProject-Related Information (PI)Noise-Related Information (NI)
PI1PI2PI3PI4PI5PI6PI7NI1NI2NI3NI4NI5NI6NI7
1Apartment91435,35794,86327641660-
2Apartment55077982262242531.6---
3Hospital2918932394923662--
4Apartment133877,256210,399 30233 6 10
5Apartment945125,366341,038373134.523-
6Commercial 20282019584202 64--
7Multi-family housing2228872218521021.5---
8Church2771196299278764--
9Multi-family housing11732765155223--
10Office67024,59136,886127248--
Note: (1) PI1 = duration; PI2 = site area; PI3 = gross floor area; PI4 = number of floors; PI5 = working days; PI6 = distance to neighboring areas; PI7 = height of barriers; NI1 = excavator; NI2 = dump truck; NI3 = auger; NI4 = pump car; NI5 = concrete mixer; NI6 = breaker; NI7 = crusher. (2) The symbol ‘–’ presents that the equipment was primarily employed in construction.
Table 4. Case similarity for 10 test cases.
CaseEuclideanJaccard and Euclidean
1-NN5-NN10-NN15-NN20-NN25-NN30-NN1-NN5-NN10-NN15-NN20-NN25-NN30-NN
10.922 0.907 0.890 0.870 0.840 0.813 0.793 0.958 0.949 0.940 0.930 0.919 0.911 0.905
20.920 0.904 0.894 0.883 0.858 0.831 0.812 0.957 0.948 0.943 0.937 0.925 0.913 0.903
30.987 0.972 0.947 0.922 0.886 0.854 0.831 0.993 0.985 0.971 0.958 0.945 0.935 0.926
40.900 0.881 0.855 0.820 0.793 0.774 0.759 0.946 0.936 0.922 0.911 0.903 0.896 0.891
50.900 0.828 0.802 0.774 0.752 0.736 0.724 0.946 0.907 0.893 0.884 0.876 0.869 0.863
60.946 0.909 0.848 0.807 0.783 0.766 0.753 0.971 0.951 0.925 0.912 0.901 0.894 0.887
70.952 0.937 0.901 0.870 0.836 0.813 0.797 0.974 0.966 0.946 0.931 0.919 0.909 0.901
80.986 0.971 0.945 0.914 0.877 0.846 0.824 0.993 0.984 0.970 0.954 0.941 0.931 0.921
90.962 0.890 0.848 0.806 0.778 0.760 0.747 0.979 0.940 0.925 0.914 0.903 0.895 0.887
100.906 0.898 0.849 0.808 0.785 0.769 0.756 0.949 0.945 0.924 0.910 0.901 0.895 0.890
Avg.0.938 0.910 0.878 0.847 0.819 0.796 0.780 0.967 0.951 0.936 0.924 0.913 0.905 0.897
Table 5. Experiment results for 10 test cases.
CaseOriginalPredicted Noise Level (dBA)Absolute Error Rate (AER, %)
EuclideanJaccard and EuclideanEuclideanJaccard and Euclidean
5-NN10-NN15-NN20-NN25-NN30-NN5-NN10-NN15-NN20-NN25-NN30-NN5-NN10-NN15-NN20-NN25-NN30-NN5-NN10-NN15-NN20-NN25-NN30-NN
165.5 60.6 59.3 58.4 58.6 58.4 58.5 60.6 59.3 58.6 59.2 59.2 59.3 7.489.4710.7910.5310.8510.627.489.4710.489.589.569.44
277.582.7 82.7 83.7 83.7 84.1 84.0 82.7 82.7 83.7 83.6 83.6 83.9 6.716.657.968.038.468.346.716.657.967.847.928.24
370.0 66.3 66.0 65.3 65.6 65.7 66.6 66.3 66.0 65.5 66.3 66.2 67.3 5.295.796.716.296.174.905.295.796.485.365.373.81
472.570.5 72.3 73.4 73.1 73.2 72.9 70.5 71.9 71.8 72.4 72.6 72.9 2.760.341.240.830.990.552.760.900.920.170.190.55
573.5 71.5 74.9 76.3 76.0 75.8 75.1 71.5 73.7 75.9 75.2 75.1 75.0 2.721.903.763.373.102.112.720.273.312.352.122.00
685.097.7 99.4 97.4 96.0 94.8 94.5 97.7 97.8 95.3 94.3 94.5 94.9 14.917.014.512.911.611.214.915.112.111.011.211.6
775.0 77.4 76.5 78.5 77.5 77.3 77.2 77.4 76.5 77.6 77.4 76.7 76.1 3.202.004.673.273.042.873.202.003.423.202.321.44
871.5 69.2 69.1 68.8 68.7 68.9 69.6 69.2 69.1 69.8 69.5 69.8 69.8 3.223.363.783.953.692.633.223.362.422.832.432.42
990.5 99.3 102.2 103.4 104.0 104.8 106.2 99.3 102.1 103.3 103.9 104.6 104.8 9.7212.8714.2514.8615.7617.339.7212.8214.1814.8115.5415.80
1075.0 75.7 77.5 76.9 75.6 74.4 74.3 75.7 75.7 75.6 74.8 74.7 74.8 0.933.382.470.790.780.990.930.910.830.240.380.27
Mean Absolute Error Ratio (MAER)5.706.277.026.496.446.165.705.726.215.745.715.56
Table 6. Case similarity (1, 5, 10, 20, 30-NN) depending on the distance measurement methods.
Distance Measurement Method1-NN5-NN10-NN15-NN20-NN25-NN30-NN
Weighted Euclidean distance (WED)0.9247 0.8949 0.8689 0.8421 0.8174 0.7967 0.7799
Jaccard and Euclidean distance (JED)0.9592 0.9417 0.9280 0.9166 0.9069 0.8986 0.8914
Average0.9420 0.9183 0.8985 0.8793 0.8622 0.8476 0.8357
Table 7. Differences and absolute error rates depending on the distance measurement methods.
Distance MeasurementDifference (dBA)Absolute Error Rate (AER, %)
1-NN5-NN10-NN15-NN20-NN25-NN30-NN1-NN5-NN10-NN15-NN20-NN25-NN30-NN
Weighted Euclidean distance (WED)5.091 4.090 4.269 4.440 4.395 4.367 4.354 7.07%5.65%5.89%6.15%6.09%6.04%6.02%
Jaccard and Euclidean distance (JED)5.091 4.101 4.221 4.340 4.289 4.321 4.313 7.07%5.67%5.83%6.01%5.95%5.99%5.97%
Variations0−0.0110.0480.10.1060.0460.0410.00%0.02%0.06%0.14%0.14%0.05%0.05%

