Article

Shifts in Climatic Niche Occupation in Astrophytum Coahuilense (H. Möller) Kayser and Its Potential Distribution in Mexico

by
Gabriel Fernando Cardoza-Martínez
1,
Jorge Luis Becerra-López
2,
Citlalli Edith Esparza-Estrada
3,
José Luis Estrada-Rodríguez
4,
Alexander Czaja
4,
Muhammad Ehsan
5,
Eduardo Baltierra-Trejo
6 and
Ulises Romero-Méndez
7,*
1
Laboratorio de ecología pesquera, ictiología y acuacultura, Facultad de Ciencias Biológicas, Universidad Juárez del Estado de Durango. Avenida Universidad s/n, Fraccionamiento Filadelfia, Gómez Palacio, Durango 35010, México
2
Laboratorio de Cambio Climático y Conservación de Recursos Naturales, Centro de Estudios Ecológicos, Facultad de Ciencias Biológicas, Universidad Juárez del Estado de Durango. Avenida Universidad s/n, Fraccionamiento Filadelfia, Gómez Palacio, Durango 35010, México
3
Instituto Potosino de Investigación Científica y Tecnológica, División de Ciencias Ambientales. Camino a la Presa San José No. 2055, Colonia Lomas 4ª. Sección, San Luis Potosí, San Luis Potosí 78216, México
4
Laboratorio de Ecología y Evolución, Centro de Estudios Ecológicos, Facultad de Ciencias Biológicas, Universidad Juárez del Estado de Durango. Avenida Universidad s/n, Fraccionamiento Filadelfia, Gómez Palacio, Durango 35010, México
5
Colegio de Postgraduados, Programa de Edafología, Carretera México-Texcoco km. 36.5, Montecillo, Texcoco, Estado de México 56230, México
6
CONACyT-Universidad Juárez Autónoma de Tabasco. Laboratorio de Remediación, División Académica de Ciencias Biológicas, Carretera Villahermosa-Cárdenas km 0.5, Villahermosa, Tabasco 86150, México
7
Laboratorio de Sistemas de información Geográfica, Centro de Estudios Ecológicos, Facultad de Ciencias Biológicas, Universidad Juárez del Estado de Durango. Avenida Universidad s/n, Fraccionamiento Filadelfia, Gómez Palacio, Durango 35010, México
*
Author to whom correspondence should be addressed.
Sustainability 2019, 11(4), 1138; https://doi.org/10.3390/su11041138
Submission received: 5 December 2018 / Revised: 21 January 2019 / Accepted: 18 February 2019 / Published: 21 February 2019
(This article belongs to the Section Environmental Sustainability and Applications)

Abstract

:
It has frequently been reported that species with strong niche conservatism will not be able to adapt to new climatic conditions, so they must migrate or go extinct. We have evaluated the shifts in climatic niche occupation of the species Astrophytum coahuilense and its potential distribution in Mexico. We understand niche occupation as the geographic zones with available habitats and with the presence of the species. To assess shifts in climatic niche occupation, we used niche overlap analysis, while potential distribution modeling was performed based on the principle of maximum entropy. The results indicate that this species presents a limited amplitude in its climate niche. This restriction of the climatic niche of A. coahuilense limits its ability to colonize new geographical areas with different climatic environments. On the other hand, the potential distribution models obtained from the present study allow us to identify potential zones based on the climatic requirements of the species. This information is important to identify high priority areas for the conservation of A. coahuilense.

1. Introduction

Mexico is the most important center of diversity for genus and species of cactus. Most of the species occur in arid or semiarid regions of the country, particularly in the southeastern part of the Chihuahuan Desert [1]. Cactaceae is one of the most threatened groups of plants, and is faced with conservation problems due to overexploitation and illegal trade [2]. Astrophytum coahuilense is an endemic cactus from Mexico that occurs in southwestern Coahuila and adjacent areas of Durango, México [3]. This species grows predominately on rock-strewn, calcareous terrain, together with conspicuous xerophytes, which include Larrea tridentata, Prosopis juliflora, Fouquiera splendens, Agave lechuguilla, Euphorbia antisyphilitica, and Hechtia sp. [4]. Moreover, A. coahuilense has a relatively small geographic range and faces several threats to its survival [4]. Its principal method of dispersion is hydrochloric, and its current range of distribution was established through lakes and rivers of the Pleistocene. Therefore, its current dispersal capacity is limited [5]. It has been mentioned that the main factors responsible for the decline of its populations are the fragmentation and reduction of habitat quality [6].
It is generally expected that endemic species with restricted distribution ranges would be particularly threatened by alterations like climate [7,8]. It has been suggested that climatic variations would severely affect all species of Astrophytum, as most of their populations may experience extreme climatic conditions in the next decades [7,9]. Nevertheless, in response to these threats and in seeking to evade extinction, species may track suitable environmental conditions in space or time, or adapt to the modified environment through acclimation [10].
Assuming that species need to migrate or adapt to changing environmental conditions, establishment success, and subsequent distribution within a given geographic range, is determined by the species’ association to abiotic variables such as climate. These associations can be interpreted through the niche concept [11]. The ecological niche of a species can be defined as the range of environmental and biotic conditions within which its populations can persist [12]. Two distinct formulations of the niche concept have been considered: 1) fundamental niche, which is genetically and physiologically determined, and 2) realized niche, which includes, additionally, constraints arising from interspecific competition [13].
Species distribution has been studied from a niche conservatism perspective (the tendency of species to retain ancestral ecological characteristics [14]) and niche shift perspective (any change in the position of either the fundamental or realized niche of a species [15]), or both [13]. In this way, niche conservatism and niche shifts can have important implications for understanding the effects of climate change on species distribution [14,15].
Niche conservatism has been evaluated in terms of statistical difference, i.e., “niche similarity” (the geographical areas occupied by a species are more similar in climate than expected by chance) and “niche equivalence” (the geographic areas occupied by a species are climatically indistinguishable)” [16]. Nevertheless, the similarity and equivalence tests only reveal statistically significant differences in species climate niches, but not the causes underlying such niche shifts [17,18]. Hence, absolute values of “equivalence” and “similarity” have little biological significance unless niche shifts are disentangled from their main drivers of change, namely “niche unfilling” and “niche expansion” [19,20].
The threat of environmental disruption for biodiversity can be analyzed from the perspective of niche conservatism [21]. Species with this characteristic will not have sufficiently broad climatic tolerance to acclimatize to the new environmental conditions of the habitat, and consequently they will have to emigrate or go extinct [22]. Those species that do not exhibit niche conservatism could increase their range beyond their native climatic environment, or adapt to new environmental conditions [13]. Considering the above, the question arises of whether A. coahuilense will have the capacity to occupy niches with different climatic conditions, and adapt to the new niches generated by global climate change and local climatic variations resulting from degradation of the habitat and human activities. Therefore, the aims of the present study are: i) to evaluate the shifts in climatic niche occupation in Astrophytum coahuilense, and ii) to model its potential distribution in Mexico. This allows us to infer the vulnerability of this species to climatic variations, and to identify potential sites for the conservation of this species.

2. Materials and Methods

2.1. Geographical Records

During 10 years of intermittent sampling, 32 records of A. coahuilense were identified inside and outside the distribution area proposed by Fitz-Maurice et al. [3,6]. Each record corresponds to a population of this species (Figure 1). Within this area, three zones with the presence of this cactus were classified (considering the political division and geographical distances): zone A (15 records) included Sierra de Jimulco and Sierra de las Noas in Coahuila, zone B (9 records) included Sierra el Sarnoso and Sierra de Lerdo in Durango, and zone C (4 records) included Sierra de Parras and Sierra de Mayrán in Coahuila. Four records were located outside the distribution area proposed by Fitz-Maurice et al. [3,6], three to the southwest in the state of Nuevo León (Sierra de las Mitras) and one to the southeast in the state of Coahuila (Sierra de la Paila). In the zones identified, the minimum distance between the records of presence of A. coahuilense was at least one kilometer. All geographic records were visualized in the Google Earth program in order to verify their accuracy (Figure 1).

2.2. Climatic Variables

Climatic information was obtained from 19 current climatic layers and elevation data, available in WorldClim database version 1.4 [23]. These layers contain climatic averages of weather conditions recorded from 1950–2000 with a spatial resolution of 30 arc-seconds (~1 km). For the selection of environmental variables, 10,000 background points were added to the polygon distribution area of A. coahuilense proposed by Fitz-Maurice et al. [3,6] (Figure 1). The information of the 19 environmental variables from the current climate was added to these points. With the generated information, a bivariate correlation analysis was conducted in order to reduce the multicollinearity between the input variables [24,25]; predictor variables that were highly correlated (|r| ≥ 0.7) were excluded. The addition of 10,000 random points was based on the criteria of not discriminating (non-repetitive) relevant information, but segregated geographical areas within the range of the A. coahuilense climatic information [26]. With the aforementioned variables, the climatic profile of A. coahuilense was generated. Using a principal component analysis (PCA), the distribution of the species in the climatic environment was identified using the software R, (R version 3.1.3, library ecospat; [27]).

2.3. Niche Overlap

From geographical records of A. coahuilense distributed in zone A and zone B, and from the six climatic variables retained in the correlation analysis, the climatic niche differentiation was evaluated. Zone C and records outside of the distribution area of A. coahuilense proposed by Fitz-Maurice et al. [3,6] were not considered for this analysis because they did not reach the minimum number of geographic registers recommended by Broennimann et al. [27]. The principal component analysis (PCA) approach proposed by Broennimann et al. [19] was used to measure equivalence and similarity between the realized niche of zone A and the realized niche of zone B (with the variables retained in bivariate correlation analysis). This method compares the environmental conditions available for a species within a defined study extent (background) with its observed occurrences, and it calculates the available environmental space defined by the first two axes from the PCA. This method corrects for sampling bias using a smooth kernel density function [19].
The niche overlap between zone A and B was calculated using Schoener’s D-metric [28], which varies from 0 (no overlap between niches) to 1 (complete overlap). The niche equivalency and similarity tests were built from the methodology described in Broennimann et al. [19]. The niche equivalency test determines whether niches of two entities in two geographical ranges are equivalent (i.e., whether the niche overlap is constant when randomly reallocating the occurrences of both entities among the two ranges). All occurrences are pooled and randomly split into two datasets, maintaining the number of occurrences as in the original dataset. This process is repeated 100 times to ensure that the null hypothesis can be rejected with high confidence.
If the observed value of D falls within the density of 95% of the simulated values, the null hypothesis of niche equivalency cannot be rejected. Therefore, the niche similarity test differs from the equivalency test because the former examines whether the overlap between observed niches in two ranges is different from the overlap between the observed niche in one range and niches selected at random from the other range. The test of niche similarity is also based on 100 repetitions. If the observed overlap is greater than 95% of the simulated values, the entity occupies environments in both of its ranges that are more similar to each other than expected. The proportion of the niche in zone B that was also measured was stable (i.e., the niche B overlapping with the niche zone A), unfilled (i.e., a partial filling of the zone A niche in the zone B range), and expanding (i.e., the invaded niche non-overlapping with the native niche) compared to its native niche [17,20]. The niche overlap analysis works with a minimum of five geographic records for each evaluated species. All analyses were computed with the ecospat [27] package in R 3.1.3 [29].

2.4. Niche Modeling

A maximum entropy model (MaxEnt, version 3.3.3k) [30,31] was used to represent the potential distribution of A. coahuilense. The MaxEnt model was chosen because it uses presence–background data (i.e., randomly selected absences from areas that have been accessible to the species). It generally has a better performance than presence–absence models, but absence data may not be reliable. A species may go undetected or it may not have had sufficient time to disperse to new locations yet [32]. Another advantage of MaxEnt relevant to this study is that it can handle small samples of a species’ presence data [33].
MaxEnt predicts habitat suitability as a function of environmental variables and species occurrence data. This habitat suitability is represented by a scale ranging from 0 (low suitability) to 1 (high fitness) [32,34,35,36]. Proper calibration and evaluation are necessary to reduce the complexity of the model [37], considering the choice of: i) accessible area (background or M area), ii) the type of variables that MaxEnt constructs (features), and iii) the type of model output (raw, cumulative, or logistic), as these considerations affect the inferences to be made [24]. Proper calibration and evaluation is also especially important for data sets suffering from sampling bias, and for studies that require transfer models through space or time [38,39].
In this study, the calibration and evaluation method for A. coahuilense modeling were carried out using the library "ENMeval" [40] in the statistical software R 3.1.3 [29]. This study considered the 28 geographic records located within the distribution area of A. coahuilense proposed by Fitz-Maurice et al. [3,6] and the six climatic variables identified above, in addition to the variable of altitude. The calibrated model was evaluated by calculating the coefficient standardized Akaike information criterion (AICc). The AICc provides information on the relative quality of a model [37]. Because the AICc is calculated using the data set, it is not affected by the method chosen for the data partition [40]. The model with the lowest AICc was selected as the best fit for the species.
The information obtained from the calibrated model was projected to Mexico, considering the environmental variables described above and the soil layers of litosol and calcareous regosol, using the software MaxEnt [30]. There were 100 repetitions performed [41] to obtain an ecological niche model, geographically represented as a map of habitat suitability under current climatic conditions for A. coahuilense. This model was converted to an absence/presence map using maximum test sensitivity plus specificity, and considering only areas of presence that coincided with the distribution of rosetophilous desert scrub [42] and limestone soil [43]. This species requires the presence of this type of soil and vegetation (4). For the validation of the model, the value of AUC (Area under the ROC curve) was considered. Also, records located outside the distribution area of A. coahuilense proposed by Fitz-Maurice et al. [3,6] were used to validate the model.
The importance of each bioclimatic variable in the observed distribution of A. coahuilense was evaluated according to the relative importance of each variable, which was obtained by adding the percentage of contribution (PC) and the importance of permutation (IP), evaluated by MaxEnt, and the result was divided by two (average contribution (PC + IP)/2) [44].

3. Results

3.1. Climatic Variables

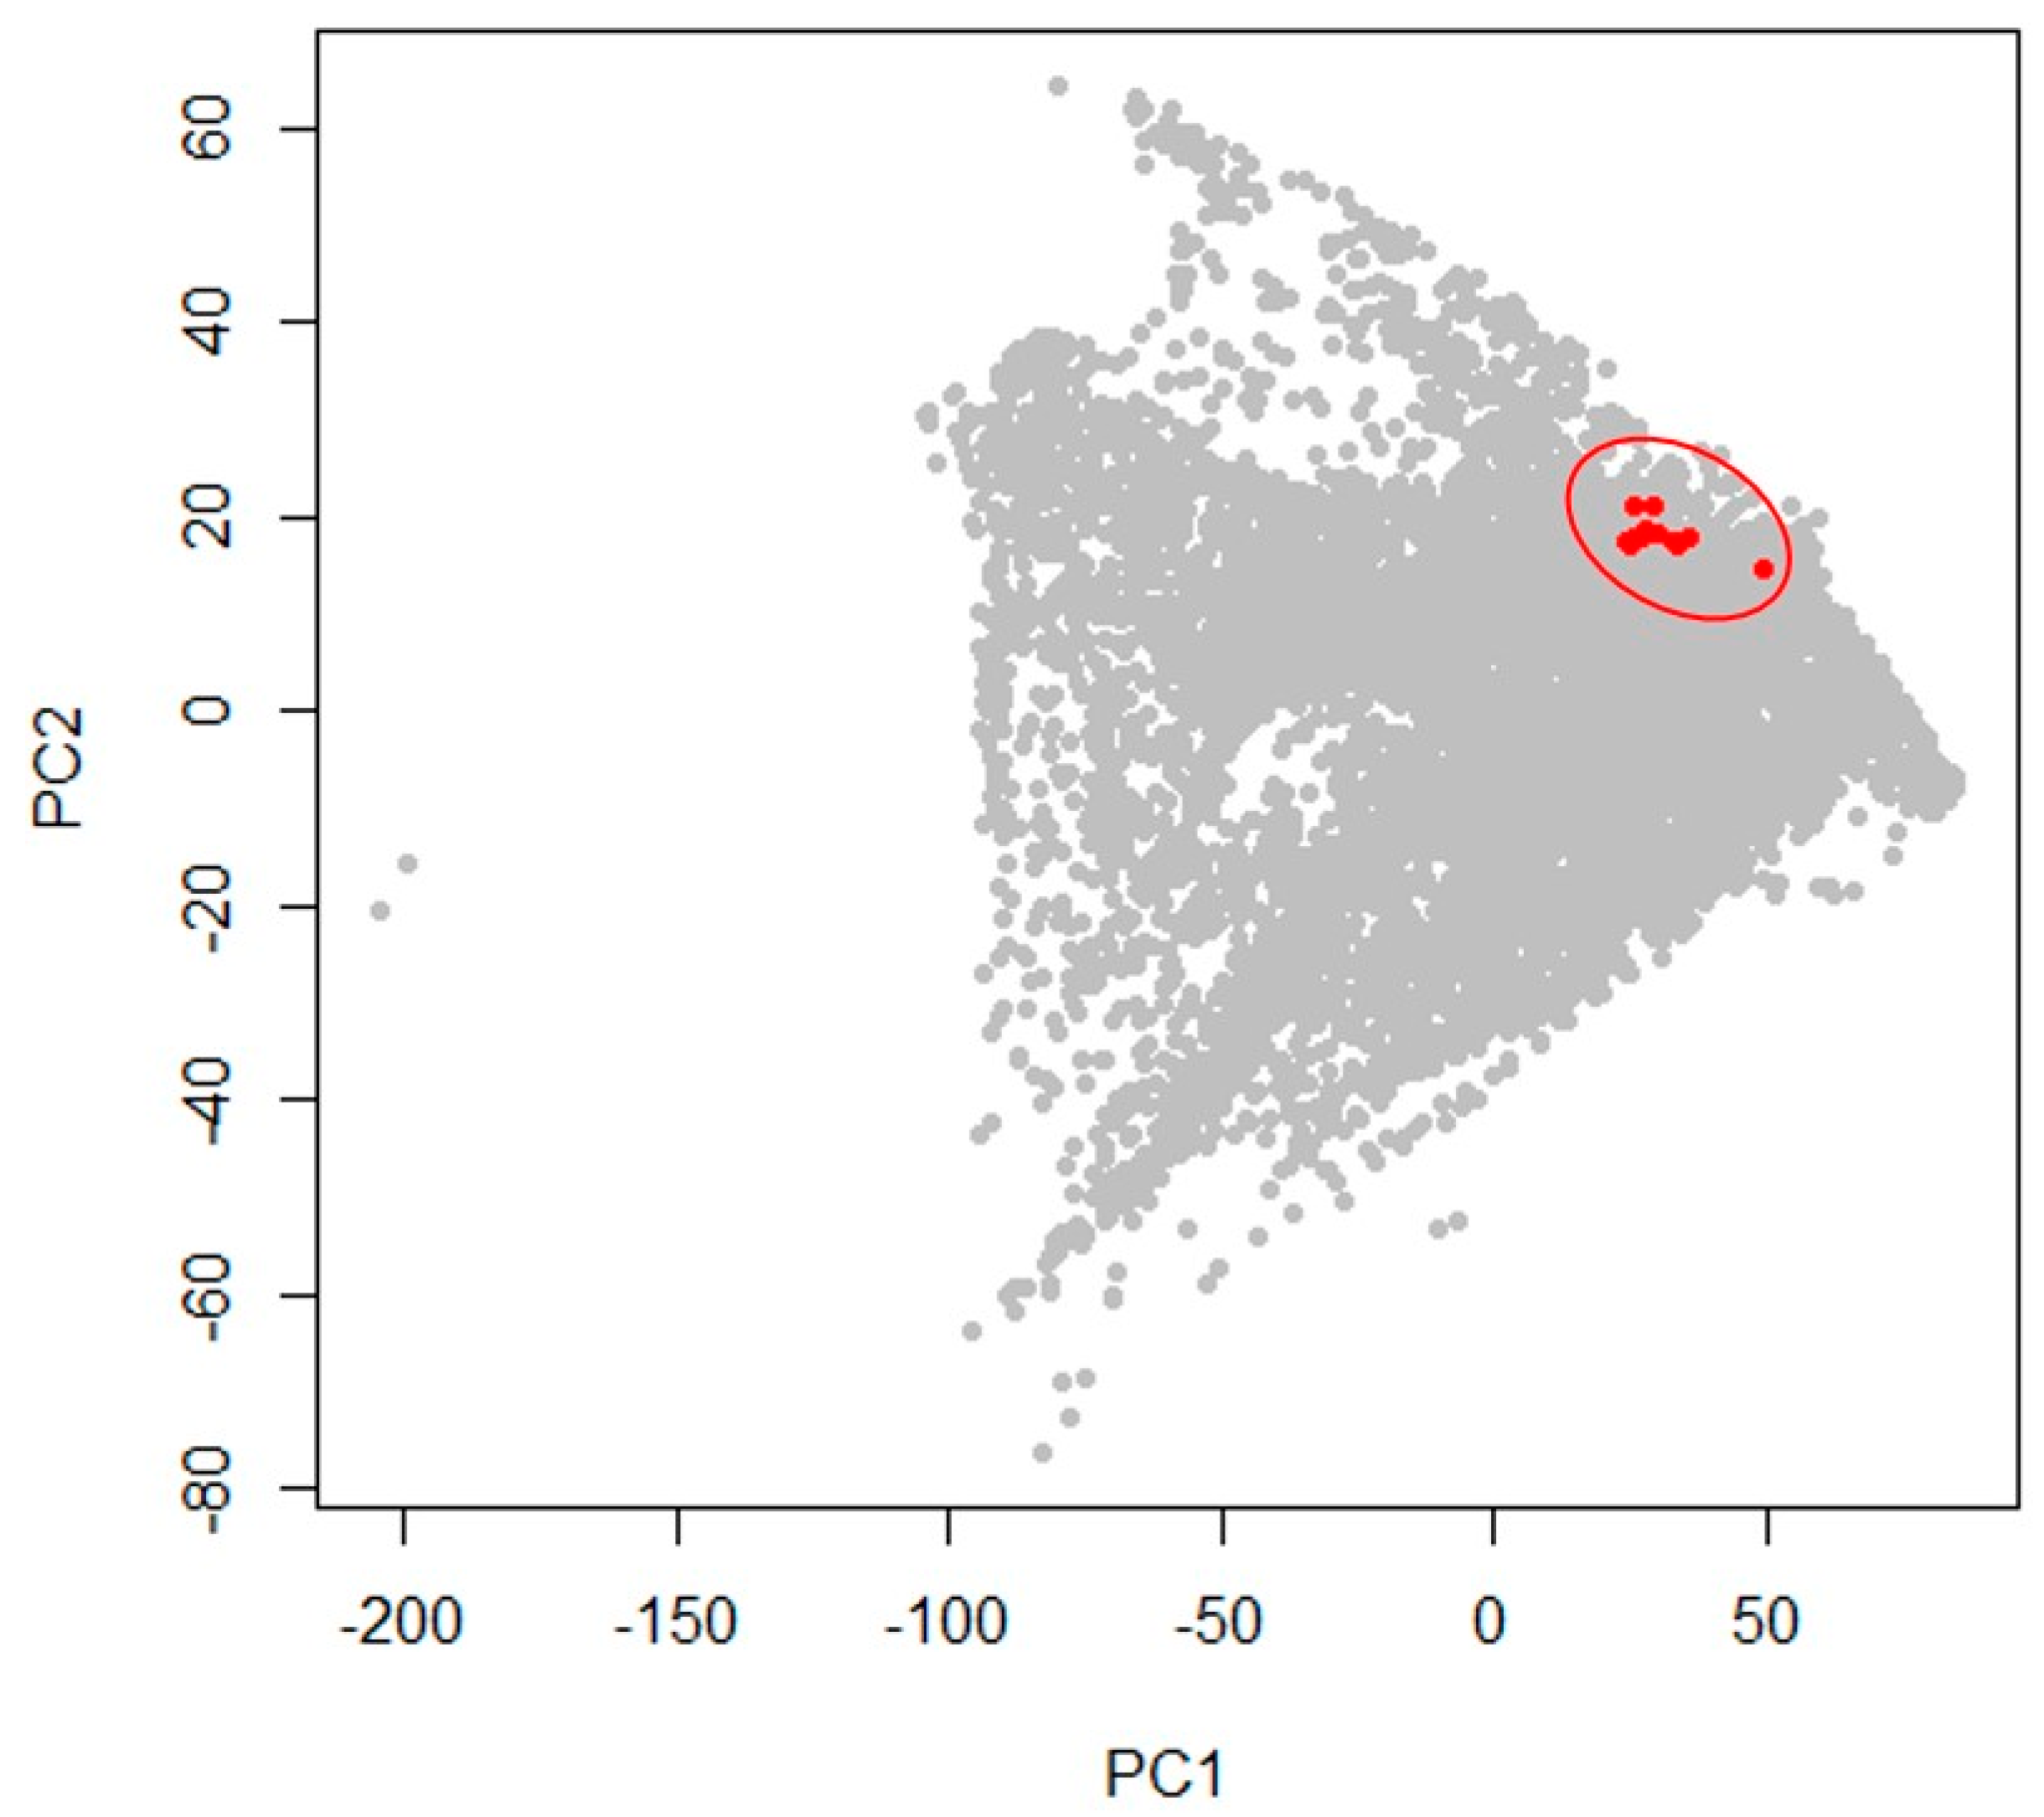
The following six climatic variables were retained from the bivariate correlation analysis: Annual Mean Temperature (bio1), Mean Diurnal Range (bio2), Max Temperature of Warmest Month (bio5), Precipitation of Driest Quarter (bio17), Precipitation of Warmest Quarter (bio18), and Precipitation of Coldest Quarter (bio19). The climatic ranges and distribution of A. coahuilense in the environmental context are shown in Table 1 and Figure 2.

3.2. Niche Overlap

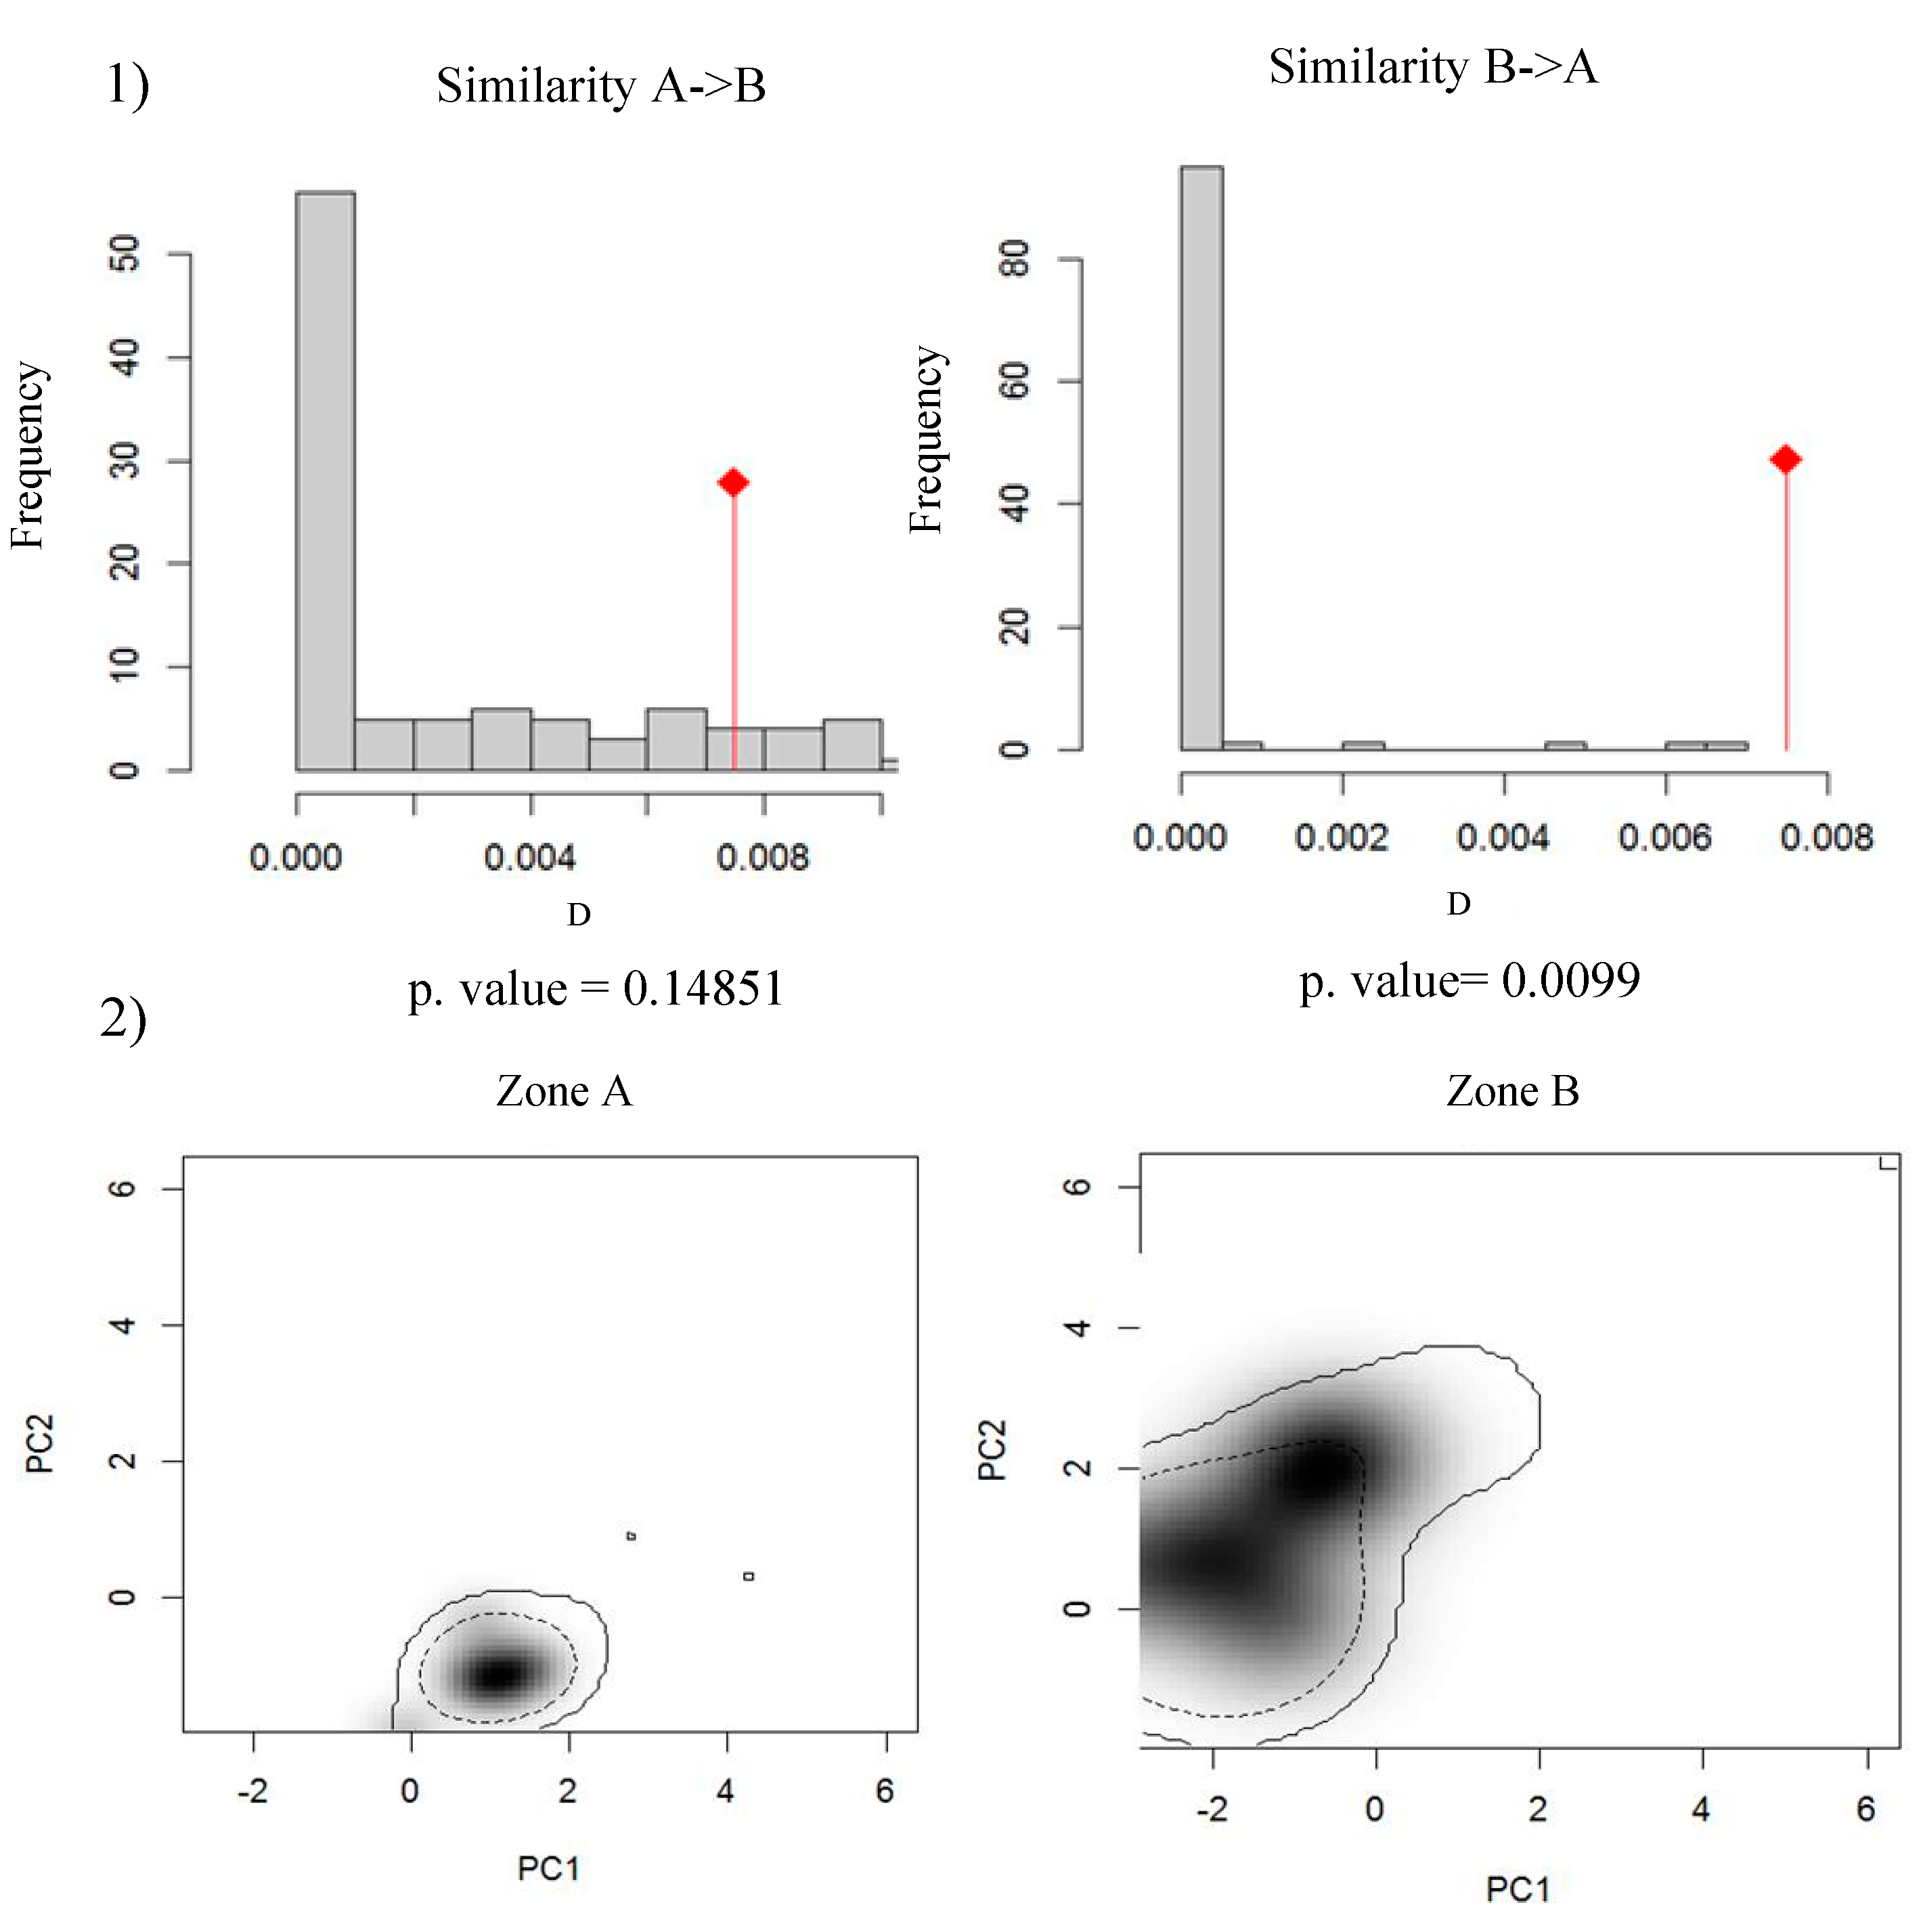
The equivalence of the realized niche of zone A and zone B was significant (p < 0.05). The similarity test between the realized niche of zone A and zone B gave a value of D = 0.007 and was not significantly different (p = 0.148). Zone B, compared to zone A, gave a value of D = 0.007 and was significantly different (p = 0.009). In addition, the analysis shows that zone B, with respect to zone A, had a value of expansion of 0.921, a stability value of 0.078, and a niche unfilled value of 0.009 (Figure 3).

3.3. Niche Modeling

The model had an AUC value greater than 0.95 (which indicated a model with good reliability), and predicted areas with habitat suitability at the geographic points used to validate the model. According to the analysis of relative importance, the elevation variable presented a high percentage of contribution and importance of permutation, which allowed it to obtain 86.9% in the relative importance for the distribution of A. coahuilense. On the other hand, the variable Precipitation of Coldest Quarter had lower scores than those of Precipitation of Warmest Quarter, with respect to the contribution percentage (19.9% and 24.9%, respectively). However, the values of permutation importance were higher in Precipitation of Coldest Quarter than in Precipitation of Warmest Quarter (14.5% and 0.5%, respectively), which allowed it to obtain a 26.95% of relative importance. The variable with the lowest relative importance was Max Temperature of Warmest Month (Table 2).
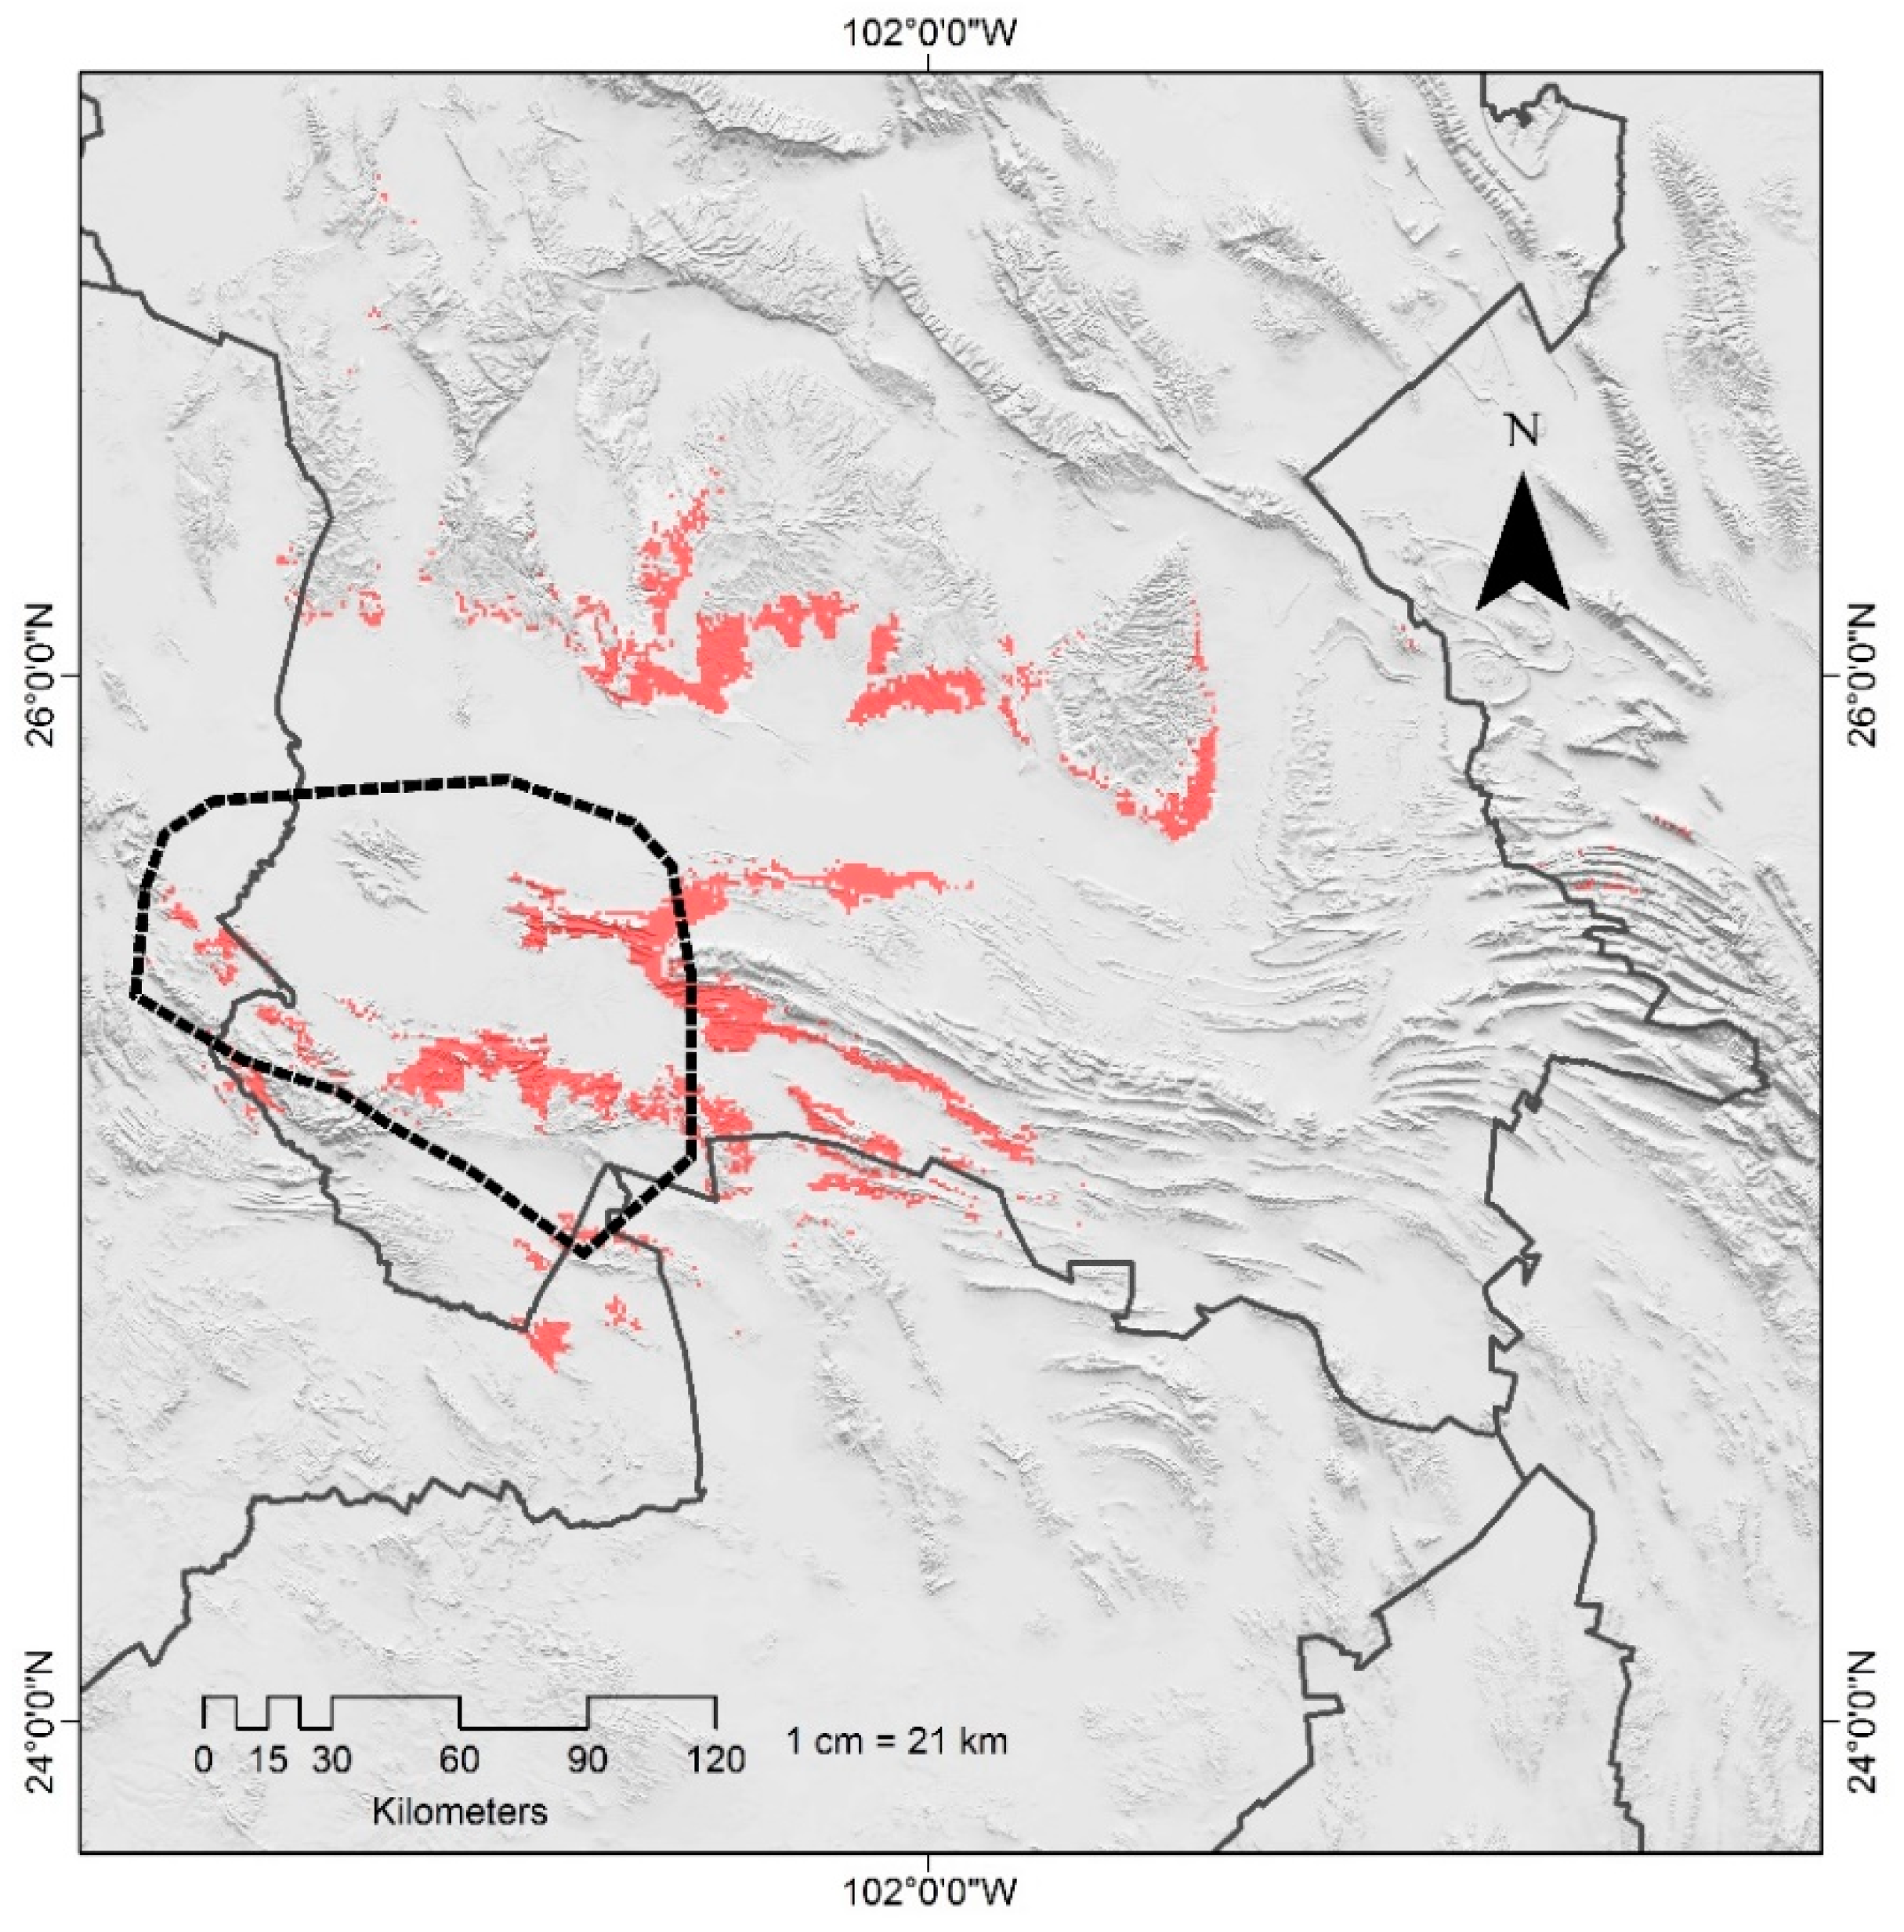
The model indicated a habitat suitability area of 3909.778km2, distributed in the northeast of the state of Durango, south of Coahuila, north of Zacatecas, and northwest of Nuevo León. Within the distribution area of A. coahuilense proposed by Fitz-Maurice et al. [3,6] the model indicated a habitat suitability area of 914.03 km2 (Figure 4).

4. Discussion

The successful establishment and subsequent distribution of a species correlates with climatic conditions more strongly than with other factors, at least at wide spatial resolutions [11,45,46,47]. However, one species can occupy different climatic environments through its geographical distribution. For example, different analyses have reported that plant species with a wide distribution occupy different niches [48,49]. Likewise, research of plant species across seven regions (located along an ~1800 km latitudinal gradient, from northern France to central Sweden and Estonia via Belgium, western and eastern Germany, and southern Sweden) showed that these species occupy different niches along a latitudinal gradient [10]. In this regard, the occupation of different niches by a species may have important implications for understanding their vulnerability to the effects of climate change [14].
We found that, within the distribution area of A. coahuilense proposed by Fitz-Maurice et al. [3,6], the equivalence analysis shows that zone A and zone B were statistically significant; therefore, there is no evidence to accept the null hypothesis of equivalence proposed by Warren, et al. [16], enabling us to interpret that the evaluated niches are ecologically distinct. Niche overlap between zone A and zone B was low. Climatic similarity tests indicate that zone A did not present statistically significant differences when compared with zone B, while zone B showed significant statistical values compared to zone A. In this regard, it has been mentioned that the climate niche will be similar only if the test is significant in both directions [16]. Under these criteria, the results of the similarity test allow us to reject the null hypothesis of climatic similarity proposed by Broennimann et al. [19], suggesting that the realized niche of A. coahuilense in zone A and zone B is climatically distinct. In this regard, most of the studies that indicate the occupation of different niches by a species have been documented in widely distributed species [50]. Our results provide evidence that this characteristic can also occur in species that have a restricted distribution.
Previous studies have recognized niche shifts in an extensive variety of taxa, but causes of these changes remain poorly understood [20]; however, the differences in niche occupation of a species can arise through niche expansion or niche unfilling [51]. The niche expansion is assumed a true niche change, while the unfilled niche is partially filled by the native niche in the invaded range [19]. Our results indicate that A. coahuilense, within the realized niche of zone B, only covers 7% of the environmental conditions occupied in the realized niche of zone A. Regarding niche expansion, our results indicate high values in zone B (92%). This suggests that the absence of climatic similarity obtained in this study can be explained, to a greater extent, by the occupation of new climatic environments in the realized niche in zone B. On the other hand, it is considered that the unfilled niche seems to be larger for species introduced more recently and into a smaller number of locations, compared to those with ancient colonization histories introduced at several points in the geographic timeline [51].
Based on the aforementioned, our results indicate that the colonization potential of A. coahuilense in this region might be extremely low, which may explain the highly disjunct distribution in Coahuila, Durango, and Nuevo León. This can be explained by the historic biogeography of A. coahuilense. It has already been documented that species is hydrochoric [5], and its principal method of dispersion was through extinct paleolithic lakes and rivers of the Pleistocene [52,53]. Likewise, it is possible to indicate that the occupation of new climatic niches by A. coahuilense occurs over thousands or millions of years. According to Webb et al. [54] and Ackerly [55], this characteristic corresponds to the species that presents with conservatism of its climatic niche.
The threat of global climate change to biodiversity can be viewed from a niche conservatism perspective [56,57]. If the climatic tolerance of a species is not wide enough to encompass the new conditions or to acclimatize to them, the species with strong climatic niche conservatism must either migrate or go extinct, whereas, more evolutionarily labile species can potentially adapt [56,57]. In this way, the presence of niche conservatism in A. coahuilense, in addition to the low dispersion capacity, could mean that this species does not have the capacity to adapt to the accelerated climate change that is currently occurring, increasing the risk of extinction of this species. As mentioned for several endemic species of mammals, birds, amphibians, reptiles, invertebrates, and plants [56,57]. In this regard, the vegetation structure plays a key role in the activity, feeding, and distribution of some organisms [58,59,60,61]. In the case of A. coahuilense, nurse plants provide microclimate to this organism, influencing its distribution [62]. Thus, it is possible to point out that the viability of the species depends, to a large extent, on the conservation of its habitat that allows it to cushion the adverse effects of climate change.
On the other hand, the model generated from records inside the distribution area proposed by Fitz-Maurice et al. [3,6] predicts the populations of A. coahuilense that were recorded in outside areas, according to said area proposed by Fitz-Maurice. This indicates that these records are within the climatic niche considered in this study, and adding them will hardly improve the model. However, they are a good option to be used as validation criteria in testing the efficiency of the model. Likewise, this indicates that a better sampling effort was needed by Fitz-Maurice et al. [3,6] to take into consideration the new records of A. coahuilense proposed in this study.
The potential distribution models obtained from the present study allow us to identify potential zones based on the climatic requirements, elevation, and soil type of the species. Our results indicate a potential distribution area of 3909.778 km2 for A. coahuilense in northern Mexico. The estimated extent of occupation areas proposed by Fitz-Maurice et al. [3,6] is approximately 6000 km². However, our model indicates that the potential range within the distribution of A. coahuilense proposed by Fitz-Maurice et al. [3,6] is 914.03 km2, that is, over 5000 km2 is being overestimated. These differences may be due to the fact that these authors considered the hole polygon as habitat ocupated for the species. The area proposed from our results only considers areas with climate, soil, and adequate elevation for the presence of the species within the polygon that delimits this distribution.
Also, the distribution area of A. coahuilense proposed by Fitz-Maurice et al. [3,6] does not take into account records outside the considered range, which leads to underestimating the distribution of the species, whereas, the potential distribution model obtained in this study predicts records of A. coahuilense that were not considered by Fitz-Maurice et al. [3,6]. Based on the above, it is possible to point out that it is necessary to use the implementation of new methods, such as the modeling of species distribution, to allow a more efficient evaluation of the known range of the species. However, it is important to consider that to develop potential distribution models, it is necessary to take into account the largest number of subsets of the climatic niche that a species may have, which make up the niche of the species. In this way, we will avoid, as much as possible, modeling only a subset of its climate niche.
In conclusion, we can show that A. coahuilense occupies distinct niches inside the distribution area proposed by Fitz-Maurice, et al. [3,6]. However, the presence of niche conservatism cannot be ruled out. On the other hand, the potential distribution models obtained from the present study allow us to identify potential zones based on the climatic requirements of the species. This information is important to identify high priority areas for the conservation of A. coahuilense, as well as to identify new records of their presence, which may directly contribute to the conservation and management plans of this species.

Author Contributions

U.R.M., C.E.E.E. and J.L.B.L., conceptualization; U.R.M., C.E.E.E. and J.L.B.L., formal analysis; U.R.M., C.E.E.E., J.L.B.L., J.L.E.R., A.C., M.E. and G.F.C.M., investigation; U.R.M., C.E.E.E., J.L.B.L., J.L.E.R., A.C., M.E. and G.F.C.M., writing – original draft; U.R.M., C.E.E.E., J.L.B.L., J.L.E.R., A.C., M.E., G.F.C.M. and E.B.T., writing – review & editing; J.L.E.R. and A.C., resources.

Acknowledgments

To the head of the Centre for Ecological Studies of the Faculty of Biological Sciences of Juárez University of the State of Durango, for the facilities provided for the accomplishment of this research, and to the reviewers who enriched the work with their valuable observations, and thanks for the collaboration of Richard Bledsoe for his help with the translation.

Conflicts of Interest

We declare the absence of any conflicts of interests at the time of submission.

References

  1. Hernandez, H.M.; Godinez, H. Contribución al conocimiento de las cactáceas mexicanas amenazada. Acta Botánica Mexicana 1994, 26, 33–52. [Google Scholar]
  2. Meza-Rangel, E.; Tafoya, F.; Lindig-Cisneros, R.; Sigala-Rodríguez, J.J.; Pérez-Molphe-Balch, E. Distribución actual y potencial de las cactáceas Ferocactus histrix, Mammillaria bombycina y M. perezdelarosae en el estado de Aguascalientes, México. Acta Botánica Mexicana 2014, 108, 67–80. [Google Scholar] [CrossRef]
  3. Fitz-Maurice, B.; Sotomayor, M.; Fitz-Maurice, W.A.; Hernández, H.M.; Smith, M. Astrophytum coahuilense (Bonete de Obispo); Distribución Conocida; Catálogo de Metadatos Geográficos/Comisión Nacional para el Conocimiento y Uso de la Biodiversidad (CONABIO) México: 2013. Available online: http://www.conabio.gob.mx/informacion/gis (accessed on 30 November 2018). (In Spanish).
  4. Montanucci, R.R. Experimental Evidence for Reproductive Isolation between Astrophytum coahuilense (H. Möller) Kayser and A. Capricorne var. Senile (Fric) Okumura (Cactaceae). Haseltonia 2015, 20, 13–21. [Google Scholar] [CrossRef]
  5. Romero-Méndez, U.; Becerra-López, J.L.; García de la Peña, C.; Martínez-Ríos, J.J.; Czaja, A.; Muro, G.; Sánchez, J. Hydrochory in Astrophytum coahuilense: Experiment to identify seminal structures that provide its buoyancy. Polibotánica 2018, 46, 149–157. [Google Scholar]
  6. Fitz-Maurice, B.; Sotomayor, M.; Fitz-Maurice, W.A.; Hernández, H.M.; Smith, M. Astrophytum coahuilense (Amended Version of 2013 Assessment). The IUCN Red List of Threatened Species 2017: e.T152660A121483203. Available online: http://dx.doi.org/10.2305/IUCN.UK.2017-3.RLTS.T152660A121483203.en (accessed on 21 January 2019).
  7. Brown, J.H. On the relationship between abundance and distribution of species. Am. Nat. 1984, 124, 255–279. [Google Scholar]
  8. Johnson, C. Species extinction and the relationship between distribution and abundance. Nature 1998, 394, 272–274. [Google Scholar] [CrossRef]
  9. Baltzer, J.L.; Davies, S.J.; Noor, N.S.M.; Kassim, A.R.; LaFrankie, J.V. Geographical distributions in tropical trees: Can geographical range predict performance and habitat association in co-occurring tree species? J. Biogeogr. 2007, 34, 1916–1926. [Google Scholar] [CrossRef]
  10. Wasof, S.; Lenoir, J.; Gallet-Moron, E.; Jamoneau, A.; Brunet, J.; Cousins, S.A.; De Frenne, P.; Diekmann, M.; Hermy, M.; Kolb, A. Ecological niche shifts of understorey plants along a latitudinal gradient of temperate forests in north-western Europe. Glob. Ecol. Biogeogr. 2013, 22, 1130–1140. [Google Scholar] [CrossRef]
  11. Hill, M.P.; Terblanche, J.S. Niche overlap of congeneric invaders supports a single-species hypothesis and provides insight into future invasion risk: Implications for global management of the Bactrocera dorsalis complex. PLoS ONE 2014, 9, e90121. [Google Scholar] [CrossRef]
  12. Hutchinson, G.E. Concluding remarks Cold Spring Harbor Symposia on Quantitative Biology. Concluding Remarks 1957, 22, 415–427. [Google Scholar]
  13. Pearman, P.B.; Guisan, A.; Broennimann, O.; Randin, C.F. Niche dynamics in space and time. Trends Ecol. Evol. 2008, 23, 149–158. [Google Scholar] [CrossRef]
  14. Wiens, J.J.; Graham, C.H. Niche conservatism: Integrating evolution, ecology, and conservation biology. Annu. Rev. Ecol. Evol. Syst. 2005, 36, 519–539. [Google Scholar] [CrossRef]
  15. Broennimann, O.; Treier, U.A.; Müller-Schärer, H.; Thuiller, W.; Peterson, A.; Guisan, A. Evidence of climatic niche shift during biological invasion. Ecol. Lett. 2007, 10, 701–709. [Google Scholar] [CrossRef] [Green Version]
  16. Warren, D.L.; Glor, R.E.; Turelli, M. Environmental niche equivalency versus conservatism: Quantitative approaches to niche evolution. Evolution 2008, 62, 2868–2883. [Google Scholar] [CrossRef]
  17. Petitpierre, B.; Kueffer, C.; Broennimann, O.; Randin, C.; Daehler, C.; Guisan, A. Climatic niche shifts are rare among terrestrial plant invaders. Science 2012, 335, 1344–1348. [Google Scholar] [CrossRef]
  18. Strubbe, D.; Broennimann, O.; Chiron, F.; Matthysen, E. Niche conservatism in non-native birds in Europe: Niche unfilling rather than niche expansion. Glob. Ecol. Biogeogr. 2013, 22, 962–970. [Google Scholar] [CrossRef]
  19. Broennimann, O.; Fitzpatrick, M.C.; Pearman, P.B.; Petitpierre, B.; Pellissier, L.; Yoccoz, N.G.; Thuiller, W.; Fortin, M.J.; Randin, C.; Zimmermann, N.E.; et al. Measuring ecological niche overlap from occurrence and spatial environmental data. Glob. Ecol. Biogeogr. 2012, 21, 481–497. [Google Scholar] [CrossRef]
  20. Guisan, A.; Petitpierre, B.; Broennimann, O.; Daehler, C.; Kueffer, C. Unifying niche shift studies: Insights from biological invasions. Trends Ecol. Evol. 2014, 29, 260–269. [Google Scholar] [CrossRef]
  21. Wiens, J.J.; Ackerly, D.D.; Allen, A.P.; Anacker, B.L.; Buckley, L.B.; Cornell, H.V.; Damschen, E.I.; Davies, T.J.; Grytnes, J.A.; Harrison, S.P.; et al. Niche conservatism as an emerging principle in ecology and conservation biology. Ecol. Lett. 2010, 13, 1310–1324. [Google Scholar] [CrossRef] [Green Version]
  22. Holt, R.D. The microevolutionary consequences of climate change. Trends Ecol. Evol. 1990, 5, 311–315. [Google Scholar] [CrossRef]
  23. Hijmans, R.J.; Cameron, S.E.; Parra, J.L.; Jones, P.G.; Jarvis, A. Very high resolution interpolated climate surfaces for global land areas. Int. J. Climatol. 2005, 25, 1965–1978. [Google Scholar] [CrossRef] [Green Version]
  24. Merow, C.; Smith, M.J.; Silander, J.A., Jr. A practical guide to MaxEnt for modeling species’ distributions: What it does, and why inputs and settings matter. Ecography 2013, 36, 1058–1069. [Google Scholar] [CrossRef]
  25. Varela, S.; Anderson, R.P.; García-Valdés, R.; Fernández-González, F. Environmental filters reduce the effects of sampling bias and improve predictions of ecological niche models. Ecography 2014, 37, 1084–1091. [Google Scholar] [CrossRef]
  26. Becerra-López, J.L.; Romero-Méndez, U.; Ramírez-Bautista, A.; Becerra-López, J.S. Revisión de las técnicas para el modelado de la distribución de las especies. Revista Científica Biológico Agropecuaria Tuxpan 2016, 5, 1514–1525. [Google Scholar]
  27. Broennimann, O.; Petitpierre, B.; Randin, C.; Engler, R.; Di Cola, V.; Breiner, F.; D’Amen, M.; Pellissier, L.; Pottier, J.; Pio, D.; et al. Ecospat: Spatial Ecology: Miscellaneous Methods. R Package Version 1.1/2015. Available online: http://CRAN.R-project.org/package=ecospat (accessed on 30 November 2018).
  28. Schoener, T.W. Nonsynchronous spatial overlap of lizards in patchy habitats. Ecology 1970, 51, 408–418. [Google Scholar] [CrossRef]
  29. R-Core-Team. R: A Language and Environment for Statistical Computing; R Foundation for Statistical Computing: Vienna, Austria, 2015; Available online: http://www.R-project.org/ (accessed on 30 November 2018).
  30. Phillips, S.J.; Anderson, R.P.; Schapire, R.E. Maximum entropy modeling of species geographic distributions. Ecol. Model. 2006, 190, 231–259. [Google Scholar] [CrossRef]
  31. Phillips, S.; Dudik, M.; Schapire, R. MaxEnt 3.3.3k/AT&T Labs-Research; Princeton University: Princeton, NJ, USA, 2012; Available online: https://github.com/mrmaxent/Maxent/tree/master/ArchivedReleases/3.3.3k (accessed on 30 November 2018).
  32. Jiménez-Valverde, A.; Peterson, A.T.; Soberón, J.; Overton, J.M.; Aragón, P.; Lobo, J.M. Use of niche models in invasive species risk assessments. Biol. Invasions 2011, 13, 2785–2797. [Google Scholar] [CrossRef]
  33. Pearson, R.G.; Raxworthy, C.J.; Nakamura, M.; Townsend Peterson, A. Predicting species distributions from small numbers of occurrence records: A test case using cryptic geckos in Madagascar. J. Biogeogr. 2007, 34, 102–117. [Google Scholar] [CrossRef]
  34. Elith, J.; Phillips, S.J.; Hastie, T.; Dudík, M.; Chee, Y.E.; Yates, C.J. A statistical explanation of MaxEnt for ecologists. Divers. Distrib. 2011, 17, 43–57. [Google Scholar] [CrossRef]
  35. Kearney, M.; Porter, W. Mechanistic niche modelling: Combining physiological and spatial data to predict species’ ranges. Ecol. Lett. 2009, 12, 334–350. [Google Scholar] [CrossRef]
  36. Buckley, L.B.; Rodda, G.H.; Jetz, W. Thermal and energetic constraints on ectotherm abundance: A global test using lizards. Ecology 2008, 89, 48–55. [Google Scholar] [CrossRef]
  37. Warren, D.L.; Seifert, S.N. Ecological niche modeling in Maxent: The importance of model complexity and the performance of model selection criteria. Ecol. Appl. 2011, 21, 335–342. [Google Scholar] [CrossRef]
  38. Elith, J.; Kearney, M.; Phillips, S. The Art of Modelling Range-Shifting Species. Methods Ecol. Evol. 2010, 1, 330–342. [Google Scholar] [CrossRef]
  39. Moreno-Amat, E.; Mateo, R.G.; Nieto-Lugilde, D.; Morueta-Holme, N.; Svenning, J.-C.; García-Amorena, I. Impact of model complexity on cross-temporal transferability in Maxent species distribution models: An assessment using paleobotanical data. Ecol. Model. 2015, 312, 308–317. [Google Scholar] [CrossRef]
  40. Muscarella, R.; Galante, P.J.; Soley-Guardia, M.; Boria, R.A.; Kass, J.M.; Uriarte, M.; Anderson, R.P. ENMeval: An R package for conducting spatially independent evaluations and estimating optimal model complexity for Maxent ecological niche models. Methods Ecol. Evol. 2014, 5, 1198–1205. [Google Scholar] [CrossRef] [Green Version]
  41. Dambach, J.; Rödder, D. Applications and future challenges in marine species distribution modeling. Aquat. Conserv. Mar. Freshw. Ecosyst. 2011, 21, 92–100. [Google Scholar] [CrossRef]
  42. CONABIO. Uso de suelo y Vegetación Modificado por Conabio. Escala 1:1,000,000. Comisión Nacional para el Conocimiento y uso de la Biodiversidad: Mexico. 1999. Available online: http://www.conabio.gob.mx/informacion/metadata/gis/usv731mgw.xml?_xsl=/db/metadata/xsl/fgdc_html.xsl&_indent=no (accessed on 30 November 2018). (In Spanish).
  43. INIFAP-CONABIO. Edafología. Escalas 1:250,000 y 1:1,000,000. Comisión Nacional para el Conocimiento y uso de la Biodiversidad, Instituto Nacional de Investigaciones Forestales, Agrícolas y Pecuarias: Mexico. 1995. Available online: http://www.conabio.gob.mx/informacion/metadata/gis/eda251mgw.xml?_httpcache=yes&_xsl=/db/metadata/xsl/fgdc_html.xsl&_indent=no (accessed on 30 November 2018). (In Spanish).
  44. Anadón, J.D.; Graciá, E.; Botella, F.; Giménez, A.; Fahd, S.; Fritz, U. Individualistic response to past climate changes: Niche differentiation promotes diverging Quaternary range dynamics in the subspecies of Testudo graeca. Ecography 2015, 38, 956–966. [Google Scholar] [CrossRef]
  45. Thuiller, W.; Araujo, M.B.; Lavorel, S. Do we need land-cover data to model species distributions in Europe? J. Biogeogr. 2004, 31, 353–361. [Google Scholar] [CrossRef]
  46. Luoto, M.; Virkkala, R.; Heikkinen, R.K. The role of land cover in bioclimatic models depends on spatial resolution. Glob. Ecol. Biogeogr. 2007, 16, 34–42. [Google Scholar] [CrossRef]
  47. Hortal, J.; Roura-Pascual, N.; Sanders, N.J.; Rahbek, C. Understanding (insect) species distributions across spatial scales. Ecography 2010, 33, 51–53. [Google Scholar] [CrossRef]
  48. Early, R.; Sax, D.F. Climatic niche shifts between species’ native and naturalized ranges raise concern for ecological forecasts during invasions and climate change. Glob. Ecol. Biogeogr. 2014, 23, 1356–1365. [Google Scholar] [CrossRef]
  49. Dellinger, A.S.; Essl, F.; Hojsgaard, D.; Kirchheimer, B.; Klatt, S.; Dawson, W.; Pergl, J.; Pyšek, P.; van Kleunen, M.; Weber, E.; et al. Niche dynamics of alien species do not differ among sexual and apomictic flowering plants. New Phytol. 2016, 209, 1313–1323. [Google Scholar] [CrossRef]
  50. Becerra-López, J.L.; Esparza-Estrada, C.E.; Romero-Méndez, U.; Sigala-Rodríguez, J.J.; Mayer-Goyenechea, I.G.; Castillo-Cerón, J.M. Evidence of niche shift and invasion potential of Lithobates catesbeianus in the habitat of Mexican endemic frogs. PLoS ONE 2017, 12, e0185086. [Google Scholar] [CrossRef]
  51. Strubbe, D.; Beauchard, O.; Matthysen, E. Niche conservatism among non-native vertebrates in Europe and North America. Ecography 2015, 38, 321–329. [Google Scholar] [CrossRef]
  52. Czaja, A.; Palacios-Fest, M.R.; Estrada-Rodríguez, J.L.; Romero-Méndez, U.; Alba-Ávila, J.A. Inland dunes fauna and flora from Paleolake Irritila in the Comarca Lagunera, Coahuila, northern Mexico. Boletín de la Sociedad Geológica Mexicana 2014, 66, 541–551. [Google Scholar] [CrossRef]
  53. Vázquez-Lobo, A.; Morales-Aguilar, G.; Arias, S.; Golubov, J.; Hernández-Hernández, T.; Mandujano, M.C. Phylogeny and biogeographic history of Astrophytum (Cactaceae). Syst. Bot. 2016, 40, 1022–1030. [Google Scholar] [CrossRef]
  54. Webb, C.O.; Ackerly, D.D.; McPeek, M.A.; Donoghue, M.J. Phylogenies and community ecology. Annu. Rev. Ecol. Syst. 2002, 33, 475–505. [Google Scholar] [CrossRef]
  55. Ackerly, D.D. Adaptation, niche conservatism, and convergence: Comparative studies of leaf evolution in the California chaparral. Am. Nat. 2004, 163, 654–671. [Google Scholar] [CrossRef]
  56. Thomas, C.D.; Cameron, A.; Green, R.E.; Bakkenes, M.; Beaumont, L.J.; Collingham, Y.C.; Erasmus, B.F.; De Siqueira, M.F.; Grainger, A.; Hannah, L.; et al. Extinction risk from climate change. Nature 2004, 427, 145–148. [Google Scholar] [CrossRef] [Green Version]
  57. Malcolm, J.R.; Liu, C.; Neilson, R.P.; Hansen, L.; Hannah, L. Global warming and extinctions of endemic species from biodiversity hotspots. Conserv. Biol. 2006, 20, 538–548. [Google Scholar] [CrossRef]
  58. Huey, R.B. Temperature, Physiology, and the Ecology of Reptiles; Department of Zoology, University of Washington: Seattle, WA, USA, 1982. [Google Scholar]
  59. Hertz, P.E.; Fleishman, L.J.; Armsby, C. The influence of light intensity and temperature on microhabitat selection in two Anolis lizards. Funct. Ecol. 1994, 8, 720–729. [Google Scholar] [CrossRef]
  60. Vitt, L.J.; Zani, P.A.; Lima, A.C.M. Heliotherms in tropical rain forest: The ecology of Kentropyx calcarata (Teiidae) and Mabuya nigropunctata (Scincidae) in the Curua-Una of Brazil. J. Trop. Ecol. 1997, 13, 199–220. [Google Scholar] [CrossRef]
  61. Bryant, S.R.; Thomas, C.D.; Bale, J.S. The influence of thermal ecology on the distribution of three nymphalid butterflies. J. Appl. Ecol. 2002, 39, 43–55. [Google Scholar] [CrossRef] [Green Version]
  62. Romero-Méndez, U. Modelo Probabilístico de la Distribución Geográfico-Espacial de la Cactácea Astrophytum myriostigma LEM. (1839) en la Sierra El Sarnoso, Durango, México. Master’s Thesis, Universidad Juárez Autónoma de Durango, Venecia, Durango, México, 2006, unpublished. [Google Scholar]
Figure 1. Geographical records of Astrophytum coahuilense. In the study areas, the black triangles correspond to the records of zone A, the black circles refer to the records of zone B, the black boxes indicate the records of zone C, and the black stars refer to the points identified outside the distribution area of A. coahuilense proposed by Fitz-Maurice et al. [3,6]. The Black dotted line shows the distribution proposed by Fitz-Maurice et al. [3,6], while solid black lines refer to the state limits.
Sustainability 11 01138 g001
Figure 2. Distribution of A. coahuilense in the climate space of Northern Mexico. The gray dots represent the multivariate climatic space in Northern Mexico, the red dots indicate the distribution of A. coahuilense in the climate space.
Sustainability 11 01138 g002
Figure 3. Niche overlap. Panel 1 shows the evaluation frequencies A vs. B and B vs. A. Panel 2 presents the dimensions of the climatic niche of A. coahuilense in zone A and zone B, represented in a Principle Component Analysis (PCA). Grey shading shows the density of the occurrences of the species per cell. The dotted line illustrates 50%, and the solid line 100%, of the available environment.
Sustainability 11 01138 g003
Figure 4. Potential distribution model of A. coahuilense. In red, the areas with habitat suitability for the species are shown. The black dotted line is the distribution area of A. coahuilense proposed by Fitz-Maurice et al. [3,6]. The state limits are indicated in black continuous lines.
Sustainability 11 01138 g004
Table 1. Distribution of A. coahuilense in the climatic environment.
Climatic VariableMaximum and Minimum Values
Precipitation of Warmest Quarter72 mm–123 mm
Precipitation of Coldest Quarter22 mm–27 mm
Annual Mean Temperature20.8 °C–21.3 °C
Mean Diurnal Range15.7 °C–17.8 °C
Precipitation of Driest Quarter12 mm–14 mm
Max Temperature of Warmest Month35.4 °C–35.7 °C
Table 2. Relative importance of climatic variables in the distribution of A. coahuilense.
VariableContribution PercentagePermutation
Importance
Relative
Importance
Alt- Elevation5269.886.9
Precipitation of Warmest Quarter24.90.525.15
Precipitation of Coldest Quarter19.914.126.95
Annual Mean Temperature2.212.78.55
Mean Diurnal Range0.62.71.95
Precipitation of Driest Quarter0.20.10.25
Max Temperature of Warmest Month000
Note: The value of each variable is the average contribution (contribution percentage + importance of permutation)/2.