Article

Spatial Accessibility to Hospitals Based on Web Mapping API: An Empirical Study in Kaifeng, China

1
Key Laboratory of Geospatial Technology for Middle and Lower Yellow River Region/College of Environment and Planning Henan University, Jinming Road, Kaifeng 475004, China
2
Department of Geosciences, Mississippi State University, 355 Lee Blvd, Hilbun Hall, Mississippi State, MS 39762, USA
3
Collaborative Innovation Center of Urban-rural Coordinated Development, Zhengzhou 450046, China
*
Author to whom correspondence should be addressed.
Sustainability 2019, 11(4), 1160; https://doi.org/10.3390/su11041160
Submission received: 11 January 2019 / Revised: 15 February 2019 / Accepted: 18 February 2019 / Published: 22 February 2019

Abstract

:
The accessibility of hospital facilities is of great importance not only for maintaining social stability, but also for protecting the basic human right to health care. Traditional accessibility research often lacks consideration of the dynamic changes in transport costs and does not reflect the actual travel time of urban residents, which is critical to time-sensitive hospital services. To avoid these defects, this study considered the city of Kaifeng, China, as an empirical case, and directly acquired travel time data for two travel modes to the hospital in different time periods through web mapping API (Application Program Interface). Further, based on travel time calculations, we compared five baseline indicators. For the last indicator, we used the optimal weighted accessibility model to measure hospital accessibility for each residential area. The study discovered significant differences in the frequency and spatial distribution of hospital accessibility using public transit and self-driving modes of transportation. In addition, there is an imbalance between accessibility travel times in the study area and the number of arrivals at hospitals. In particular, different modes of transportation and different travel periods also have a certain impact on accessibility of medical treatment. The research results shed new light on the accessibility of urban public facilities and provide a scientific basis with which local governments can optimize the spatial structure of hospital resources.

1. Introduction

Health is fundamental to human survival and development and is related not only to the quality of life of individuals, but also to national security and social stability [1]. The World Health Organization (WHO) strongly advocates for a reduction in health inequalities between different people and regions within a country [2]. The accessibility of hospital service facilities is of importance not only for maintaining social stability, but also for protecting the basic human right to health. Spatial variation in the accessibility of hospital facilities directly impacts opportunities for urban residents to receive hospital services [3,4,5]. Therefore, the distribution of hospital facilities has long been an important socio-spatial issue at the regional and national levels [6].
China’s resource allocation system differs from those in most Western countries. On the one hand, Chinese cities have large populations and limited hospital resources. Hospital resource allocation and utilization presents an Inverted Pyramid model (defined here as the allocation and utilization of hospital resources [7]), which results in a contradiction between increasing hospital demands of urban residents and constraints on the supply of hospital resources [8]. On the other hand, the Chinese hospital system has a strict, complex hierarchical structure, with the government playing a leading role in the spatial allocation of resources, urban planning, and construction. This impedes free flow in the spatial distribution of hospital facilities. The gradual deepening of health system reform in China and continuous increase in the input of hospital and health resources have led to a great improvement in the general level of public health in recent years, resulting in average life expectancy extending from 69 years in 1990 to 75 years in 2010 [9]. However, there are still significant spatial and social differences in health levels between different regions. Whether in China or other countries, beneficiaries of the health care system tend to be of the upper classes [10,11], and vulnerable areas and communities often encounter difficulties in accessing required hospital services [5,12]. Inequality in hospital services has become one of the core issues affecting human development [13,14,15]. With the rapid development of urbanization and the evolution of the urban spatial structure, the mismatch between the growing needs of people and uneven infrastructure development has become the main contradiction in Chinese society. Accurate assessment of the current distribution of hospital facilities is crucial for understanding and solving existing injustices [16]. Therefore, researchers are paying increasing attention to the accessibility of hospital facilities and the socio-spatial problems caused by it [17,18]. This issue has become a matter of great importance for both the people and government of China.
Hansen described accessibility as “the interaction of opportunity potential” [19] (p. 73) and Dalvi and Martin further elaborated on the objects and means of access and described accessibility as “the difficulty of reaching a certain facility from somewhere based on a given way of transportation” [20] (p. 18). At present, domestic and international research on hospital service accessibility primarily focuses on four aspects: (a) The supply and demand distribution of a potential population with a certain type of disease regarding a specific hospital [21,22]; (b) modeling to predict and optimize the distribution of facilities to cater to a certain population size and facility level [18,23]; (c) spatial comparison of facility accessibility by different transport modes [24,25]; and (d) discussion of the socio-spatial equity of facility supply on the basis of the combined social and economic attributes of residents [26]. For example, Hare explored the accessibility of cardiovascular hospital facilities by considering the number of beds and residents at different critical distances from each other [22]. Yin used network analysis to calculate the average shortest distance between residential areas and hospital facilities, applying the Theil index to evaluate regional inequality [27]. Cheng used the two-step floating catchment area (2SFCA) method to analyze spatial differences and heterogeneity in the accessibility of administrative hospitals for those using self-driving and public means of transport [24]. Wang assessed the accessibility of primary hospital facilities by using enhanced 2SFCA and Gini coefficients [16]. Song and others adapted the potential model to measure the level of accessibility of hospital supply and demand at different geographical scales [28,29].
The most commonly used methods of studying the accessibility of hospital service facilities are 2SFCA [30,31,32], the potential model [33,34], and network analysis [35]. 2SFCA was first proposed by Radke and Mu [36]. Many scholars have improved and extended 2SFCA in recent years to form a huge family of two-step mobile search methods [37,38,39]. Broadly, 2SFCA is employed by moving the search twice within a certain range threshold based on the supply point and demand point, and then summing up the supply and demand ratios to determine accessibility of the demand point. The potential model, derived from Newton’s law of gravity, assumes that the attractiveness of a service facility is proportional to its quality (scale, grade) and is inversely proportional to the distance necessary (traffic cost) to reach it. Joseph Guagliardo improved on the model by taking the competition between supply and demand into account and introducing the size of the population as well as the facility level and other factors into the basic formula [40,41]. Network analysis models use a GIS network analysis module to measure facility accessibility by setting the travel costs of different roads and calculating the network path distance. However, existing accessibility models are sensitive to the research scale, and the choice of service range threshold is subjective. Furthermore, traffic cost measurement in traditional 2SFCA and potential models depends on Euclidean distance or network path distance. Euclidean distance assumes that the demand points and facilities points are located on the homogeneous plain, focusing on the linear distance between the two points. But in fact, geographic space is heterogeneous space, and the flow of people and things in space is mostly along the road network rather than the straight line distance. Although this is a simpler method, it completely ignores the actual traffic situation, which may lead to conflicting conclusions [42,43]. The distance on network path is based on the road network model and complex parameter setting to fit the traveling path on an actual road. In order to reflect the time factor, travel time is generally simulated by assigning actual speed limits of the roads [25,42]. The transportation cost is a time-sensitive index, which varies significantly with time and location, and is critical to time-sensitive services.
Some recent studies have indicated the necessity of including the actual traffic conditions related to the time component (i.e., traffic jams, speed limits, waiting times, limits on turning, and one-way streets) [44,45]. Studies often fail to consider the dynamic time cost when calculating the traffic cost, neglecting the urgency of reaching hospital services [42]. Especially in the case of emergency services, time is life for patients, so the time it takes to receive a diagnosis is directly related to survival rates [46]. Also, research has focused on evaluating the spatial accessibility of hospitals and has lacked a consideration of the driving mechanisms of variations in accessibility from a variety of factors. Finally, the census statistical unit is generally used as the analysis unit, and the population data are also derived from census data, resulting in research results that have limited applicability. With the rapid development and widespread application of spatial sensing and mobile positioning technology, sources of big data have become available that are highly relevant to national economic and social development and penetrate into the daily lives of residents [47,48,49,50]. The data services within web mapping API (Application Program Interface) include navigation path planning, facility POI (Point of Interest) and building contours, which are more realistic and accurate than traditional accessibility investigation methods and visualizations. In the real-time navigation module, the two dimensions of time and space are integrated to evaluate accessibility, thus incorporating a comprehensive consideration of the layout and management of the urban spatial structure and the results of demand. Currently, web mapping API is being applied primarily to hospital accessibility analysis [24], accessibility of business centers [49], measurement of parks accessibility [50,51], approach to intra-urban food deserts [43], and so forth. This method is simple and easy to operate. Therefore, the web mapping API provides a new perspective for the study of space-time accessibility.
In view of the above, this paper takes the city of Kaifeng as an empirical case. Based on real-time traffic navigation data, we established the optimal weighted model of hospital accessibility and examined the accessibility of hospitals reflecting three quality levels under two transport modes in different time periods. This provides a new perspective and method for researching hospital accessibility, and enables recommendations to be made for future urban planning.

2. Materials and Methods

2.1. Overview of the Study Area

Kaifeng, with an area of 6266 km2, is located in the east of the middle and lower reaches of the Yellow River and has major national historical and cultural importance as one of China’s eight ancient capitals. It is now a sub-central city of Henan province and is part of the core development area of the Central Plains city group. It is classed as a small to medium city and is expanding rapidly. In 2017, the city’s total population was 5.2304 million, of which the resident population was 4.5493 million [52]. At the end of 2017, there were 3273 health institutions, 21,000 sickbeds, and 29,900 health workers. Thus, per 1000 people, there are an average of 4.01 sickbeds, 5.72 health technicians, and 2.16 practicing doctors [52].
The old town, the new western urban area, the eastern urban area, and the southern urban area were selected for study because they (a) are the main loci of social and economic activity in the city (Figure 1), (b) house a large proportion of the urban population, and (c) have the most complex and congested traffic conditions. The integration of Zhengzhou and Kaifeng and the promotion of urban agglomeration in the Central Plains have led urban construction in Kaifeng to expand outward considerably in recent years. At present, the new urban area has become an important focus of urban development and expansion. The rapid expansion of cities has led to urban traffic congestion and uneven distribution of public service resources, which will not only affect accessibility to hospital care and social equity but also bring great challenges to future urban development [13,14,15,53].

2.2. Data

This study uses residential area (building scale) as the lowest geographic level for assessing hospital accessibility. The location data of residential areas and hospitals are mainly from Gaode map API (https://www.amap.com/). Considering the urgency of residents’ need for hospital care, this study selected hospital institutions with surgical capabilities for its sample, focusing mainly on primary, secondary, and tertiary hospitals. Finally, we counted 4147 residential areas and 30 hospitals as research objects (Figure 1). Moreover, Kaifeng’s primary and secondary hospitals have a relatively small number of doctors, nurses, and beds. On the basis of the reclassification proposed by Zhong [54], this study classifies some small hospitals as primary hospitals; first-level grade-A hospitals and secondary hospitals as basic hospitals; and third-level grade-A hospitals and third-level grade-B hospitals as high-quality hospitals. If several hospitals are affiliated with the same hospital, they are regarded as separate hospitals.

2.3. Travel Time

The travel time to treatment is taken as the main factor restricting people’s accessibility to hospitals [24]. The time factor is very sensitive to medical care, and urban congestion will increase the cost of travel time, leading to a delay in receiving medical care. Thus, it is necessary to study travel times in peak and non-peak periods [42]. This study did not calculate travel time by using distance, and a hypothetical speed based on vector maps. Instead, it used Gaode’s web mapping route planning API to get the travel time. The speed measurement incorporated into accessibility comes from real-time feedback on road conditions, which is more accurate than the previous speed assignments based on planning. When a route is requested between a start and end point in the Gaode Map, the system will plan different travel schemes according to the mode of travel and real-time road conditions. For each route, the planning takes the multi-combinational characteristics of the travel mode into consideration and solves the problem of the “first/last 1 km” between the starting point and the destination. When planning for public transport, it also considers the number of changes required and transfer impediments, which are a good reflection of actual travel issues faced by residents [47,48]. Related studies proved these map services are based on a large amount of historical and real-time data, use scientific computing methods, and offer accurate, reliable results [49,50,55,56,57].

2.4. Methods

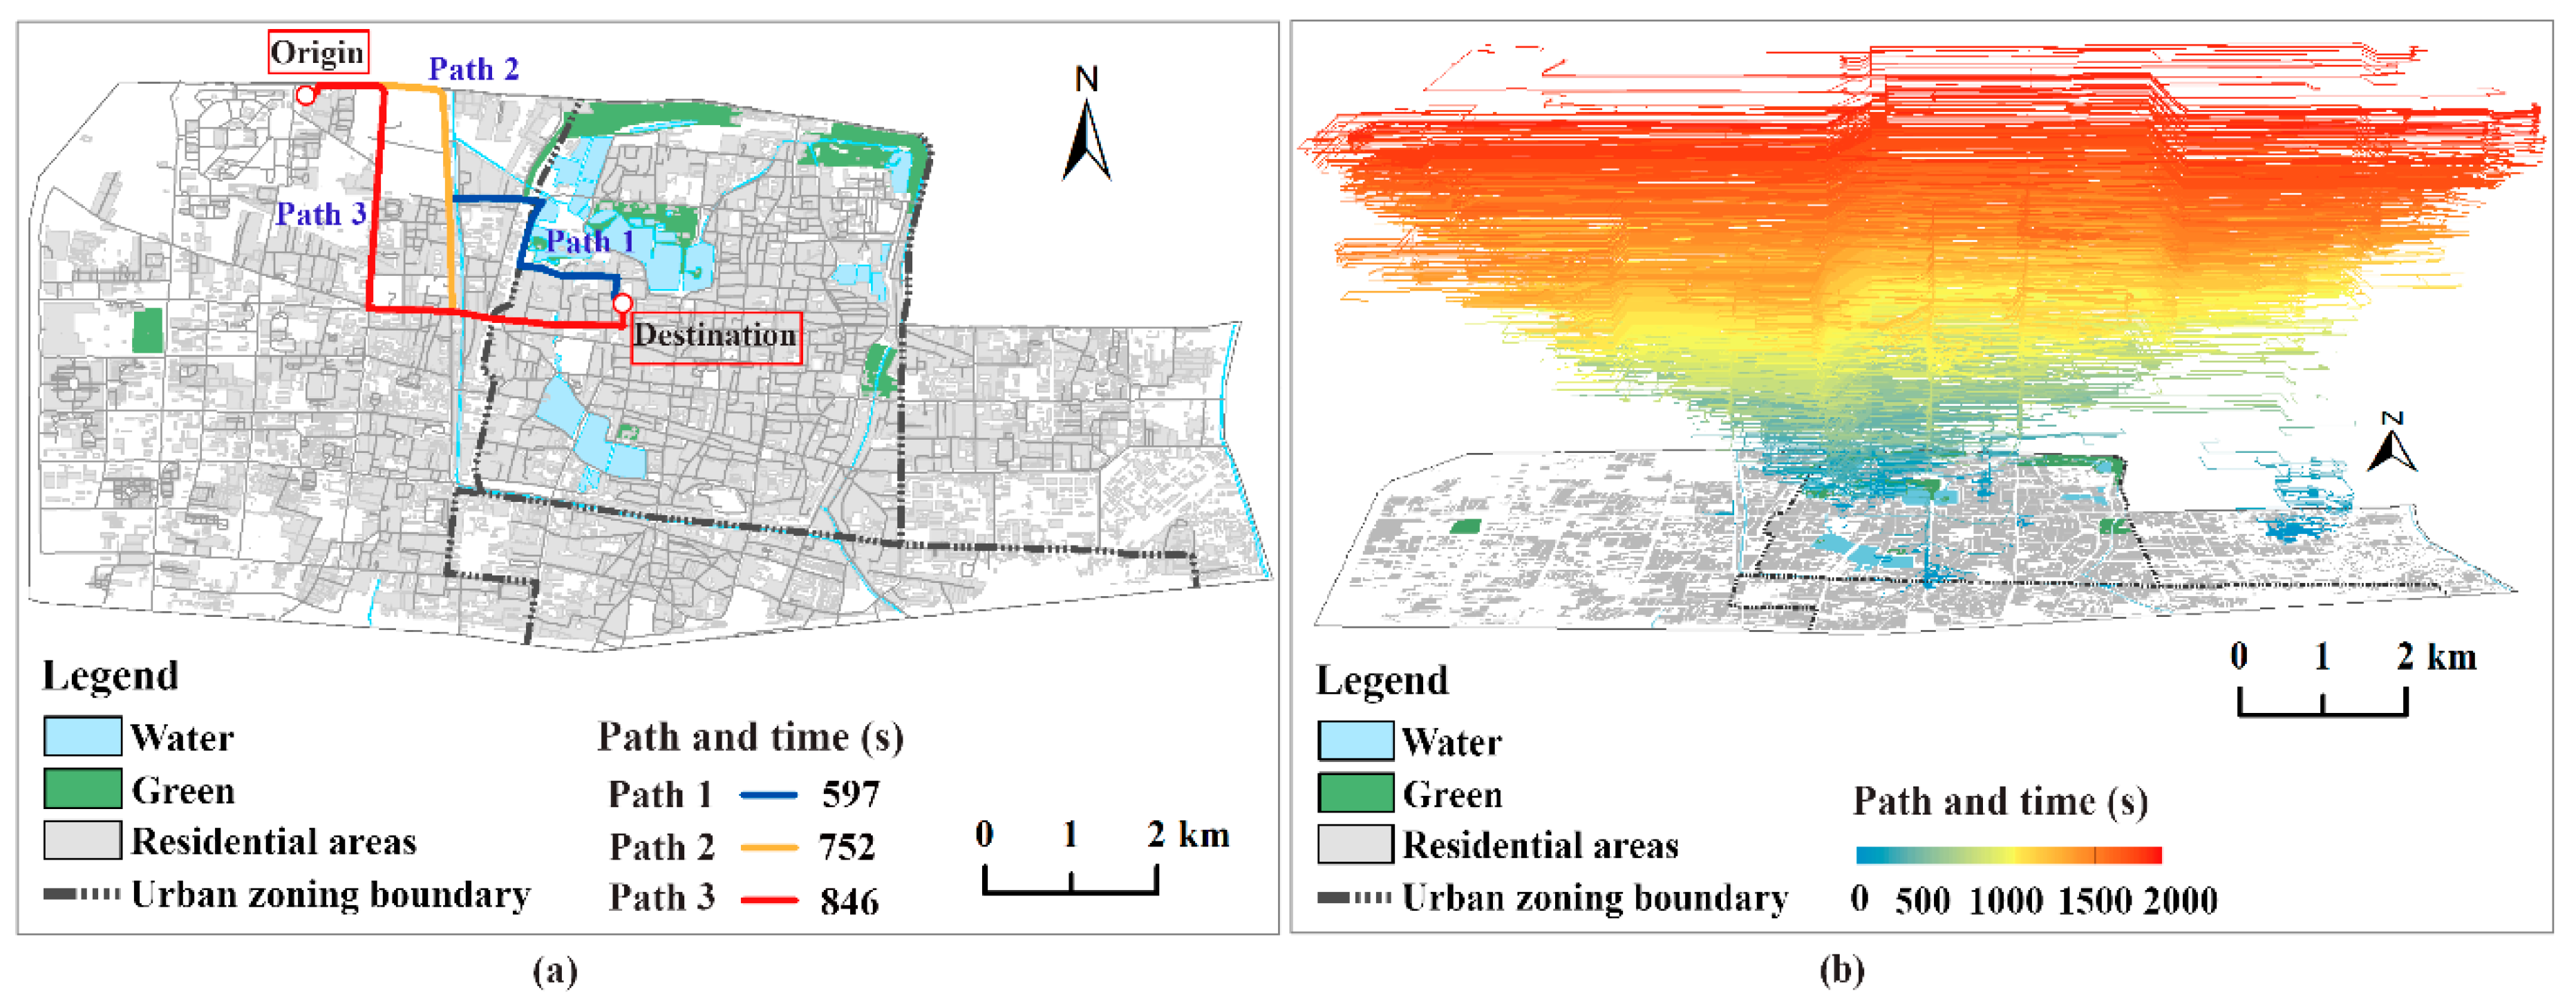
In this paper, we acquired multi-source data by employing web mapping API, which proffers a new approach to measure accessibility. We used the API to obtain the travel time from 4147 starting points to 30 hospitals in the study area at the same time. The technical process is as follows: (a) The starting point is defined by writing the code for the API of Gaode Map, building the web application program, parsing a certain range of building contour information, and extracting the coordinates of the unit’s centroid; (b) the destination point is acquired by requesting the hospital POI in batches from Gaode Map and converting the data returned into coordinates; and (c) traffic lines and time consumption are available in corresponding OD (Origin–Destination) matrices that are ready to be imported into ArcGIS by setting the travel mode, route selection, and travel time consumed to get to the starting point in batches. We selected a residential area and a hospital as the study sample (Figure 2a). In Figure 2, when using the navigation function of Gaode Map route planning; the system recommends three paths and corresponding estimated travel times, of which path 1 takes the shortest time. Therefore, this study uniformly selected path 1 as the data source. Optimal navigation paths and time distances were then obtained for all of the initial targets, and these are plotted in 3D maps (Figure 2b, where travel time gradually increases from below to above).
Some scholars have found that the level of medical technology at a hospital facility is a major concern for residents when making choices regarding hospital treatment [26,47]. Considering the different technical levels and hospital levels, we gave divergent weight indicators to hospitals of disparate levels, and established the mathematical model of optimal weighted accessibility as follows:
A i = M a x ( A i ) = W j × 1 t i j
In the formula, Ai is the optimal weighted accessibility level of residential unit I, and tij is the optimal path time for those at residence unit i to arrive at hospital j (calculated by minute statistics). Wj is the weight of hospital grade j. This paper used the grade weightings proposed by Zeng [3], adopting a weight of 0.6 for high-quality medicine, 0.3 for a basic hospital, and 0.1 for a primary hospital. The higher the Ai value, the higher the accessibility level from the residential unit.
Considering the urgency with which medical assistance is required, navigation time via self-driving and public transport was taken as the measurement basis. Data were acquired on a single day in October 2017. To reflect temporal changes in accessibility more accurately, peak travel time data were obtained for 18:00 to 19:00 and non-peak data were from 10:00 to 11:00.

3. Results

3.1. Baseline Indicators of Hospital Accessibility

We further developed five baseline indicators of hospital accessibility based on the travel time calculations to measure hospital accessibility for each residential area (Figure 3). These travel time calculations are: (a) minimum (minimum travel time to all hospitals), (b) maximum (maximum travel time to all hospitals), (c) average (average travel time to all hospitals), and (d) Ai (optimal weighted model travel time).
Figure 3 presents the data distribution of the accessibility baseline indicators for hospitals of different transport modes and varied travel times. Under the self-driving mode, the minimum data is relatively centralized, the proportion of extreme value is relatively high, and the average travel time in peak periods is 2–4 min higher than that in non-peak periods. Under the public transit mode, the average data is relatively centralized, the difference between the minimum and maximum values is still significant, and the average travel time in peak periods is 4–8 min higher than that in non-peak periods. On the whole, the average travel time of the public transport mode is 10–20 min longer than that of the self-driving mode. This suggests that the imbalance of travel time for hospital treatment in the study area may be due to the accessibility of different modes of transportation as well as different time periods.
Under the optimal weighted accessibility model, travel time data are lower than the average value, and the data distribution is the most stable. At the same time, the time fluctuation in different travel modes and time periods is also the smallest. In past studies, the level of hospital technology at a hospital facility is a major concern for residents when making choices regarding hospital treatment [26,46]. Therefore, the weighted travel time is closer to the actual situation of residents. We use this model as the final evaluation of accessibility. First, the travel time from each residential area to different hospital levels is counted (Figure 4).
Figure 4 data are most concentrated and travel time is the shortest for people who travel to primary hospitals from residential areas. The data for people who travel to basic hospitals are relatively concentrated and travel time is comparably low. Compared with low-level hospitals, high-quality hospitals show the greatest difference between the upper and lower limit data values for arrivals. Also, the travel time is higher than that to other hospitals. This shows that the travel time of people to different hospital levels is unequal. The travel time from all residential areas to low-level hospitals is relatively equal, and the travel time to high-quality hospitals is the most unequal.

3.2. Frequency Distribution of Accessibility Level

The accessibility (Ai) values via public transport and self-driving transport can be divided into five grades by applying GIS (geometric interval classification) (based on the non-peak value) to the accessibility results calculated by Equation (1) (Table 1). The distribution frequency and cumulative frequency of the number of the residential units by level of accessibility and the proportion of each hospital grade at that level were calculated for both peak and off-peak periods and for the two transport modes (Figure 5).
As shown in Figure 5, there are clear differences in the frequency distributions of the hospital accessibility levels for the two travel modes whereas the frequency distributions of hospital accessibility levels via the same travel mode at different time periods are similar. In each accessibility level, the frequency of public transportation to basic hospitals is significantly higher than that of self-driving transport, especially at the poor, medium, and best-accessibility levels. It can be seen that people from residential areas are more dependent on public transport when they arrive at basic hospitals for hospital treatment. Overall, however, the proportion of different hospital grades at that accessibility level are ordered as High-quality hospital > Basic hospital > Primary hospital.
Under the self-driving mode, the distribution frequency of residential areas declined from 52% to 2% between the extremely poor and poor accessibility levels during non-peak periods. This drop is even more marked for public transport and constitutes the largest change in frequency in the whole accessibility level distribution. In the overall change trend, the distribution frequency increased most significantly from the medium level for people using public transport. For those people using self-driving transport, the increase was from the poor level. These are also the only points in the distribution frequencies that increase with an increase in accessibility level. However, it is noteworthy that in peak periods, the number of basic hospitals with public transport accessibility at poor and above levels and the number of basic hospitals with self-driving transport accessibility at medium and above levels are greater than in non-peak periods. In addition, self-driving transport hospital accessibility is significantly better than with public transport in both peak and non-peak travel periods. For example, during peak and off-peak periods, only 2% and 12% of medium and better level residential areas adopt the public transport mode. In the self-driving mode, the two proportions increased to 24% and 21% in peak periods and 23% and 19% in non-peak periods, respectively.

3.3. Spatial Distribution of Accessibility Level

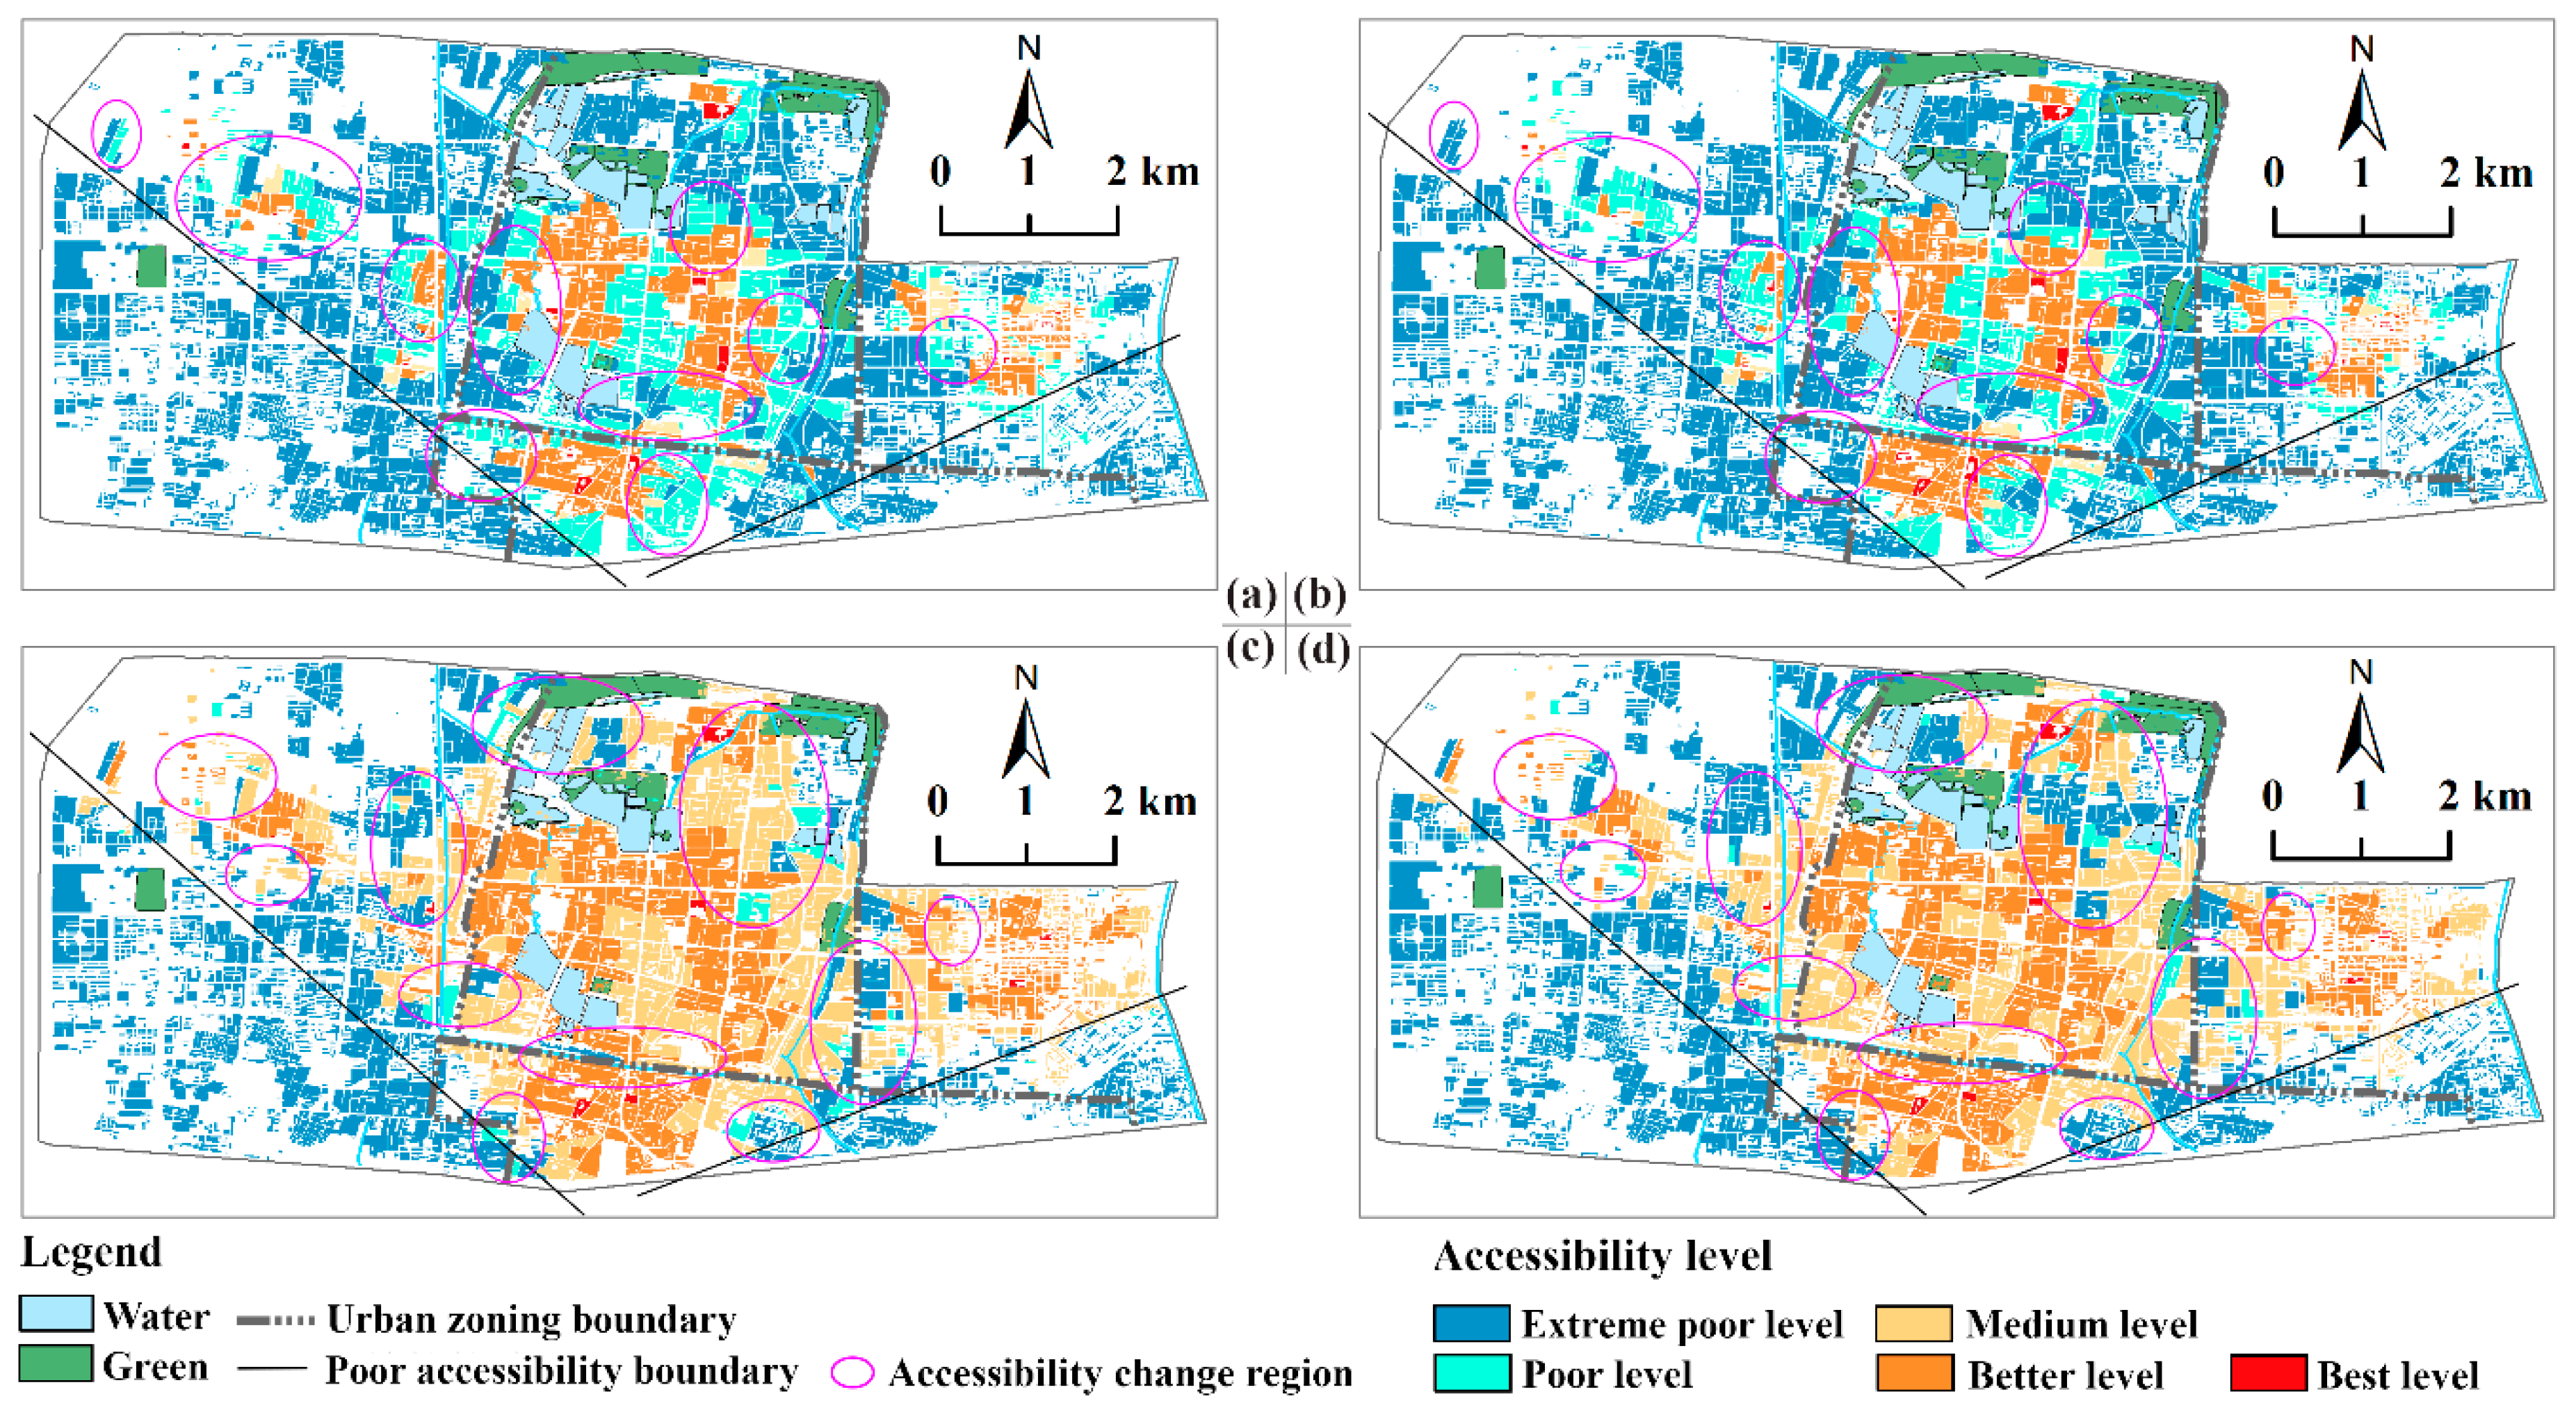
To analyze the internal differences and overall spatial distribution of hospital accessibility in each residential area, visualizations were created of the spatial distribution of the accessibility levels. These are presented in Figure 6, in which regions with major accessibility changes at different times are indicated with a red ellipse. Regions with poor accessibility under all conditions are divided off with black lines.
Figure 6 shows that the spatial distribution of each hospital accessibility level differs significantly with the transport mode. A wider area has relatively better hospital accessibility with self-driving transport than with public transport, and a smaller area has relatively poor hospital accessibility. Generally speaking, the accessibility grade of residential quarters shows significant spatial differentiation and spatial agglomeration, and there is an overall attenuation in accessibility level from the old town area towards the periphery. In addition, there is a marked difference between accessibility in the new urban area and the old town area. Specifically, in Kaifeng, extremely poor accessibility is most common at the periphery of the new urban area, in the southeast, and at other urban fringes. The hospital and transportation infrastructure in these areas usually lags behind that in more central regions, especially in the regions divided by black lines in the graphs. Areas with a medium and above accessibility level are located in the inner part of the old town area, the southern urban area, and the eastern urban area, which usually have a high degree of mixed land-use and a compact road network that houses the majority of the highest-quality hospitals. The results show that the spatial distribution of hospital resources in Kaifeng is unbalanced, high-quality hospital resources are concentrated in the old town areas, and hospital resources in the periphery of the urban area are significantly insufficient.
Although the overall spatial pattern of accessibility of the same transportation mode during peak and non-peak periods does not change significantly in different travel periods, when we microcosmic each residential area, we find that a different travel time has a significant impact on the spatial pattern of hospital assistance accessibility, and the most significant impact is on the residential areas within the boundaries of the old town areas. Generally speaking, the accessibility of non-peak periods is better than that of peak periods. Like the red ellipse in Figure 6, they are all distributed around the old town area. The area in the red ellipse shows the residential areas with different accessibility between peak and non-peak periods and also expresses the change of frequency in Figure 5. However, in some red ellipses, the barrier-free level of some residential areas in peak periods is even better than that in non-peak periods. Therefore, different travel periods have different impacts on the accessibility of residents to hospitals.

4. Discussion and Conclusions

This paper calculated accessibility on the basis of web mapping API data provided by Gaode Map to evaluate the spatial distribution of the hospitals in Kaifeng, China. Based on the estimated travel time, we established the optimal weighted model of hospital accessibility and examined hospital accessibility at three quality levels under two transport modes in different time periods.
From the data distribution of hospital travel time, we found that non-peak travel time is better than peak travel time, and self-driving transport is better than public transport. It shows that different transportation modes and diverse travel times will affect the ability of residents to arrive at the hospital on time for treatments. Chen’s study, after considering road congestion, found that the road travel time increased and the degree of increase varied in different traffic periods [42]. This study demonstrates that a person’s ability to receive medical care is very sensitive to the time factor that urban congestion will increase travel time costs, leading to a delay in medical care. Especially in the case of emergency services, time is life for patients, so the time necessary to receive a diagnosis is directly related to survival rates [46]. Our study also shows that different travel periods have different impacts on the accessibility to hospitals of residents from diverse areas. Thus, when considering medical care availability in cities, a hospital accessibility assessment model reflecting real-time traffic conditions should be built to optimize the hospital travel path. Also, technical methodology should be employed to improve the efficiency of hospital treatment of patients from different urban spaces.
In the optimal weighted accessibility model, there are inequalities in travel time between residential areas to hospitals of different levels. This means that the only option for residents requiring fast general treatment is low-level hospitals. If such residents suffer from complicated diseases requiring high-level hospital care, it will be costly in time and expense for them to go there. We suggest that the government should avoid blindly pursuing economic benefits and ignoring quality of public service. Especially for hospital resources organized on an Inverted Pyramid model, the government should strengthen support for low-level hospital construction and constantly upgrade the quality and coverage of those hospitals so as to promote a better hospital resource allocation balance [54].
In addition, our study revealed that there are significant differences in the accessibility distribution frequencies to hospitals of three quality levels under two transport modes in different time periods. Zeng observed similar hospital grade differentiation characteristics in a study of the accessibility of hospitals in Nanjing [3]. However, compared with other cities, the frequency change of hospital accessibility level in the city of Kaifeng is complex, and the ratio of residential areas to high-quality hospitals is much higher than that of basic hospitals. Spatially, the accessibility grade of residential quarters shows significant spatial differentiation and spatial agglomeration. Residential areas with better accessibility are concentrated in old urban areas, while those with lower accessibility are concentrated in new urban areas and urban fringe areas. The overall pattern of hospital accessibility in Kaifeng is similar to that in most Chinese cities; for example, Nanjing, Shenzhen, and Changchun [3,24,49], decreasing from the old town center towards the periphery.
The old urban area of Kaifeng has gathered most of the high-quality hospitals. Also, this area usually has a high degree of mixed land use and a compact road network. On the contrary, infrastructure construction in the new urban area and urban fringe areas lags behind construction in the old urban area. At present, the new urban area is the main focus of the planning and urban expansion is being undertaken by the Kaifeng municipal government. However, the profit-seeking nature of business means that developers focus only on short-term profits. In the absence of infrastructure allocation, their large-scale development of shantytowns has led to the premature construction of new urban development zones and residential areas at the edge of the city. Many residential areas are often isolated residential buildings with extremely poor public transport services and no hospital, educational, or other supporting facilities. As a result, the rapid expansion of built-up urban areas and the dual role of key development directions of urban planning and construction have resulted in spatial mismatch between the new urban area and the existing hospitals in Kaifeng. This situation hinders the improvement of hospital accessibility on land in the new urban area. Thus, the spatial distribution of public service facilities resources in most cities in China is uneven, public service facilities are mainly concentrated in the old urban areas, and resources in urban fringe areas lag behind.
Under the socialist market economy, the government plays a leading role in the spatial allocation of resources, as well as urban planning and construction, which makes it difficult for hospitals to plan their layout according to the needs of the local population. We hope that the government will relax the access restrictions of hospital resource planning agencies. New high-quality hospitals should be built outside old urban areas to adjust more easily to the trend of urban development and the demands of the regional population. At the same time, urban planning and construction should pay more attention to the present and future direction of urban development, strengthen control over the market economy, and limit the premature development of residential areas with inadequate services, such as new urban areas and urban fringes.
This study was an attempt to evaluate the spatial accessibility of urban hospitals using the big data platforms of web maps. Furthermore, real-time measurement highlights the temporal significance of accessibility research, providing a more microscopic and refined perspective for the study of accessibility. For example, the Euclidean distance measurement method was used to evaluate the spatial pattern of facility accessibility [3], but the study completely neglected a large number of water bodies and mountains that were located along the path of the Euclidian distances measured in the study area. In some studies [16,25,28,31,32], the average time of travel as recorded in the government statistics was used as the transportation cost in the network analysis. They also added distance walked to reach the destination to improve the accuracy of accessibility [25]. When we use the web maps navigation service, multi-modes of transportation features are automatically added in the travel path planning, and the time required for transfer between public routes is also considered in the calculation when traveled by bus. Some scholars have applied web maps to facility accessibility studies; they usually select data within a certain time threshold to study and consider the facilities located beyond a certain time threshold have zero attractiveness to residents [24,43,50,51]. Generally, the selection of time threshold has some subjectivity. In this study, we considered the various technical levels and hospital levels in the model. We gave different weights to different hospital levels, and established the mathematical model of optimal weighted accessibility. This model is simple, easy to operate, and more suitable for evaluating the real conditions affecting travel choices. We choose two travel periods, peak and non-peak, which also make the temporal significance of reachability study more distinct.
Finally, it should be pointed out that there are still some limitations in this study: The travel path data in this paper sample peak and non-peak conditions on one day only; thus, different results may be obtained for different dates and travel times. Due to a lack of specific population size data and survey data on the behavioral preferences of residents, spatial pattern accessibility results may still deviate from actual experienced accessibility. These problems will be considered in future research.

Author Contributions

Conceptualization, Z.Z., H.X., S.A., Y.Q. and L.Z.; Data curation, Y.L. and Z.X.; Formal analysis, Z.Z. and Y.L.; Funding acquisition, L.Z. and Y.Q.; Methodology, Z.Z., H.X. and Z.X.; Project administration, Y.Q.; Writing—original draft, Z.Z.; Writing—review & editing, S.A, H.G., H.X. and Y.Q.

Funding

This research was funded by the National Science Foundation of China (41501588, 41671536), the China Postdoctoral Science Foundation (2016M600575), Henan Provincial Philosophy and Social Science Foundation (2014CJJ065), the China Postdoctoral Science Foundation (2017M622333) and the program for Key Scientific Research Project of Henan Higher Education (17A170006, 18A170002).

Acknowledgments

We acknowledge Gaode Map for offering public web mapping APIs and relative travel data.

Conflicts of Interest

The authors declare no conflict of interest.

References

  1. Zhao, X.; Wang, W.; Wan, W. Regional inequalities of residents’ health level in China: 2003–2013. Acta Geogr. Sin. 2017, 72, 685–698. [Google Scholar]
  2. WHO Sustainable Health Financing, Universal Coverage and Social Health Insurance. Available online: http://apps.who.int/iris/bitstream/10665/20383/1/WHA58_ 33-en (accessed on 27 November 2018).
  3. Zeng, W.; Xiang, L.; Li, H.; Zhang, X.; Zhang, H. Spatial Pattern of Access to Health Care Facilities and Its Formation Mechanism in Nanjing. Econ. Geogr. 2017, 37, 136–143. [Google Scholar]
  4. Tobias, M.; Silva, N.; Rodrigues, D. A107 perception of health and accessibility in amazonia: An approach with gis mapping to making decision on hospital location. J. Trans. Health 2015, 2, 60–61. [Google Scholar] [CrossRef]
  5. Tali, A.F.; Asima, N.; Aasif, N. Accessibility to Higher Order Public Health Centers a Study of District Pulwama (J&K). Int. J. Sci. Res. Sci. Technol. 2017, 3, 55–61. [Google Scholar]
  6. Neng, W.; Bin, Z.; Troy, S. A three-step floating catchment area method for analyzing spatial access to health services. Int. J. Geogr. Inf. Sci. 2012, 26, 1073–1089. [Google Scholar]
  7. Zhen, L.; Ping, W. Establishing Primary Care to Correct Misallocation of Health care Resource. Chin. Health Econ. 2011, 30, 24–27. [Google Scholar]
  8. Si, Z.; Shi, Y. The Impacts of Class 3A Comprehensive Hospitals on Population Distribution and Housing Price—Take Children’s Hospital of Fudan University for Example. Econ. Geogr. 2013, 33, 74–81. [Google Scholar]
  9. National Health and Family Planning Commission. China Statistical Yearbook of Health and Family Planning (2015); Chinese Union Medical University Press: Beijing, China, 2015.
  10. Yang, L.; Li, H.; Li, Y.; Wang, W.; Tan, J. Progress of medical geography and environmental health studies. Prog. Geogr. 2010, 29, 31–44. [Google Scholar]
  11. Smyth, F. Medical geography: Understanding health inequalities. Prog. Hum. Geogr. 2008, 32, 119–127. [Google Scholar] [CrossRef]
  12. Ahmad, S. A GIS Based Investigation of Spatial Accessibility to Health Care Facilities by Local Communities within an Urban Fringe Area of Melbourne. Masters Thesis, RMIT University, Melbourne, Australia, 2012. [Google Scholar]
  13. Braveman, P. Health disparities and health equity: Concepts and measurement. Annu. Rev. Public Health 2006, 27, 167–194. [Google Scholar] [CrossRef]
  14. Kirby, R.S. Geography of Health Inequalities in the Developed World: Views from Britain and North America. Prof. Geogr. 2010, 57, 615–617. [Google Scholar] [CrossRef]
  15. Zhou, J.; Zhong, X. Social Justice in Urban planning: Reflections on Urban Planning in a Perspective of Social Space. Urb. Plann. For. 2016, 5, 9–12. [Google Scholar]
  16. Wang, X.; Yang, H.; Duan, Z.; Pan, J. Spatial accessibility of primary health care in China: A case study in Sichuan Province. Soc. Sci. Med. 2018, 209, 14–24. [Google Scholar]
  17. Guagliardo, M.F. Spatial accessibility of primary care: Concepts, methods and challenges. Int. J. Health Geogr. 2004, 3, 3. [Google Scholar] [CrossRef] [PubMed]
  18. Wang, F. Measurement, Optimization, and Impact of Health Care Accessibility: A Methodological Review. Ann. Assoc. Am. Geogr. 2012, 102, 1104–1112. [Google Scholar] [Green Version]
  19. Hansen, W.G. How Accessibility Shapes Land Use. J. Am. Inst. Plan. 1959, 25, 73–76. [Google Scholar] [CrossRef]
  20. Dalvi, M.Q.; Martin, K.M. The measurement of accessibility: Some preliminary results. Transportation 1976, 5, 17–42. [Google Scholar] [CrossRef]
  21. Wisniewski, S. Spatial Accessibility of Hospital Healthcare in Lodz Voivodeship. Quaest. Geogr. 2016, 35, 157–166. [Google Scholar] [CrossRef]
  22. Hare, T.S.; Barcus, H. Geographical accessibility and Kentucky’s heart-related hospital services. Appl. Geogr. 2007, 27, 181–205. [Google Scholar] [CrossRef]
  23. Sun, Y.; Lv, B.; Zhao, Y. A Study of County Public Service Facilities Distribution Assessment Based on Behavior Investigation and GIS: A Case Study of Medical Facilities in Dengxing. Hum. Geogr. 2015, 30, 103–110. [Google Scholar]
  24. Cheng, G.; Zeng, X.; Duan, L.; Lu, X.; Sun, H.; Jiang, T.; Li, Y. Spatial difference analysis for accessibility to high level hospitals based on travel time in Shenzhen, China. Habitat Int. 2016, 53, 485–494. [Google Scholar] [Green Version]
  25. Hou, S.; Jiang, H. An analysis on accessibility of hospitals in Changchun based on urban public transportation. Geogr. Res. 2014, 33, 915–925. [Google Scholar]
  26. Talen, E. School, Community, and Spatial Equity: An Empirical Investigation of Access to Elementary Schools in West Virginia. Ann. Assoc. Am. Geogr. 2001, 91, 465–486. [Google Scholar] [CrossRef]
  27. Yin, C.; He, Q.; Liu, Y.; Chen, W.; Gao, Y. Inequality of public health and its role in spatial accessibility to medical facilities in China. Appl. Geogr. 2018, 92, 50–62. [Google Scholar]
  28. Song, Z.N.; Chen, W.; Che, Q.; Zhang, L. Measurement of Spatial Accessibility to Health Care Facilities and Defining Health Professional Shortage Areas Based on I mproved Potential Model—A Case Study of Rudong County in Jiangsu Province. Sci. Geogr. Sin. 2010, 30, 213–219. [Google Scholar]
  29. Song, Z.; Yan, T.; Liu, T.; Huang, T. A new gravity P-median model and empirical test in urban comprehensive hospital location decision making: Take Wuxi as an example. Prog. Geogr. 2016, 35, 420–430. [Google Scholar]
  30. Delamater, P.L. Spatial accessibility in suboptimally configured health care systems: A modified two-step floating catchment area (M2SFCA) metric. Health Place 2013, 24, 30–43. [Google Scholar] [CrossRef]
  31. Luo, J.; Chen, G.; Li, C.; Xia, B.; Sun, X.; Chen, S. Use of an E2SFCA method to measure and analyse spatial accessibility to medical services for elderly people in wuhan, china. Int. J. Environ. Res. Public Health 2018, 15, 1503. [Google Scholar] [CrossRef]
  32. Liu, Z.; Yang, H.; Xiong, W.; Chen, G. Spatial Accessibilities of Medical Services at County Level Based on Optimized Two-step Floating Catchment Area Method. Sci. Geogr. Sin. 2017, 37, 728–737. [Google Scholar]
  33. Yiannakoulias, N.; Bland, W.; Svenson, L.W. Estimating the effect of turn penalties and traffic congestion on measuring spatial accessibility to primary health care. Appl. Geogr. 2013, 39, 172–182. [Google Scholar] [CrossRef]
  34. Tao, Z.L.; Cheng, Y.; Dai, T.Q. Measuring spatial accessibility to residential care facilities in Beijing. Prog. Geogr. 2014, 33, 616–624. [Google Scholar]
  35. Zhang, C.; Li, X.; Man, J.Y. Accessibility to Health Care Service of the Affordable Housing Residents in Beijing: Base on GIS Network Analysis. Hum. Geogr. 2017, 32, 59–64. [Google Scholar]
  36. Radke, J.; Mu, L. Spatial decompositions, modeling and mapping service regions to predict access to social programs. Geogr. Inf. Sci. 2000, 6, 105–112. [Google Scholar] [CrossRef]
  37. Luo, W.; Wang, F. Measures of Spatial Accessibility to Health Care in a GIS Environment: Synthesis and a Case Study in the Chicago Region. Environ. Plan. B Plan. Des. 2003, 30, 865–884. [Google Scholar]
  38. Jun, L. Integrating the Huff Model and Floating Catchment Area Methods to Analyze Spatial Access to Healthcare Services. Trans. Gis. 2014, 18, 436–448. [Google Scholar]
  39. Kanuganti, S.; Sarkar, A.K.; Singh, A.P. Evaluation of access to health care in rural areas using enhanced two-step floating catchment area (E2SFCA) method. J. Trans. Geogr. 2016, 56, 45–52. [Google Scholar] [CrossRef]
  40. Joseph, A.E.; Bantock, P.R. Measuring potential physical accessibility to general practitioners in rural areas: A method and case study. Soc. Sci. Med. 1982, 16, 85–90. [Google Scholar] [CrossRef]
  41. Cheng, M.; Lian, Y. Spatial accessibility of urban medical facilities based on improved potential model: A case study of Yangpu District in Shanghai. Prog. Geogr. 2018, 37, 266–275. [Google Scholar]
  42. Chen, J.; Zhou, S.; Liu, L.; Xiao, L. Estimating the effect of traffic congestion on accessibility to emergency medical care services: Take Guangzhou as an example. Prog. Geogr. 2016, 35, 431–439. [Google Scholar]
  43. Su, S.; Li, Z.; Xu, M.; Cai, Z.; Weng, M. A geo-big data approach to intra-urban food deserts: Transit-varying accessibility, social inequalities, and implications for urban planning. Habitat Int. 2017, 64, 22–40. [Google Scholar] [CrossRef]
  44. Wee, B.V. Accessible accessibility research challenges. J. Trans. Geogr. 2016, 51, 9–16. [Google Scholar] [Green Version]
  45. Widener, M.J.; Farber, S.; Neutens, T.; Horner, M. Spatiotemporal accessibility to supermarkets using public transit: An interaction potential approach in Cincinnati, Ohio. J. Trans. Geogr. 2015, 42, 72–83. [Google Scholar] [CrossRef]
  46. Pons, P.T.; Haukoos, J.S.; Bludworth, W.; Cribley, T.; Pons, K.A.; Markovchick, V.J. Paramedic response time: Does it affect patient survival? Acad. Emerg. Med. 2005, 12, 594–600. [Google Scholar] [CrossRef] [PubMed]
  47. Jie, C.; Feng, L.; Han, Z.; Shih-Lung, S. Making place recommendations: An individual accessibility measure to urban opportunities in space and time. Acta Geogr. Sin. 2015, 70, 931–940. [Google Scholar]
  48. Mathers, N.; Huang, Y.C. The future of general practice in china: From ‘barefoot doctors’ to gps? Br. J. Gen. Pract. J. R. Coll. Gen. Pract. 2014, 64, 270–271. [Google Scholar] [CrossRef] [PubMed]
  49. Hao, F.; Wang, S.; Xie, D.; Yu, T.; Feng, Z. Space-Time Accessibility of Commercial Centers in Changchun Urban Area Based on Internet Map Service. Econ. Geogr. 2017, 37, 68–75. [Google Scholar]
  50. Niu, Q.; Wang, Y.; Xia, Y.; Wu, H.; Tang, X. Detailed assessment of the spatial distribution of urban parks according to day and travel mode based on web mapping API: A case study of main parks in Wuhan. Int. J. Environ. Res. Public Health 2018, 15, 1725. [Google Scholar] [CrossRef] [PubMed]
  51. Xu, M.; Xin, J.; Su, S.; Weng, M.; Cai, Z. Social inequalities of park accessibility in Shenzhen, China: The role of park quality, transport modes, and hierarchical socioeconomic characteristics. J. Trans. Geogr. 2017, 62, 38–50. [Google Scholar] [CrossRef]
  52. Henan province bureau of statistics. Statistical Bulletin on National Economic and Social Development of Kaifeng City in 2017. Available online: http://www.ha.stats.gov.cn (accessed on 10 November 2018).
  53. Zhang, Z.; Liu, H.; Yang, Y. Urban spatio-temporal expansion process for resource-exhausted cities: A case study of Huaibei city. Geogr. Res. 2018, 37, 183–198. [Google Scholar]
  54. Zhong, S.; Yang, Z.; Chen, R. The accessibility measurement of hierarchy public service facilities based on multi-mode network dataset and the two-step 2SFCA: A case study of Beijing’s medical facilities. Geogr. Res. 2016, 35, 731–744. [Google Scholar]
  55. Karimi, H.A. A comparative analysis of routes generated by Web Mapping APIs. Cartogr. Geogr. Inf. Sci. 2015, 42, 33–43. [Google Scholar]
  56. Zhou, X.; Kim, J. Social disparities in tree canopy and park accessibility: A case study of six cities in Illinois using GIS and remote sensing. Urban For. Urban Green. 2013, 12, 88–97. [Google Scholar] [CrossRef]
  57. Wang, F.; Xu, Y. Estimating OD travel time matrix by Google Maps API: Implementation, advantages, and implications. Geogr. Inf. Sci. 2011, 17, 199–209. [Google Scholar]
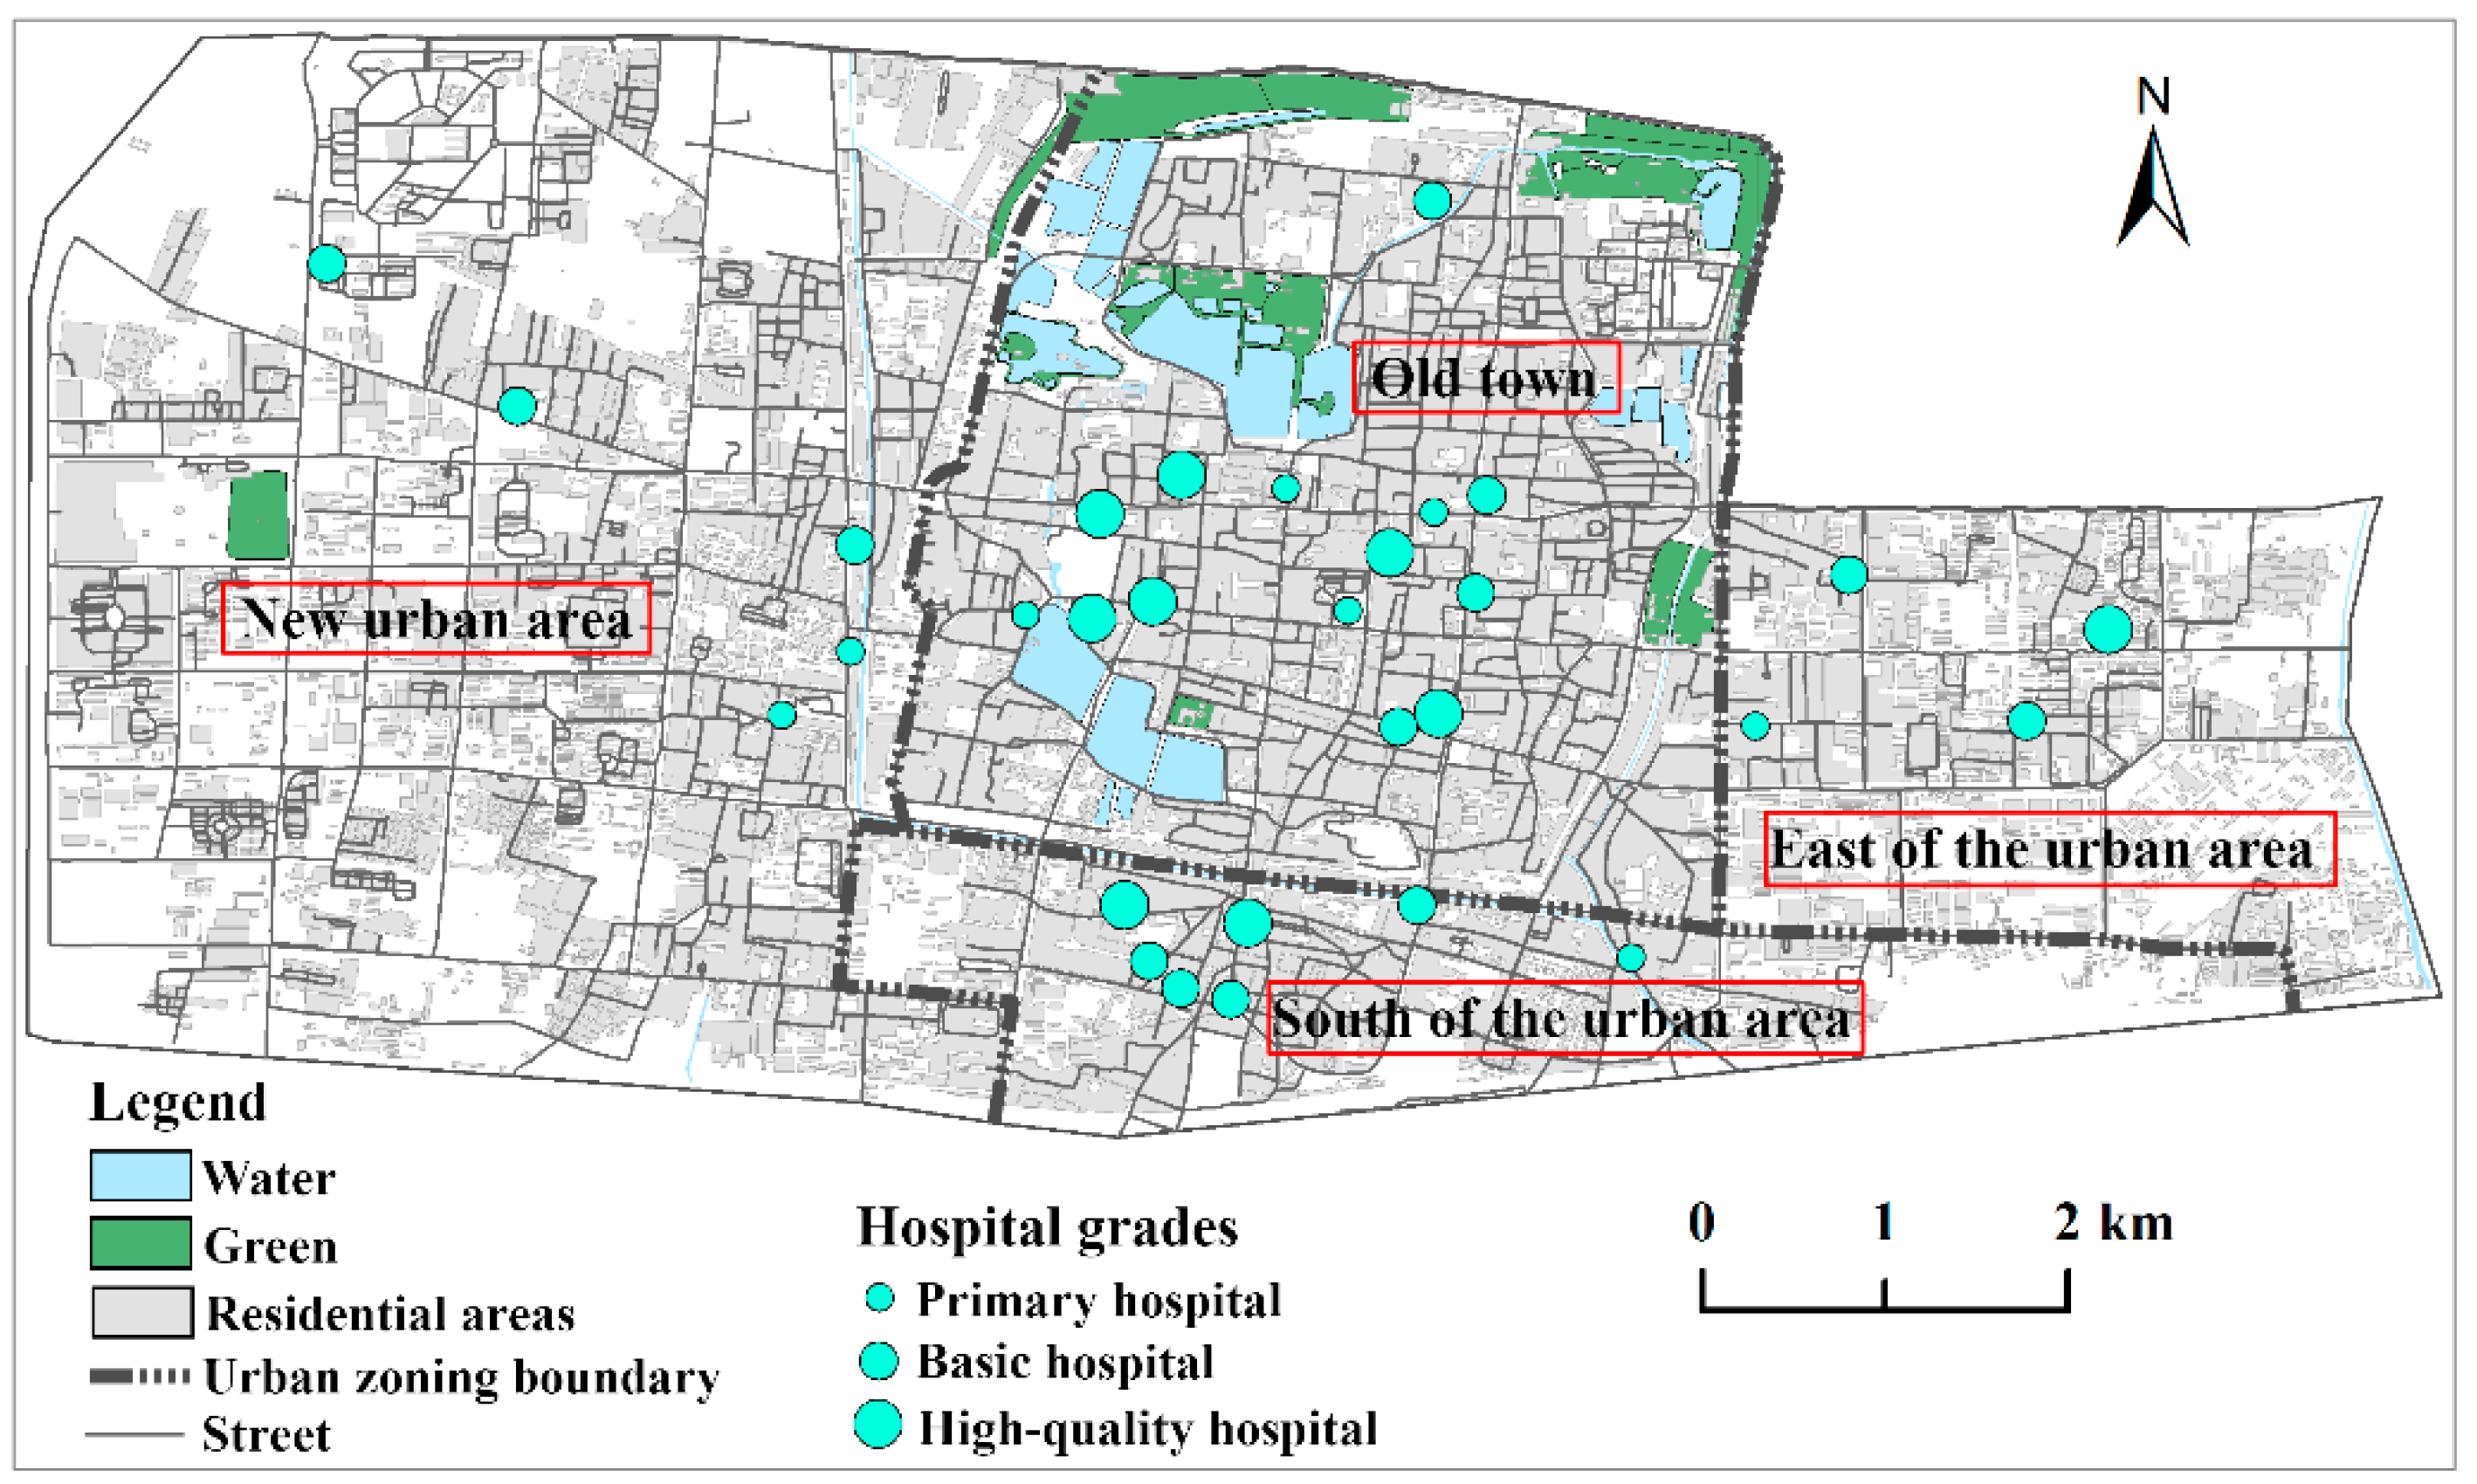
Figure 1. Location of the study area in Kaifeng.
Sustainability 11 01160 g001
Figure 2. Navigation path and time consumption. (a) An example: navigation path and time; (b) Optimal navigation path and time for residential area self-driving transport to hospital during off-peak travel times.
Sustainability 11 01160 g002
Figure 3. Box-plots for the baseline travel time. (a) Off-peak periods self-driving transport; (b) Peak periods self-driving transport; (c) Off-peak periods public transport; (d) Peak periods public transport. Box boundaries are the 25 and 75 percentiles, and the circle indicates each outlier.
Sustainability 11 01160 g003
Figure 4. Box-plots of travel times at different hospital levels based on Ai. (a) Off-peak periods self-driving; (b) Peak periods self-driving; (c) Off-peak periods public transport; (d) Peak periods public transport. Box boundaries are the 25 and 75 percentiles, and the circle indicate each outlier.
Sustainability 11 01160 g004
Figure 5. Accessibility level frequency distribution. (a) Off-peak periods public transport; (b) Peak periods public transport; (c) Off-peak periods self-driving transport; (d) Peak periods self-driving transport.
Sustainability 11 01160 g005
Figure 6. Accessibility level spatial distribution. (a) Off-peak periods public transport; (b) Peak periods public transport; (c) Off-peak periods self-driving transport; (d) Peak periods self-driving transport.
Sustainability 11 01160 g006
Table 1. Accessibility classification.
Accessibility LevelsExtreme PoorPoorMediumBetterBest
Public transport0.01~0.030.03~0.060.06~0.070.07~0.8>0.80
Self-driving0.02~0.080.08~0.090.09~0.140.14~1.10>1.10