Article

Supporting Sustainable Maintenance of Substations under Cyber-Threats: An Evaluation Method of Cybersecurity Risk for Power CPS

1
School of Electrical Engineering and Automation, Wuhan University, Wuhan 430072, China
2
School of Power and Mechanical Engineering, Wuhan University, Wuhan 430072, China
*
Authors to whom correspondence should be addressed.
Sustainability 2019, 11(4), 982; https://doi.org/10.3390/su11040982
Submission received: 18 January 2019 / Revised: 8 February 2019 / Accepted: 12 February 2019 / Published: 14 February 2019
(This article belongs to the Section Energy Sustainability)

Abstract

:
In the increasingly complex cyber-environment, appropriate sustainable maintenance of substation auto systems (SASs) can lead to many positive effects on power cyber-physical systems (CPSs). Evaluating the cybersecurity risk of power CPSs is the first step in creating sustainable maintenance plans for SASs. In this paper, a mathematical framework for evaluating the cybersecurity risk of a power CPS is proposed considering both the probability of successful cyberattacks on SASs and their consequences for the power system. First, the cyberattacks and their countermeasures are introduced, and the probability of successful cyber-intruding on SASs is modeled from the defender’s perspective. Then, a modified hypergraph model of the SAS’s logical structure is established to quantitatively analyze the impacts of cyberattacks on an SAS. The impacts will ultimately act on the physical systems of the power CPS. The modified hypergraph model can describe more information than a graph or hypergraph model and potentially can analyze complex networks like CPSs. Finally, the feasibility and effectiveness of the proposed evaluation method is verified by the IEEE 14-bus system, and the test results demonstrate that this proposed method is more reasonable to assess the cybersecurity risk of power CPS compared with some other models.

1. Introduction

A cyber-physical system (CPS) is a complex system that performs the functions of monitoring, controlling, and collaborating physical systems through its computation and communication kernels [1]. The combination of power system and CPS technologies motivates the advancement of smart grids. In addition to research on the architecture of smart grids, researchers have also paid special attention to the interactions between cyber systems and physical systems, and have found that tighter coupling of cyber space and physical space gives rise to more security risks [2,3].
Cyber threats emerge because of potential benefits for economic, political or military purposes. This makes critical infrastructures (e.g., power systems) vulnerable to not only safety problems attributed to physical failures of equipment, but also security problems caused by cyberattacks. Some information security threats against critical infrastructure have happened all over the world in recent years and are listed as follows: The subway system in Poland was attacked in 2008. A computer virus named “Stuxnet” attacked the Supervisory Control and Data Acquisition (SCADA) system that ran in the computers of Iran’s nuclear program in 2010. The municipal water supply system of a city in Illinois was attacked in 2011. Both the Ministry of Petroleum and the National Iranian Oil Co. in Iran were attacked by the computer virus “Flame” in 2012. A blackout caused by a malicious code called "BlackEnergy" occurred in Ukraine in 2015. These are all examples of cyberattacks implemented on critical infrastructures, each of which is a complex system with tight coupling between its cyber and physical components. The attacks exploiting the vulnerabilities of these CPSs usually have significant impacts and serious consequences. For example, the disturbance of some vulnerable components can potentially trigger subsystem collapse, or even failure of the entire system [4,5]. Substation auto systems (SASs) are basic and important components in power CPSs. The sustainable maintenance of SASs is necessary in the increasingly complex cyber-environment nowadays because of the positive effects on power CPSs, such as reduced costs to replace equipment damaged by cyberattacks, reduced labor cost to inspect and fix information systems, reduced power system losses, and enhanced power-supply reliability. The cybersecurity risk evaluation of power CPSs is the first step in creating a sustainable maintenance plan for an SAS. It can provide guidance for upgrading and updating its information systems or developing its defensive strategies [6,7].
Some representative cyberattacks against power CPSs include denial of service (DoS) attack [8,9], false data injection attack (FDIA) [10], and replay attack [11]. They prevent legitimate requests from being fulfilled in a timely fashion or fool the protection and control system by injecting fake information into it. As a result, the actuators may malfunction, which will lead to a series of collapse behaviors of the CPS, and the power system will consequently be out of order. According to security threats to assets resulting from inadvertent events and deliberate attacks, the IEC 62351 series of standards on data and communication security of power systems sum up four security requirements. They are confidentiality, integrity, availability, and non-repudiation. Some common countermeasures can deal with typical attacks to meet the above requirements, such as applying symmetric and asymmetric encryption, authorizing role-based access control (RBAC) or installing an intrusion detection systems (IDS). Some countermeasures of each requirement are listed in IEC TS 62351-1. These technical specifications also convey that not all security countermeasures are needed or desired all the time for all systems, otherwise it would be overkill and would tend to make the entire system unusable or very slow. Therefore, security risk assessment is vital to determining exactly what needs to be secured against what threats and to what degree of security [12].
A cyberattack on an SAS takes effect when it aims at the vulnerabilities of the cyber-network. The most popular vulnerability analyzing method is the use of complex network and graph theory to establish a network topology model. This model is helpful to assess the efficiency of the communication network [13], the structural vulnerability of the power network [14], or the overall vulnerability through inter-network dependency [15,16,17]. Hypergraph theory has been used to model the logical structure of SASs because it makes modeling a network with heterogeneous nodes or a network of networks feasible. In our previous research work [18], each logical function consisting of several logical nodes in an SAS is defined as a hyperedge in hypergraph theory. Then the efficiency indexes are defined by choosing some indexes from the hyper-network model of each SAS. A CPS’ effectiveness model is established taking the functional influence after an attack into account to identify the critical elements of the CPS. In addition, Reference [18] has introduced the cyberattack process procedures and divided the data attacks on SASs into two categories, data tampering attack and data jamming attack, according to their impact. Also, it has provided a new avenue for the research in this paper and the contrastive test results. However, some key characteristics of complex systems are discarded to simplify that research process; for example, the connections between logical nodes (LNs) in SASs are ignored in the hypergraph model and only the integrity of logical function is roughly considered. The modified hypergraph method is a hypergraph model with links added between nodes. It is adopted to model the cyber and physical networks of SASs in this paper, since it contains more details than a graph or hypergraph model, although only the basic definitions of modified hypergraph are used to model an SAS according to IEC 61850 here. Based on these, the impact of data error propagation caused by a data tampering attack on an SAS can be mathematically modeled and that of time delay accumulation caused by data jamming attack can be mapped to the SAS’s logical structure. Then it is possible to analyze and show the impact expansion process step by step. Furthermore, the modified hypergraph model potentially has greater ability to analyze complex networks like CPSs; for example, spectral analysis methods in graph and hypergraph theories have helped to realize deep mining of complex network information and extraction of complex network features.
Some studies on maintenance strategies to prevent cyberattacks on power systems also exist, such as redesigning communication links based on the existing DoS technologies, updating IDS, and increasing sensor nodes or phasor measurement units (PMUs) to improve the system’s ability to detect cyberattacks [19,20]. The budget for sustainable maintenance should take numerical risk evaluation results into consideration first. A security-oriented stochastic risk management technique, CPINDEX, is presented in Reference [21]. It measures the security level of the cyber–physical system by cyber–physical security indexes. In order to obtain the values of these indexes, cyber–side instrumentation probes need to be installed. A method to evaluate the cybersecurity risk of a CPS under cyberattack without installing extra instruments is proposed in Reference [22]. It presents the successful attack-probability index and the attack-impact index to quantify the risk. However, it does not take into consideration the detailed effect of actions in the physical domain under cyberattack. In view of this, a new evaluation framework of cybersecurity risk is proposed. It combines the probability of a successful series of cybers attacks on an SAS and their ultimate impacts on the physical system. In this framework, the modified hypergraph model of an SAS is helpful to determine the status of physical devices and is favorable for visually displaying the effects of propagation processes in cyber and physical systems.
In this paper, the cyberattack techniques and security countermeasures of SASs are analyzed according to some military cyberspace security research and the IEC 62351 standard series. Based on these analyses as well as the works in References [23,24], a conditional probability of intrusion given an alarm is redefined to model the probability of a successful cybersecurity event happening to an SAS from the defender’s perspective. Then, the logical structure of an SAS according to the IEC 61850 series is described by a modified hypergraph model which is helpful to simulate the effect propagation process after a cyberattack. In light of the detailed analysis of the paths of cyberattack on the SAS, a new mathematical evaluation framework of cybersecurity risk is proposed. The framework takes both the probability of a successful cybersecurity event and its impact on the physical power system into consideration. It can help to solve the first problem of planning sustainable maintenance of substations under cyber-threats, assessing the cybersecurity risk for a power CPS while the ultimate cyberattack targets are in SASs. Finally, the feasibility and effectiveness of the proposed cybersecurity risk evaluation method are verified by the IEEE 14-bus system, and the simulation results demonstrate that the proposed method is more reasonable for evaluating the risk of a power CPS when its SASs are subjected to typical cyberattacks than some other models. Further work on improving the models in this framework and making sustainable maintenance plans is forecasted in the conclusion.

2. Cyber-Security Analysis of the SAS in a Power CPS

2.1. Procedure and Tools of Cyberattacks

It was stated in Reference [12] that deliberate threats can cause more focused damage to facilities and equipment in substations than inadvertent threats. Some sophisticated cyber-attackers seek to damage specific equipment or render critical equipment inoperative in ways that could potentially do more harm to the power system as a whole than just blowing up one substation. In the military field, cyber warfare has been studied in theory and practice. A complete cyberattack process was divided into seven chronological stages in Reference [25]: reconnaissance, scanning, accessing and escalating privilege, exfiltrating data, assaulting, sustaining access, and concealing traces. Sorting out common tools of every stage is helpful to lead researchers to dive into the technical details and refine the model of cyberattacks on SASs. These tools are listed in Table 1. The cybersecurity threats of power systems were summarized as four types: unauthorized access to information, unauthorized modification or theft of information, denial of service, and repudiation/unaccountability [12]. Each of them can be achieved by utilizing some technologies listed in Table 1.

2.2. Paths of Cyberattacks on an SAS

Each cyberattack on an SAS can be defined as a tuple consisting of the attack action and attack target. With the continuous improvement of cyber systems in power CPSs, a single attack can hardly invade them successfully, so intruders need a reasonable combination of cyberattacks. A series of cyberattacks on corresponding targets that occur chronologically and constitute a path of successful intrusion is defined below as a cybersecurity event. A successful cybersecurity event includes the initial attack, attack in process, and ultimate attack on a critical target which may have a serious influence on the physical system.
The technical advances in computer-based applications help to improve the delivery of energy and make it possible for different roles (e.g., utility operators, energy brokers, and end users) to access multiple applications of delivering, transmitting, and consuming energy in a personalized way. Authentication is the base of secure access to computer-based applications. Local mechanisms for authorization are difficult to administer uniformly across the whole power system enterprise. Role-based access control (RBAC) for enterprise-wide use in power systems is defined in the IEC 62351 standard series. It is part of a general authentication, authorization, and accounting infrastructure for access control of data and it helps with central control of access to a shared user base by transporting access tokens. The access tokens can be provided in two generic ways, PUSH and PULL, and there are two mappings in the diagram of RBAC, subject-to-role mapping and role-to-right mapping [26]. They work together to allocate the rights (e.g., view, read, file write, and control) on some objects (e.g., file, printer, terminal, and database record) to a subject (i.e., user or automated agent). Meanwhile, this document provides attackers with a way to obtain some knowledge of the authentication mechanisms.
Substation auto systems intruders can take advantage of the subject’s authorities from inside and outside, such as from the subject in the same SAS, from remote access, from an office network, from the control center, or from adjacent substations, etc. These are enumerated as Intruders 15 in Figure 1.
According to the IEC 61850 standard series, an SAS can be divided into three levels, each of which consists of several logical nodes (LNs) realizing different functions. From the information perspective, an LN is a sub-function located in a physical node that exchanges data with other separate logical entities [27]. From the communication perspective, there are several communication modes between the physical devices, such as MMS, SVM, GOOSE, etc. shown as yellow lightning in Figure 1. Most of the critical devices can be represented as LNs in the logical structure of an SAS. Identifying the potential targets of a cyberattack and mapping them to the logical structure of the SAS are very important for analyzing the intrusion process and quantifying the potential consequences later. It can be seen from Table 1 that accessing and assaulting are the two most threatening attack actions in an intrusion. The corresponding potential targets in an SAS are analyzed and listed in Table 2, including accessing targets inside or outside the SAS, marked as A1, A2, etc., and assaulting targets, marked as C1, C2, etc., in Figure 1.
The intrusions may originate from inside or outside the SAS’s cyber-network and finally have an effect on the LNs, which may influence the physical network of a power CPS. For instance, changing the state of the switches/breakers or the data in merging units (MUs) that can be represented as LNs at the process level will alter the power system topology or operation state directly. Intrusions from inside the SAS always originate from A1 (station bus), A3 (user interface), or devices at the bay level. Attackers from outside the SAS are shown in Figure 1. Then, in order to meet the requirements of subsequent modeling, the attack paths are roughly represented by combinations of targets that are accessed and assaulted, e.g., C6-C1-A1-C8/C9, A6-C5-A4-C2-A1-C8/C9, and A5-C4-A4-C2-A1-C8/C9. A typical case of social engineering attacks is sending a malicious hyperlink or malware to a staff member via e-mails, and then that person’s working computer would become infected via an external device such as a flash drive. Once the infected external device is applied to the SAS cyber-network, the malware can find the attack targets by scanning and then perform the attacks, e.g., by accessing, assaulting, sustaining access, and concealing traces. The path of this cyberattack can be represented as A7-C3-A4-C2-A1-C8/C9.

2.3. Security Countermeasures of the SAS

In order to meet the four security requirements of power system, some commonly used security technologies and services are utilized. For instance, the encryption technologies are used in security measures, such as transport level security (TLS), virtual private networks (VPN), and wireless security. These in turn support some IEC 62351 security standards and public key infrastructure (PKI) to realize the authentication that ensures passwords and certificates are assigned [12]. However, encryption is not recommended for some applications in SAS, such as applications using GOOSE and IEC 61850 and requiring a 4 ms response times, applications using multicast configurations and low CPU overhead. Then the mechanism for allowing confidentiality for applications are defined separately according to concern about the 4 ms delivery criterion [28]. If encryption is not employed, the threat may be an unauthorized modification of information. It can be countered through message-level authentication of the messages. If encryption is employed, there are two threats, unauthorized access to information and unauthorized modification (tampering) or theft of information. Both can be countered through message-level authentication and encryption of the messages.
Countermeasures to some security attacks on SAS have been put forward: a man-in-the-middle attack can be countered through the use of a message authentication code mechanism specified within IEC 62351-8 [26]; a tamper detection or message integrity attack can be countered through the algorithm used to create the authentication mechanism as specified in [28]; and a replay attack can be countered through the use of specialized processing state machines specified in IEC 62351-1 and IEC 62351-6 [12,28]. The technical specifications IEC 61850-8-1 and IEC 62351-4 expound upon the use of MMS in SAS and security specifications for use within or external to the substation, e.g., control center to substation, and substation communications [29,30]. The adopted countermeasures help to prevent the damage caused by cyberattacks, which makes a cybersecurity event include several cyberattacks probabilistic, related to both intruders and defenders.

3. Modified Hypergraph Model of the SAS in a Power CPS

3.1. Introduction to SAS Structure

A power CPS is a complex industrial system comprising computation, communication, and control technologies. Tight coupling and real-time interaction between cyberspace (i.e., information and computation space) and the physical system (i.e., the power system network) are its two salient features. It is difficult to perform accurate risk assessment without a deep analysis of these features. The substation auto system (SAS) is an elementary component of a power CPS and is the most likely target of cyberattack. Taking the IEEE 14-bus system as an example, when a bus is regarded as a node, there are 14 nodes in its physical network. In a power system, a bus usually represents a substation. However, if there is a transformer between two buses, they are considered to be located in the same substation. Assuming a control center is in the IEEE 14-bus system, there are 11 nodes (i.e., 10 substations and one control center) in its cyber-network. All the nodes are shown as blue circles on the right of Figure 2. The middle of Figure 2 is a T1-1 transmission substation. Its SAS has operation, protection, and monitoring functions. As per standard series IEC 61850, each function is performed by multiple logical nodes (LNs), and data carrying the status or behavioral information of physical equipment and devices can only be exchanged between LNs [27]. The left of Figure 2 shows the physical structure of a substation with three levels: station level, bay level, and process level.
Though the structure of a T1-1 transmission substation is simple, with only one incoming line and two outgoing lines, all the basic functions of the SAS are available, e.g., operation, protection, control, and monitoring functions. It has four bays (E01, E02, E03, and D01) and 12 functions (F1 to F12). Bays E01 and E03 share the same structure and functions [27]. Based on the analysis of the standard series IEC 61850, the logical structure of the SAS is summarized and shown in Table 3. It contains the LNs, represented by colored rectangles, and logical links between the LNs of every logical function in the four bays of T1-1. In addition, the full name of every LN is listed in Table 4.

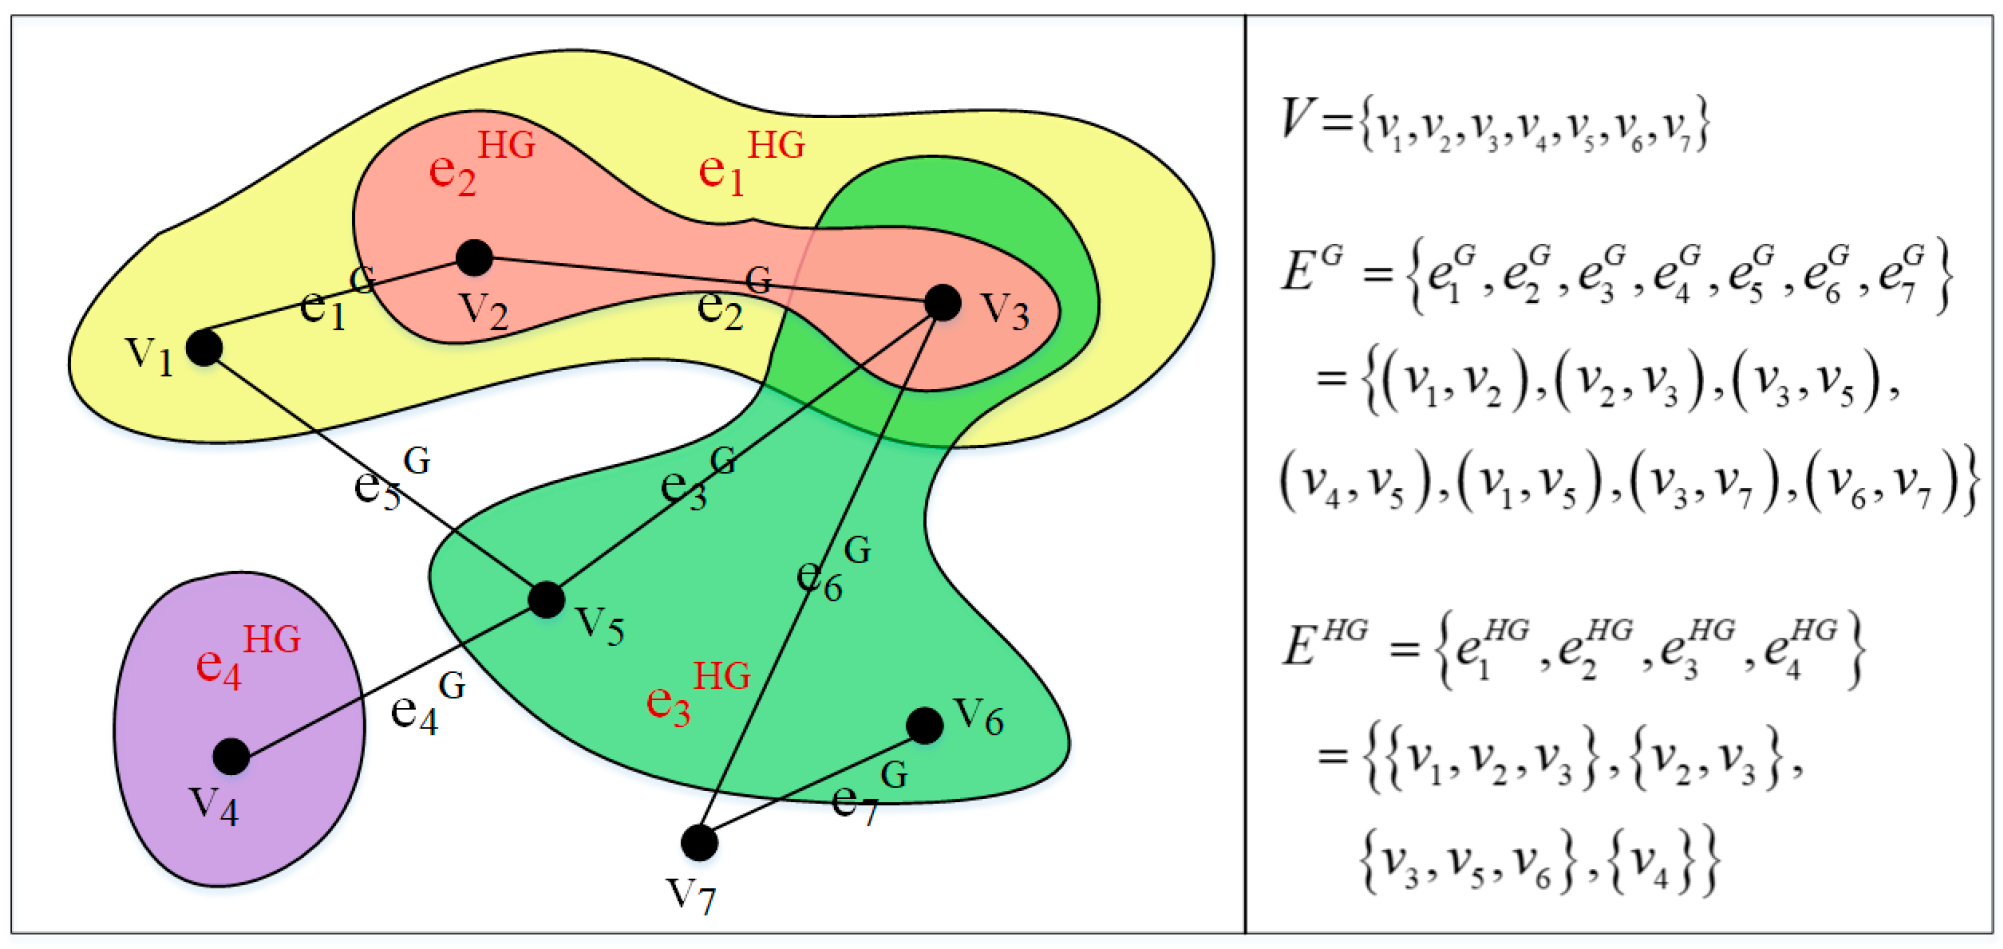
3.2. Definitions of Modified Hypergraph

3.2.1. Basic Definition

The hypergraph theory was proposed by C. Berge in the 1970s [31]. It is a generalization of a graph in which an edge can join any number of nodes. The hyperedge of a hypergraph is defined as a finite set of nodes with a similar property [32], but the links between two nodes are ignored in hypergraph compared with graph theory. The modified hypergraph includes the definitions of nodes and edges in basic graph theory and of hyperedges in hypergraph theory. It exhibits more details in complex networks and is adopted to model the logical structure of an SAS in this paper. The basic definition of a modified hypergraph is introduced first.
The modified hypergraph is a triple H M = ( V , E G , E H G ) , where V = { v 1 , v 2 , , v k } is a set of elements called nodes. E G = { e 1 G , e 2 G , , e m G } is a set of edges in which e m G = ( v i , v j ) is a two-element subset of V , and E H G = { e 1 H G , e 2 H G , , e n H G } is a set of hyperedges in which e n H G = ( v i , , v j ) is a non-empty subset of V .
e i H G ( i = 1 , 2 , , m )
i = 1 n e i H G = V
An example of the modified hypergraph is shown in Figure 3.

3.2.2. Matrix Expressions

• Incidence Matrix
The relationship between nodes and edges in a modified hypergraph H M can be expressed by an incidence matrix. Considering that the communication links, power flow distribution, and logical connections in the SAS are directed, the incidence matrix of a directed graph I M ( G ) = ( b i j G ) k × m is adopted, where the element b i j G is
b i j G = { 1 ,     if   the   edge   e j G   enters   node v i 1 , if the   edge   e j G leaves   node v i 0 ,     otherwise
• Adjacency Matrix
The relationship between any two nodes in a modified hypergraph H M can be expressed by an adjacency matrix. A weighted adjacency matrix A M ( G ) = ( a i j G ) k × k is adopted, where the element a i j G is:
a i j G = { ω i j , if ( v i , v j ) E G 0 , otherwise
where ω i j is the weight of the edge between nodes v i and v j .
• Hyper-Incidence Matrix
The relationship between nodes and hyperedges in a modified hypergraph H M can be expressed by a hyper-incidence matrix I M ( H G ) . Each row of I M ( H G ) corresponds to a node v k , and each column corresponds to a hyperedge e n H G . The element b i j H G in I M ( H G ) = ( b i j H G ) k × n is defined in Equation (5).
b i j H G = { 1 , v i e j H G 0 , v i e j H G
• Hyper-Adjacency Matrix
If a modified hypergraph H M is connected, its hyper-adjacency matrix A M ( H G ) = ( a i j H G ) k × k is symmetric, nonnegative and irreducible [33]. The diagonal elements a i i H G are zero, and other elements a i j H G ( i j ) are the number of hyperedges containing both node v i and node v j . It can be obtained using Equation (6),
a i j H G = { l = 1 n a i j , l H G , i j 0 ,    i = j
where
a i j , l H G = { 1 , if   v i , v j e l H G 0 , otherwise

3.3. Modified Hypergraph Model of the SAS

In order to model the SAS by a modified hypergraph, the LNs are defined as nodes and the logical links between LNs are defined as edges, while each logical function in Table 3 is defined as a hyperedge. Taking the two hyperedges, logical functions F1 and F2 as shown in Figure 4 from Table 3, as examples, F1 is a measurement and metering function with six LNs. MMXU represents the measurand unit/operation. Data obtained from the current transformer (TCTR) and voltage transformer (TVTR) are then processed here as measurement values. These values are used for operations such as power flow monitoring and management, screen display, and state estimation. MMTR represents metering used for commercial purposes. It acquires data from the TCTR and TVTR and carries out an energy calculation. F2 is a distance protection function containing nine LNs. Once the impedance, admittance, or reactance of the line calculated by the TCTR and TVTR exceeds the preset PDIS limit, the line distance protection will be triggered and the XCBR will be open [18].
The modified hypergraph model of an SAS describes the connection between two LNs by edge and the relation between LNs and functions by hyperedge, which overcomes the drawbacks of simple graph or hypergraph methods. The mathematical expressions of the model are easily obtained by the matrices, which is feasible for processing and analysis through a computer. Meanwhile, they are the basis of complex network analysis and computation. Some centrality indexes of the LNs in the graph and hypergraph models can be easily calculated by the abovementioned matrices, which is studied in Reference [18]. The research helps to identify the critical LNs in an SAS when only the structure of the SAS is considered. Besides, the matrix expressions help in analyzing and exhibiting the impact of cyberattacks on the SAS. For instance, the weight of an edge can represent the time delay between two LNs after a cyberattack, and the analysis of other topological properties (connectivity, aggregation, etc.) based on these matrix expressions can play an important role in future research on the creation of sustainable maintenance plans.

4. Evaluation Framework for the Risk of a Power CPS

Figure 5 presents the risk evaluation framework of a power CPS when some SASs in it are under cyberattacks. A power CPS is a complex system that can collapse under an internal or external cyberattacks. A cyberattack on an SAS is defined as a tuple consisting of the attack action and attack target, as described in Section 2. In the proposed evaluation framework, each cyberattack listed in Table 2 is called a cybersecurity factor; several cybersecurity factors that occur chronologically will constitute a cybersecurity event. A cybersecurity event will result in the collapse of the power CPS with a certain probability. Based on the substructure model of Figure 5, the probability of success of a cybersecurity event can be calculated. The superstructure of Figure 5 is based on the modified hypergraph model of an SAS, which attempts to analyze and exhibit the impact on a power CPS numerically after a cyberattack on the SAS.

4.1. Substructure Model

Both the attacker and the defender participate in the game process of SAS cybersecurity. From the perspective of the attacker or defender, the observed probability of a successful intrusion is different. As mentioned in Section 2.1, there are several steps and corresponding tools for attackers to discover the vulnerabilities of an SAS, such as reconnaissance, scanning, accessing, and even exfiltrating data. Attackers try their best to crack the target of every cybersecurity factor. For each cybersecurity factor, there will be only two possible results after a cyberattack on a target, success or failure. So, a cybersecurity factor happening successfully is a discrete event satisfying binomial distribution. Moreover, these cybersecurity factors are independent from each other. Let C F denote a set of cybersecurity factors to be activated by the attacker, whose size is N C F . Then the number of cybersecurity factors needed in a successful cybersecurity event approximately follows a Poisson distribution, which is denoted as N C F P o i ( λ c f ) . The parameter λ c f is the mean value of N C F . The probability mass function (pmf) f ( n c f , λ c f ) and cumulative distribution function (cdf) F ( n c f , λ c f ) of N C F are calculated as follows:
f ( n c f , λ c f ) = P ( N C F = n c f ) = λ c f n c f e λ c f n c f !
F ( n c f , λ c f ) = P ( N C F n c f ) = e λ c f i = 0 f l o o r ( n c f ) λ c f i i !
where n c f is the number of cybersecurity factors needed in a successful cybersecurity event. Figure 6 shows the changes of pmf and cdf with the parameters n c f and λ c f . λ c f represents the cybersecurity level of the target substation and F ( n c f , λ c f ) represents the ratio of controllability somehow obtained by the attacker [24].
The operators of a substation can be seen as defenders who have taken defensive measures against foreseeable attacks according to the standard series IEC 62351. For a defender, it is hard to establish a perfect defense system to determine all malicious intrusions, because, for example, support systems for cybersecurity that need prior knowledge are not able to detect zero-day attacks, internal reconnaissance activities will not be monitored by firewalls, and there are ways for sophisticated attackers to avoid detections by their complex behavior and diverse technologies. Accordingly, there are limitations in estimating the probability of cyberattack from the defender’s point of view. Considering that attack actions may generate logs in the target SAS and support systems, an example is that IDSs set off alarms. So, a Bayesian detection rate-based model is adopted to describe the conditional probability of an intrusion given an alarm P ( I | A ) :
P ( I | A ) = P ( I ) P ( A | I ) P ( I ) P ( A | I ) + P ( ¬ I ) P ( A | ¬ I )
where P ( I ) is the probability of status with one or more intrusions, P ( ¬ I ) is the probability of status without intrusions, P ( A | I ) is the conditional probability of an alarm when an intrusion exists, and P ( A | ¬ I ) is the conditional probability of an alarm when no intrusion exists, which is also called the probability of a false alarm [23].
P ( I ) can be calculated considering the attack actions and their related logs recorded in the SAS, and P ( ¬ I ) = 1 P ( I ) [24]:
P ( I ) = k = 1 n c f F ( k , λ c f ) δ ( c f k ) k = 1 n c f ( F ( k , λ c f ) δ ( c f k ) + γ ( c f k ) )
where δ ( c f k ) is the number of anomaly logs and γ ( c f k ) is the number of normal logs produced while exploiting the cybersecurity factor k .

4.2. Superstructure Model

Intruders conduct cyberattacks with the purpose of changing data in the information or communication system of a substation that helps to perceive the physical world and control behaviors. A cybersecurity event that successfully changes the data in a cyber-system may result in alterations to the state of physical devices or actions that will have an impact on the normal operating status and market clearing results of a power system. Referring to classifications in electronic countermeasures (ECMs), there are mainly two ways to change data according to the effect suffered by the power CPS, a data jamming attack and a data tampering attack [18]. The methods and technologies of cyberattack are not the focus of this paper, so they are briefly introduced with typical examples. A jamming attack seeks to make a device or network resource unavailable to users in time. The most common jamming attack is a denial of service (DoS) attack, which floods the targeted device or resource with superfluous requests in an attempt to overload the communication systems and prevent some or all legitimate requests from being fulfilled [9]. The most common tampering attack is a false data injection attack (FDIA), which can pass through the state estimation and make the user believe that the altered data reflects the real system state. The impacts of jamming attacks and tampering attacks are time delays in the communication network and the emergence of data errors, respectively. Once an SAS in a power CPS suffers a successful cybersecurity event, delays can accumulate or errors can propagate through the cyber—physical networks of the SAS, which can change the operation state of the power system in some way. The analysis and exhibition of time delay accumulation between LNs and error propagation between functions in an SAS are based on the communication network calculus and the modified hypergraph model of the SAS.

4.2.1. Model of Time Delay Accumulation

Abnormal time delays produced by jamming attacks such as DoS, SYN flood, or Smurf attacks can cause the state of the physical system to not change in time, which can trigger a cascading failure of the power CPS. Cumulative time delay is an important index to measure the impact of jamming attacks on an SAS. The time delay of a physical node in an SAS’s communication network can be obtained by modeling the actual information flows and doing the network calculus. Then the time delay is mapped to the modified hypergraph model of the SAS as the weight of an edge next to the LN that contains this physical node. By summing up the weights of the edges along the information flow in the SAS’s modified hypergraph model, the maximum summation value will be the cumulative time delay of this data flow after the jamming attacks.
As shown in Figure 1, traffic flows carry various messages, e.g., SV, GOOSE, MMS, and SNTP, from source devices to corresponding destinations through station bus and process bus networks in an SAS. A port connection model of the communication network in a substation was established by basic matrix expressions and operations in graph theory. It also considered the communication technologies widely used in SAS, e.g., virtual local-area networks (VLANs) and transmission control protocol (TCP) [34]. The mapping from the port connection model to the modified hypergraph model of the SAS is relatively easy to achieve, since the properties of devices are known by the operators of a substation. Therefore, it is adopted to emulate the actual communication network in an SAS.
Taking the modeling and calculation methods of power flow in a power system as reference, the information traffic flow model in the actual communication network of the SAS can be established by the existing graph theory and matrix analysis [35]. The first step is to establish the algebraic equations of the substation’s communication network as follows:
F ( D , V , I ) = 0
where I is the injected data flow vector of actual communication nodes, which is treated as the injected current vector of nodes in the power network; D is the time delay vector, which is treated as the voltage vector in the power network; and V is the information velocity vector, which is related to the parameters of the devices in the communication network, such as the type and length of the transmission medium, the information processing rate, and the equivalent bandwidth of the switch. Therefore, F ( · ) = 0 is a set of linear algebraic equations characterizing the information flow, like Equation (13). If the matrices I and V are given, then the time delay vector D can be calculated by the appropriate algebraic equation solution method.
I = V · D
Considering that the data in the network will not disappear for no reason, the total data input equals the total data output for every node, which is called flow conservation [35]. For a node in the port connection model, it can be described by the equation:
I i n ( t ) + I e m ( t ) = I l o ( t ) + I o u t ( t )
where, I i n ( t ) represents the information flux into a node; I o u t ( t ) represents the flux out of a node; I e m ( t ) is the flux emerging in this node because of information forwarding based on the information transmission mechanism of protection and control defined in the IEC 61850 standard series, or because of the jamming attacks; I l o ( t ) is the lost flux for some reasons, such as the rectification or packet loss mechanism.
The traffic flow velocity of a line in the communication network can be obtained directly from its type and parameters. Equivalent traffic flow velocity of a physical node, e.g., a router or a switch, needs to be calculated by the network calculus theorem based on the arrival curve and service curve of the node [36]. The arrival curve α ( t ) = r t + b , proposed by Cruz [37], provides the upper bound of traffic flow arriving at a physical node. As I ( t ) is the bit number on the traffic flow in time interval [ 0 , t ] , I is constrained by α if and only if t 1 t 2 :
I ( t 1 ) I ( t 2 ) α ( t 1 t 2 ) = r ( t 1 t 2 ) + b
where r is a burstiness parameter representing the maximum continuous arrival rate of the data stream for the traffic flow; b is an upper bound on the long-term average rate of the traffic flow.
The service curve β ( t ) = R max { t T , 0 } means that a flow will receive the service of rate R in time T after it arrives at the physical node. It provides the lower bound of traffic flow arriving at a physical node. Then the physical node’s output flow bounds can be calculated by the operator by min-plus deconvolution of the data flow’s arrival curve and the physical node’s service curve [36].
α * = α β = sup u 0 [ α ( t + u ) β ( u ) ]
In a communication network, the upper bound of a physical node’s time delay at time t is determined by the maximum horizontal deviation between α and β , h ( α , β ) :
d ( t ) h ( α , β ) = sup u 0 { inf [ τ 0 ; α ( u ) β ( u + τ ) ] }
where sup { S } means the least upper bound and inf { S } means the greatest lower bound of subset S [34].
Then, the equivalent velocity of data flow past a physical node that is an element in V can be determined by the equivalent bandwidth b d ( · ) corresponding to the node’s service curve. b d ( · ) equals the tangent slope of α ( t ) at the point t = d when the transmission rate of node c o u t satisfies α ( t ) c o u t ( t + d ) .
b d ( α ) = sup u 0 α ( u ) u + d
Furthermore, each element in matrix D , which represents the queuing delay and transmission delay of a physical node, will be solved from Equation (13) based on the above method. If the physical node is a switch, it should be added by a packet receiving delay and processing delay of 3 microseconds.
Finally, according to the mapping between the node in the actual communication network and the node in the modified hypergraph model of SAS, every data flow in the actual communication link topology can be expressed as a set of edges in the SAS’s modified hypergraph model. Note that an edge may have different weights in different communication links. The accumulated time delay of the data flow passing through a certain path can be calculated by finding the maximum summed weight of each set of edges. The modeling and calculating procedure is given in the pseudo code Algorithm 1.
Algorithm 1. Modeling and calculating time delay accumulation under jamming attacks.
Note: The equation of the data flow network is I N s o u r c e × 1 i n = V N s o u r c e × N R o u t e D N R o u t e × 1 .
Input: The actual communication network topology, the parameters of devices in the communication network, the types of data injected, the priority queuing in the SAS, the targets of jamming attacks, jamming attack technology, and the modified hyper-graph model of the SAS.
Output: The time delay of data flows mapped to the modified hyper-graph model.
Initialization: The number of information sources N S o u r c e , the types of information sources, the initial state of data paths in communication network I R o u t e ( 0 ) , and the matrix expressions of the modified hypergraph model of SAS k before jamming attacks I ( G B e f o r e k ) and A ( G B e f o r e k )
Step 1: Construct the vector of injected information flow I N s o u r c e × 1 i n = ( i i j i n ) N S o u r c e × 1
for i ← 0 to N S o u r c e 1 do
   i i 1 i n = 185;// if the information source i is an intelligent electronic device (IED) && the type of message is GOOSE
   i i 1 i n = 152;// else if the information source i is MU && the type of message is SV
   i i 1 i n = 524;// else if the information source i is PC && the type of message is MMS
   i i 1 i n = ∞;// else
end for
Step 2: Construct the matrix of the communication network connection I C o m L i n k = [ I C o m L i n k 1 I C o m L i n k 2 ] = [ ( i i j p l ) p × p ( i i j v l ) ( N p o r t p ) × ( N p o r t p ) ] N p o r t × N p o r t , where p represents port.
i i j p l = 1 ;// if there is a connection between port i and port j , and they are in different devices
i i j v l = 1 ;// if there is a connection between port i and port j , and they are in the same device
i i j p l = 0 , i i j v l = 0 ;// else
Step 3: Calculate the matrix of data flow path I R o u t e = ( i i j r o u t ) N S o u r c e × N P o r t by the iterative method,
I R o u t e ( 0 ) = ( I R o u t e ( 0 ) × I C o m L i n k 1 ) I R o u t e ( 2 k ) = ( I R o u t e ( 2 k 1 ) × I C o m L i n k 2 ) I R o u t e ( 2 k + 1 ) = ( I R o u t e ( 2 k ) × I C o m L i n k 1 ) I R o u t e = I R o u t ( 0 ) + 2 I R o u t ( 1 ) + ( 2 k + 1 ) k = 1 m I R o u t ( 2 k ) + ( 2 k + 2 ) k = 1 m I R o u t ( 2 k + 1 )
where if i i j r o u t is positive, this indicates output, if i i j r o u t is negative, this indicates input, and the iteration number m is the number of switches in the longest information path.
Step 4: Construct the equivalent bandwidth matrix B = ( b i j ) N S o u r c e × N P o r t of the data stream between switch port j and information source i according to Equation (18). The element b i j is calculated as follow:
b i j = l i ( c o u t n = 1 N t o t a l H P r n H P ) l max L P + n = 1 N t o t a l H P l n H P + n = 1 N t o t a l E P l n E P
where l i is the length of the message for source i and c o u t = 100 Mbps. The superscript HP means the priority of source n is higher than that of source i . The superscripts EP and LP represents equal to and less than, respectively.
Step 5: Calculate the equivalent velocity matrix V N R o u t e × N R o u t e = d i a g ( v 11 , v 21 , v 22 , , v n r , , v N S o u r c e N R o u t e ) :
v n r = 1 / n = 1 N t o t a l u p p o r t ( 1 / b n p )
where v n r represents the equivalent velocity of data flow from source n along path r and p is the number of uplink ports in path r of source n .
Step 6: Calculate the delay matrix of different data paths, D N R o u t e × 1 .
Step 7: Map the actual communication paths to sets of edges in the modified hyper-graph model of the SAS, assigning the maximum summed weight of each edge set to the accumulated time delay of data flow from the original LN to its destination.

4.2.2. Model of Data Error Propagation

Tampering attacks on the SAS will produce data errors, which may lead to misjudgments of the protection and control functions in the SAS. If the attacks succeed, the deviations of data generated on an LN will propagate among its related functions and eventually be transmitted to physical devices at the process level, such as switches or circuit breakers (CBs). This will likely result in mis-operation of physical devices and the changes in power system’s operation state. The functions are represented by hyperedges in the modified hypergraph model of an SAS. Finding out the relationship between two functions based on their co-contained LNs will aid in the analysis of the propagation range of the data error produced in an LN after a data tampering attack. Obviously, if the two functions in the same bay have more identical LNs, the data errors are more likely to propagate between them. However, the data errors can also be propagated from one function to another via a third one in the situation that an LN in the third function is a neighbor to the LN in the first function and a neighbor to the LN in the second function as well. The similarity between hyperedges is defined to quantify the possibility of a data error propagating between two functions. It contains the possibility of two functions being connected directly or indirectly through certain LNs. Referring to the transfer coefficient in a social graph, which is defined as the ratio of the number of persons who know each other among an individual’s acquaintances to the total number of that individual’s acquaintances, the similarity between hyperedges can be calculated by the sum of two ratios. One is the ratio of the number of common LNs to the number of total LNs in two hyperedges. The other is the ratio of the number of hyper-triangles constructed by LNs in two hyperedges to the total number of combinations by three LNs in two hyperedges [38].
There are two types of hyper-triangles, real analogous hyper-triangles. Real hyper-triangles consist of three nodes from three hyperedges, while analogous hyper-triangles consist of three nodes from two hyperedges [33]. The more hyper-triangles that can be formed by two hyperedges, the larger the second ratio in the similarity between them will be. The similarity adjacency matrix of hyperedges A s i m obtained from the modified hypergraph model of the SAS can be used to analyze the probability of data error propagation from one function to another after a tampering attack on an LN. The modeling and calculating procedure is given in the pseudo code Algorithm 2.
Algorithm 2. Constructing the similarity adjacency matrix of hyper-edges A s i m .
Input: The modified hyper-graph model of SAS, the attributes of the target L N T a r and the hyper-edge name H E T a r it belongs to
Output: A s i m
Initialize: The number of hyper-edges N H y p e r T r a n g l e = 0, hyper-incidence matrix I M ( H ) = ( I i j M H ) N L N × N H E .
Step 1: Define a function IsHyperTrangle() to judge whether three logical nodes and two hyper-edges can form a hyper-triangle. If yes, return 1, otherwise return 0
#define int IsHyperTrangle(HE1,HE2,LN1,LN2,LN3, I M ( H ) )
{
   ( A e H E 1 H G ) L N 1 L N 2 = 0 ; ( A e H E 2 H G ) L N 2 L N 3 = 0 ; ( A e H G ) L N 3 L N 1 = 0 ; // Initialization
   ( A e H E 1 H G ) L N 1 L N 2 = I L N 1 H E 1 M H I L N 2 H E 1 M H ; // ( A e H E 1 H G ) L N 1 L N 2 = 1 indicates LN1 and LN2 belong to hyper-edge HE1
   ( A e H E 2 H G ) L N 2 L N 3 = I L N 2 H E 2 M H I L N 3 H E 2 M H ;//
   ( A e H E 0 H G ) L N 3 L N 1 = 0 ;
  for k ← 0 to N H y p e r E d g e 1 do
     ( A e H E k H G ) L N 3 L N 1 = ( A e H E k H G ) L N 3 L N 1 + I L N 3 H E k M H I L N 3 H E k M H ;
  end for
   ( A e H G ) L N 3 L N 1 = s i g n ( ( A e N H E 1 H G ) L N 3 L N 1 ) ;// ( A e H G ) L N 3 L N 1 = 1 indicates LN3 and LN1 belong to a hyper-edge, where s i g n ( x ) is a signum function
  return ( A e H E 1 H G ) L N 1 L N 2 × ( A e H E 2 H G ) L N 2 L N 3 × ( A e H G ) L N 3 L N 1 ;
}
Step 2: Construct the similarity adjacency matrix of hyper-edges A S i m i H E = ( a i j H E ) N H E × N H E .
for i ← 0 to N H y p e r E d g e 1 do
  for j ← 0 to N H y p e r E d g e 1 & j i do
     V i j T o = { v | v e i H G } { v | v e j H G } ; // The set of total LNs in hyperedge i and j.
     V i j C o = { v | v e i H G } { v | v e j H G } ; // The set of common LNs in hyperedge i and j.
     N i j T o = COUNTIF ( v , v V i j T o ) ; // The number of total LNs in hyperedge i and j.
     N i j C o = COUNTIF ( v , v V i j C o ) ; // The number of common LNs in hyperedge i and j.
    for m ← 0 to N i j 1 do
      for n ← 0 to N i j 1 & n m do
        for l ← 0 to N i j 1 & l m & l n do
           A 1 , A 2 , A 3 , A 4 , A 5 , A 6 = 0
           A 1 = IsHyperTrangle (i, j, m, n, l, I M ( H ) );
           A 2 = IsHyperTrangle (i, j, n, l, m, I M ( H ) );
           A 3 = IsHyperTrangle (i, j, l, m, n, I M ( H ) );
           A 4 = IsHyperTrangle (i, j, m, l, n, I M ( H ) );
           A 5 = IsHyperTrangle (i, j, l, n, m, I M ( H ) );
           A 6 = IsHyperTrangle (i, j, n, m, l, I M ( H ) );
           N H y p e r T r a n g l e = N H y p e r T r a n g l e + SUM ( A 1 : A 6 ) / 6 ;
        end for
      end for
    end for
     a i j H E = N i j C o / N i j T o + N H y p e r T r a n g l e / C N i j 3 ; // C N i j 3 is the combination of 3 in N i j T o .
  end for
end for
The error propagation between hyperedges in an SAS may result in changes to a power system’s operational state, especially if the data error propagates to the LNs at the process level. For example, if the data error propagates to the LN named XCBR, the state of the circuit breaker (CB) may be changed. Considering that the LNs at different levels could be targets of a tampering attack and eventually have an impact on the XCBR, there are three possible scenarios: (1) once the XCBR is the ultimate target, the state of the CB will certainly be changed by a successful cybersecurity event; (2) if an LN at the bay level or process level is the ultimate target, the probability that the CB’s state will change is determined by the mean value of the similarities between the hyperedge containing the target LN and the hyperedges in the same bay containing the XCBR; and (3) if the ultimate target LN is at the station level, the probability that the CB’s state will change is always related to human factors, the investigation of which is not within the scope of this study, and the probability that the CB’s state will change is simplified to 0.5.

4.2.3. Model of Cybersecurity Risk Evaluation

A cybersecurity event acting on an SAS successfully can cause the secondary system to malfunction due to the abnormal information flow, which could impact the operations of the primary system and the transmission of power flow. The power CPS’s cybersecurity risk should be calculated considering not only the probability of a successful cybersecurity event, but also the impact on the power system after changes of system operation state are transmitted from the secondary system to the primary devices. The probability of a successful cybersecurity event from the operator’s perspective can be calculated by Equation (10). When calculating the risk transmitted from the secondary system to the primary devices, the modified hypergraph models of SASs are used to quantify the time delay accumulation after a data jamming attack and the data error propagation after a data tampering attack. The probability of a state change to physical devices is determined by the type of ultimate attack action and target LN. Once changes to the physical devices’ state are obtained, changes to the operational state of the power system can be calculated by the concept of power energy entropy (PEE), which is proposed with reference to the definition of Shannon entropy [39].
Power energy entropy can be used to measure the uncertainty of energy distribution after a power system’s operation state changes or when the network topology is altered. For example, changing the state of a CB may cut a branch, which will change the topology and operation state of the power system. E l k in Equation (22) is the energy transferred to line k (node m n ) after the disconnection of line l . It can be calculated by electrical parameters, such as transmission power, voltage amplitude, or the phase angle difference of branches. It shows the cumulative effect of electrical parameter changes in the energy domain. Then H t r i p ( l ) , which is the PEE caused by the disconnection of line l , can be calculated by Equation (23):
E l k = ( δ m n s , U m n s ) ( δ m n , U m n ) [ f p m n , f q m n ] [ d δ m n d U m n ] = δ m n s δ m n ( P m n P m n s ) d δ m n + U m n s U m n ( Q m n Q m n s U m n ) d U m n = δ m n s δ m n [ U m 2 G m n U m U n ( G m n cos δ m n + B m n sin δ m n ) P m n S ] d δ m n + U m n s U m n [ U m 2 B m n + U m U n ( B m n cos δ m n G m n sin δ m n ) Q m n S U m n ] d U m n
where δ m n = δ m δ n is the difference of phase angle between node m and node n ; U m n = U m U n is the difference of voltage amplitude between these two nodes; P m n and Q m n are active and reactive power between node m and node n ; G m n and B m n are the conductance and susceptance of branch k ( m n ); and the superscript S indicates the initial value of the corresponding variables in a steady state.
H t r i p ( l ) = k = 1 N 1 η l k ln η l k = k = 1 N 1 ( E l k k = 1 N 1 E l k ) ln ( E l k k = 1 N 1 E l k )
where η l k = E l k / k = 1 N 1 E l k , with N representing the number of branches in the power system.
If the transferred energy caused by the disconnection of line l is shared with all the other branches, then the accumulated deviation of the potential energy of each branch is the smallest, H t r i p ( l ) has the largest value, and the impact of the line disconnection on the system’s energy transfer is minimal. On the contrary, if all the energy transfer caused by the disconnection of line l is concentrated in one branch, then the accumulated deviation of potential energy of this branch is the greatest, H t r i p ( l ) has the smallest value, and the impact on the system’s energy transfer is maximal.
Once an SAS is under a cybersecurity event leading to disconnection of line l with a probability P p C P S ( C S E , M H S A S , l ) , the final impact on the energy flow of the power system is represented as E ( l ) = 1 / H t r i p ( l ) . Then the cybersecurity risk R p C P S ( C S E , M H S A S , l ) can be calculated as follows:
R p C P S ( C S E , M H S A S , l ) = P C S E ( n c f , λ c f ) × P p C P S ( C S E , M H S A S , l ) × E ( l )
where P C S E ( n c f , λ c f ) = P ( I | A ) , C S E represents a cybersecurity event, M H S A S represents the modified hypergraph model of the SAS, P p C P S ( · ) is the probability of state change of a CB or a switch in line l after a successful cybersecurity event. P p C P S ( · ) is calculated according to the ultimate target logical node (utLN) of C S E :
P p C P S ( C S E , M H S A S , l ) = { 1 , i f   t h e   u t L N   i s   X C B R   o r   c o o w n e d   L N   u n d e r   d a t a   t a m p e r i n g   a t t a c k s   o r   t h e   a c c u m u l a t e d   t i m e   d e l a y   o n   u t L N   i s   s u f f i c i e n t , a i j H E , i f   u t L N   i s   a n   L N   i n   p r o c e s s / b a y   l e v e l   u n d e r   d a t a   t a m p e r i n g   a t t a c k s , e x c e p t   t h e   L N s   c o o w n e d   b y   t w o   h y p e r e d g e s 0.5 , i f   t h e   u t L N   i s   a n   L N   i n   s t a t i o n   l e v e l   u n d e r   d a t a   t a m p e r i n g   a t t a c k s , 0 , i f     t h e   a c c u m u l a t e d   t i m e   d e l a y   o n   u t L N   i s   n o t   s u f f i c i e n t .
Note that the intruder is assumed to have the ability to obtain corresponding rights in order to implement the data tampering or jamming attack. The rights are defined and assigned according to [26], such as read, file write, and control.

4.3. Calculation Flow

There are three steps in the risk evaluation frame of a power CPS’s cybersecurity when the SAS is under attack. The first is to estimate the probability of a successful cybersecurity event in the substructure; the second is to analyze the event’s impact on the SAS; the third is to evaluate the effect of changing the power system’s operational state. The last two are based on the models in the superstructure.
The probability of a cybersecurity event happening successfully means the probability of successful intruding on the SAS. It considers the targets/actions of a cyberattack and the defensive measures implemented in a substation, as illustrated in Reference [12]. A successful cybersecurity event will result in risk being transmitted from the secondary system to the primary system. The transmission process between cyber and physical systems of an SAS can be emulated and computed based on the modified hypergraph model of the SAS. Then the impact on the power system can be evaluated by Equation (24). Figure 7 shows a flow chart of the cybersecurity risk evaluation process for the power CPS when an SAS is attacked by a cybersecurity event.

5. Case Study and Discussions

5.1. Analysis of Cybersecurity Events

A power CPS based on the IEEE 14-bus system was set up to validate the method proposed in this paper. The topological structure of the physical system is shown on the right in Figure 2. It has 14 buses, 5 generators, 11 loads, 3 transformers, and some transmission lines [40]. The topological structure of the cyber system is shown in blue circles in Figure 2. It has 10 substations and one control center. The communication network of a substation is shown on the left in Figure 2. Table 3 shows the logical structures of the logical functions in every bay marked in the middle of Figure 2.
There are two types of cyberattacks, according to their consequences to the information and communication system of an SAS: data jamming attacks, which can cause abnormal time delay accumulation, and data tampering attacks, which can cause data error propagation [18]. Therefore, two cybersecurity events applying two typical technologies as their ultimate attack actions were designed to evaluate the cybersecurity risk of the power CPS in this section. One includes a jamming attack method, DoS, and the other includes a tampering attack method, FDIA.

5.1.1. Cybersecurity Event 1

In cybersecurity event 1, a DoS attack was designed to be launched at three specific LNs in the targeted SAS from three different levels: IHMI at the station level, PDIS at the bay level, and XCBR at the process level.
All the sources are regarded as periodic packets, and the traffic of message injection can be determined by the length of the source message. The length and priority of different message types are set up ahead of time [34]. If the ultimate target of the cyberattack is IHMI, the MMS message is sent from the station PC to the IEDs at the bay level (e.g., the protection IED, PDIS), and its priority is 4. If the target of the cyberattack is PDIS, the GOOSE 1 message is sent from the line protection IEDs to the breaker IEDs, and its priority is 7. If the target is XCBR, the CB state GOOSE message is sent to the line protection IED, and its priority is 5. If the bandwidth is designed to be sufficient in cybersecurity event 1, the traffic flow of the physical communication links can be calculated according to Algorithm 1 in Section 4.2.1. When different target LNs are under DoS attack in cybersecurity event 1, the maximum message delays with the maximum communication load are as shown by the blue blocks in Figure 8.
The cumulative delay on different paths can be increased by inserting messages with higher priority in the queuing sequence, such as the GOOSE message with a priority of 7, which is the highest priority in SAS, or the SV message with a priority of 6. The GOOSE messages of the substation occur in a burst period with an interval of 0.002 s, and the maximum processing time for two IEDs is 2.4 ms [34]. Then, the maximum network delay of tripping GOOSE messages should be less than 0.6 ms and the maximum network delay of GOOSE messages apart from tripping GOOSE should be less than 7.6 ms. Therefore, if the target is PDIS or XCBR, a delay of no less than 52 ms or 2425 ms is required, respectively, by a jamming attack to affect the normal operation of the whole system. These can be easily satisfied by common data jamming attacks, so P p C P S ( C S E 1 , M H S A S , l ) is usually equal to 1.0 after a successful DoS attack.
Some defensive measures should be adopted by substation builders and operators. For example, installing IDS to filter command streams or using a digital signature for authentication would enhance the cybersecurity of the target substation [12]. The parameter λ c f , representing the cybersecurity level of the target substation, can change from 4 to 5 after upgrading the IDS. An attacker from inside may have knowledge of the vulnerabilities of the target substation, and external attackers (e.g., Intruder 2–5 in Figure 1) are generally blind to the vulnerabilities before starting an intrusion. So, cybersecurity events by internal attackers always have fewer cybersecurity factors than external ones. The parameter n c f represents the number of cybersecurity factors that a cybersecurity event includes. The probability of success of cybersecurity event 1 can be calculated by Equation (10). Some variables in Equation (10) are simply set as δ ( c f k ) = 10, γ ( c f k ) = 1000, P ( A | I ) = 0.98, P ( A | ¬ I ) = 0.01. The results are listed in Table 5.
The results in Table 5 show that, for a given cybersecurity event with the same ultimate target LN under a data jamming attack, the probability of success is related to the defensive capability of the substation. A substation with a larger λ c f has enhanced defense measures. So, the probability of success decreases with the increase of λ c f . Meanwhile, for a given substation whose λ c f is fixed, a cybersecurity event with more cybersecurity factors has a larger probability of success from the defender’s perspective. For example, cybersecurity event 1 with IHMI as an ultimate target LN starts from the control center outside the SAS. It has the maximum number of cybersecurity factors, n c f , and this makes it more likely to be perceived by defenders, as does cybersecurity event 1 with PDIS as an ultimate target LN. They all have more factors than cybersecurity event 1 with XCBR as an ultimate target LN originating from the user interface inside the SAS. So, the probability of success increases with the increase of n c f .

5.1.2. Cybersecurity Event 2

FDIA makes the consistent measurement of bad data hardly detected by bad data detection modules. For each SAS, the traffic in different bays is separated by VLAN. Therefore, in cybersecurity event 2, an FDIA was designed to be launched at the TCTR or TVTR LN, ultimately in a certain bay of a substation. TCTR contains the current sampling sequences from TA representing current transformer, and TVTR contains the voltage sampling sequences from TV representing voltage transformer. The four substations chosen to be the target SASs are S/S1, S/S3, S/S9, and S/S5, shown in Figure 2. S/S1, S/S3, and S/S9 are T connections, and the S/S5 is a 3/2 connection. The different structures mean they have different ultimate target LNs in a successful intrusion using FDIA. In detail, in order to intrude the T connection substation successfully, the LNs (TCTR and TVTR) should be attack targets of FDIA simultaneously. For the 3/2 connection substation, only the TCTR is needed to be an attack target [41].
The probability of success of cybersecurity event 2 can be calculated by Equation (10). Note that the ultimate LN targets, TVTR and TCTR, under FDIA are for measuring. The results are listed in Table 6.
The results in Table 6 also show that, for a given cybersecurity event with the same ultimate target LNs under a data tampering attack, the probability of success is related to the defensive capability of the substation and decreases with the increase of λ c f . Meanwhile, for substations with the same connection type and cybersecurity level, such as S/S1, S/S3, and S/S5, all with λ c f = 3 , cybersecurity event 2 with more cybersecurity factors has a larger probability of success P C S E . For example, cybersecurity event 2 carried by Intruder 3 outside S/S9 has the maximum number of factors and the largest P C S E ; cybersecurity event 2 that starts from remote access outside S/S1 has the minimum number of factors and the lowest P C S E . So, the probability of success decreases with the decreased the number of cybersecurity factors.
In addition, for cybersecurity event 2 with a data tampering attack, P p C P S ( C S E 2 , M H S A S , l ) is related to the similarity between hyperedges. According to Algorithm 2 in Section 4.2.2, the similarity between two hyperedges can be calculated by the incidence matrix and hyper-incidence matrix in the modified hypergraph model of the SAS. The similarity between hyperedge e 1 H G , representing F1, measurement and metering, and e 2 H G , representing F2, distance protection in bay E01 of S/S1, is taken as an example. The calculated similarity between e 1 H G and e 2 H G is 0.2818, which means the probability of data error propagation from e 1 H G to e 2 H G is 0.2818. In other words, if an LN in e 1 H G , which is not the LN co-owned by e 1 H G and e 2 H G , is under a data tampering attack, then the probability of changing the state of a CB (XCBR in e 2 H G ) is 0.2818, and P p C P S ( C S E 2 , M H S A S , l ) = 0.2818 . Both hyperedges have the LNs IHMI, TVTR, and TCTR, which are the targets of the data tampering attacks. Based on our previous research [18], TVTR and TCTR are more critical than other LNs, since they have almost the maximum hyper-degree, which is a neighbor-based centrality measurement, and almost the maximum sub-hypergraph centrality, which is a path-based centrality measurement. Furthermore, as defined in Equation (25), if the LNs TVTR and TCTR in e 1 H G , which are also contained by e 2 H G , are under a successful data tampering attack, then the probability of changing the state of a CB (XCBR in e 2 H G ) is 1.0, and P p C P S ( C S E 2 , M H S A S , l ) = 1 . If the LN IHMI contained in both e 1 H G and e 2 H G is under a successful data tampering attack, then the probability of changing the state of a CB (XCBR in e 2 H G ) is 0.5, and P p C P S ( C S E 2 , M H S A S , l ) = 0.5 . Then, for different ultimate target LNs in S/S1, the calculated probability of the CB’s state changing after cybersecurity event 2 is listed in Table 7. Cybersecurity event 2 with TVTR and TCTR as ultimate targets has the maximum probability of the CB’s state changing, which is consistent with the analysis in previous work [18,41].

5.2. Comparative Analysis of Cybersecurity Risks

5.2.1. Comparative Analysis of Risks with Different Target LNs

In cybersecurity event 1, a logical node at the S/S1 station—IHMI, PDIS, or XCBR—suffers from a DoS attack. If the accumulated delay caused by the attack is sufficient to make a CB or switch fail, P p C P S ( C S E 1 , M H S A S , l ) = 1 . Considering that the target SAS has a fixed cybersecurity level, λ c f = 3 or λ c f = 5 , and the ultimate LN is from a fixed bay, E01 or E03, the risk of the power CPS under a data jamming attack on different LNs in S/S1 can be calculated by Equation (24), and the results are shown in Figure 9. Some conclusions regarding cybersecurity event 1 can be made from Figure 9: (1) the risk caused by attacking the substation with λ c f = 3 is higher than that caused by attacking the substation with λ c f = 5 ; (2) the disconnection of the line in bay E03 leads to higher risk than the disconnection of the line in bay E01; (3) the risk of cybersecurity event 1 with IHMI as the ultimate target LN is higher than with PDIS or XCBR as the ultimate target, because cybersecurity event 1 with IHMI has more factors than the other two, as illustrated in Table 5. In conclusion, the security level of the target substation, the bay containing the target LN, and the number of factors in a cybersecurity event are the major determinants for risk evaluation of power CPS under a data jamming attack on an SAS.
In cybersecurity event 2, the current sampling and voltage sampling sequences in different logical nodes in the S/S1 station—IHMI, MMXU, or TVTR and TCTR—suffer from FDIA. After the data error propagations, the probability of the CB’s state changing after cybersecurity event 2 is as listed in Table 7. Considering that the target SAS has a fixed cybersecurity level, λ c f = 3 or λ c f = 5 , and the ultimate LN is from a fixed bay, E01 or E03, the risk of the power CPS under data tampering attacks on different LNs in S/S1 can be calculated by Equation (24), and the results are shown in Figure 10. Some conclusions regarding cybersecurity event 2 can be made from Figure 10: (1) the risk caused by attacking the substation with λ c f = 3 is higher than that caused by attacking the substation with λ c f = 5 ; (2) the disconnection of the line in bay E03 leads to higher risk than the disconnection of the line in bay E01; (3) the risk of the cybersecurity event 2 with TCTR and TVTR as the ultimate target LNs is higher than with IHMI or MMXU as the ultimate target LN. The reason is that the probability of a CB or switch state change after the attack, which is represented as P C S E × P p C P S in Equation (24), is not only related to the number of factors in this event, but also the target LN, especially its level attribute. In conclusion, the security level of the target substation, the bay the target LN is located in, the level the target LN is attributed to, and the number of factors in a cybersecurity event are the major determinants in the risk evaluation of power CPS under a data tampering attack on an SAS.

5.2.2. Comparative Analysis of Risks with Different Data Attack Technologies

After the comparative analysis of the risks of power CPS under the same ultimate attack action on different LNs in an SAS, the risks under different ultimate attack actions on the same LNs are analyzed in this section. The LN containing the current sampling and voltage sampling sequences, MMXU in bay E01 of S/S1, is chosen as the ultimate target of cybersecurity event 3, represented as A6-C5-C2-A1-A2. FDIA and DoS attacks were applied to the ultimate target. Then the data error propagation or time delay accumulation process after the data attack can be emulated by Algorithm 2 or Algorithm 1 in Section 4.2. Considering that the target SAS has a fixed cybersecurity level, λ c f = 3 or λ c f = 5 , the risks of the power CPS under the two types of cyberattack on the same LNs in S/S1 can be calculated by Equation (24), and the results are shown in Figure 11.
Figure 11 also shows that the risk caused by attacking the substation with λ c f = 3 is higher than that caused by attacking the substation with λ c f = 5 , and the disconnection of the line in bay E03 leads to higher risk than the disconnection of the line in bay E01. Beyond that, the risk caused by a DoS attack is much higher than that caused by an FDIA, and the DoS attack is more threatening than FDIA for MMXU. The main reason is that a DoS attack on MMXU can impede the measurement data being uploaded in time, which will make the CB or switch malfunction or refuse to act directly, especially right after the fault happens. However, the FDIA on MMXU trying to upload the tampered measurement data to IHMI can mislead the operators, which can make the XCBR in another function malfunction or refuse to act indirectly. Moreover, the FDIA is a well-known cyberattack technology and some methods have been applied to detect it in power system research. The effects of all countermeasures applied in SAS will be studied further in future works.

5.2.3. Comparative Analysis of Risks with Different Target SASs

The location of the target LN is also an important factor in the risk evaluation after cyberattacks. The above analyses proved that attacking LNs of the same type in different bays of the SAS will result in different risk values. The risks of power CPS under the same attack action on the same type of LNs in different SASs will be analyzed comparatively in this section. Considering that substations S/S1, S/S3, and S/S8 share the same cybersecurity level λ c f = 5 , cybersecurity event 4 starting from Intruder 3 is A7-C3-A4-C2-A1-C8. As shown in Figure 4, if the TVTR and TCTR of measuring function F1 in a certain bay are attacked by tampering technologies, the state of XCBR of distance protection function F2 in the same bay will be affected. When the measuring LNs in F1 suffer from a tampering attack, the probability of the XCBR’s state changing in F2 will be 0.2686, which means the probability of the physical device CB’s malfunction is 0.2686. Once that happens, the corresponding line will be cut off, the electric power will be redistributed in the grid, and the PEE, which can be used to evaluate the effect of line disconnection, will be generated. In each SAS, the TVTRs and TCTRs, which are in the F1 of E01 and F5 of E03, are the targets of the data tampering attack. The risks of the power CPS under tampering attack on the same LNs located in different SASs can be calculated by Equation (24), and the results are shown in Figure 12.
Figure 12 indicates that the risk of the power CPS is related to the location of the target LN under cyberattack, and the “location” contains not only the substation information but also the bay information. The risk of the power CPS after implementing the data tampering attacks on TCTR and TVTR in one bay of substation S/S1 is similar to the risk caused by implementing a data tampering attack on TCTR and TVTR in one bay of substation S/S8. However, the risk of power CPS after implementing the data tampering attacks on TCTR and TVTR in bay E01 of substation S/S3 is much higher. Therefore, the power system operators should pay more attention to the cybersecurity of the LNs, TCTR, and TVTR in bay E01 of substation S/S3. This risk evaluation method provides the precise locations of the critical elements of all SASs in the whole power CPS, which will support the operators in making sustainable maintenance plans for substations under cyber-threats.

5.3. Comparisons with other Methods and Discussion

The comparative analyses of cybersecurity risks of the power CPS in different cybersecurity events show that the proposed evaluation method quantizes the relationships between the major factors in SAS and the risk of the whole power CPS. The major factors discovered in Section 5.2 are the target LN, representing a physical device or the data generated in it, and the intrusion paths, defined as the cybersecurity event, the cyberattack technologies, and defensive measures. The information of the target LN in the SAS’s logical structure is the most fundamental factor in this risk evaluation framework, as it determines the type and location of the target LN. For substation operators, finding the critical LNs in an SAS will provide guidance for upgrading the installed IDSs. For substation designers, finding out the critical LNs in an SAS is helpful to improve data and communication security technologies and enhance the ability of the substation to resist cyber-threats.
There already exist some methods to identify the critical elements in complex networks. In graph theory, the definitions of diverse centrality can be used to identify the critical nodes based on the knowledge of network topological structures. There are two categories of node centralities defined to evaluate the node’s importance, neighborhood-based centralities, and path-based centralities. Degree centrality, LocalRank, and ClusterRank are neighborhood-based centralities, and eccentricity, closeness centrality, betweenness centrality, and Katz centrality are path-based centralities [42]. Based on the definition and calculation of each centrality and the analysis of the frequency distribution histogram of the T1-1 network, the degree centrality and subgraph centrality of a node were adopted to evaluate the structural importance of each LN in the network topological structure of SAS. Meanwhile, these two indexes can be extended to the hyper-graph. The extended indexes contain the LN’s functional information and help to identify the most functional important LN in an SAS [18]. However, the topology of the SAS in that paper is primarily concerned with the logical connection between LNs and does not consider the actual communication links and bay attributes of LNs. Furthermore, the centralities are used to define normalized efficiency loss to evaluate damage to the entire CPS after a data attack on a certain type of LN in the SAS. It just takes the load loss caused by the data attack into consideration, which cannot reflect the dynamic process of power flow transfer, power oscillation, and voltage fluctuation after the malfunction or failure of physical devices caused by cyberattacks.
Comparing the analysis results in Reference [18] with those in this paper, it can be seen that the LNs are sorted differently based on these two methods. The comparative results in Section 5.2 show that the descending order of LNs according to risk generated by a data jamming attack is IHMI, PDIS, and XCBR, and according to risk generated by a data tampering attack is TVTR (or TCTR), IHMI, and MMXU. As illustrated in Reference [18], IHMI is the most critical LN in the SAS from the logical structure point of view, and PDIS is the most critical from the functional point of view. It also conveys that the calculation of the efficiency of an SAS in which a certain LN is under attack helps to identify the more critical LNs, and the top ones are PDIS, IHMI, TCTR (or TVTR), XCBR, and MMXU. IHMI is from the station level and participates in more functions than PDIS, and a data jamming attack on IHMI is bound to cause greater risk. TVTR (or TCTR) is the source of voltage (or current) sampling sequences, and a tampering attack on TVTR (or TCTR) may affect the other LNs using this data. Therefore, the results in this paper are more reasonable. Meanwhile, the framework in this paper also allows the possibility of comparing risks caused by different cyberattack technologies or attacks on target LNs with different types or at different locations.
A security risk assessment framework for SAS was proposed in Reference [43]. It established a function-based model of SAS according to IEC 61850. However, its calculation of the loss of LN function failure is based on pre-set security levels, and the risk assessment of SAS adopts the traditional analytic hierarchy process (AHP) method. These caused the calculation process to include too many subjective factors from experts or prior knowledges. The cybersecurity risk evaluation framework proposed in this paper considers not only the effects of a cyberattack on an LN spreading across functions, but also the simulation results of data transmission in the communication network of an SAS under cyberattack. The calculation and exhibition processes are embodied by the modified hypergraph model of SAS. Moreover, it also takes one reason for LN failure, cyberattack, into careful consideration. The relatively simplified cybersecurity event model still covers cyberattack forms and defensive measures. This proposed framework more objectively reflects the evolution process of power CPS after a cyberattack. The probability model in a substructure of the risk evaluation framework can be further improved in succeeding works, such as finer modeling of cybersecurity events considering every stages of a complete intrusion, distinguishing the number of logs produced in each cybersecurity factor. In addition, more effort will be spent on exploring the possibility of applying the modified hypergraph theory to modeling SAS cybersecurity from the confidentiality, integrity, availability, and non-repudiation points of view. This work is crucial for the creation of sustainable maintenance plans for SAS by developing new defensive technologies, upgrading communication systems, or installing new IDSs.

6. Conclusions

An evaluation framework of cybersecurity risk for power CPS was proposed to assess the impact of cyberattack on an SAS. It helps to identify the critical LNs of a certain SAS, which should be given more attention when considering the cybersecurity of the power CPS. This preliminary work on the creation of a sustainable maintenance plan could lead to many positive effects on the whole power CPS system under consideration, such as reduced total costs associated with defending from cyberattacks, reduced network losses, and enhanced power-supply reliability.
Based on the introduction of procedures and tools for cyberattacks, the possible paths to attack an SAS are analyzed from the intruder’s perspective. Except for the attacker, the SAS operators have the leading role in sustainable maintenance to ensure the cybersecurity of the substation. Therefore, defensive measures to enhance the cybersecurity of an SAS is also studied based on IEC 62351 standard series. This is the foundation of modeling the probability of a successful intrusion defined as a cybersecurity event in substructure of the proposed evaluation framework.
In order to emulate the effects of two major categories of cyberattack technologies on an SAS, the modified hypergraph model of the SAS’s logical structure is proposed. This model comprises connections between nodes and relationships between nodes and hyperedges. Although only the most basic definitions of the modified hypergraph are adopted in this paper, they are helpful in mathematical modelling of the impacts of a cyberattack on an SAS. Furthermore, these basic definitions will have greater significance in future research. For example, the spectral analysis methods in graph and hypergraph theory has been used to realize deep mining of complex network information and extraction of complex network features, which could provide ideas for further studies on risk evaluation and sustainable maintenance design. In view of the above advantages, the modified hypergraph model of SAS is used to model the impacts of a cyberattack on an LN in an SAS. The superstructure of the proposed evaluation framework can intuitively show the time delay accumulation process after a data jamming attack and the data error propagation process after a data tampering attack.
Risk is usually the product of probability and consequence. To realize the objective analysis and evaluation of risk of a power CPS in which an SAS is under cyberattacks, the modularized cybersecurity risk evaluation framework proposed in Section 4 takes as many factors as possible. These factors are the path of the cyberattacks represented as a cybersecurity event, defensive measures simply expressed as security levels of a substation, the effect of time delay caused by a jamming attack, the effect of data error caused by a tampering attack, the probability of failure or mis-operation of the physical device (e.g., CB or switch) caused by the above cyber-effects, and the PEE index measuring the uncertainty of energy distribution after the failure or mis-operation of the physical device stemming from the cyberattacks on an SAS. Each module can be improved individually to provide convenience for further improvement of the models.
The comparative analysis of the test results by the proposed method in different scenarios shows that the risk of power CPS after the cyberattacks on SAS is directly related to the cyberattack technologies and the location of the ultimate target LN, that is, the LN located in which bay of which SAS. It is useful in identifying the critical LNs in a power CPS concerning cyber-threats, which provides guidelines for making sustainable security maintenance plans. Meanwhile, the comparative analysis of the evaluation results with other methods demonstrates that the proposed risk evaluation framework is more reasonable and objective than some other methods. Some work for further study was put forward in Section 5, particularly a finer probability model in the substructure of the framework concerning defense/offense technologies and the seven steps in the cyberattack procedure.

Author Contributions

Conceptualization, Y.F. and J.L.; methodology, J.L. and D.Z.; software, J.L., J.S. and J.P.; validation, J.L. and D.Z., G.Z.; writing—original draft preparation, J.L.; writing—review and editing, J.L.

Funding

This research was funded by the National Natural Science Foundation of China, grant number 71601147.

Acknowledgments

Thanks to Qinghu Zhang in Huaqin Telecom Technology Co., Ltd. for providing the technical guidance and support, and to those who have helped to review and edit this paper.

Conflicts of Interest

The authors declare no conflict of interest.

References

  1. Lee, I.; Liu, S.; Stankovic, J. Cyber-Physical Systems: The next computing revolution. In Proceedings of the Design Automation Conference IEEE, Anaheim, CA, USA, 13–18 June 2010; pp. 731–736. [Google Scholar]
  2. Mo, Y.; Kim, T.H.; Brancik, K.; Dickinson, D.; Lee, H.; Perrig, A.; Sinopoli, B. Cyber-physical security of a smart grid infrastructure. Proc. IEEE 2011, 100, 195–209. [Google Scholar]
  3. Xin, S.; Guo, Q.; Sun, H.; Zhang, B.; Wang, J.; Chen, C. Cyber-physical modeling and cyber-contingency assessment of hierarchical control systems. IEEE Trans. Smart Grid 2017, 6, 2375–2385. [Google Scholar] [CrossRef]
  4. Mo, H.; Sansavini, G. Dynamic defense resource allocation for minimizing unsupplied demand in cyber-physical systems against uncertain attacks. IEEE Trans. Reliab. 2017, 66, 1253–1265. [Google Scholar] [CrossRef]
  5. Wurm, J.; Jin, Y.; Liu, Y.; Hu, S.; Heffner, K.; Rahman, F.; Tehranipoor, M. Introduction to cyber-physical system security: A cross-layer perspective. IEEE Trans. Multi-Scale Comput. Syst. 2017, 3, 215–227. [Google Scholar] [CrossRef]
  6. Ye, X.M.; Wen, F.S.; Shang, J.C.; He, Y. Propagation mechanism of cyber physical security risks in power systems. Power Syst. Technol. 2015, 39, 3072–3079. [Google Scholar]
  7. Tang, Y.; Han, X.; Wu, Y.; Ju, Y.; Zhou, X.; Ni, M. Electric power system vulnerability assessment considering the influence of communication system. Proc. CSEE 2015, 35, 6066–6074. [Google Scholar]
  8. Teixeira, A.; Sou, K.C.; Sandberg, H.; Johansson, K.H. Secure control systems a quantitative risk management approach. IEEE Control Syst. 2015, 35, 24–45. [Google Scholar]
  9. Understanding Denial-of-Service Attacks. Available online: https://www.uscert.gov/ncas/tips/ST04-015 (accessed on 14 February 2018).
  10. Liu, Y.; Ning, P.; Reiter, M.K. False data injection attacks against state estimation in electronic power grids. ACM Trans. Inf. Syst. Secur. 2011, 14, 1–33. [Google Scholar] [CrossRef]
  11. Teixeira, A.; Shames, I.; Sandberg, H.; Johansson, K.H. A secure control framework for resource-limited adversaries. Automatica 2015, 51, 135–148. [Google Scholar] [CrossRef] [Green Version]
  12. IEC Standard for Power Systems Management and Associated Information Exchange—Data and Communications Security, Part 1 Communication Network and System Security—Introduction to Security Issues; IEC TS 62351-1; IEC: Geneva, Switzerland, 2007.
  13. Liu, N.; Zhang, J.; Zhang, H.; Liu, W. Vulnerability assessment for communication network of Substation Automation Systems to cyber attack. Power Syst. Conf. Expo. 2009, 20, 1–7. [Google Scholar]
  14. Guo, Y.; Duan, R.; Cao, J.; Li, S. Power Grid Vulnerability Identifying Based on Complex Network Theory. Int. Conf. Instrum. 2013, 7, 474–477. [Google Scholar]
  15. Buldyrev, S.V.; Parshani, R.; Paul, G.; Stanley, H.E.; Havlin, S. Catastrophic cascade of failures in interdependent networks. Nature 2010, 464, 1025–1028. [Google Scholar] [CrossRef] [PubMed] [Green Version]
  16. Ji, X.; Wang, B.; Liu, D.; Dong, Z.; Chen, G.; Zhu, Z.; Zhu, X.; Wang, X. Will electrical cyber–physical interdependent networks undergo first-order transition under random attacks? Phys. A Stat. Mech. Appl. 2016, 460, 235–245. [Google Scholar] [CrossRef]
  17. Xin, S.; Guo, Q.; Sun, H.; Chen, C.; Wang, J.; Zhang, B. Information-energy flow computation and cyber-physical sensitivity analysis for power systems. IEEE J. Emerg. Sel. Top. Circuits Syst. 2017, 7, 329–341. [Google Scholar] [CrossRef]
  18. Fan, Y.; Li, J.; Zhang, D. A method for identifying critical elements of a cyber-physical system under data attack. IEEE Access 2018, 6, 16972–16984. [Google Scholar] [CrossRef]
  19. Jiang, X.; Yang, J.; Jin, G.; Wei, W. RED-FT: A scalable random early detection scheme with flow trust against dos attacks. IEEE Commun. Lett. 2013, 17, 1032–1035. [Google Scholar] [CrossRef]
  20. Zhao, J.; Mili, L.; Wang, M. A generalized false data injection attacks against power system nonlinear state estimator and countermeasures. IEEE Trans. Power Syst. 2018, 33, 4868–4877. [Google Scholar] [CrossRef]
  21. Vellaithurai, C.; Srivastava, A.; Zonouz, S.; Berthier, R. CPIndex: Cyber-physical vulnerability assessment for power-grid infrastructures. IEEE Trans. Smart Grid 2015, 6, 566–575. [Google Scholar] [CrossRef]
  22. Wu, W.; Kang, R.; Li, Z. Risk assessment method for cybersecurity of cyber-physical systems based on inter-dependency of vulnerabilities. In Proceedings of the IEEE International Conference on Industrial Engineering & Engineering Management, Singapore, 6–9 December 2015; pp. 1618–1622. [Google Scholar]
  23. Axelsson, S. The base-rate fallacy and its implications for the difficulty of intrusion detection. ACM Trans. Inf. Syst. Secur. 1999, 4, 186–205. [Google Scholar]
  24. Chen, Y.; Hong, J.; Liu, C.C. Modeling of intrusion and defense for assessment of cyber security at power substations. IEEE Trans. Smart Grid 2016, 9, 2541–2552. [Google Scholar] [CrossRef]
  25. Winterfeld, S.; Andress, J. The Basics of Cyber Warfare: Understanding the Fundamentals of Cyber Warfare in Theory and Practice; Syngress Publishing: Rockland, MA, USA, 2012; pp. 51–66. [Google Scholar]
  26. IEC Standard for Power Systems Management and Associated Information Exchange. Data and Communications Security, Part 8 Role-Based Access Control; IEC TS 62351-8; IEC: Geneva, Switzerland, 2011.
  27. IEC Standard for Communication Network and Systems in Substations, Part 1 Introduction and Overview; IEC 61850-1; IEC: Geneva, Switzerland, 2003.
  28. IEC Standard for Power Systems Management and Associated Information Exchange—Data and Communications Security, Part 6 Security for IEC 61850; IEC TS 62351-6; IEC: Geneva, Switzerland, 2007.
  29. IEC Standard for Communication Networks and Systems for Power Utility Automation, Part 8-1: Specific Communication Service Mapping (SCSM)—Mappings to MMS (ISO 9506-1 and ISO 9506-2) and to ISO/IEC 8802-3; IEC 61850-8-1; IEC: Geneva, Switzerland, 2011.
  30. IEC Standard for Power Systems Management and Associated Information Exchange—Data and Communications Security, Part 4 Profiles Including MMS and Derivatives; IEC TS 62351-4; IEC: Geneva, Switzerland, 2018.
  31. Berge, C. Graphs and Hypergraphs; Elsevier: New York, NY, USA, 1973; pp. 389–391. [Google Scholar]
  32. Wang, Z.T.; Wang, Z.P. Elementary study of supernetworks. Chin. J. Manag. 2008, 5, 1–8. [Google Scholar]
  33. Estrada, E. Subgraph centrality and clustering in complex hyper-networks. Phys. A Stat. Mech. Appl. 2006, 364, 581–594. [Google Scholar] [CrossRef] [Green Version]
  34. Zhang, Y.; Cai, Z.; Li, X.; He, R. Analytical modeling of traffic flow in the substation communication network. IEEE Trans. Power Deliv. 2015, 30, 2119–2127. [Google Scholar] [CrossRef]
  35. Ruiwen, H.E.; Dong, W.; Yanxu, Z.; Zexiang, C.; Xiaowang, H.E.; Yuhui, C. Modeling and static calculation method of the information flow on smart grid. Proc. CSEE 2016, 36, 1527–1535. [Google Scholar]
  36. Boudec, J.-Y.L.; Thiran, P. Network Calculus: A theory of Deterministic Queuing Systems for the Internet in Ser. Number 2050 in Lecture Notes in Computer Science; Springer: Berlin, Germany, 2001; pp. 7–20, 122–125. [Google Scholar]
  37. Cruz, R.L. A calculus for network delay. I. Network elements in isolation. IEEE Trans. Inf. Theory 1991, 37, 114–131. [Google Scholar] [CrossRef]
  38. Lv, L.; Zhou, T. Link Prediction; Higher Education Press: Beijing, China, 2013; pp. 156–213. [Google Scholar]
  39. Gou, J.; Liu, J.Y.; Liu, Y.B.; Xu, L.; Zhang, L.; Lei, C. Energy entropy measure based risk identification of power system cascading failures. Power Syst. Technol. 2013, 37, 2754–2761. [Google Scholar]
  40. Zimmerman, R.D.; Murillo-Sánchez, C.E.; Thomas, R.J.; Anderson, C.L. Free, Open-Source Electric Power System Simulation and Optimization Tools for MATLAB and Octave. Download MATPOWER. Available online: http://www.pserc.cornell.edu/matpower/#download (accessed on 16 March 2017).
  41. Li, Q.; Sun, H.; Sheng, T.; Zhang, B.; Wu, W.; Guo, Q. Injection attack analysis of transformer false data in substation state estimation. Autom. Electr. Power Syst. 2016, 40, 79–86. [Google Scholar]
  42. Lü, L.; Chen, D.; Ren, X.L.; Zhang, Q.M.; Zhang, Y.C.; Zhou, T. Vital nodes identification in complex networks. Phys. Rep. 2016, 650, 1–63. [Google Scholar] [CrossRef] [Green Version]
  43. Guo, C.; Yu, B.; Guo, J.; Wen, B.J.; Zhang, J.J. Security Risk Assessment of the IEC61850-based Substation Automation System. Proc. CSEE 2014, 34, 685–694. [Google Scholar]
Figure 1. Cyber environment of a substation auto system (SAS) and its potential cyber-threats.
Sustainability 11 00982 g001
Figure 2. Physical structure of a substation auto systems (SAS) in a power cyber-physical system (CPS).
Sustainability 11 00982 g002
Figure 3. Example of modified hypergraph.
Sustainability 11 00982 g003
Figure 4. (a) F1: measurement and metering; (b) F2: distance protection.
Sustainability 11 00982 g004
Figure 5. Risk evaluation framework of a power CPS.
Sustainability 11 00982 g005
Figure 6. (a) Mesh grid for probability mass function (pmf) f ( n c f , λ c f ) ; (b) Mesh grid for cumulative distribution function (cdf) F ( n c f , λ c f ) .
Sustainability 11 00982 g006
Figure 7. Calculation flow chart for cybersecurity risk evaluation of power CPS.
Sustainability 11 00982 g007
Figure 8. Time delay needed by a jamming attack to affect normal operations.
Sustainability 11 00982 g008
Figure 9. Cybersecurity risk of a power CPS in cybersecurity event 1.
Sustainability 11 00982 g009
Figure 10. Cybersecurity risk of a power CPS in cybersecurity event 2.
Sustainability 11 00982 g010
Figure 11. Cybersecurity risks of a power CPS in cybersecurity event 3.
Sustainability 11 00982 g011
Figure 12. Cybersecurity risks of a power CPS in cybersecurity event 4.
Sustainability 11 00982 g012
Table 1. Tools used in each stage of a cyberattack procedure [17].
Stage No.Stage NameCommon Tools
1ReconnaissanceWebsites
Search engines
Google Hacking
WHOIS search/DNS queries
Metadata
Maltego
2ScanningNmap
Nessus
OpenVAS
3Accessing and escalating privilegePassword decoding/deciphering tool
Metasploit
CANVAS
4Exfiltrating dataPhysical exfiltrating
Encryption and steganography
Covert channels over general protocols
Out of band (OOB) methods
5AssaultingTampering of software or OS settings
Attacking hardware
Changing settings
6Sustaining accessAdding authorized accounts
Backdoor program
Adding monitor service
7Concealing tracesHiding physical location
Modifying logs
Modifying files
Table 2. Potential targets of cyberattacks in a power cyber-physical system (CPS) and their positions.
Attack ActionTypePotential TargetTarget Position in Figure 3Target Mapped to Logical Structure
AccessingInside the SASCyber network of SASA1ALL the LNs
Devices in bay levelA2LNs in bay level
User interfaceA3IHMI
Outside the SASWide-area networkA4N/A
Control center networkA5N/A
Adjacent SASA6N/A
Corporation office networkA7N/A
AssaultingDevice in cyber networkFirewallC1–C5All the LNs
Remote accessC6N/A
Time synchronizationC7RSYN
Device in physical networkDevices in process levelC8,C9LNs in process level
Server in control centerC10N/A
User interface in control centerC11N/A
Table 3. Logical functions and their links between logical nodes (LNs) in substations of T1-1.
BayNum.FunctionDetailed Structure
E01F1Measurement and metering Sustainability 11 00982 i001
F2Distance protection Sustainability 11 00982 i002
F3Differential protection Sustainability 11 00982 i003
F4Interlocking Sustainability 11 00982 i004
E03F5Measurement and meteringThe same as F1
F6Distance protectionThe same as F2
F7Differential protectionThe same as F3
F8InterlockingThe same as F4
E02F9Distance protectionThe same as F2
F10Voltage regular Sustainability 11 00982 i005
D01F11Transformer differential protection Sustainability 11 00982 i006
F12Overcurrent and over-voltage protection Sustainability 11 00982 i007
Table 4. Full name of every LN in Table 1.
Level NameLogical NodeFull Name
Station levelIHMIHuman machine interface
IARCArchiving
ITMITelemonitoring interface
ITCITelecontrol interface
Bay/unit levelMMXUMeasurand unit/Op.
MMTRMetering/acquisition and calculation
PDISLine protection scheme
PSCHLine protection scheme
PTRCProtection trip conditioning
PDIFDifferential protection
RSYNSynchrocheck
CSWISwitch controller
CILOInterlocking bay/station
ATCCAutomatic tap changer control
PTDFDifferential transformer protection
PTOV(Time) Overvoltage protection
PIOCInstantaneous overcurrent or rate of rise protection
Process levelTVTRVoltage transformer
TCTRCurrent transformer
XCBRCircuit breaker
RMXUDifferential measurements
XSWIDisconnector
YLTCTap Changer
Table 5. Probability of success of cybersecurity event 1.
Ultimate TargetLevel NameCybersecurity Event Probability   of   Success   P C S E
λ c f = 3 λ c f = 5
IHMIStation levelC11-A5-C4-A4-C2-A30.39320.2686
PDISBay levelA6-C5-C2-A1-A20.37030.2256
XCBRProcess levelA3-A1-C90.29310.1232
Table 6. Probability of success of cybersecurity event 2.
Ultimate TargetIntruder No.Substation No.Cybersecurity Event 1 Probability   of   Success   P C S E
λ c f = 3 λ c f = 5
TCTRIntruder 1S/S 5A3-A1-C80.29310.1232
TVTR and TCTR Intruder 2S/S 1C6-C1-A1-C80.33810.1758
TVTR and TCTRIntruder 5S/S 3A6-C5-C2-A1-C80.37030.2256
TVTR and TCTRIntruder 3S/S 9A7-C3-A4-C2-A1-C80.39320.2686
Table 7. Probability of CB’s state changing after cybersecurity event 2.
Ultimate TargetIntruder No.Level NameCybersecurity Event 2 Probability   P C S E × P p C P S
λ c f = 3 λ c f = 5
IHMIIntruder 4Station C11-A5-C4-A4-C2-A30.19660.1343
MMXU Intruder 5BayA6-C5-C2-A1-A20.10440.0636
TVTR and TCTRIntruder 3Process A7-C3-A4-C2-A1-C80.39320.2686

