Article

A Systematic Disturbance Analysis Method for Resilience Evaluation: A Case Study in Material Handling Systems

1
School of Reliability and Systems Engineering, Beihang University, No. 37, Xue Yuan Road, Beijing 100191, China
2
Science and Technology on Reliability and Environmental Engineering Laboratory, No. 37, Xue Yuan Road, Beijing 100191, China
*
Author to whom correspondence should be addressed.
Sustainability 2019, 11(5), 1447; https://doi.org/10.3390/su11051447
Submission received: 22 November 2018 / Revised: 21 February 2019 / Accepted: 25 February 2019 / Published: 8 March 2019

Abstract

:
With the development of intelligent manufacturing technology, the material handling system (MHS) faces larger resilience challenges that threaten the sustainability of the system. To evaluate system resilience, the disturbance that the system may experience and the system response need to be identified in advance. This paper proposes a systematic and innovative approach to performing resilience-related disturbance analysis, i.e., disturbance mode and effects analysis (DMEA). Using this method, the possible disturbance modes, their occurrence probabilities, and the quantitative effects on system performance can be collected in a bottom-up process, and the information can be applied to further resilience quantification. Moreover, a quantitative system resilience evaluation framework for the MHS based on DMEA and the Monte Carlo method is presented. Production is defined as the key performance index of the system and is monitored to reflect the resilience behavior of the system after the disturbance occurs. The resilience of a tire tread handing system is quantified in our case study, and the results show the effectiveness of our DMEA-based resilience evaluation method. We also find that a reasonable system configuration and maintenance strategy can effectively improve system resilience, and a trade-off can be made between resilience and cost.

1. Introduction

Manufacturing provides a solid foundation for economic and societal developments, and it is the mainstay industry of the country. However, the manufacturing process consumes a lot of the world’s resources, such as water and energy, and part of the consumption becomes a type of waste. Sustainable manufacturing presents a new manufacturing system paradigm from the perspective of sustainability. In broad terms, sustainable manufacturing can be considered as an integrated strategy to reduce the environmental impacts caused by manufacturing [1], with the aim of coping with environmental challenges by minimizing natural resource consumption and improving manufacturing quality. Today’s sustainable manufacturing faces challenges related to maintaining manufacturing continuity because of potential disturbances. Resilience is an effective way to combat these unpredictable disturbances, and it helps to improve performance sustainability [2].
The material handling system (MHS), a vital part of the manufacturing plant, faces more complicated and uncertain disturbances in intelligent processes. Those unexpected events may lead to production delays or even breakdowns, as well as economic losses. Pioneers have tried to provide more sustainable MHSs that are resilient to these disturbances and can reduce resource waste. Here, resilience is the ability of the system to absorb the effects of a disturbance and quickly return to the normal operational state. In general, MHSs help promote sustainable manufacturing in two ways. On the one hand, as a “bridge” between one production line and the next, MHSs integrate all sustainable manufacturing processes within the factory as a whole. Rajesh [3] illustrated that increasing the resilience of each manufacturing process in a factory or a supply chain can reduce the disruption probability and enhance the resilience and sustainability of the whole system. On the other hand, studying MHSs’ response to a disturbance, i.e., resilience issues, helps improve the efficiency of the entire manufacturing system by preventing overtime work and additional resource consumption. A sustainable system should be resilient. Pope et al. [4] referred to enhancing resilience as one of the four discourses of “sustainable development” and “sustainability assessment”. Jayal et al. [5] claimed that sustainable manufacturing differentiates itself from other concepts (e.g., green manufacturing) partly for its notion of recovery ability. Of course, a resilient system is more sustainable. It is not only able to withstand the disturbances caused by the external environment but also able to reduce the waste of production resources through adaptation and recovery. For example, Nakano [6] proposed a “Vee” model to test the disruption and resilience of the system, aiming to realize sustainable manufacturing. Through a detailed, triangulated secondary data analysis and industry survey, Thomas et al. [7] summarized the tools, methods, and models that UK manufacturing companies adopted and applied in order to achieve resiliency and economic sustainability. The result showed that companies with better sustainability and resilience developed and applied more resiliency and sustainability models. Hence, in this paper, we focus on the resilience of the MHS and how it benefits sustainable manufacturing.
The MHS-related literature is rich, but most published studies have focused on system dispatching and scheduling [8,9,10] and routing planning [11,12,13], aiming to improve system performance and decrease the cost. Twenty years ago, researchers started to analyze the reliability of the MHS and tried to improve the performance and reliability of the system together. For example, Tavana et al. [14] considered reliability to be an essential property of the MHS, modeled it as a cost function, and applied both cost and time measures as bi-objectives in the stochastic programming problem. Karimi et al. [15] analyzed and simulated the reliability of flexible manufacturing systems and used a bi-objective nonlinear optimization model to maximize shop reliability, as well as minimize production time. Beschorner and Glüer [16] further analyzed the availability of the MHS on the basis of the maximum flow that could be transported from the source to the destination in the system, i.e., they evaluated the percentage of the maximum flow that the MHS could provide with the consideration of component failures. Robustness, the ability of the system to maintain its function despite internal or external disruptions, has also been examined in relation to the MHS [17,18,19]. These studies deal with how to reduce the possibility of failures and how to adapt to system failures. In this paper, we further focus on the system behavior after the disturbance while considering both adaption and recovery abilities, i.e., the resilience of the system.
To the best of our knowledge, there is no published research about the resilience of the MHS. As the MHS is a part of the manufacturing system, the resilience research in this field is introduced as a reference. Gu et al. [20,21] defined four parameters, i.e., throughput settling time, overtime to recover, production loss, and total underproduction time. These were applied as four resilience measures to analyze multistage manufacturing systems, and the authors applied the discrete time Markov Chain to quantify system resilience. They found that parallel systems can provide better resilience than serial ones, and the existence of caches can effectively mitigate the impacts of disruptions. Fisher et al. [22] qualitatively presented the advantages of using historical manufacturing data stored in the cloud to improve process resilience. The supply chain is similar to the MHS: Brandon-Jones et al. [23] studied both the robustness and resilience of the supply chain, and Li et al. [24] proposed a simulation method to quantitatively analyze the effects of network structure on the resilience of supply chain networks. According to the literature above, many research efforts focus on resilience concepts, metrics, and evaluation frameworks, but the means to identify disturbances and retrieve data for disturbance effects analysis are seldom referenced. Some scholars have applied failure mode and effects analysis (FMEA) to resilience assessment [25,26,27], but these studies only used the risk priority number (RPN), a semi-quantitative measure, and we still lack quantitative disturbance analysis methods. Usually, there are five basic types of data: (1) test data, which are obtained by conducting tests or experiments, such as in Bruelheide and Luginbühl [28], Ledger et al. [29], Pascale et al. [30]; (2) survey data, which are gathered using questionnaires, such as in Shirali et al. [31], Azadeh et al. [32,33]; (3) field data, which are monitored during system operation, such as in Almeida and Vieira [34], Pradhan et al. [35]; (4) simulation data, which are collected by system modeling and simulating, such as in Li et al. [24], Ma et al. [36], Tran et al. [37], Almajali et al. [38]; (5) historical data, including public data that are available on the Internet (such as in Liu et al. [39]) and field data from similar systems (such as in Zio and Piccinelli [40]). Although there are so many types of data, there is no systematic way to collect and use the information. A common situation in resilience evaluation is the lack of knowledge of how to systematically identify disturbances and how to obtain system response data after disturbances.
To solve this problem, a disturbance mode and effects analysis (DMEA) method is proposed to analyze the disturbance for resilience evaluation, and a resilience quantification framework based on the Monte Carlo method is also addressed. This method and framework help perform a resilience evaluation more conveniently and systematically, and these properties coincide with the sustainability of a manufacturing system to some degree. Our research benefits not only system analysts but also system designers working to achieve resilience and sustainability goals, which can be used as decision-making factors when a trade-off needs to be made between high production and low energy and economic consumption. The remainder of the paper is organized as follows. Section 2 describes the structural and functional composition of MHSs. Section 3 proposes a DMEA method for disturbance analysis as part of resilience evaluation. Section 4 gives the detailed procedures of the DMEA-based MHS resilience evaluation framework. In Section 5, a tire tread handling system is introduced to demonstrate the effectiveness of our method, and we also discuss how the system configuration affects its performance and resilience. Finally, concluding remarks are provided in Section 6.

2. Problem Description

This paper considers material picking, transport, and storage among various pieces of equipment throughout a facility, namely, MHSs, as shown in Figure 1. The different levels of automation define the diversity of MHSs and vary from manual handling to automatic handling. Typical equipment includes material transport equipment (e.g., automated guided vehicles (AGVs), rail-guided vehicles (RGVs), conveyors, and hoists and cranes), storage systems (e.g., bulk storage, rack systems, shelving, and bins), unitizing equipment (e.g., containers, pallets, palletizers, and depalletizers), identification and tracking systems (e.g., barcodes, radio frequency identification (RFID) tags, and sensors) [41,42].
This study concentrates on a systematic disturbance analysis method for the resilience evaluation of MHSs. A resilient MHS is able to withstand disturbances and return to a normal status quickly, and its recovery strategy includes (1) self-healing by the system and (2) manual repair. In this paper, the following assumptions are made:
  • The equipment and caches in the system have a limited capacity.
  • Disturbances that occur to the MHS are independent.

3. Disturbance Analysis Method: DMEA

This paper aims to solve the problem of how to analyze the disturbance and then evaluate system resilience at the design stage. Essentially, the resilience curve describes the performance change process after all kinds of external disturbances and internal failures. Before the resilience evaluation, we need to identify the disturbance and the system response. Thus, a bottom-up method, DMEA, is proposed.
Our DMEA method is effective for identifying all potential disturbance modes of components, equipment, and software in the design and manufacturing process, as well as the effects of each disturbance mode, at the design stage. For the purpose of system resilience quantification, we need to obtain the data that include the potential disturbance modes, their occurrence rates, and the effects (i.e., the performance degradation and recovery process of the system). The disturbances of the system need to be analyzed by the following steps:
  • Function and structure analysis of the system. The indenture levels of the system are specified on the basis of a function and structure analysis. Here, the indenture levels are used to identify or describe the relative complexity of the system. Typical indenture levels include the system level, subsystem level, unit level, and part level. We need to choose the indenture levels appropriately because an insufficient analysis may result in missing some critical disturbance modes, and an excessive analysis may cause resource waste.
  • Disturbance identification and effects analysis. As a bottom-up method, the analysis begins at the lowest indenture level and continues upward. At each indenture level, all possible disturbances, their occurrence probabilities, the performances that may be affected, and the degradation and recovery behaviors are identified, as shown in Table 1. The information obtained from a lower level can be used further during the analysis of a higher level.
In Table 1, the first column, “No.”, is the disturbance mode number in the table; the second column, “Part name”, is the name of the part in the current indenture level, and all parts under the current indenture level need to be analyzed; the third column, “Function”, is the functional description of the part; the fourth column, “Disturbance modes”, is the way in which a disturbance occurs; the fifth column, “Disturbance causes”, lists the physical or chemical processes, design defects, part misapplication, natural disasters, human attacks, or other processes that are basic reasons for internal failures or external disruptions; the sixth column, “Occurrence probability”, provides the occurrence rate of the corresponding disturbance mode; the seventh and eighth columns, “Disturbance effects”, describe the results or consequences to the part due to the corresponding disturbance mode, including the performance metrics that may be affected and the performance change behaviors after the disturbance. The first six columns are similar to those in an FMEA. As the FMEA method is widely used in the design stage, it is easy to extend to disturbance analysis. The innovativeness of the DMEA method lies in its quantitative description of the disturbance effects and the consideration of the system recovery. Specifically, “performance affected by the disturbance” in the seventh column concentrates on all possible performance metrics of the system and implicitly expresses which performance metric may fluctuate in the corresponding disturbance mode. “Performance degradation and recovery” presents the degradation function and recovery function of the corresponding system performance after the disturbance. DMEA provides a quantitative expression of the performance behavior after a component causes a disturbance in the system, thus constituting a bottom-up system evaluation.
In general, the following are typical curve models of performance degradation and recovery:
  • Continuous curve
    • Linear model. System performance linearly declines from the normal value Q 0 to the lowest value Q 1 after the disturbance, or the performance linearly recovers from Q 1 back to Q 2 by taking some recovery actions, as shown in Figure 2a.
    • Nonlinear model. As shown in Figure 2b, system performance continuously declines from normal to the degraded state or restores to its normal state, and the speed of the performance degradation or recovery is not constant.
  • Discrete curve
    • In this model, system performance is defined within a limited number of states. After the disturbance, system performance is gradually reduced and then gradually restored, as shown in Figure 2c.
In Figure 2, there are three possibilities after the recovery: (1) system performance is fully restored, i.e., Q 2 = Q 0 ; (2) after recovery, the system performs better than before, i.e., Q 2 > Q 0 ; and (3) after recovery, the system only maintains a lower performance than before, i.e., Q 2 < Q 0 .

4. Resilience Evaluation Based on DMEA

In the quantitative analysis of the resilience of the MHS, a resilience metric needs to be first defined and then its values are assessed [43]. The metric of resilience varies with the designer’s understanding of the concept of resilience. In general, it can be summarized into deterministic measures [44,45,46] and probabilistic measures [47,48]. The two types of metrics reveal the resilience behavior of the system to a certain disturbance and a random disturbance, respectively. Although no resilience research has been found for the MHS, some studies analyzing the resilience of the supply chain can be used as a reference. For example, Li et al. [24] proposed a maximum allowable recovery time that is based on a deterministic resilience metric and an expectation-based probabilistic metric. Since these two resilience metrics have clear physical meanings, they are applied in this paper. For details, see Section 4.5.
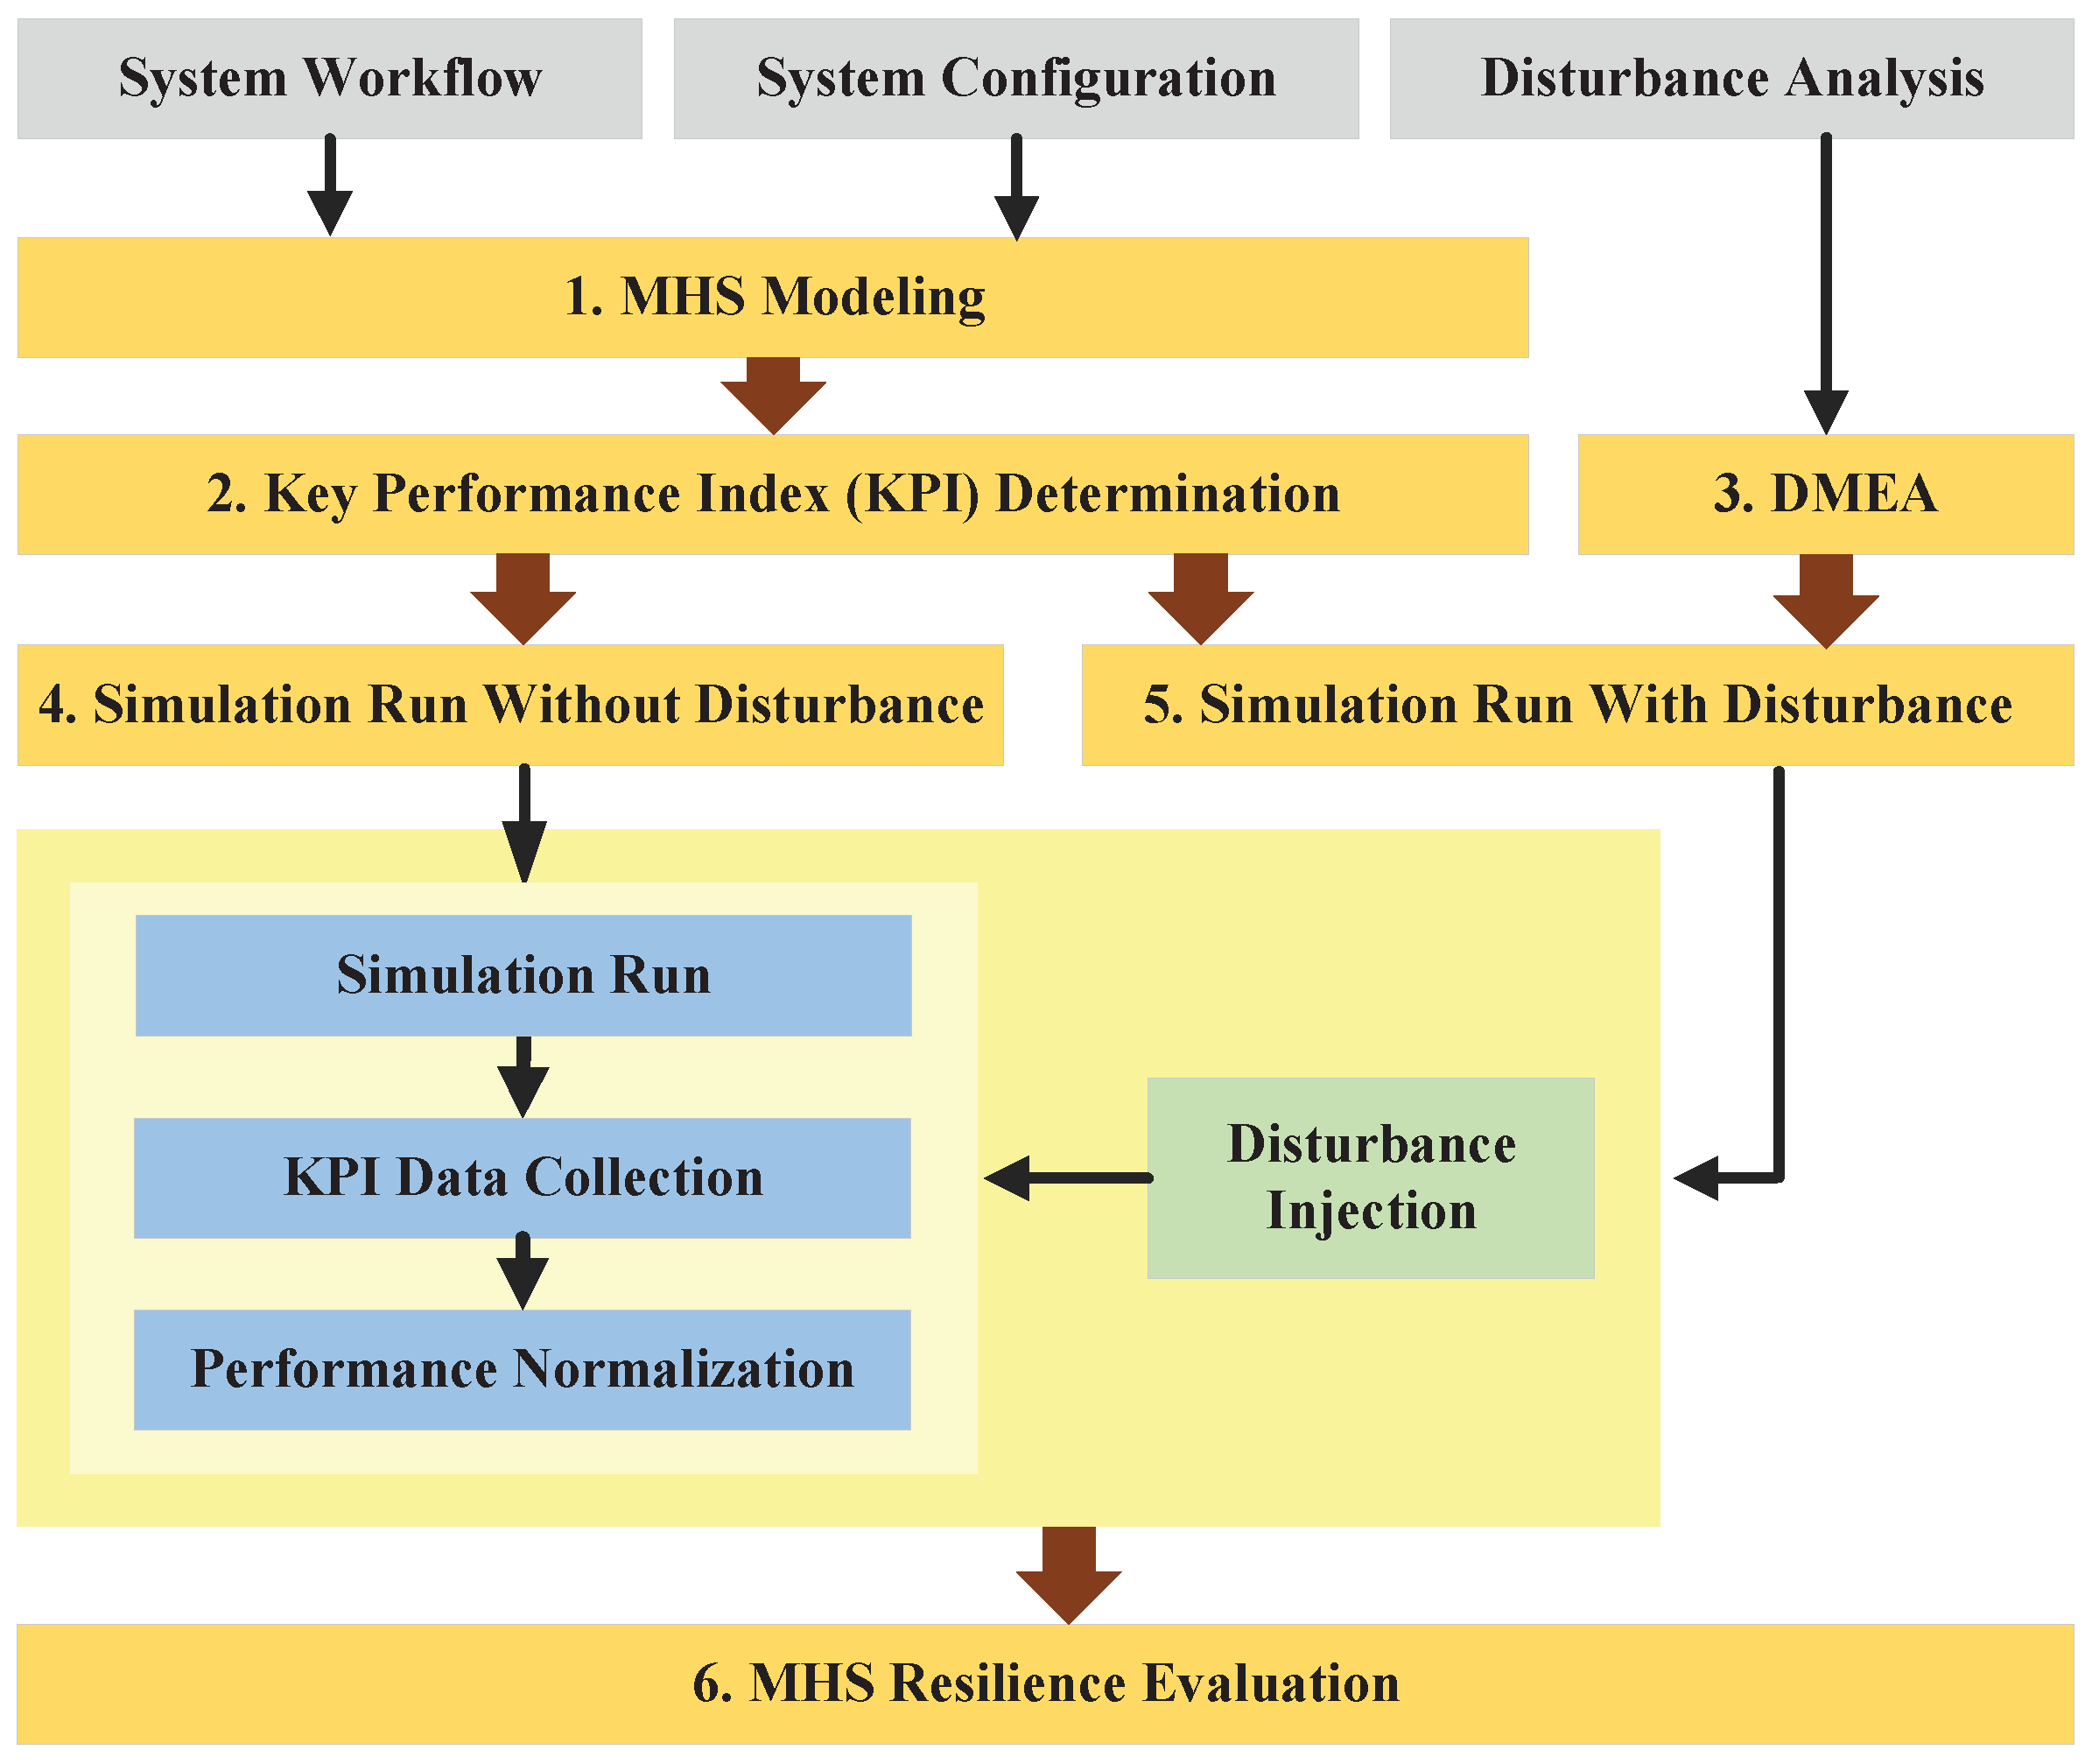
To evaluate the system, one can apply analytical, simulation, or test methods. Among them, the simulation method is advantageous for evaluating the resilience of a system because (1) the analytical resilience expression is difficult to obtain; (2) the test method consumes a lot of money, and the test cannot be conducted before the prototype of the system is available. The randomness characteristic of a disturbance makes the Monte Carlo-based simulation an efficient method to evaluate system resilience. As a combination of our DMEA method and Monte Carlo-based simulation, our resilience evaluation procedure is shown in Figure 3.

4.1. MHS Modeling

The MHS system is a typical queuing system, and its workflow is the basis of the modeling of this system. To model the MHS system and evaluate its resilience, we require the following types of data:
  • System configuration data, such as system composition, equipment layout parameters (e.g., the position, length, width, and height of the equipment), and equipment functional parameters (e.g., velocity, acceleration, operation time, and transport time of the equipment).
  • Simulation-related data, such as the iteration number, time duration, and granularity of the simulation.
  • Disturbance-related data, such as the minimum acceptable value of the resilience, the disturbance probability, the performance degradation curve, and the recovery curve. See Section 4.3 for details.

4.2. Key Performance Index Determination

Resilience is measured on the basis of the key performance index (KPI) of the system, so we need to select representative and easily accessible performance parameters. Bruneau et al. [44] summarized four dimensions of resilience, i.e., technical, organizational, social, and economic, for various types of physical and organizational systems.
For a man-made system like the MHS, technical resilience and economic resilience often attract company managers. Technical resilience refers to the ability of the MHS (including components, their interconnections and interactions, and the entire system) to perform at an acceptable level when the disturbance occurs. Economic resilience refers to the capacity of the system to reduce both direct and indirect economic losses resulting from the disturbance. In this paper, an efficiency parameter, production (e.g., annual production, monthly production, and daily production), is used as the KPI of the MHS. It is a typical technical parameter, and it can also reflect the system’s economics, as production loss directly influences the company’s profit.

4.3. DMEA

Resilience behavior is the result of a disturbance, so disturbance-related data are critical to the resilience evaluation. As referenced in Section 4.1, three types of data—occurrence probability, performance degradation curve, and recovery curve—are required in the resilience evaluation. Table 1 provides a method to collect these data. The occurrence probabilities of all potential disturbance modes are recorded in a digital form, and the performance degradation and recovery curves are recorded differently due to different curve types.
  • For a continuous linear curve, the following data are required:
    • the system’s lowest performance value after the disturbance ( Q 1 ) and its distribution;
    • the time duration of the performance degradation ( t 1 t 0 ) and its distribution;
    • the performance after recovery ( Q 2 ) and its distribution;
    • the time duration of the performance recovery ( t 2 t 1 ) and its distribution.
  • For a continuous nonlinear curve, data are required as follows:
    • the system’s lowest performance value after the disturbance ( Q 1 ) and its distribution;
    • the performance function of the degradation process;
    • the performance after recovery ( Q 2 ) and its distribution;
    • the performance function of the recovery process.
  • For a discrete curve, the following data are needed:
    • performance values of all possible states;
    • the system’s lowest performance value after the disturbance ( Q 1 ) and its distribution;
    • the time duration and its distribution at each state during system degradation and recovery, respectively.

4.4. Simulation Run without/with Disturbance

Using the system model in Section 4.1 and the resilience-related data collected in Section 4.3, we can run the system simulation without and with disturbance, and the KPI values can be monitored. After performance normalization, the normalized KPI without and with disturbance can be compared and applied to calculate system resilience, as presented in Section 4.5. Most of the procedures in the simulation run without and with disturbance are the same, differing only by the presence of disturbance, which needs to be injected in the latter case.

4.4.1. Disturbance Injection

Disturbance injection is the first step in the simulation run with disturbance. The occurrence of a disturbance, the degradation, and the recovery of the performance are random, so we need to sample the disturbance mode and its effects (i.e., the performance degradation and recovery curve) before disturbance injection.
We can use the occurrence probability to determine the disturbance mode that will be injected. Adding the probabilities of all disturbance modes together as D and sampling a random number in the interval [ 0 , D ] allow the disturbance mode to be determined using a random sampling method.
The inverse function method can be used to sample the disturbance effects (i.e., the performance degradation and recovery curve) according to the corresponding distribution that is analyzed in the DMEA form.
Once the disturbance mode and effects are determined, the disturbance can be injected into the MHS simulation run, and the behavior of the MHS under such disturbance can then be monitored.

4.4.2. Simulation Run and KPI Data Collection

The simulation is run without disturbance, and the production of the MHS under normal conditions is obtained. Then, the simulation is run with disturbance according to the sampling results, and the production value change process after the disturbance is injected is recorded.

4.4.3. Performance Normalization

With the min-max normalization method, the production of the MHS can be normalized as
Q t = 1 , P ( t ) P 0 , P ( t ) P 0 , P ( t ) < P 0 ,
where Q ( t ) is the normalized performance at time t, P ( t ) is the production value of the MHS after the disturbance at time t, and P 0 is the production value in the normal state. Equation (1) is similar to the performance normalization method applied in Henry and Ramirez-Marquez [49]. We also consider the possibility that the performance after the recovery may exceed the normal performance: we define the normalized performance under such a situation as 1, as the performance goal is satisfied.

4.5. MHS Resilience Evaluation

In this paper, deterministic resilience, presented in Li et al. [24], is applied to quantify the resilience of the MHS under a certain disruption i, i.e.,
R D , i = t 0 t 0 + T a Q ( t ) d t t 0 t 0 + T a Q 0 ( t ) d t = t 0 t 0 + T a Q ( t ) d t T a ,
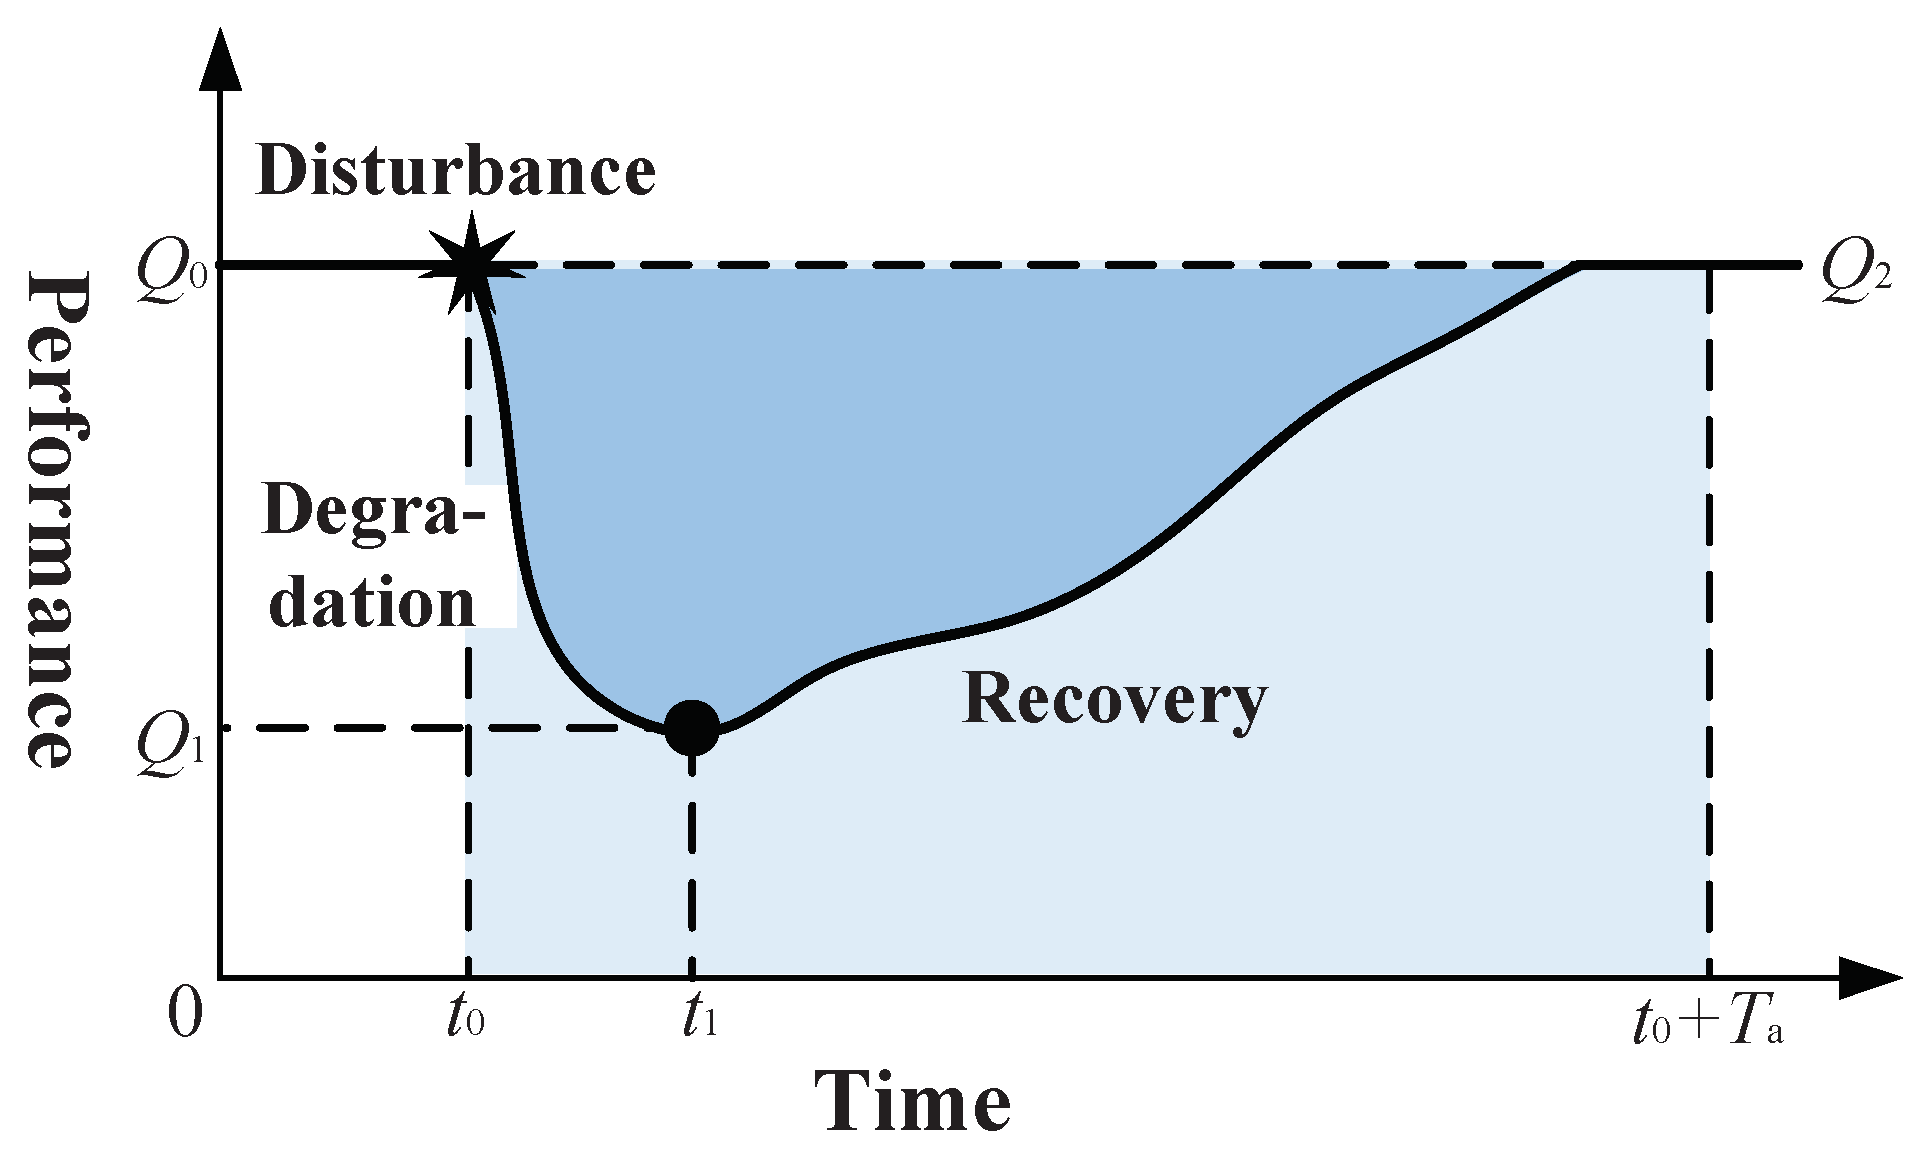
where t 0 is the time when the disturbance occurs, T a is the maximum allowable recovery time of the system determined by users, and Q 0 ( t ) and Q ( t ) are the normalized performance at time t in the normal state and after the disturbance, respectively. For the MHS, as the production in the normal state is stable, i.e., P 0 ( t ) = P 0 and Q 0 ( t ) = 1 , we have t 0 t 0 + T a Q 0 ( t ) d t = T a . The resilience calculated in Equation (2) is the ratio of the light colored area to the colored area in Figure 4, and it qualifies the average performance percentage of the system within the specified time interval [ t 0 , t 0 + T a ] .
In practice, real-time monitoring of the performance of the MHS is difficult or unnecessary, both technically and cost-effectively. To facilitate performance monitoring, we can monitor the system production every Δ t and get several discrete performance observation values. Using trapezoidal integration, system resilience can be computed as
R D , i Q ( t 0 ) + Q ( t m ) + 2 j = 1 m 1 Q ( t j ) 2 T a ,
where t m = t 0 + T a ; t j = t 0 + j T a / m ; and m is the number of discrete points monitored within the time interval [ t 0 , t 0 + T a ] .
After obtaining the deterministic resilience under different disruptions, the probabilistic resilience can be calculated as
R A = E ( R D ) a n d R A ^ = i = 1 n R D , i n ,
where n is the number of the deterministic resilience. R A is the expectation of system resilience and reflects the average resilience of the MHS. R A ^ is an estimate of R A and is calculated by taking the average of the deterministic resilience under different disturbances.

5. Case Study

5.1. Case Overview

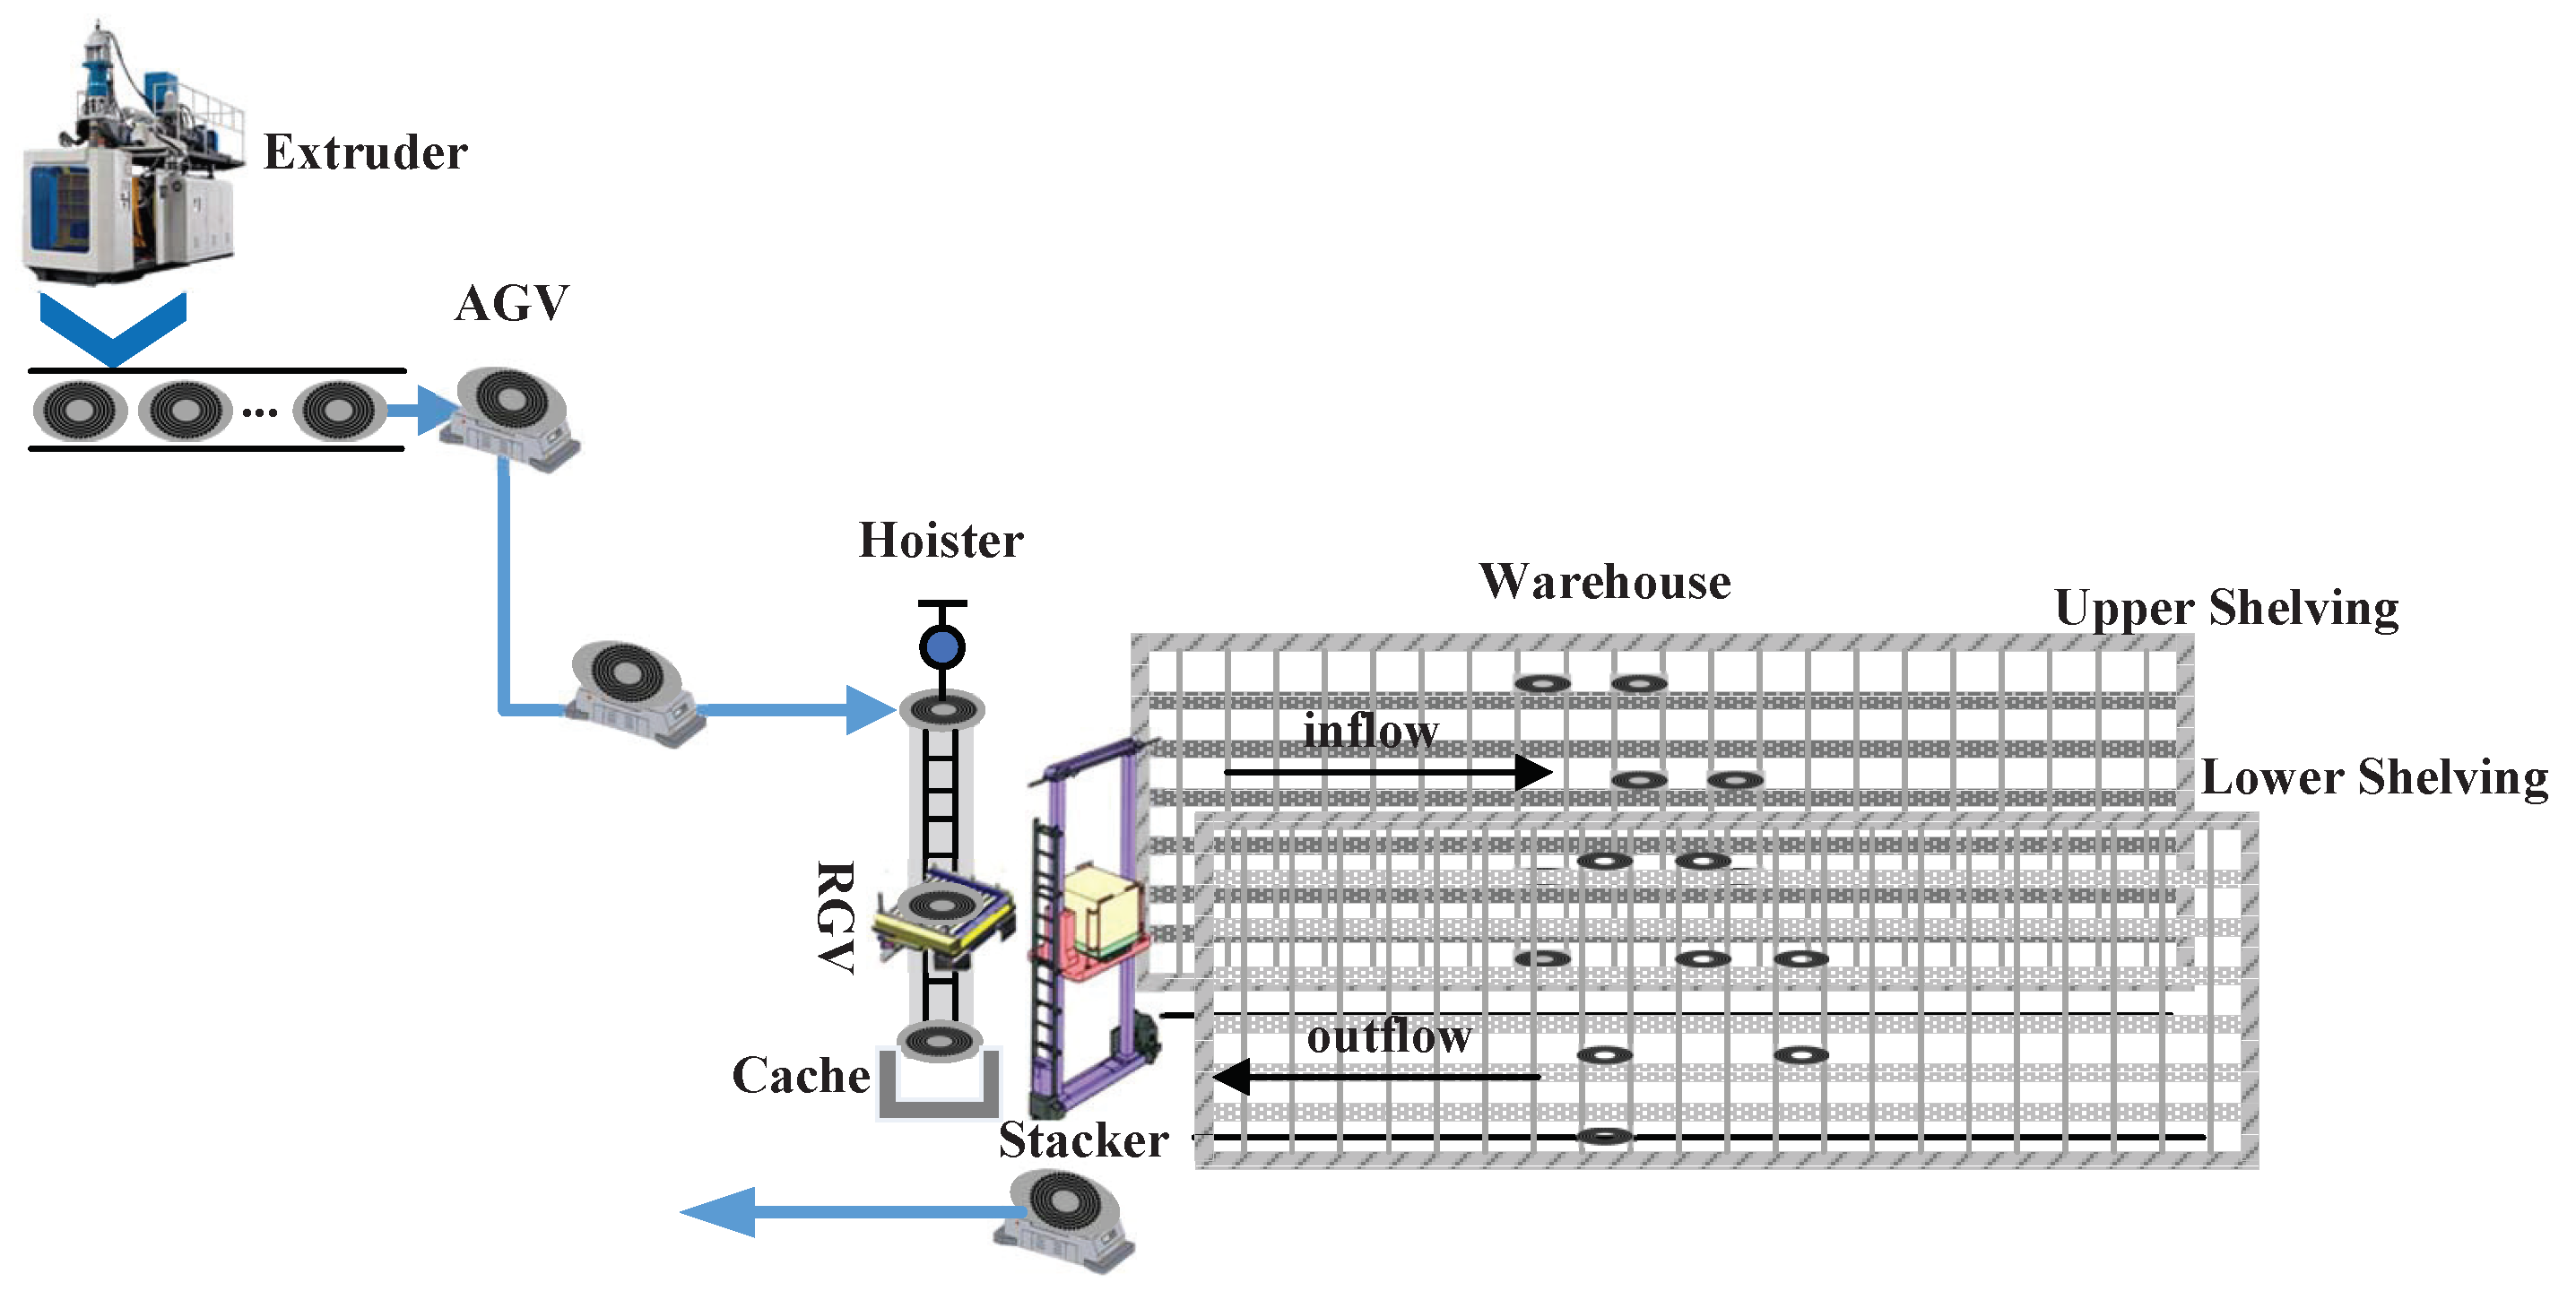
This case is an automatic tire tread handling system from an actual factory manufacturing line in China. As Figure 5 shows, the system consists of an extruder, an AGV, an automated storage and retrieval system (ASRS, which includes a hoister, an RGV, a stacker, and a large warehouse). The tire tread handling process is as follows: (1) the tire tread is extruded at the extruder and loaded onto the pallet; (2) after the pallet is fully loaded, it will be sent to the AGV point where it waits in line to be transported by the AGV; (3) when the AGV is available, it will carry the pallet to the entrance of the ASRS and then return for the next delivery; (4) in the ASRS, the pallet waits for the hoister to lift it up and load it onto the RGV if the RGV is available; (5) the RGV then transports the pallet to the stacker point; (6) when the stacker is available, it takes the pallet of tire treads to the designated storage unit and carries a pallet of tire treads out to the next process.
In the warehouse, 195 pallets of tire treads, which is the production capacity of the extruder for 12 h, are pre-placed before the simulation starts. Every time the stacker stores a pallet in the warehouse, it picks one out. So, the inventory of the warehouse is relatively stable. The store and pickup strategy of the ASRS is random. Table 2 shows the system configuration parameters, and the daily production of this automatic tire tread handling system is 390 pallets in the normal state. If the daily production plan is not completed due to component failures, the corresponding economic loss is 500 Yuan/pallet.

5.2. Disturbance Analysis and Resilience Evaluation

5.2.1. DMEA

Using the DMEA method in Section 3, the potential disturbance modes, as well as their effects, can be identified. In this problem, we only consider internal disturbances; external disruptive events ranging from natural disasters (e.g., earthquakes, hurricanes) to man-made faults (e.g., terrorists) are not considered. There are 86 disturbance modes identified in the automatic tire tread handling system, and some of them are shown in Table 3. The function, disturbance modes, disturbance causes, and occurrence probabilities originate from the FMEA form directly, system performance degradations resulting from different disturbance modes are estimated empirically, and the distributions of the recovery time are estimated using 1190 maintenance data of similar products. Taking the disturbance mode “tire treads exceed on the left” of the stacker (i.e., the 84th disturbance mode) as an example, with an occurrence probability of 1.45 × 10 6 , the stacker performance metrics P 5 , 1 P 5 , 4 reduce to 0%, 50%, and 80% of their original performances with probabilities of 50%, 30%, and 20%, respectively. Using maximum likelihood estimation and the chi-square goodness-of-fit test, we find that the performance recovery duration time in this disturbance mode obeys the log–normal distribution with the parameters (2.678, 0.265 2 ).

5.2.2. Resilience Evaluation

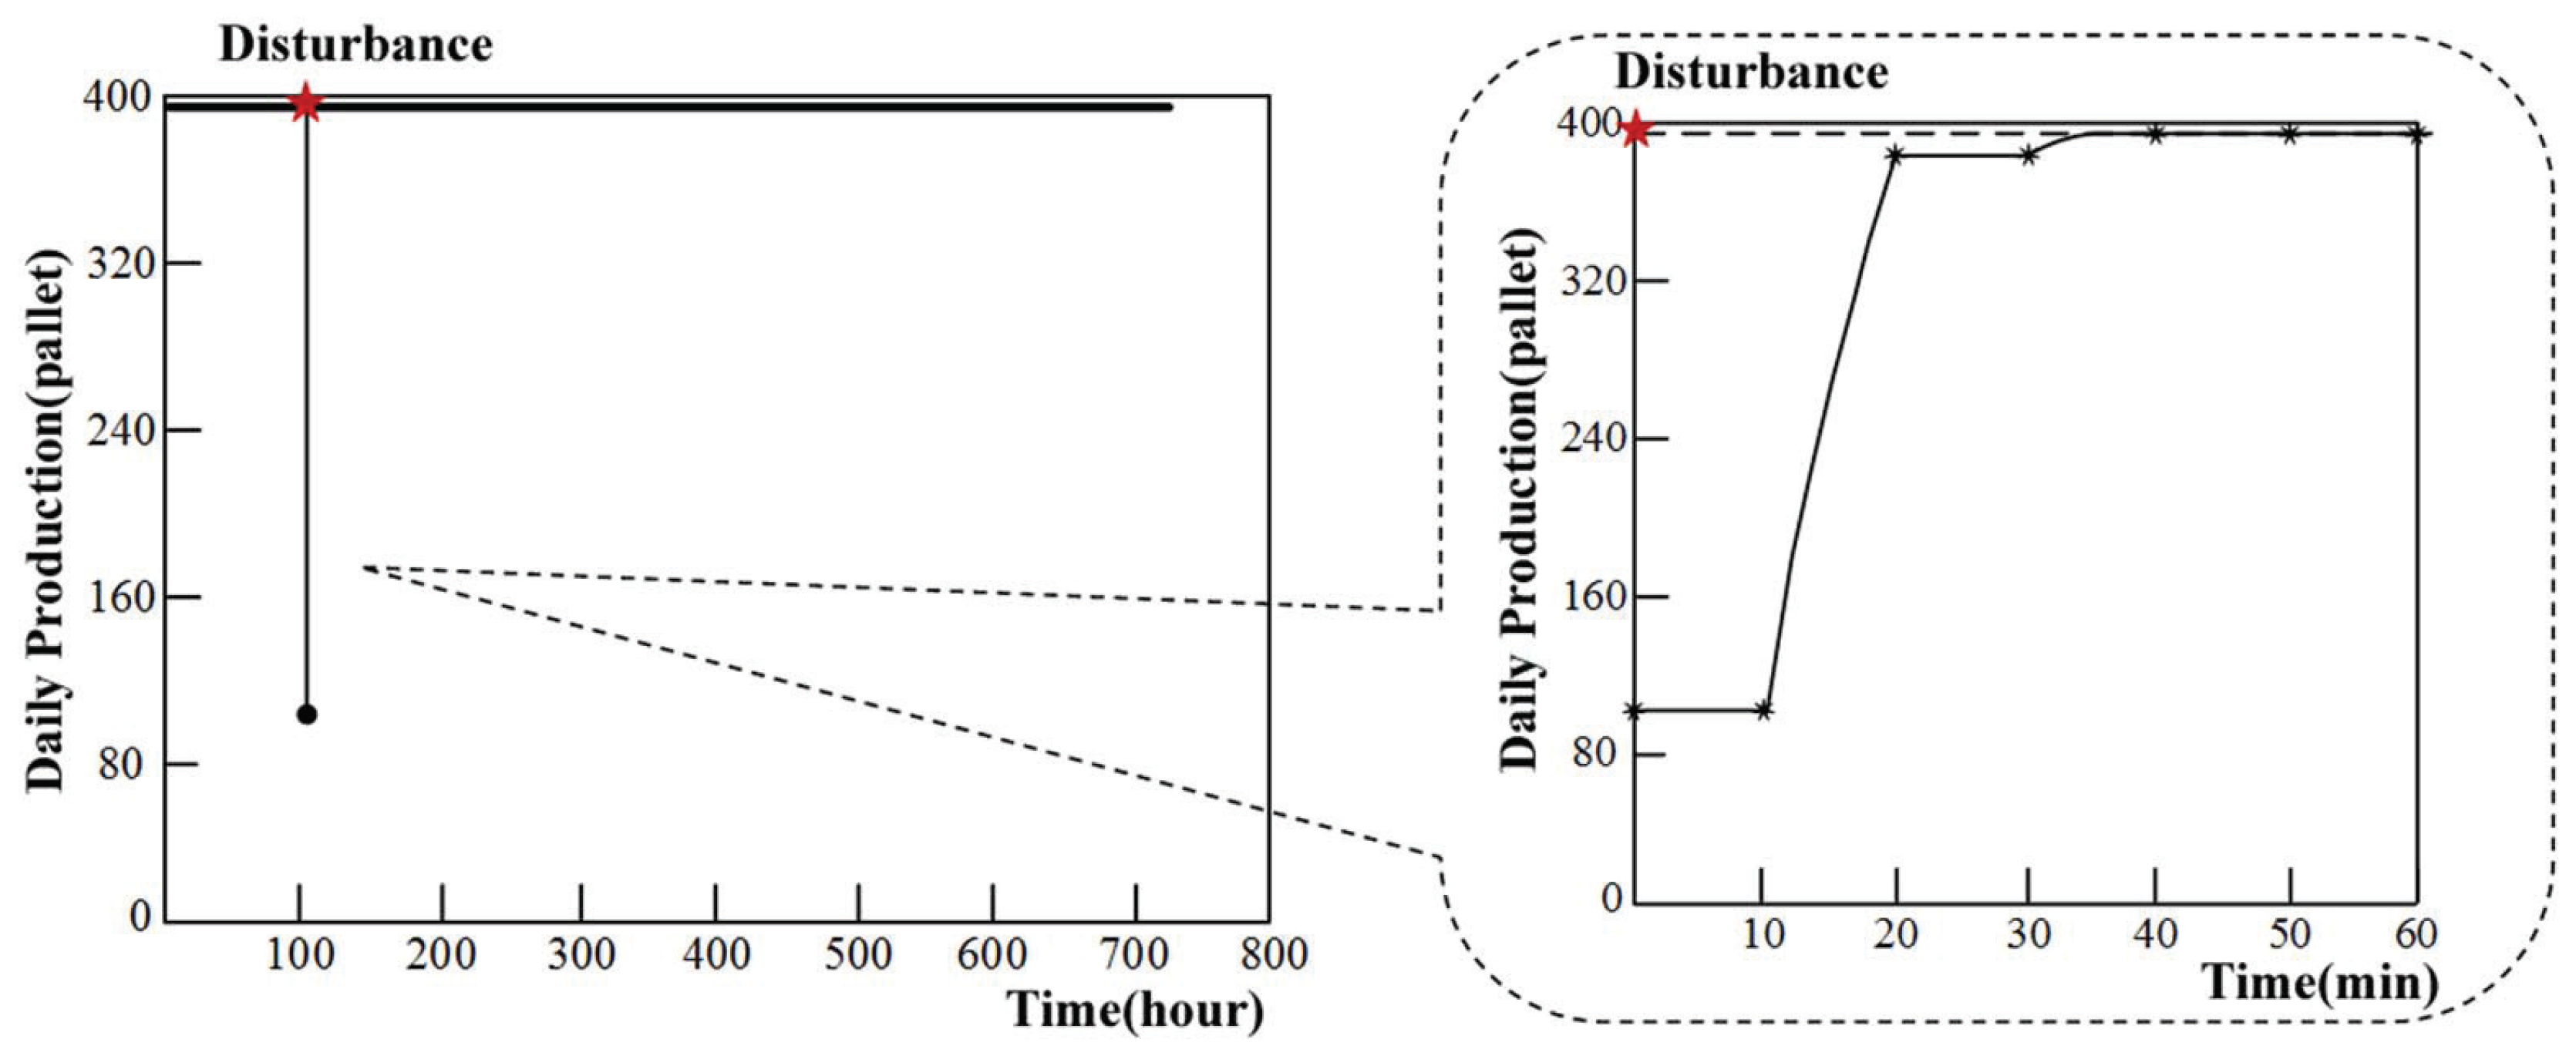
Using the DMEA and Monte Carlo-based simulation method detailed in Section 4, we evaluated the resilience of the tire tread handling system, and Figure 6 shows an example of the system’s resilience behavior after a certain disturbance. In Figure 6, the system begins operating in the normal state with a daily production of 390, and the disturbance occurs at 105 h on the stacker and causes a sharp decline in daily production. After the recovery action is taken, daily production restores to the normal state rapidly. Using Equation (2), the resilience to this particular disturbance is calculated to be 0.9225. Here, the simulation granularity is 10 min, i.e., the performance of the system is monitored and sampled every 10 min.
To characterize the resilience of the tire tread handling system subjected to random disturbances, the expectation of system resilience can be estimated using Equation (4).

5.3. Error Analysis

Samples x i obtained from Monte Carlo simulations are independent and identically distributed (i.i.d.) random variables. According to the central limit theorem, if the expectation and variance of these i.i.d. variables are finite, then the arithmetic average of the samples follows a normal distribution with mean μ and variance σ 2 / n when the sample size n is large. The estimate of the error is as follows:
ε = X X ^ < z α / 2 σ n ,
where X ^ is the estimate of X ( X ^ = x i / n ), and 1 α is the confidence level (e.g., 1 α = 95 % ).
For our problem, we combine Equations (4) and (5) and obtain
ε R A = E ( R A ) E ( R A ^ ) < z α / 2 s R A n ,
where s R A is the standard deviation of R A . It is obvious that the larger the number of iterations, the smaller the simulation error and the longer the simulation time. It is generally necessary to make a trade-off between the above two factors. Table 5 shows the error and simulation duration for different numbers of simulation iterations. We chose 1000 as the number of simulation iterations, because it reduces the (otherwise large) simulation error at a small simulation time cost.

5.4. Results and Discussion

Using the 86 disturbance modes and the corresponding performance degradation and recovery data identified through DMEA, the expectation of the resilience for the tire tread handling system subjected to random disturbances is calculated to be R A ^ = 0.9565 on the basis of 1000 simulation runs. According to Equation (6), the simulation error is calculated to be 0.003437, which is within the acceptable level.
The resilience evaluation results of the tire tread handling system can be further applied to enhance the resilience of the system. System optimization with the consideration of resilience helps reduce resource waste, increase system efficiency, and improve the sustainability of the whole manufacturing system. Section 5.4.1 discusses two system resilience enhancement methods from the perspectives of system configuration and maintenance management, and Section 5.4.2 discusses how the results affect system sustainability.

5.4.1. System Resilience Enhancement Methods

(1) Perspective of system configuration
At the design stage, we need to find a reasonable equipment configuration, and a trade-off is usually performed between the performance and cost of the system. Usually, there are three types of costs: acquisition cost, operation cost, and maintenance cost. The three costs are shown in Table 6.
In this problem, we consider that (1) there is only one extruder and one stacker in the system; (2) the warehouse lies in two rows with seven floors each, and 24 and 25 storage units exist on each floor of the two rows; and (3) the numbers of AGVs, hoisters, RGVs, and caches are variables. We analyzed the tire tread handling system with different equipment configurations, and the cost, the normal daily production, and the resilience of the system are compared in Table 7.
In Table 7, Case 1 is the initial configuration, and Cases 2–5 add redundancy to each type of equipment. One can see that both the cost and the resilience of the system increase, and the daily production retains the same value. Actually, the daily production of the tire tread handling system cannot exceed the number extruded by the extruder, which is exactly 390 pallets per day. When we configure redundancy for the AGV, the resilience increases from the original 0.9565 to 0.9867, but the cost also increases rapidly. On the other hand, if the hoister, the RGV, or the cache at the warehouse is configured redundantly, the resilience improves to about 0.9700 with a much smaller cost increase. Using these analysis results, a trade-off between cost and performance can be determined.
(2) Perspective of maintenance management
Different types of equipment play specific roles in the tire tread handling process. Correspondingly, different disturbances in these pieces of equipment result in different system performance responses, which influence the resilience. To compare the resilience responses caused by different disturbances in different equipment, eight disturbances were injected into different pieces of equipment, and the maintenance cost, the resilience to the particular disturbance, the corresponding production and economic losses are shown in Table 8.
From Table 8, one can see that the AGV is very sensitive to some disturbances, and large production losses may be caused by such disturbances and make the system less resilient. An instructive suggestion is to perform preventive maintenance on time to avoid or reduce the effects caused by these disturbances. We can also find that the system production losses that result from these disturbances are different, and it means that if several disturbances occur at the same time, an optimal maintenance sequence needs to figure out to enhance system resilience.

5.4.2. Sustainability Analysis

To date, there is no consensus on the definition and research boundary of sustainable manufacturing, and its indicators are broad. The National Institute of Standards and Technology (NIST) have defined indicators that can be used to measure the sustainability of manufactured products and processes and established a neutral set of indicators in five dimensions: technological advancement, performance management, economic growth, environmental stewardship, and social well-being [50]. We analyzed the contribution of resilience to the tire tread handling system in these five aspects one by one.
(1)
A more resilient tire tread handling system represents more advanced technology. The trade-off between cost and production can be better determined by adding resilience as an additional constraint. Resilience can effectively describe the continuous performance change process of the system after the disturbance and is more advanced than the previous two-state (i.e., the system is either normal or faulty) or discrete multistate methods.
(2)
As resilience can describe the feature of continuous changes in system performance, it is very useful in performance management. The deterministic resilience measure in Equation (2) characterizes the average performance of the system over a period of time after the disturbance. For a given disturbance, a resilient strategy can be generated according to the performance level of the system after the disturbance, and then the average performance of the system when responding to the disturbance can be improved. For random disturbances, we can analyze the resilience behavior of the system with different disturbances according to the DMEA method in this paper, and we can then find a way to improve the average resilience of the system to these disturbances.
(3)
Under a given disturbance, a resilient system can be restored faster. Fast recovery increases system production by consuming maintenance resources. In Table 8, one can see that a more resilient recovery strategy significantly decreases the total expense (i.e., the sum of the maintenance cost and the economic loss caused by the decrease in production). For example, Case 1 has a total expense of 24,070 Yuan at a resilience level of 0.9099, while the total expense in Case 2 decreases to 10,903 Yuan at a high resilience level of 0.9958. A highly resilient manufacturing process realizes global economic savings, avoids overtime work, and prevents additional resource consumption, thus promoting sustainable manufacturing. Exceptions may exist when the failure is so severe that only an overhaul or even replacement can bring the broken component back into use, as in Case 8. In this case, high resilience is obtained by direct replacement of a part.
(4)
The recovery strategy, which is determined with the consideration of resilience, helps increase the average production of the tire tread handling system after the disturbance. This means that the factory emissions per product can be reduced and that the resilient system is environmentally friendly. Moreover, the recovery strategy for multi-failure conditions affects production continuity a lot and determines the additional effort hours and resources, and this topic is closely linked with resource consumption and environmental pressure, on which sustainability has primarily focused [51]. Research concentrating on the optimal recovery strategy will be conducted in the future.
(5)
Because the resilience can improve the average performance of the system after the disturbance, it is beneficial to manufacture more products facing the same situation. The richness of commodities attracts customers and is conducive to improvement in social well-being.

6. Conclusions

This paper proposes a new disturbance analysis method for resilience evaluation, i.e., DMEA. With the use of our method, quantitative information of disturbance occurrence probability, performance degradation, and recovery behavior can be collected easily. With the data obtained by performing DMEA, we also developed a Monte Carlo-based simulation method to estimate the resilience. The effectiveness of this method was verified by conducting a resilience evaluation of a tire tread handling system. The main contributions of this paper are as follows: (1) A systematic disturbance identification and analysis method is proposed for the purpose of resilience qualification. Potential disturbance modes can be identified and listed in a bottom-up method, and the disturbance effects are specified using performance degradation and recovery functions. (2) A resilience measure for the MHS based on the daily production is proposed to enrich MHS resilience quantification, and few studies were found to have explored this area before. (3) A resilience evaluation framework based on DMEA and the Monte Carlo method is developed for the MHS. Using our DMEA-based resilience evaluation method, the resilience of the MHS system can be analyzed and further optimized, thus enabling the system to operate more efficiently and helping to reduce wasted resources. This method can also be applied to other engineering systems, especially at the design stage.
In this paper, the current case study indicates that the resilience of the MHS can be enhanced by reasonable system configuration and maintenance management. In our future work, we will further study more advanced examples using our DMEA method and improve system resilience by optimizing resilient system reconfiguration and maintenance strategies. As the AGV is the main part of the MHS, we will focus on its scheduling strategy and recovery strategy. In the future, with the development of intelligent technology, intelligent maintenance methods will be applied in the manufacturing industry more extensively, and self-maintenance technology arising from this will further enhance the resilience and sustainability of the system [52]. Our research will benefit the generation of resilient and sustainable self-maintenance strategies.

Author Contributions

Conceptualization, R.L. and R.K.; Data curation, L.Y.; Formal analysis, R.L. and X.T.; Funding acquisition, R.L. and X.T.; Investigation, X.T.; Methodology, R.L.; Project administration, R.L. and R.K.; Software, R.L. and X.T.; Supervision, R.L. and L.Y.; Validation, R.L. and X.T.; Visualization, X.T.; Writing—original draft, X.T.; Writing—review & editing, R.L.

Funding

This research was funded by National Natural Science Foundation of China grant number 61773044, 61872018 and Graduate Innovation Practice Foundation of Beihang University grant number YCSJ-03-2018-02.

Conflicts of Interest

The authors declare no conflict of interest.

References

  1. Yuan, C.; Zhai, Q.; Dornfeld, D. A three dimensional system approach for environmentally sustainable manufacturing. CIRP Ann.-Manuf. Technol. 2012, 61, 39–42. [Google Scholar] [CrossRef]
  2. Murino, T.; Romano, E.; Santillo, L.C. Supply chain performance sustainability through resilience function. In Proceedings of the 2011 Winter Simulation Conference (WSC), Phoenix, AZ, USA, 11–14 December 2011; pp. 1600–1611. [Google Scholar]
  3. Rajesh, R. On sustainability, resilience, and the sustainable-resilient supply networks. Sustain. Prod. Consum. 2018, 15, 74–88. [Google Scholar] [CrossRef]
  4. Pope, J.; Bond, A.; Morrison-Saunders, A. A conceptual framework for sustainability assessment. In Handbook of Sustainability Assessment; Edward Elgar Publishing: Cheltenham, UK; Northampton, MA, USA, 2015; pp. 20–42. [Google Scholar]
  5. Jayal, A.D.; Badurdeen, F.; Dillon, O.W.; Jawahir, J.I.S. Sustainable manufacturing: Modeling and optimization challenges at the product, process and system levels. CIRP J. Manuf. Sci. Technol. 2010, 2, 144–152. [Google Scholar] [CrossRef]
  6. Nakano, M. A conceptual framework for sustainable manufacturing by focusing on risks in supply chains. In Proceedings of the IFIP International Conference on Advances in Production Management Systems, Bordeaux, France, 21–23 September 2009; pp. 160–167. [Google Scholar]
  7. Thomas, A.; Byard, P.; Francis, M.; Fisher, R.; White, G.R. Profiling the resiliency and sustainability of UK manufacturing companies. J. Manuf. Technol. Manag. 2016, 27, 82–99. [Google Scholar] [CrossRef]
  8. Lin, J.T.; Wang, F.K.; Yen, P.Y. Simulation analysis of dispatching rules for an automated interbay material handling system in wafer fab. Int. J. Prod. Res. 2001, 39, 1221–1238. [Google Scholar] [CrossRef]
  9. Wu, L.H.; Mok, P.Y.; Zhang, J. An adaptive multi-parameter based dispatching strategy for single-loop interbay material handling systems. Comput. Ind. 2011, 62, 175–186. [Google Scholar] [CrossRef]
  10. Wang, C.N.; Lee, Y.H.; Hsu, H.P.; Nguyen, D.H. The heuristic preemptive dispatching method for convey-based automated material handling system of 450 mm wafer fabrication. Comput. Ind. Eng. 2016, 96, 52–60. [Google Scholar] [CrossRef]
  11. Lau, H.Y.K.; Woo, S.O. An agent-based dynamic routing strategy for automated material handling systems. Int. J. Comput. Integr. Manuf. 2008, 21, 269–288. [Google Scholar] [CrossRef]
  12. Chien, C.F.; Chou, C.W.; Yu, H.C. A novel route selection and resource allocation approach to improve the efficiency of manual material handling system in 200-mm wafer fabs for Industry 3.5. IEEE Trans. Autom. Sci. Eng. 2016, 13, 1567–1580. [Google Scholar] [CrossRef]
  13. Fang, Z.; Mao, J. Energy-efficient elevating transfer vehicle routing for automated multi-level material handling systems. In Proceedings of the 13th IEEE Conference on Automation Science and EngineeringAutomation Science and Engineering, Xi’an, China, 20–23 August 2017; pp. 249–254. [Google Scholar]
  14. Tavana, M.; Fazlollahtabar, H.; Hassanzadeh, R. A bi-objective stochastic programming model for optimising automated material handling systems with reliability considerations. Int. J. Prod. Res. 2014, 52, 5597–5610. [Google Scholar] [CrossRef]
  15. Karimi, B.; Niaki, S.T.A.; Haleh, H.; Naderi, B. Bi-Objective optimization of a job shop with two types of failures for the operating machines that use automated guided vehicles. Reliab. Eng. Syst. Saf. 2018, 175, 92–104. [Google Scholar] [CrossRef]
  16. Beschorner, A.; Glüer, D. MaxFlow theory for availability calculation of automated material handling systems. Robot. Comput. Integr. Manuf. 2003, 19, 141–145. [Google Scholar] [CrossRef]
  17. Glüer, D. Optimization of automated material handling systems regarding robustness and delivery time. In Proceedings of the 2003 IEEEI/SEMI Advanced Semiconductor Manufacturing Conference and Workshop, Munich, Germany, 31 March–1 April 2003; pp. 96–100. [Google Scholar]
  18. Mital, P.; Goetschalckx, M.; Huang, E. Robust material handling system design with standard deviation, variance and downside risk as risk measures. Int. J. Prod. Econ. 2015, 170, 815–824. [Google Scholar] [CrossRef]
  19. Chen, W.; Wang, Z.; Chan, F.T.S. Robust production capacity planning under uncertain wafer lots transfer probabilities for semiconductor automated material handling systems. Eur. J. Oper. Res. 2017, 261, 929–940. [Google Scholar] [CrossRef]
  20. Gu, X.; Jin, X.; Ni, J. Resilience measures of manufacturing systems under disruptions. In Proceedings of the ASME 2014 International Manufacturing Science and Engineering Conference, Detroit, MI, USA, 9–13 June 2014; pp. 1–10. [Google Scholar]
  21. Gu, X.; Jin, X.; Ni, J.; Koren, Y. Manufacturing system design for resilience. Procedia CIRP 2015, 36, 135–140. [Google Scholar] [CrossRef]
  22. Fisher, O.; Watson, N.; Porcu, L.; Bacon, D.; Rigley, M.; Gomes, R.L. Cloud manufacturing as a sustainable process manufacturing route. J. Manuf. Syst. 2018, 47, 53–68. [Google Scholar] [CrossRef]
  23. Brandon-Jones, E.; Squire, B.; Autry, C.; Petersen, K.J. A contingent resource-based perspective of supply chain resilience and robustness. J. Supply Chain Manag. 2014, 50, 55–73. [Google Scholar] [CrossRef]
  24. Li, R.; Dong, Q.; Jin, C.; Kang, R. A new resilience measure for supply chain networks. Sustainability 2017, 9, 144. [Google Scholar] [CrossRef]
  25. Adams, T.; Bekkem, K.; Bier, V. Operational Resiliency of Beloit-Hudson Interstate Highway Corridor; Technical Report; University of Wisconsin: Madison, WI, USA, 2010. [Google Scholar]
  26. Marousek, R.; Novotny, P. The FMEA exploitation in supply chain resilience evaluation. In Proceedings of the 23rd International Conference on Metallurgy and Materials, Brno, Czech Republic, 21–23 May 2014; pp. 1–6. [Google Scholar]
  27. Mock, R.G.; de Obeso Luis, L.; Zipper, C.; Schönenberger, M. Resilience assessment of internet of things: A case study on smart buildings. In Risk, Reliability and Safety: Innovating Theory and Practice; Walls, L., Revie, M., Bedford, T., Eds.; Taylor & Francis: Glasgow, UK, 2016; pp. 2260–2267. [Google Scholar]
  28. Bruelheide, H.; Luginbühl, U. Peeking at ecosystem stability: Making use of a natural disturbance experiment to analyze resistance and resilience. Ecology 2009, 90, 1314–1325. [Google Scholar] [CrossRef]
  29. Ledger, M.E.; Harris, R.M.L.; Armitage, P.D.; Milner, A.M. Climate change impacts on community resilience: Evidence from a drought disturbance experiment. Adv. Ecol. Res. 2012, 46, 211–258. [Google Scholar]
  30. Pascale, F.D.; Bernardo, M.; Muto, F.; Matteo, D.D.; Dattilo, V. Resilience and seismic risk perception at school: A geoethical experiment in Aiello Calabro, southern Italy. Nat. Hazards 2017, 86, 569–586. [Google Scholar] [CrossRef]
  31. Shirali, G.A.; Mohammadfam, I.; Ebrahimipour, V. A new method for quantitative assessment of resilience engineering by PCA and NT approach: A case study in a process industry. Reliab. Eng. Syst. Saf. 2013, 119, 88–94. [Google Scholar] [CrossRef]
  32. Azadeh, A.; Asadzadeh, S.M.; Tanhaeean, M. A consensus-based AHP for improved assessment of resilience engineering in maintenance organizations. J. Loss Prev. Process Ind. 2017, 47, 151–160. [Google Scholar] [CrossRef]
  33. Azadeh, A.; Salehi, V.; Kianpour, M. Performance evaluation of rail transportation systems by considering resilience engineering factors: Tehran railway electrification system. Transp. Lett. 2018, 10, 12–25. [Google Scholar] [CrossRef]
  34. Almeida, R.; Vieira, M. Benchmarking the resilience of self-adaptive software systems: perspectives and challenges. In Proceedings of the 6th International Symposium on Software Engineering for Adaptive and Self-Managing Systems, Waikiki, HI, USA, 23–24 May 2011; pp. 190–195. [Google Scholar]
  35. Pradhan, S.; Dubey, A.; Levendovszky, T.; Kumar, P.S.; Emfinger, W.A.; Balasubramanian, D.; Otte, W.; Karsai, G. Achieving resilience in distributed software systems via self-reconfiguration. J. Syst. Softw. 2016, 122, 344–363. [Google Scholar] [CrossRef]
  36. Ma, W.; Li, R.; Jin, C.; Kang, R. Resilience test and evaluation of networked control systems for given disturbances. In Proceedings of the 2nd International Conference on Reliability Systems Engineering, Beijing, China, 10–12 July 2017; p. R043. [Google Scholar]
  37. Tran, H.T.; Balchanos, M.; Domerçant, J.C.; Mavris, D.N. A framework for the quantitative assessment of performance-based system resilience. Reliab. Eng. Syst. Saf. 2017, 158, 73–84. [Google Scholar] [CrossRef]
  38. Almajali, A.; Viswanathan, A.; Neuman, C. Resilience evaluation of demand response as spinning reserve under cyber-physical threats. Electronics 2017, 6, 2. [Google Scholar] [CrossRef]
  39. Liu, X.; Jiang, W.; Li, J.; Wang, W. Evaluation of the vegetation coverage resilience in areas damaged by the Wenchuan earthquake based on MODIS-EVI data. Sensors 2017, 17, 259. [Google Scholar] [CrossRef]
  40. Zio, E.; Piccinelli, R. Randomized flow model and centrality measure for electrical power transmission network analysis. Reliab. Eng. Syst. Saf. 2010, 95, 379–385. [Google Scholar] [CrossRef] [Green Version]
  41. O’Sullivan, D. Material Transport Systems. Available online: http://www.nuigalway.ie/staff-sites/david_osullivan/documents/unit_8_material_transport_systems.pdf (accessed on 8 March 2019).
  42. Hao, Q.; Shen, W. Implementing a hybrid simulation model for a Kanban-based material handling system. Robot. Comput.-Integr. Manuf. 2008, 24, 635–646. [Google Scholar] [CrossRef] [Green Version]
  43. Strigini, L. Fault tolerance and resilience: meanings, measures and assessment. In Resilience Assessment and Evaluation of Computing Systems; Springer: Berlin/Heidelberg, Germany, 2012; pp. 3–24. [Google Scholar]
  44. Bruneau, M.; Chang, S.E.; Eguchi, R.T.; Lee, G.C.; O’Rourke, T.D.; Reinhorn, A.M.; Shinozuka, M.; Tierney, K.; Wallace, W.A.; von Winterfeldti, D. A framework to quantitatively assess and enhance the seismic resilience of communities. Earthq. Spectra 2003, 19, 733–752. [Google Scholar] [CrossRef]
  45. Zobel, C.W. Representing perceived tradeoffs in defining disaster resilience. Decis. Support Syst. 2011, 50, 394–403. [Google Scholar] [CrossRef]
  46. Ouyang, M.; Dueñas Osorio, L.; Min, X. A three-stage resilience analysis framework for urban infrastructure systems. Struct. Saf. 2012, 36–37, 23–31. [Google Scholar] [CrossRef]
  47. Chang, S.E.; Shinozuka, M. Measuring improvements in the disaster resilience of communities. Earthq. Spectra 2004, 20, 739–755. [Google Scholar] [CrossRef]
  48. Cimellaro, G.P.; Reinhorn, A.M.; MichelBruneau, M. Seismic resilience of a hospital system. Struct. Infrastruct. Eng. 2010, 6, 127–144. [Google Scholar] [CrossRef]
  49. Henry, D.; Ramirez-Marquez, J.E. Generic metrics and quantitative approaches for system resilience as a function of time. Reliab. Eng. Syst. Saf. 2012, 99, 114–122. [Google Scholar] [CrossRef]
  50. Joung, C.B.; Carrell, J.; Sarkar, P.; Feng, S.C. Categorization of indicators for sustainable manufacturing. Ecol. Indicat. 2013, 24, 148–157. [Google Scholar] [CrossRef]
  51. Garetti, M.; Mummolo, G.; Taisch, M. Special issue on “sustainable manufacturing”. Prod. Plan. Control 2012, 23, 79–82. [Google Scholar] [CrossRef] [Green Version]
  52. Lee, J.; Ghaffari, M.; Elmeligy, S. Self-maintenance and engineering immune systems: Towards smarter machines and manufacturing systems. Annu. Rev. Control 2011, 35, 111–122. [Google Scholar] [CrossRef]
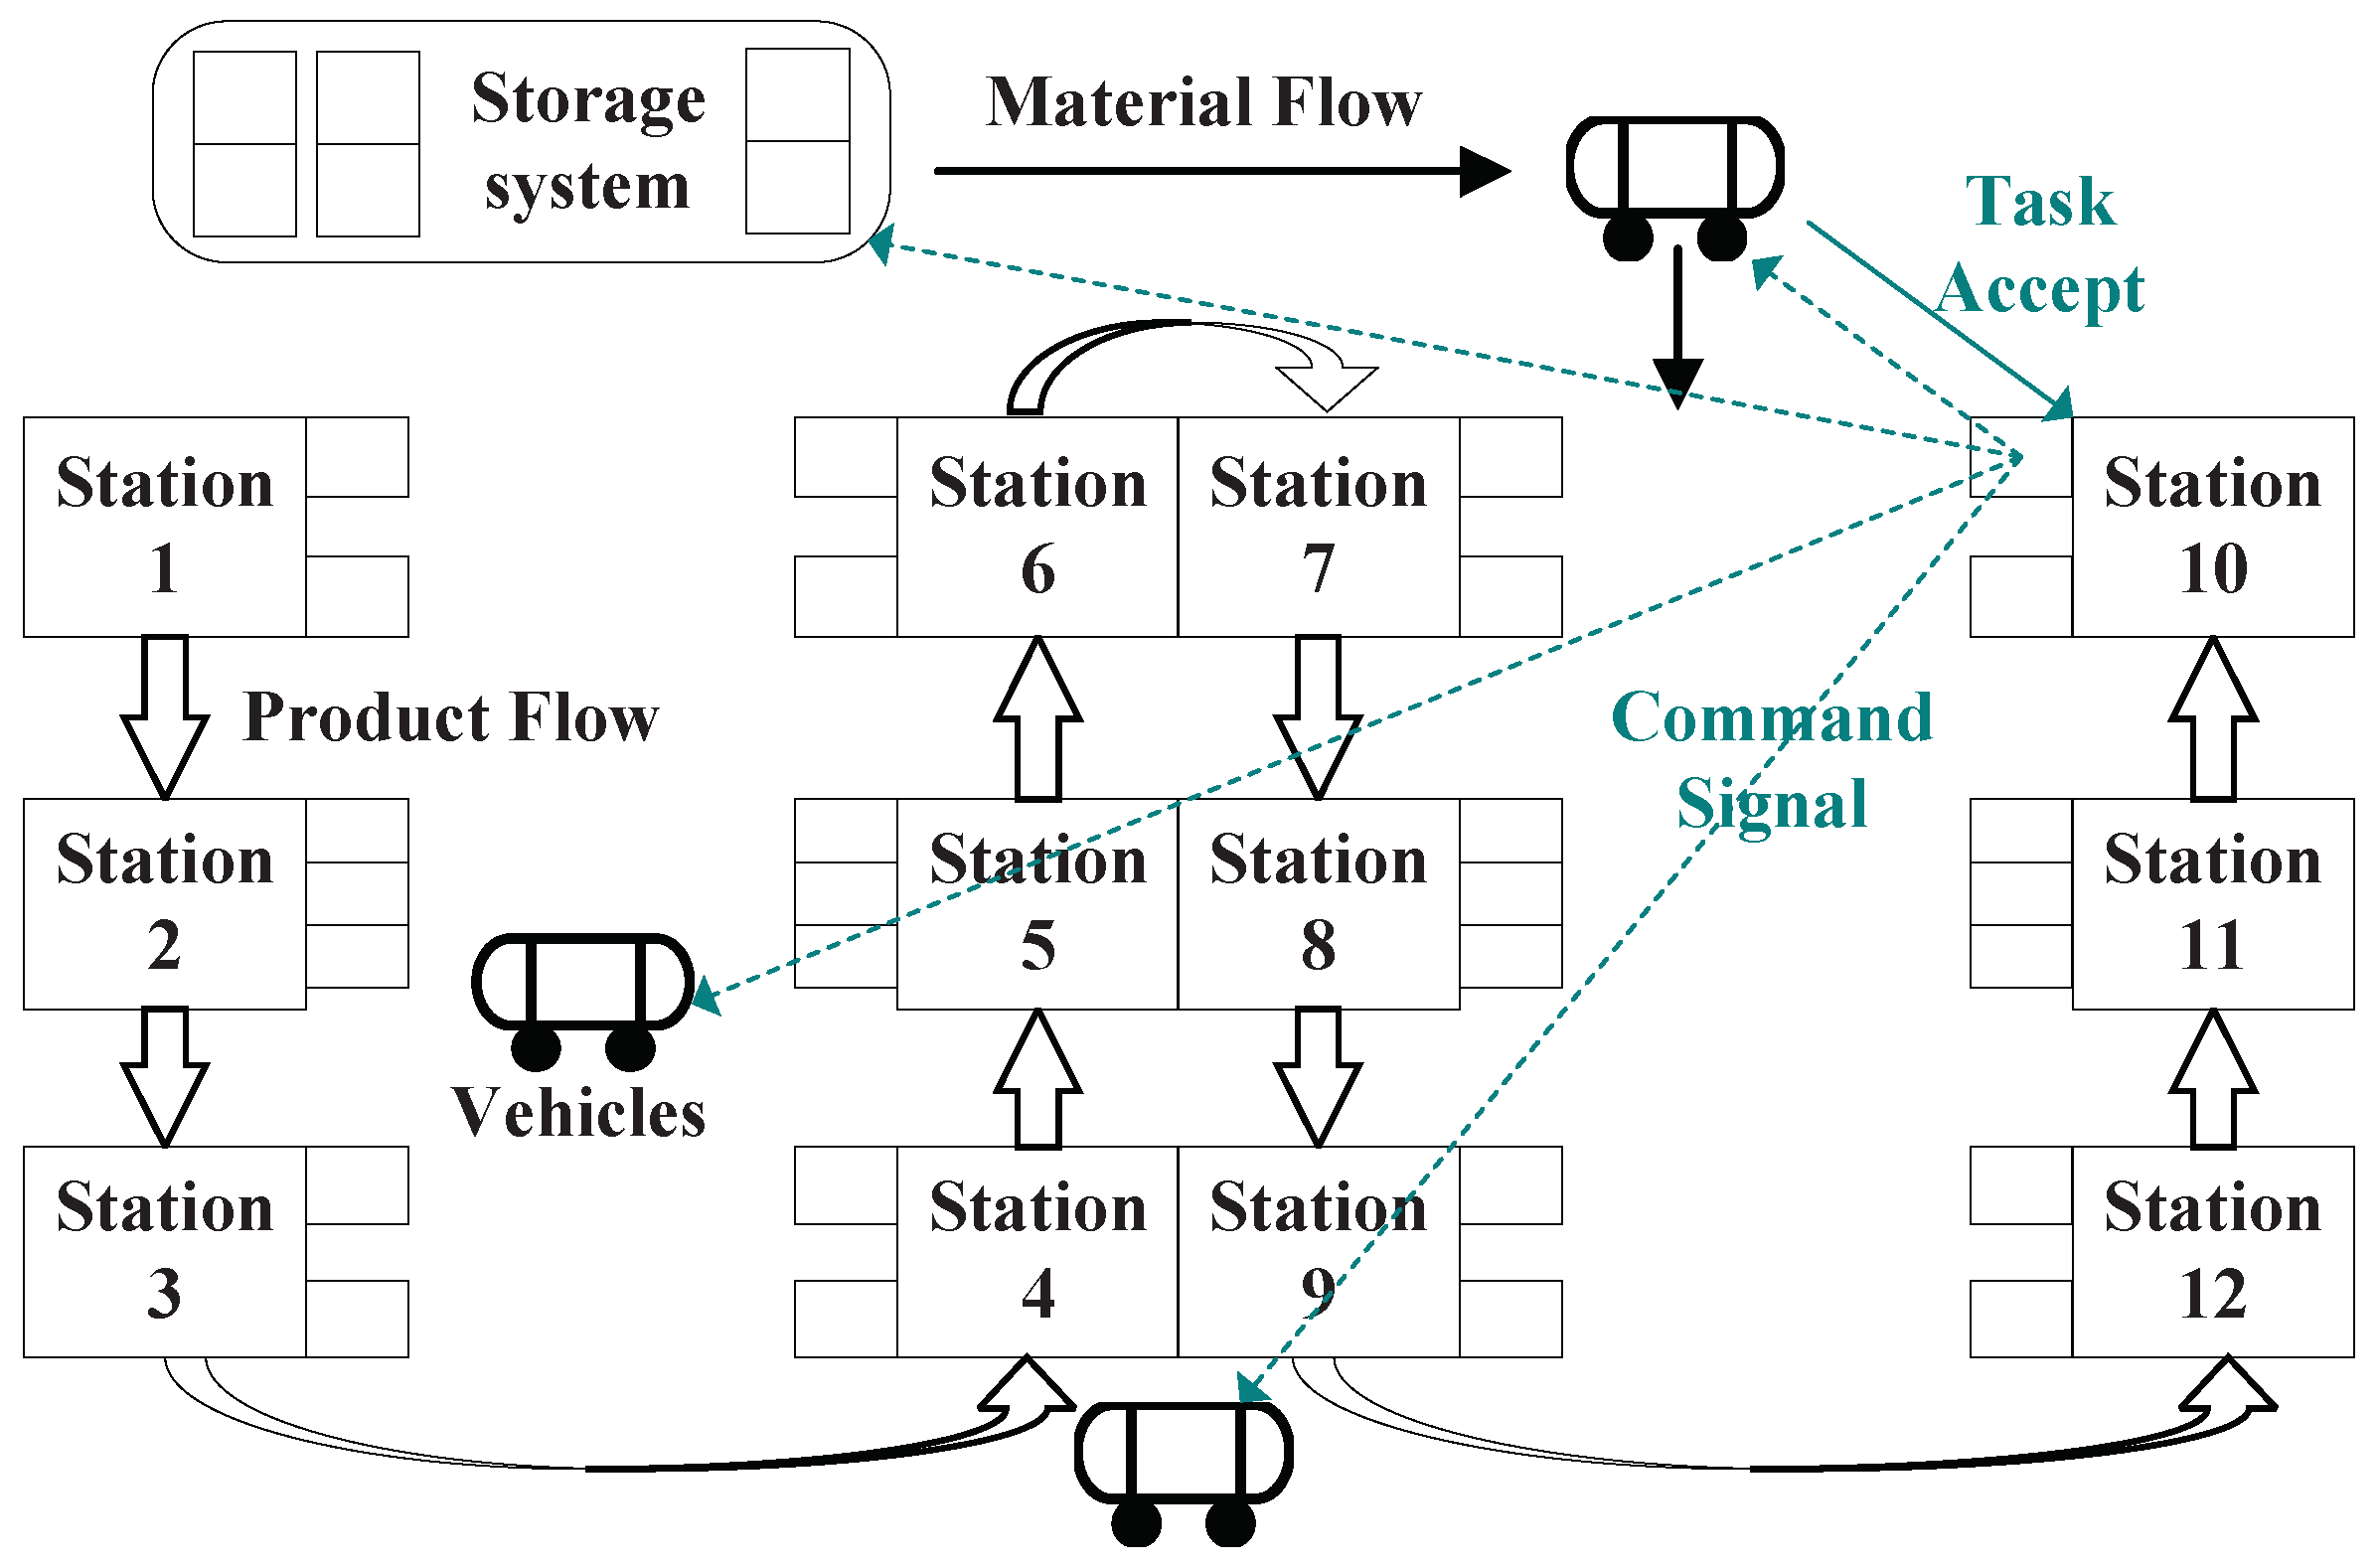
Figure 1. The general constitution of the material handling system (MHS).
Sustainability 11 01447 g001
Figure 2. Three typical performance degradation and recovery models: (a) continuous linear model; (b) continuous nonlinear model; (c) discrete model.
Sustainability 11 01447 g002
Figure 3. General procedure for conducting a disturbance mode and effects analysis (DMEA)-based resilience evaluation for MHSs.
Sustainability 11 01447 g003
Figure 4. The deterministic measure of resilience.
Sustainability 11 01447 g004
Figure 5. The automatic tire tread handling system.
Sustainability 11 01447 g005
Figure 6. The resilience behavior of the tire tread handling system (example).
Sustainability 11 01447 g006
Table 1. Disturbance mode and effects analysis form.
Sustainability 11 01447 i001
No.Part
Name
FunctionDisturbance
Modes
Disturbance
Causes
Occurrence
Probability
Disturbance Effects
Performance AffectedPerformance Degradation and Recovery
        
Table 2. The configuration parameters of the automatic tire tread handling system.
ParameterValueParameterValue
Discharge time interval of the extruder221.4 s/palletHoisterMaterial pick-up duration ( P 2 , 1 )8 s
Maximum allowable recovery time4 hMaterial drop-off duration ( P 2 , 2 )1 s
Transport duration from extruder
to the AGV pick-up location ( P 1 , 1 )
45 sTransport duration from the AGV
drop off location to hoister cache ( P 2 , 3 )
17.5 s
AGVForward velocity ( P 1 , 2 )1.33 m/sRGVDuration of vehicle go ( P 3 , 1 )12 s
Turn velocity ( P 1 , 3 )0.5 m/sDuration of vehicle return ( P 3 , 2 )11 s
Acceleration ( P 1 , 4 )0.2 m/s 2 Material drop-off duration ( P 3 , 3 )2 s
U-turn duration ( P 1 , 5 )25 sStackerMaterial pick-up/drop-off duration ( P 4 , 1 )22 s
Material pick-up/drop-off duration ( P 1 , 6 )15 sLift velocity ( P 4 , 2 )0.67 m/s
Straight path length of AGV go35.6 mWalk velocity ( P 4 , 3 )2.67 m/s
Straight path length of AGV return36.9 mAcceleration ( P 4 , 4 )0.5 m/s 2
Turning path length of AGV go7.4 mShelvingNumber of floors7
Turning path length of AGV return10.3 mNumber of upper horizontal storage units24
U-turn times of AGV go0Number of lower horizontal storage units25
Turn times of AGV go1Width of the storage unit1.47 m
U-turn times of AGV return1Height of the storage unit2.325∼2.425 m
Turn times of AGV return1
Table 3. Partial DMEA form of the tire tread handling system.
Sustainability 11 01447 i002
No.Part
Name
FunctionDisturbance
Modes
Disturbance
Causes
Occurrence
Probability
Disturbance Effects
Performance Affected Q i , 1 t 1 t 0 Q i , 2 t 2 t 1
1AGVtake tire treadsdrive unit failsdrive unit design 1.14 × 10 4 P 1 , 1 P 1 , 6 1,0.8,10 Q 1 , 0 1,10,10
2to the warehousecircuit connection failsprocess problem 5.71 × 10 5 P 1 , 1 P 1 , 6 6,[0.5,0.8],[0.2,0.8]0 Q 1 , 0 1,20,20
3entrancecontrol system failsexternal interference 2.28 × 10 4 P 1 , 1 P 1 , 6 6,[0.5,0.8],[0.2,0.8]0 Q 1 , 0 1,30,30
84stackercarry tiretire treads exceed on the leftbias of the pallet 1.45 × 10 6 P 5 , 1 P 5 , 4 6,[0,0.5,0.8],[0.5,0.3,0.2]0 Q 5 , 0 4,2.678,0.265
85treads to thetire treads exceed on the rightbias of the pallet 1.58 × 10 6 P 5 , 1 P 5 , 4 6,[0,0.5,0.8],[0.5,0.3,0.2]0 Q 5 , 0 4,2.632,0.248
86storage unittask execution timeoutnetwork interruption 6.57 × 10 7 P 5 , 1 P 5 , 4 6,[0,0.5,0.8],[0.5,0.3,0.2]0 Q 5 , 0 4,2.732,0.314
Note: (1) In the seventh column, P i , j is the jth performance parameter of the ith component, and P 1 , 1 P 1 , 6 and P 5 , 1 P 5 , 4 are the parameters of the AGV and stacker in Table 2, respectively; (2) The ”Performance Degradation and Recovery“ in Table 1 is replaced by Q i , 1 , t 1 t 0 , Q i , 2 , and t 2 t 1 , as the performance degradation and recovery process of the automatic tire tread handling system is the continuous linear type; (3) Q i , 1 and t 2 t 0 are random variables, and the explanations of the two parameters in different distribution types can be seen in Table 4, respectively; (4) It is assumed that the performance of the component drops directly to Q i , 1 after the disturbance and then restores to the normal state after recovery, i.e., t 1 t 0 0 and Q i , 2 Q i , 0 for all i.
Table 4. Explanations of common distributions and their parameters in Table 3.
Distribution TypeDistribution Type No.Characteristic Parameters
12
Uniform distribution X U ( a , b ) 1ab
Exponential distribution X E ( λ ) 2 λ -
Normal distribution X N ( μ , σ 2 ) 3 μ σ
Log–normal distribution l n X N ( μ , σ 2 ) 4 μ σ
Log-logistic distribution X L L ( e μ , 1 / s ) 5 μ s
Discrete distribution6 [ d 1 , d 2 , , d n ] [ p 1 , p 2 , , p n ]
Note: In the discrete distribution, d 1 , d 2 , , d n are n possible values of the parameter; p 1 , p 2 , , p n are the possibilities at each value; and i = 1 n p i = 1 .
Table 5. Errors and duration for different numbers of simulation iterations.
No.Number of IterationsErrorDuration (s)
15000.00613152.6959
210000.00343789.2595
315000.003306127.169
420000.003197178.013
525000.002938200.445
630000.002747279.122
735000.002564283.232
840000.002430327.458
945000.002291368.282
1050000.002077509.328
Table 6. Cost parameters of the tire tread handling system.
EquipmentAcquisition Cost
(Yuan/Unit)
Operation Cost
(Yuan/Unit Year)
Maintenance Cost
HardwareManpower (Yuan/Hour)
AGV900,00010,000Determined by
the disturbance
mode
500
Hoister150,0001000
RGV200,0001000
Stacker1,000,00010,000
Cache100,000---
Storage Unit2700---
Table 7. Comparisons of the tire tread handling system in different system configurations.
Case No.Number ofCost (Yuan)Daily Production
(Pallet)
Resilience
AGVHoisterRGVCacheAcquisitionOperationMaintenanceTotal
111113,276,10022,00095,0003,393,1003900.9565
221114,176,10032,000173,0004,381,1003900.9867
312113,426,10023,000102,0003,551,1003900.9716
411213,476,10023,000107,0003,606,1003900.9700
511123,376,10022,00095,0003,493,1003900.9720
Table 8. Comparison of different disturbances to different pieces of equipment.
Case No.Disrupted EquipmentMaintenance Cost (Yuan)ResilienceProduction Loss
(Pallets)
Economic Loss
(Yuan)
ManpowerHardwareTotal
1AGV500600065000.909935.1417,570
28310,00010,0830.99581.64820
3Hoister75010,00010,7500.97928.114055
475010,00010,7500.99681.25625
5RGV50060011000.9769.364680
683100010830.99193.161580
7Stacker103.730003103.70.97928.114055
87020,00020,0700.99322.651325