Abstract
In this study, various national strategies and programs are described by planning instruments. The TIEB (Thailand Integrated Energy Blueprint), which includes six programs (AEDP, PDP, EEDP, ODP, GDP, REDP), aims to regulate renewable energy and improve the use of biofuel. In addition, the potential of second-generation biofuels is estimated with different residue extractions of second-generation biomasses: 20% (scenario 1), 44% (scenario 2), and 66% (scenario 3). Based on the production potentials that were estimated, CO2 will decrease 1.3–3.5 megatons in the gasoline sector, and 1.4–3.8 megatons in the diesel sector under scenario 1. In scenario 2, we estimated decreases of 2.8–7.7 mega tons and 3.2–8.4 mega tons of CO2 for the gasoline and diesel sectors, respectively. Finally, scenario 3 is expected to reduce the CO2 concentration by 4.2–11.6 megatons in the gasoline sector, and by 4.7–12.6 megatons in the diesel sector. We also estimate the economic potential of a second-generation biofuel with the view of emissions trading. For bioethanol and biodiesel, respectively, 27–74 million USD and 30–81 million USD could be realized in scenario 1, 60–163 million USD and 67–178 million USD in scenario 2, and 90–244 million USD and 100–267 million USD in scenario 3. We conclude that the future potential of second-generation biofuels in Thailand is optimistic, and that they can provide both environmental and economic benefits to the country.
1. Introduction
1.1. Background
Greenhouse gas (GHG) emissions from fossil fuels such as oil, coal, and natural gas cause air pollution, and they are harmful to the environment [1]. According to the International Energy Agency (IEA), the transportation sector was responsible for 23% of energy-related CO2 emissions globally, in 2013 [2,3]. Currently, energy fuel resources are mainly based on non-renewable fuels, and they face gradual depletion [4]. However, renewable sources that are derived directly or indirectly from the sun or from other natural mechanisms can be supplemented within a short time scale [5].
Liquid biofuel, one type of renewable energy, has been investigated globally to mitigate CO2 emissions from the transportation sector. As demands for clean energy increase, biofuels are becoming increasingly attractive. Biofuel contributes to the reduction of CO2 emissions from vehicles, because their lifecycle CO2 emissions are generally lower than those of gasoline and diesel [6]. According to Balat [7], cellulosic bioethanol can reduce GHG emissions by 90% compared with gasoline. In addition, cellulosic diesel can reduce GHG emissions by 60–90%, compared with diesel, based on other research [8]. Furthermore, it can improve human health by reducing air pollution, and increase economic growth for rural areas [9].
Thailand is a major Asian biofuel producer country, along with India, China, Indonesia, and Malaysia, and it has a high potential for both bioethanol and biodiesel [10]. Thailand was the first country in Asia to regulate its national policies [11,12]. In 2000 and 2001, the Thai government signed cabinet resolutions (an official decision made by a group of government ministers who make and approve government policy) to promote the biofuel industry. The government set the goal for renewable energy to be at least 8% of total energy consumption by 2011, of which 1.9% was targeted to be from biofuel [13]. In addition, Thailand has well-organized funding (subsidies) programs that can work as examples for other biofuel producer countries. It is necessary to focus on renewable energy for economic growth, since Thailand heavily relies on energy imports [14]. As one of the biggest biofuel producers in Southeast Asia, the Thai government actively promotes the domestic production of biofuels. As a result, farmers’ incomes have increased by producing biofuels of higher market value than conventional agricultural products [15].
Most current biofuel production, however, is based on first-generation biomass, such as corn, sugarcane, cassava, palm oil, and soybean [16]. This causes increases in the price of grain, which is a food resource. First-generation biomass, in terms of food depletion in the future, is therefore less desirable as a source of energy. The amount of GHG that is emitted from production of raw materials for biofuels has a negative effect on the environment. Furthermore, there are other challenges to overcome in this sector, such as oil price fluctuation with different stakeholders, various risks, related government policy, infrastructure development, and the cooperation of private agencies and institutions [17,18].
To overcome the drawbacks of first-generation biofuels, non-food crops such as cellulosic biomass (second-generation biomass) should be utilized as energy crops. This will be an effective way to use agricultural residues such as straw and bagasse from various fruits and grains. There is a need to estimate the potential regarding the barriers to increased biofuel production from second-generation biomass. To support this industry, tax incentives, national targets, promotions, and Research and Development (R&D) may be needed to convert from a first-generation system to a second-generation system.
1.2. Goal and Scope of This Study
Technological improvements and market status changes, however, have produced many new opportunities and challenges over recent years. The feasibility of commercializing biofuels in Thailand therefore needs to be updated [19]. Looking over various programs in the biofuel sector to analyze the overall status of planning instruments before estimating the biofuel potential in Thailand will be essential. This will help deliver more comprehensive and informative results.
In this paper, three scenarios were selected to measure the future potential of biofuels by applying various extraction rates. This assessment is crucial for the following reasons: (1) it will present the expected amounts of GHG reduction, and the economic benefits to be achieved by calculating the actual production of second-generation biofuels; (2) it will motivate the Thai government and biofuel suppliers to develop second-generation biofuels; (3) it will help to utilize the residues (second-generation biomass) from first-generation biomass more efficiently. In addition, this study will assist in the development of relevant policy incentives and regulations for this country, as they can expect second-generation biofuel production at any extraction rate.
This study aims to reduce the gap between past and current status, and to provide a comprehensive view on biofuel development in Thailand. Aspects of policy instruments (planning instruments) are covered, to understand the overall status of the biofuel industry in Thailand. This paper also investigates and quantifies the potential availability of agricultural residues in Thailand. It measures the cellulosic ethanol technical process and Fischer–Tropsch diesel from those residues. The cellulosic ethanol technical process requires a pretreatment step to break down the cellulosic material into sugars, which is an additional step compared to the typical ethanol process. The Fischer–Tropsch (the BTL process, Biomass-to-Liquids, a multi-step process to produce liquid biofuels from biomass) is a chemical reaction that converts a mixture of carbon monoxide and hydrogen into liquid hydrocarbons. It comprises the gasification of biomass feedstock, cleaning, and conditioning of the produced synthesis gas, and its subsequent synthesis to liquid biodiesel [1]. Based on the production of potential, it is divided into two categories, the environmental view and the economic view.
This paper describes the current status of biofuel production and consumption in Thailand, and the research design for this study, in the next two sections. Subsequently, the planning instruments and the future potential of second-generation biofuel production are discussed.
2. Contextual Background
2.1. Biofuel Production Trends in Thailand
Thailand began bioethanol production in 2003, using sugarcane molasses and cassava starch as feedstock. Molasses, a product from sugarcane refinement, holds the largest share (60%), followed by cassava (35%) and sugarcane (5%). In the case of biodiesel feedstock, CPO (crude palm oil) or RBDPO (refined bleached deodorized palm oil) (70%) have the largest rate of usage, followed by palm stearin (22%) and FFA (free fatty acids) (8%) [20].
Table 1 lists the number of bio-refineries and the nameplate capacity of both bioethanol and biodiesel [20]. The number of bioethanol plants more than doubled between 2009 and 2018. The number of biodiesel plants, however, remained almost the same during this time period. The number of bio-refineries for bioethanol has increased while that of biodiesel has remained constant.

Table 1.
Number of registered biofuel plants in Thailand.
The nameplate capacity of bioethanol increased to 1815 million liters in 2018 from 581 million liters in 2009 (Table 1). There was a sharp increase between 2012 and 2013, from 977 million liters to 1307 million liters. However, these increases of nameplate capacity have not been realized, in the case of biodiesel. The nameplate capacity of biodiesel was reduced by 570 million liters between 2012 and 2014, but this increased again in 2015.
Figure 1 shows biofuel production and market penetration over the past decade in Thailand [20]. It has increased over the years, except in 2012 for bioethanol and in 2011 for biodiesel. The production of bioethanol in 2013, however, rapidly increased to 1048 million liters from 790 million liters. In the case of biodiesel, the production also sharply increased to 910 million liters in 2012, from 630 million liters in 2011. Biodiesel production was lower than that of bioethanol until 2012, but the production of both has increased since 2013, and they were estimated to be at almost the same levels of production in 2018 (1500 million liters for bioethanol and 1480 million liters for biodiesel). Regarding the status of market penetration, almost all of the biofuel produced was used, while only half or less of the biodiesel produced was used. For example, almost all of the production of bioethanol was used for on-road transportation; on the other hand, biodiesel used only 60% out of the total. Agriculture (20%), industry (17%), and inland shipping (3%) accounted for the rest. This is because the most common vehicles in Thailand are motorcycles, which use gasoline as fuel, rather than cars (including SUVs), which use diesel [21].
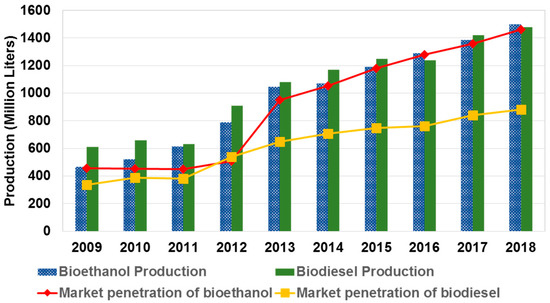
Figure 1.
Biofuel production in Thailand since past decade. Source: GAIN [17], Department of Alternative Energy Development and Efficiency, Ministry of Energy [20]. Note: The data for 2017, 2018 is an estimate. Source: GAIN, 2017.
2.2. Biofuel Consumption in Thailand
The demand for bioethanol and biodiesel increased to replace oil imports after the energy crisis in 2008, as crude oil prices rose to above 140 USD/barrel during this time(the standard units of volume are as follows: 1 barrel (oil) = 42 US gallons = 159 L) in Thailand, [22]. Subsequently, ethanol use increased from 1.3 million liters/day in 2012, to 2 million liters/day in 2013 [17]. Table 2 presents the level of biofuel consumption from 2009 to 2018. The consumption of both bioethanol and biodiesel has increased in Thailand. The consumption of bioethanol, however, had a sharp increase between 2012 and 2013. Finally, the consumption of bioethanol and biodiesel increased by 3.19% in 2018, compared to 2.41% in 2009, respectively. Through these data, it can be seen that Thailand has great market potential for the biofuel industry. A discussion on the potential of biofuel supply in this country is of vital importance for planning within the biofuel industry.
Table 2.
Biofuel consumption in Thailand.
2.3. Producer Price Comparison between First- and Second-Generation Biomass in Thailand
First-generation biofuel is also called food crop- or food source-based biofuel. It is typically derived from sources such as starch, sugar, vegetative oil, and animal fats. Compared to conventional gasoline and diesel, it has lower CO2 emissions, because of the property of being carbon neutral [6]. In addition, first-generation biofuels can utilize a wide range of materials, use less harmful carbons (such as carbon monoxide and tetrahydrocannabinol), and significantly reduce the amount of particulate matter (PM) emissions (which affect air pollution).
However, first-generation biomass biofuels are more expensive to produce than fossil fuels [23] and they conflict with food supplies. They are less suitable for use in low temperatures (for example, palm oil solidifies below 24 °C). Furthermore, because they are food crop-based, there is high variability in the prices of first-generation biomass biofuels.
Figure 2 describes the price variation of rice (first-generation biomass) and rice straw (second-generation biomass) at the maximum and minimum costs, during 2011 and 2016. The maximum price of rice was 335 USD in 2011 and the lowest price was 228 USD in 2016. On the other hand, rice straw has a low fluctuation in price. The maximum price of rice straw was about 35 USD/tonne, and the minimum price was about 20 USD/tonne. Unlike rice prices, which can differ by about 110 USD/tonne, rice straw has a difference of about 20 USD/tonne. It is also much less expensive than crop rice.
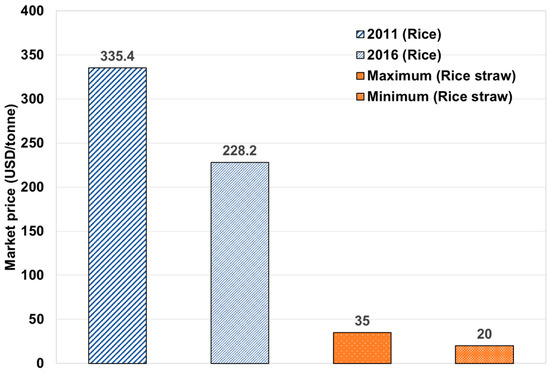
Figure 2.
Producer prices of rice and rice straw in Thailand. Source: FAOSTAT [24].
3. Research Design
In this section, planning instruments and three scenarios were collected and analyzed regarding biofuel status and their future potential in Thailand. The estimation of potential is one aspect of a planning instrument. In other words, well-organized plans will support biofuel development. Using planning instruments, the biofuel industry can be investigated from various aspects, such as the goal of renewable energy utilization and the R&D status of biofuels. This information makes the results of potential estimation more informative and predictive of overall biofuel status in Thailand.
3.1. Policy Instruments
There are four types of policy instruments: (1) economic instruments, (2) regulatory instruments, (3) planning instruments, and (4) informational instruments. Economic instruments include subsidies, funds, taxes, and grants. Regulatory instruments include regulations, decisions, laws, and orders. Planning instruments include national plans, programs, actions, strategies, and roadmaps. Last but not least, informational instruments include forums, training, conferences, workshops, and exhibitions. However, only planning instruments are collected and analyzed in this study.
This tool will make the evaluation of policies that are related to the biofuel industry in Thailand more effective. Prior to identifying the potential of second-generation biofuels in the next chapter, it is crucial to organize various programs and strategies.
3.2. Scenario Construction
In this study, three scenarios to investigate the potential of second-generation biofuels were assumed (Figure 3). These scenarios are based on different rates of residue extraction. Herein, the extraction rate refers to the remaining percentage after the exclusion of the portion, which may be used for other purposes, such as ecosystem function, nutrient recycling, and animal feed, because it is practically impossible to utilize 100% of the predicted production [25]. Scenario 1 assumes an extraction rate of 20%, scenario 2 is set at 44%, and scenario 3 is set at 66%. Scenario 1 follows other previous studies [14,25] set at a 20% extraction rate, where these studies are reported in OECD/IEA [3] for sustainable extraction. According to Helwig [26] and Lal [27], the sustainable extraction rates, however, are from residues that are affected by factors, such as the type of soil and fertility, land slope, tillage and crop yield. In addition, studies in Quebec, Canada showed that sustainable extraction rates were between 44 and 64% [25,26]. These rates are applied to scenario 2 and 3, respectively. Each extraction rate from agricultural residues, however, is a reasonable average for bioenergy applications [25].
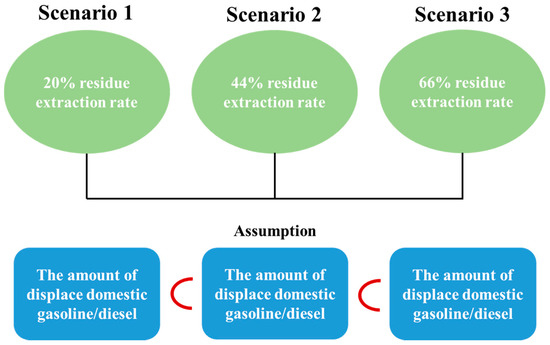
Figure 3.
Summary of scenario 1, 2, and 3.
4. Policy Instruments
Planning Instruments
The Ministry of Energy in Thailand is focusing on the development of alternative energy and renewable energy sources to secure new energy resources, and it provides inexpensive energy to the citizens of Thailand [28]. The current national energy plan is the TIEB (Thailand Integrated Energy Blueprint). It reflects the goals of the National Economic and Social Development Plan between 2015 and 2036 [17]. TIEB includes the following six master plans (Figure 4): (1) the Alternative Energy Development Plan (AEDP), (2) the Power Development Plan (PDP), (3) the Energy Efficiency Development Plan (EEDP), (4) the Oil Development Plan (ODP), (5) the Gas Development Plan (GDP), and (6) REDP (Renewable Energy Development Plan). The TIEB considers both domestic and international situations. In addition, it formed the basis for Thailand’s commitments at the 2015 United Nations Climate Change Conference (COP 21, Conference of the Parties 21 held in Paris, France). Specifically, the AEDP and REDP concern biofuel regulation. The AEDP projects biofuel increases from 7% of total fuel energy use in 2015 to 25% in 2036. The REDP has more detailed goals for the biofuel sector. It has a production goal of 9.0 million liters per day for bioethanol, and 7.20 million liters per day for biodiesel by 2021.
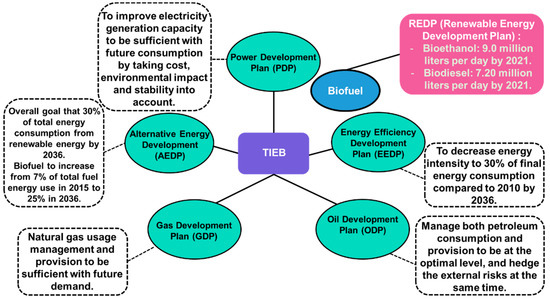
Figure 4.
Summary of TIEB’s and REDP Objectives. Source: Ministry of Energy, 2016 [17]; IRENA, 2018 [12].
As a result of the TIEB 2015, the AEDP (2012–2021), which aimed to increase the share of renewable and alternative energy from 20 to 25% by 2021, was replaced with a new AEDP (2015–2036). While both AEDP 2012 and AEDP 2015 target national energy security and domestic economic development rather than environmental protection, the revised AEDP 2015 extends coverage from 10 years to 20 years, and integrates all national energy plans [20].
The production of bioethanol in Thailand increased steadily over the past decade, but the actual scale, however, is far lower than expected. This is mostly due to the price variability of feedstock for producing biofuels. The production cost of biofuels mainly consists of the feedstock cost, facility depreciation cost, operation cost, and labor cost [29]. This means that first-generation biomass has a high variability in market prices (Figure 1). It is difficult to predict the fluctuation in price each year, because of variables such as natural factors, weather, supply and demand problems, and energy security issues. These reasons are why second-generation biofuels should be developed and gradually substituted for first-generation biofuel.
Second-generation biomass, which has less variability in price than first-generation biomass, because it consists of residues from agriculture and forestry, has been investigated regarding the converting process to liquid biofuel. Currently, there are five institutions researching second-generation biofuel in Thailand. The National Science and Technology Development Agency (NSTDA), Thailand Institute of Scientific and Technological Research (TISTR), King Mongkut’s University of Technology North Bangkok (KMUTNB), Chulalongkorn University (CU), and the National Metal and Materials Technology Center (MTEC) have been working mainly on R&D [17]. According to the Ministry of Energy of Thailand, these five institutions have carried out basic research on biofuel production technology, the maintenance of the research environment, and support for the development of the country’s biofuel industry, and they play an important role in biofuel technology development in Thailand. In addition, TISTR promotes both basic and applied research on bio-sciences, materials, energy, and the environment for independent work. NSTDA provides expertise on catalyst technology, and KMUTNB supports the biofuel industry, and offers expertise on bio-oil reforming technology.
Much of this research, however, is in the initial stages, and is not ready for commercialization, while first-generation biofuel has been mastered for converting feedstock to liquid biofuel. Infrastructure and technology for second- and third-generation biofuels are still lacking [30,31]. In general, related technology processes have a high-capability cost and are less energy-efficient. To overcome this, additional development of new infrastructure for harvesting, transporting, storing, and refining second- and third-generation biofuel for commercialization in Thailand is needed [14].
Global cooperative efforts are significant for converting biofuels into the current energy system. Technology innovation related to biofuel production and optimization are necessary [32]. Additionally, the monitoring of large-scale demonstration programs, and investments into research on second-generation biofuels will be needed. This will help with developing sustainable management in the transportation sector [33].
5. Results and Discussion
5.1. Production Potential
The development of second-generation biofuel technologies has made no progress in commercialization in Thailand [34]. This technology, however, is crucial for the sustainable development of biofuels for future generations. It is produced through the fermentation of sugars derived from the cellulose and hemicellulose fractions of lignocellulosic biomass.
The potential of second-generation biofuels in Thailand is estimated in Table 3, Table 4, Table 5 and Table 6. This is an updated and modified version, originally found in Kumar’s study [14] in which the raw data on crop production is from 2011. The raw data on crop production in this study, however, is from 2016, and wheat as a feedstock was not considered, because of its significantly low production compared with other crops. In addition, data such as the heating value of each type of bioethanol and biodiesel, and the conversion value has been changed from J (Joule) to tons of oil equivalent (toe).
Table 3.
Estimated production by types of residues in Thailand.
Table 4.
Estimated extraction residues production under each scenario condition.
Table 5.
Estimated potential of second generation biofuel in Thailand by scenarios.
Table 6.
Estimated biofuel potential in relation to Thai transportation fuel consumption.
We estimated the potential of agricultural residues from the following crops and forestry materials: maize (Zea mays), rice (Oryza sativa), sugarcane (Saccharum officinarum), sorghum (Sorghum bicolor), coffee (Coffea arabica) and coconut (Cocos nucifera) (Table 3). These crops contribute to either bio-electricity or transport fuel. We also considered the technical potential for biofuel production of enzymatic hydrolysis and fermentation for bioethanol and thermochemical syngas to Fischer–Tropsch diesel for biodiesel [14]. The potential biofuel production is approximately 9.08 million dry tonnes per year in scenario 1, 20.0 million dry tonnes per year in scenario 2, and 30.0 million dry tonnes per year in scenario 3 (Table 4).
Our estimates indicate that the production potential per year from agricultural residues were in the range of 1.0–2.70 billion liters per year for bioethanol, and 0.68–1.82 billion liters per year for biodiesel in scenario 1 (Table 5). We estimated around 2.2–5.99 billion liters per year for bioethanol and 1.5–4.0 billion liters per year for biodiesel in scenario 2. Under scenario 3, estimates were 3.30–8.99 billion liters per year for bioethanol and 2.25–5.99 billion liters per year for biodiesel. The conversion factors used are from Sims’s study [34]. In addition, these estimated values are comparable to Kumar’s study, with a potential of 1.14–3.12 billion liters per year, and 0.8–2.1 billion liters per year for bioethanol and biodiesel, respectively (based on a 20% residue extraction rate). This is because this study utilizes the latest data from 2017, while Kumar’s study used data from 2011 on gasoline consumption in Thailand. In addition, Kumar’s study only used the data for 100% gasoline, while in this study, the gasoline proportion of gasohol, excluding the ethanol proportion, was applied to the amount of gasoline, based on the statistics from the Ministry of Energy in Thailand [35,36].
Table 6 describes the estimated biofuel potential in relation to Thailand’s transportation fuel consumption. The results show that the estimated production of second-generation bioethanol can possibly displace 7.19–19.62% of gasoline in Thailand in scenario 1. This was compared with the 2017 domestic gasoline consumption, and the estimated 1.0–2.7 billion liters of ethanol per year is equivalent to 0.51 × 10⁶–1.38 × 10⁶ toe. For scenario 2, 15.83–43.17% of gasoline in Thailand could be displaced, which is equivalent to 1.11 × 10⁶–3.03 × 10⁶ toe. In addition, this result was estimated, where 23.74–64.75%, equivalent to 1.67 × 10⁶–4.55 × 10⁶ toe, could be displaced in scenario 3. This includes both the consumption of 100% gasoline and the gasoline proportion of gasohol. For example, Thailand currently uses 10, 20, and 85% ethanol blended with gasoline, and the concentrations of 90, 80, and 15% gasoline were used for the calculations, respectively.
Scenario 1 shows that 4.07–10.86% of the domestic diesel consumption in Thailand can be potentially offset. This estimated biodiesel per year is equivalent to 0.56 × 10⁶–1.50 × 10⁶ toe, and is compared with 2017 national diesel consumption. Under scenario 2, 1.23 × 10⁶–3.29 × 10⁶ toe was estimated, possibly offsetting the national diesel consumption by 8.96–23.89%. Scenario 3 estimated 1.85 × 10⁶–4.94 × 10⁶ toe, which could potentially displace 13.44–35.84% of national diesel consumption. As a result, when the extraction rate is higher, the reduction ratio of GHG emissions will decrease as the estimated production of biofuels increases.
In the next section, environmental potentials and economic potentials in Thailand are analyzed, based on the production potential of second-generation biofuels that are discussed in this section.
5.2. Environmental Potential
As a result of the production potentials in the previous section (Section 5.1), scenario 1 shows that 7.2–19.6% (based on biochemical processes) and 4.1–10.9% (based on the Fischer–Tropsch process) of national gasoline and diesel consumption in Thailand, respectively, can be possibly offset. Scenario 2 shows that 15.8–43.2% and 9.0–23.9% for gasoline and diesel, respectively, can be offset, and 23.7–64.8% and 13.4–35.8% can be displaced in scenario 3. In this section, the GHG emissions of each scenario are projected, based on the production potential estimates.
According to Balat [7], the GHG emissions from second-generation bioethanol are about one-tenth (1/10) that of gasoline (Figure 5). Further, second-generation biodiesel has a 60–90% GHG reduction, compared to first-generation biodiesel [8]. An average value of 75% was applied in this study. As a result, a decrease of 1.3–3.5 (a-c–b-d) megatons of CO2 in the gasoline sector and 1.4–3.8 (a’-c’–b’-d’) mega tons of CO2 in the diesel sector were estimated in scenario 1. In scenario 2, 2.8–7.7 (a-c–b-d) megatons of CO2, and 3.2–8.4 (a’-c’–b’-d’) megatons of CO2 for the gasoline and diesel sectors, respectively, were estimated. Finally, scenario 3 estimated that 4.2–11.6 (a-c–b-d) megatons of CO2 in the gasoline sector, and 4.7–12.6 (a’-c’–b’-d’) megatons of CO2 in the diesel sector would be reduced.
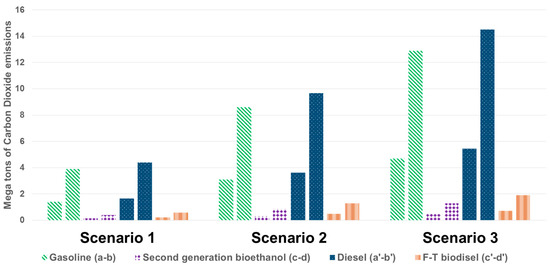
Figure 5.
A comparison of scenarios 1, 2, and 3 and the reduced amounts CO2 emissions in the gasoline and diesel sectors by scenarios. Note: (a, b)—Possible amounts could be offset with bioethanol, original gasoline emission; (c, d)—Second-generation bioethanol emissions displaced by gasoline (Table 6); Carbon dioxide emission calculator—United States Environmental Protection Agency (EPA); (a’, b’) [37] Possible amounts could be offset with biodiesel, original diesel emission; (c’, d’)—Fischer–Tropsch Biodiesel emissions displaced by diesel (Table 6); Carbon dioxide emission calculator—New Zealand Energy Efficiency and Conservation Authority (EECA) [38].
5.3. Economic Potential
In this section, economic profits were estimated, based on the decreased quantities of CO2 emissions established in the previous section (Section 5.2). These results should be considered when developing an emissions trading policy, which is a market-based approach to controlling pollution by providing economic incentives for achieving reductions in pollution emissions. For instance, companies can sell and buy unused permits from other companies. A company which exceeds their CO2 emissions may buy permits from another company which has leftover CO2 emission allowances for sale.
Expected profit gains were as follows (Table 7): 27–74 million USD for the bioethanol sector and 30–81 million USD for the biodiesel sector in scenario 1; 60–163 million USD for the bioethanol sector and 67–178 million USD for the biodiesel sector in scenario 2; 90–244 million USD for the bioethanol sector and 100–267 million USD for the biodiesel sector in scenario 3. This will provide a huge contribution to Thailand’s economy, considering that the GDP per capita in Thailand is about 6593 USD (based on 2017).
Table 7.
Economic effects on emissions trading by scenarios.
6. Conclusions
Thailand is a country with great potential for growing its biofuel industry. There are various programs for developing biofuel in Thailand that can cope with environmental issues. The TIEB aims to regulate the goals of the renewable energy sector, gas and oil, etc. The REDP especially sets goals for biofuel production based on first-generation biomass. For second-generation biofuels development, five institutions are conducting research with catalyst technologies, and supporting the biofuel industry. As outlined here, second-generation biomass potentials under three scenarios with different extraction rates—scenario 1 (20%), scenario 2 (44%), and scenario 3 (66%)—could possibly offset the national consumption of gasoline and diesel. In summary, energy diversification such as fuel production from agricultural residues will continue to bring both environmental and economic benefits to the country.
In conclusion, second-generation biofuels in Thailand is expected to need the cooperation of other agencies as well as subsidies from the Thai government. Monitoring for large-scale demonstration programs and investments will also be needed. These could help achieve the goal of sustainable management in the transportation sector. It is crucial to have strong motivation and public awareness towards utilizing biofuels for larger groups of the population, for environmental conservation and the development of new energy sources. Therefore, biofuels from agricultural residues are a vital factor in meeting these goals. Further research is needed to estimate the biofuel potential of energetic efficiency that can be expressed as the ratio of energy that is obtained from some amount of fuel that is produced for energy resources in Thailand. This research focused on the biofuel potential of environmental impact. Also, the pre-treatment process to convert residues to biofuel should be investigated. Despite these challenges, this study has filled in some data gaps in the current plans, and strategies for biofuel utilization by types of programs and specified the potential availability of agricultural residues for liquid biofuel applications in Thailand. Through these efforts, the goal of sustainability in the transportation sector can be achieved with the diversification of agricultural residue. These plans will assist to break down existing barriers to second-generation biofuels, and provide considerably more investment in R&D in this sector.
Author Contributions
S.H. and J.W.C. conceived and designed the research and S.H. performed the data collection and analysis and proofread the manuscript.
Funding
This research was funded by Korea Forest Service (Project No. 2017052A00-1720-BB02).
Acknowledgments
This research was supported by the Korea Forest Service (Korea Forest Promotion Institute) through ‘R&D Program for Korea Science Technology (Project No. 2017052A00-1720-BB02)’.
Conflicts of Interest
The authors declare no conflict of interest.
References
- Lappas, A.; Heracleous, E. 18-Production of biofuels via Fischer-Tropsch Synthesis: Biomass-to-liquids. In Handbook of Biofuels Production: Processes and Technologies, 2nd ed.; Elsevier Science: Amsterdam, The Netherlands, 2016; pp. 549–593. [Google Scholar]
- Dulal, H.B.; Brodnig, G.; Onoriose, C.G. Climate change mitigation in the transport sector through urban planning: A review. Habitat Int. 2011, 35, 494–500. [Google Scholar] [CrossRef]
- OECD; IEA. Sustainable Production of Second-Generation Biofuels: Potential and Perspectives in Major Economies and Developing Countries; International Energy Agency: Paris, France, 2010; pp. 1–221. [Google Scholar]
- Landry, J.S.; Matthews, H.D. Non-deforestation fire vs. fossil fuel combustion: The source of CO2 emissions affects the global carbon cycle and climate responses. Biogeosciences (BG) 2016, 13, 2137–2149. [Google Scholar] [CrossRef]
- Elum, Z.A.; Momodu, A.S. Climate change mitigation and renewable energy for sustainable development in Nigeria: A discourse approach. Renew. Sustain. Energy Rev. 2017, 76, 72–80. [Google Scholar] [CrossRef]
- Bessou, C.; Ferchaud, F.; Gabrielle, B.; Mary, B. Biofuels, Greenhouse Gases and Climate Change: A Review; HAL: Bengaluru, India, 2011; pp. 1–80. [Google Scholar]
- Balat, M. Production of bioethanol from lignocellulosic materials via the biochemical pathway: A review. Energy Convers. Manag. 2011, 52, 858–875. [Google Scholar] [CrossRef]
- Börjesson, P.; Lundgren, J.; Ahlgren, S.; Nyström, I. Dagens Och Framtidens Hållbara Biodrivmedel; The Swedish Knowledge Centre for Renewable Transportation Fuels: Göteborg, Sweden, 2013; f3 2013:13:1-209. [Google Scholar]
- Ben-Iwo, J.; Manovic, V.; Longhurst, P. Biomass resources and biofuels potential for the production of transportation fuels in Nigeria. Renew. Sustain. Energy Rev. 2016, 63, 172–192. [Google Scholar] [CrossRef]
- IEA. World Energy Outlook; International Energy Agency: Paris, France, 2013; pp. 1–708. [Google Scholar]
- IRENA. Renewable Energy and Kobs Annual Reveiw 2017; International Renewable Energy Agency: Abu Dhabi, UAE, 2017. [Google Scholar]
- IRENA. Renewable Energy Market Analysis: Southeast Asia; International Renewable Energy Agency: Abu Dhabi, UAE, 2018. [Google Scholar]
- Bloyd, C. Thailand Alternative Fuels Update; PNNL-26916; Department of Energy, US: Washington, DC, USA, 2017.
- Kumar, S.; Salam, P.; Shrestha, P.; Ackom, E. An Assessment of Thailand’s Biofuel Development. Sustainability 2013, 5, 1577–1597. [Google Scholar] [CrossRef]
- Chanthawong, A.; Dhakal, S. Liquid Biofuels Development in Southeast Asian Countries: An Analysis of Market, Policies and Challenges. Waste Biomass Valoriz. 2015, 7, 157–173. [Google Scholar] [CrossRef]
- UNCTAD. The State of the Biofuels Market: Regulatory, Trade, and Development Perspectives; United Nations Conference on Trade and Development: Geneva, Switzerland, 2014; pp. 1–101. [Google Scholar]
- Ministry of Energy (Thailand). Thailand Energy Outlook 2016: The Futre of Thailand’s Energy Sector; Policy and Stretegy Management Office, Office of the Permanent Secretary, Ministry of Energy: Bangkok, Thailand, 2016.
- Gadonneix, P.; de Castro, F.B.; de Medeiros, N.F.; Drouin, R.; Jain, C.P.; Kim, Y.D.; Ferioli, J.; Nadeau, M.J.; Sambo, A.; Teyssen, J.; et al. Biofuels: Policies, Standards and Technologies; World Energy Council: London, UK, 2010; pp. 1–152. [Google Scholar]
- Yamaguchi, K. Study on Asian Potential of Biofuel Market. Econ. Res. Inst. ASEAN East Asia 2014, 20, 1–231. [Google Scholar]
- GAIN. Global Agricultural Information Network: Thailand Biofuels Annual; TH7084; USDA Foreign Agricultural Service: Washington, DC, USA, 2017.
- ASEAN_UP. Thailand Automotive Industry Overview: Market Analysis. 2019. Available online: https://aseanup.com/thailand-automotive-industry-overview/ (accessed on 24 January 2018).
- Sakulsuraekkapong, J.; Thepa, S.; Pairintra, R. Improvement of biodiesel’s policy in Thailand. Energy Sour. Part B Econ. Plan. Policy 2018, 13, 158–164. [Google Scholar] [CrossRef]
- Viesturs, D.; Melece, L. Advantages and disadvantages of biofuels: Observations in Latvia; Engineering for Rural Development: Jelgava, Latvia, 2014; pp. 210–215. [Google Scholar]
- FAOSTAT. 2017. Available online: http://www.fao.org/faostat/en/#data/QC (accessed on 18 January 2019).
- Ackom, E.K.; Alemagi, D.; Ackom, N.B.; Minang, P.A.; Tchoundjeu, Z. Modern bioenergy from agricultural and forestry residues in Cameroon: Potential, challenges and the way forward. Energy Policy 2013, 63, 101–113. [Google Scholar] [CrossRef]
- Helwig, T.; Jannasch, R.; Samson, R.; DeMaio, A.; Caumartin, D. Agricultural Biomass Residue Inventories and Conversion System for Energy Production in Eastern Canada; Resource Efficient Agricultural Production (REAP): Ste-Anne-de-Bellevue, QC, Canada, 2002; pp. 1–70. [Google Scholar]
- Lal, R. Crop residues as soil amendments and feedstock for bioethanol production. Waste Manag. 2008, 28, 747–758. [Google Scholar] [CrossRef] [PubMed]
- Heo, S.; Choi, J. Biofuel Utilization and Implications in ASEAN Based on Case Analysis of Developed Countries. Korean Wood Sci. Technol. 2018, 46, 577–596. [Google Scholar]
- Hao, H.; Liu, Z.; Zhao, F.; Ren, J.; Chang, S.; Rong, K.; Du, J. Biofuel for vehicle use in China: Current status, future potential and policy implications. Renew. Sustain. Energy Rev. 2018, 82, 645–653. [Google Scholar] [CrossRef]
- Dhyani, V.; Singh, A.; Chaurasia, S.P. A Review on Microalgae Based Biofuels. Int. J. Sci. Eng. Res. 2015, 3, 1–22. [Google Scholar]
- Leong, W.H.; Lim, J.W.; Lam, M.K.; Uemura, Y.; Ho, Y.C. Third generation biofuels: A nutritional perspective in enhancing microbial lipid production. Renew. Sustain. Energy Rev. 2018, 91, 950–961. [Google Scholar] [CrossRef]
- Rodionova, M.V.; Poudyal, R.S.; Tiwari, I.; Voloshin, R.A.; Zharmukhamedov, S.K.; Nam, H.G.; Zayadan, B.K.; Bruce, B.D.; Hou, H.J.M.; et al. Biofuel production: Challenges and opportunities. Int. J. Hydrog. Energy 2017, 42, 8450–8461. [Google Scholar] [CrossRef]
- Patumsawad, S. 2nd Generation Biofuels: Technical Challenge and R&D Opportunity in Thailand. J. Sustain. Energy Environ. Spec. Issue 2011, 1, 47–50. [Google Scholar]
- Sims, R.E.; Mabee, W.; Saddler, J.N.; Taylor, M. An overview of second generation biofuel technologies. Bioresour. Technol. 2010, 101, 1570–1580. [Google Scholar] [CrossRef] [PubMed]
- Ministry_of_Energy’s Webpage (Thailand). 2018. Available online: http://www.eppo.go.th/index.php/en/en-energystatistics/petroleum-statistic?orders[publishUp]=publishUp&issearch=1 (accessed on 31 December 2017).
- OECD; IEA. World Energy Statistics; International Energy Agency: Paris, France, 2017. [Google Scholar]
- EPA (United States Environmental Protection Agency), Greenhouse Gas Equivalencies Calculator. Available online: https://www.epa.gov/energy/greenhouse-gas-equivalencies-calculator (accessed on 28 December 2018).
- EECA Business. CO2 Emission Calculator. Available online: https://www.eecabusiness.govt.nz/tools/wood-energy-calculators/co2-emission-calculator/ (accessed on 28 December 2018).


© 2019 by the authors. Licensee MDPI, Basel, Switzerland. This article is an open access article distributed under the terms and conditions of the Creative Commons Attribution (CC BY) license (http://creativecommons.org/licenses/by/4.0/).