Abstract
An understanding of changes in forest cover and the drivers of forest transition (FT) contributes to the sustainable management of global forests. In this paper, we used the latest global land cover data published by the European Space Agency (ESA) to investigate spatiotemporal variation characteristics of forest cover in developing countries from 1992 to 2015, and then analyzed causal factors of this variation using a binary logistic regression model. Existing studies on FT are mostly based on data from the Food and Agriculture Organization (FAO); this study improves our understanding of FT mechanisms through the use of a new dataset. The results indicate that the forest area in developing countries decreased from 21.8 to 21.3 million km2 from 1992–2015, and the rate of decline slowed after 2004. South America suffered the largest reduction in forest area (505,100 km2), whereas forest area in Africa increased slightly. By 2015, more than 80% of African countries had experienced FT, whereas only half of developing countries experienced forest expansion in South America. The variables affecting FT occurrence differed among continents. On the global scale, the remaining forest coverage and the proportion of forest exports negatively affected the likelihood of FT occurrence, whereas urbanization level had a positive effect.
1. Introduction
Global forest change is a public concern [1,2,3,4,5,6] because humans are heavily reliant on forests. On one hand, forests provide forest products [7] including food, medicine, fodder for livestock, fuel, and shelter [8]. The livelihoods of 1.6 billion rural people are estimated to depend on forests [9]. On the other hand, the ecological services provided by forests can solve some environmental problems [10,11]. For example, forests can reduce soil erosion and improve water quality by regulating the hydrological cycle [12,13], ameliorate climate change by increasing carbon sequestration [14], and protect biodiversity [15]. Forest recovery after severe deforestation first occurred in European countries in the 18th century [16,17] and later in North America. In recent years, forest cover has begun to increase in many developing countries [18,19,20]. This increasing trend in forest cover led Mather to coin the term “forest transition” (FT), which refers to the process of moving from a reduction to an expansion in forest area within a certain country or region [17].
Since the introduction of the term FT [17], many researchers have studied this process and its underlying causes. In European countries, economic development and forest scarcity are regarded as two pathways of FT. Economic development and urbanization reduced the conversion of forest lands, and forest loss during agricultural expansion caused a countervailing trend [10]. Later, several theories supplemented the theoretical framework and proposed other FT pathways, such as government policies [20,21], globalization [22,23,24], and smallholder tree farming based on land use identification [25]. Many studies on FT have been carried out on subnational [26], national [27,28,29] and multinational [19,30] scales; however, global-scale studies on FT are lacking.
To obtain an understanding of global FT conditions, consistent data of annual forest cover are needed. Many studies have used forest resource assessment (FRA) data from the Food and Agriculture Organization (FAO) to investigate FT [10,22,31], since these data provide the annual forest area. The quality of FRA2015 data has improved as more countries have added remote sensing data to supplement the standard data sources [10]. However, FRA data still suffer from some problems, including uneven data quality and differences in forest definitions among countries [32]. While other recent forest cover datasets have high spatial resolution, they only provide forest cover data for certain years. For example, the GlobeLand30 land cover dataset [33,34] has a spatial resolution of 30 m and contains two baseline years (2000 and 2010). The Global Land Cover Facility (GLCF) [35], which has a spatial resolution of 30 m, covers 1990, 2000, and 2005. The Global Forest Watch (GFW) dataset developed by Hansen [36] has a resolution of 30 m and includes only annual gross loss of forest cover for 2000–2012. In 2017, the European Space Agency (ESA) released global annual land cover data from 1992–2015, including data for the entire surface of the Earth at a spatial resolution of 300 m [37]. This dataset provides continuous, consistent, and long-term series data on global land cover during the last two decades, presenting a unique opportunity for exploring FT.
The primary objective of this study was to use the ESA dataset to provide a global view of forest cover change, FT status, and their drivers. Because the ESA dataset only covers 1992–2015, developed countries were excluded from the analysis because these countries experienced FT much earlier [10,38].
The objectives are summarized as follows:
- Analyze the spatial and temporal variations in forest cover between 1992 and 2015 in developing countries on the global, continental, and country scales; and
- Determine the driving factors for FT occurrence based on the binary logistic model.
2. Materials and Methods
2.1. Data
2.1.1. Developing Countries
In this paper, the term “developing countries” refers to developing economies from the classification results of the countries in the World Economic Situation and Prospects (WESP), which was compiled by the Development Policy and Analysis Division, Department of Economic and Social Affairs, United Nations Secretariat (UN/DESA) (https://www.un.org/development/desa/dpad/publication/world-economic-situation-and-prospects-2014/). To rule out accidental factors, countries with forest coverage below 3% were excluded. The 78 developing countries are listed in Table A1 in the Appendix A.
2.1.2. Forest Cover
ESA recently published the Climate Change Initiative Land Cover version 2 (CCI LC v2) dataset, an annual global land cover dataset that provides data from 1992 to 2015 at a spatial resolution of 300 m (http://maps.elie.ucl.ac.be/CCI/viewer/). The data in CCI LC v2 include advanced very high-resolution radiometer (AVHRR) data collected by National Oceanic and Atmospheric Administration (NOAA) between 1992 and 1999, Satellite for observation of Earth-Vegetation (SPOT-VGT) data collected by the National Centre for Space Studies (CNES) between 1999 and 2013, and medium resolution imaging spectrometer (MERIS) and project for on-board autonomy–vegetation (PROBA-V) data collected by ESA between 2003 and 2015. The forests represented in the CCI LC v2 dataset include eight types of vegetation (Table A2). According to the data evaluation and verification definitions proposed by the Working Group for Calibration and Verification from the Committee of Earth Observation Satellites, the overall accuracy of the dataset is approximately 75.4%, and the accuracy of the forests in CCI LC v2 is higher than 75.7% [39].
2.1.3. Other Data
The urbanization level and GDP per capita for the studied countries between 1992 and 2015 were derived from World Bank public data (https://data.worldbank.org/indicator). The export and import values of forest products were obtained from the online FAOSTAT database (http://www.fao.org/ faostat/en/#data).
2.2. Methods
2.2.1. Changes in Forest Area
The change in forest area (CA) can be expressed by the following formula:
where S1992 is the forest area in 1992, and Sn is the forest area in year n (n = 1993, 1994, … 2015).
2.2.2. Forest Transition
Between 1992–2015, forest coverage was still decreasing in some countries, while in other countries, the trend in forest coverage had changed from decreasing to increasing, or forest cover increased continuously; according to the definition of FT [19,38], these conditions are respectively named as before FT (BFT), during FT (DFT), and post-FT (PFT; Figure 1). We estimated the FT status of each developing country based on their forest coverage curve in 1992–2015.
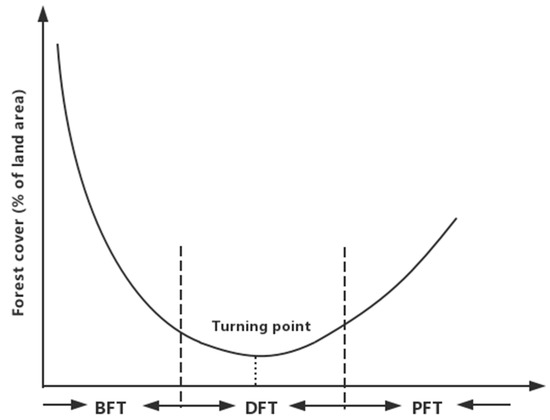
Figure 1.
Diagram showing the different forest transition (FT) statuses. BFT, DFT, and PFT correspond to countries before, during, and post-FT, respectively.
2.2.3. Binary Logistic Regression Model
Not all countries could experience FT. Although some studies have investigated the causal factors of FT [10,20,22,23,24,25], the driving factors of FT on the global and continental scales need to be further explored. Considering that the dependent variable is dichotomous (i.e., the country experienced FT or did not), a binary logistic regression model was used to identify the driving factors of FT in this study. The logistic regression model is a statistical method for analyzing whether one or more independent variables determine an outcome [40,41]. In this study, we established a regression model for all developing countries and every continent. FT status was considered as the binary dependent variable as follows: If the country experienced FT during the study period, the dependent variable value was 1; otherwise, it was 0. In addition, four potential driving forces were evaluated as independent variables: Forest coverage (Forest_r), GDP per capita (GDP_per), urban population (Urbanization_r), and the trade ratio (Trade_r).
The probability of FT occurrence (p(presence)) is given by:
where X is the independent variable being considered as a possible driving factor of FT, b0 is a constant, and the parameters bi (i = 1, 2, 3, …, k) reveal the effect of each independent variable of the outcome (the occurrence of FT).
The probability of FT absence (p(absence)) is given by:
The ratio of the probability of FT presence to the probability of FT absence (odds) is given by:
The logarithmic transformation of Equation (3) gives the logistic model:
Table 1 shows the variables assessed as potential driving factors of FT. According to previous research, forest scarcity and economic development are regarded as two main pathways of FT [10,25]. In some countries with little import ability to import forest products but stable demand for them, the prices of forest products increase due to resource scarcity, prompting the conversion of land to woodlands [10]. Therefore, forest area is considered as an important potential driving factor of FT, and forest coverage (Forest_r) was used as an independent variable in this study to reveal its effect on FT. Regarding economic development, rapid urbanization is associated with a shift in labor from agriculture to industrial production, and the resulting abandoned farmlands often revert to forest land [10,27,42,43]. Therefore, both GDP per capita (GDP_per) and urbanization level (Urbanization_r) were analyzed as independent variables in this study. In recent studies, FT has been shown to be strongly related to global trade [22,23]. Globalization can shift the pressure on forest resources in one country to other countries, thereby reducing deforestation in the country with reduced pressure. Thus, the trade ratio (Trade_r) can reveal the trade conditions in a country and was designated as an independent variable in this study. In summary, considering the availability and comparability of global data, four independent variables (Forest_r, GDP_per, Urbanization_r, Trade_r) (Table 1) were considered as potential driving factors of FT at the global and continental scales.

Table 1.
Variables included in this analysis.
Excluding countries with missing data, the driving factors of FT were assessed based on panel data for 75 major developing countries between 1992 and 2015. Thus, a total of 1725 valid samples were analyzed in Stata (software for statistical data analysis).
3. Results
3.1. Changes in Forest Cover at the Global, Continental, and Country Scales
In 2015, the average forest cover in developing countries was approximately 40.6% (standard deviation = 24.6%), mainly distributed in Northern South America, Central Africa, and Southeast Asia (Figure 2). The five countries with the largest forest areas were Brazil (4.2 million km2), China (2.1 million km2), the Democratic Republic of Congo (1.8 million km2), Indonesia (1.1 million km2), and Peru (0.8 million km2), collectively encompassing 46.9% of the global forest area.
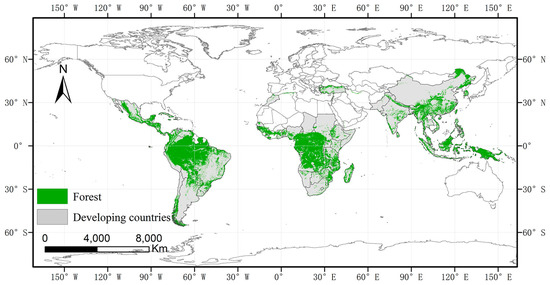
Figure 2.
Forest distribution in major developing countries in 2015.
Globally, forest coverage in developing countries declined during the study period, with an annual average rate of decline of −0.03% (Figure 3A). Notably, after 2004, the rate of decline slowed. From 1992–2015, the total forest area in developing countries decreased from 21.8 to 21.3 million km2, and forest coverage decreased from 41.2 to 40.6%.
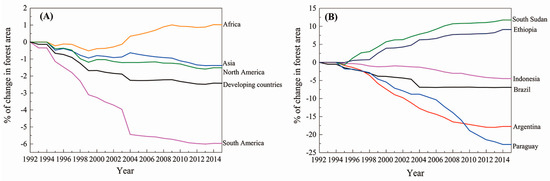
Figure 3.
Percentage change in forest area (A) on the global and continental scales, and (B) on the country scale for major developing countries from 1992–2015.
Different continents were characterized by different trends in forest coverage. Among all continents, forest area decreased the most in South America (from 8.5 to 8.0 million km2), which accounted for 85.2% of global forest loss during the study period. South America was followed by Asia, which experienced a decrease of 71,000 km2 and accounted for 12.0% of global forest loss. In contrast, forest area increased by 68,000 km2 in Africa, where FT occurred (Figure 3A).
Although global forest loss in developing countries has slowed in recent years, several countries are still experiencing severe forest reduction. The four countries with the largest reductions in forest area were Brazil, Argentina, Paraguay, and Indonesia. Brazil experienced the largest decrease in forest area (0.3 million km2), accounting for 50.6% of total forest loss in developing countries. Argentina, Paraguay, and Indonesia recorded net forest losses of 86,000, 53,000, and 51,000 km2, respectively. Among these four countries, the percentage loss of forest cover was largest in Paraguay (23.0%) and lowest in Indonesia (4.5%); however, the rate of decrease in forest coverage accelerated in Indonesia after 2005 (Figure 3B). Three of the above four countries (all except Indonesia) are located in South America (Figure 4).
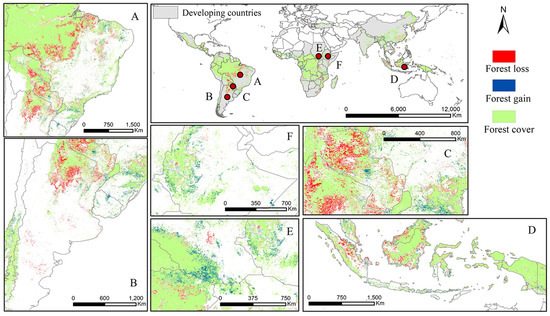
Figure 4.
Changes in forest cover during 1992–2015 in typical developing countries: The four countries with the largest decrease in forest area, (A) Brazil, (B) Argentina, (C) Paraguay, and (D) Indonesia, and the two countries with the largest increase in forest area, (E) South Sudan and (F) Ethiopia.
In several countries, the forest area increased during the study period, with South Sudan and Ethiopia having the largest increases in forest area. In South Sudan, the forest gain was concentrated on the edge zone of the southeastern forest area, with an increase in extent of 11.8%. In Ethiopia, the increase in forest land was concentrated in the western forest area, and the increase was 9.0% (Figure 3B and Figure 4). These two countries are located in Africa.
3.2. FT Conditions in Developing Countries
As shown in Figure 5, among African countries, 36.1% were classified as PFT countries during the study period, 44.4% were DFT countries, and 19.4% were BFT countries. In other words, 80.5% of African countries experienced FT before 2015. In Asia and North America, FT occurred in more than 60.0% countries by 2015. In South America, FT had occurred in only 50.0% of countries. Figure 6 shows plots of forest coverage (%) vs. time for 33 DFT countries, and the turning point of each FT is indicated by a red line.
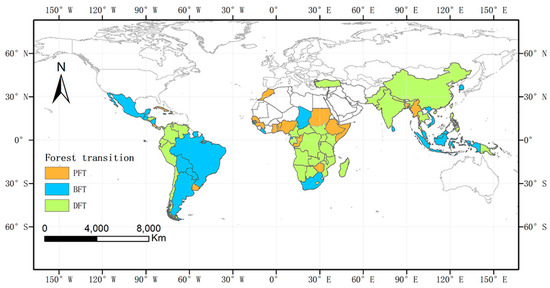
Figure 5.
FT status of developing countries from 1992–2015 (BFT = before FT; DFT = during FT; and PFT = post-FT).
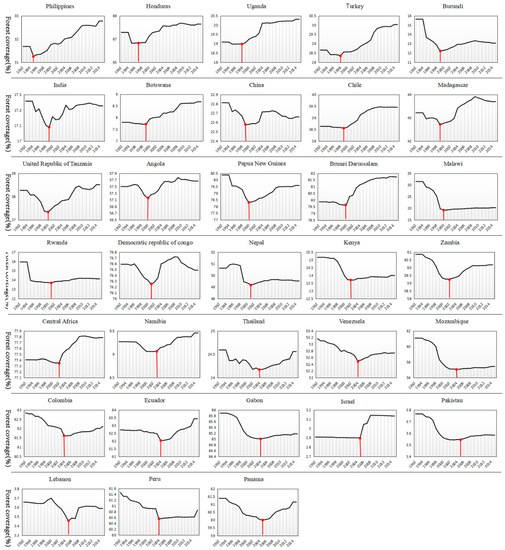
Figure 6.
DFT countries and their turning point (ordered based on the years of the turning points, which are indicated by the red lines).
3.3. Results of the Binary Logistic Regression Model
To determine the driving factors of FT, the independent variables in Table 2 were entered into a random-effects binary logistic regression (xtlogit-re) model. The log likelihood and Wald chi2 test indicated that the fitting effect of this model was perfect (p < 0.01). At the global scale, three variables were significant at the 1% level, except for GDP per capita. Among them, forest coverage and trade ratio negatively affected the possibility of FT occurrence, while urbanization level had a positive effect.
Table 2.
Logistic regression results based on panel data.
The influential variables differed by continent, and the same variables sometimes had opposite effects in different continents. For example, forest coverage had a negative effect on FT occurrence in Africa (p < 0.01), a positive effect in North America (p < 0.01) and South America (p < 0.01), and no significant effect in Asia. GDP per capita had a significant negative effect on FT occurrence in Africa (p < 0.05), a significant positive effect in Asia (p < 0.01) and South America (p < 0.01), and no significant influence on FT occurrence in North America. Urbanization positively affected FT occurrence in all continents. Trade ratio only had a significantly effect on FT occurrence in Asia (p < 0.05), and its effect was negative.
4. Discussion
4.1. Reasons for the Increase in Forest Area in Africa
On the continental scale, forest coverage increased in Africa during the study period, which was different from the continuous decrease in other continents. From 1992–2015, forest area in Africa increased by approximately 68,000 km2, and the conversion of cultivated land to forest land accounted for 66.0% of this increase. Among developing countries, the largest increases in forest area were observed in two African countries, South Sudan and Ethiopia. The potential reasons for the large increases in forest area in these countries are discussed here. South Sudan has always been embroiled in wars and turmoil. During the study period, Sudan (including South Sudan, which became an independent country in 2011) experienced the Second Sudanese Civil War (1985–2005), and the South Sudanese Civil War has been ongoing since 2013 [44]. Many studies have shown that conflicts have a positive effect on forest areas in conflict zones [44,45]. During conflicts, people often flee from war zones and/or hide in forested mountain regions. This can result in a decrease in human activities, thereby promoting the restoration of local forests [44,45,46]. Figure 3B shows that since 2004, one year before the Comprehensive Peace Agreement of the Second Sudanese Civil War, the rate of increase in forest coverage decreased. In 2013, when the South Sudanese Civil War began, the rate of increase in forest coverage increased.
In Ethiopia, the increase in forest area was mainly caused by the implementation of forest protection policies and the emphasis of forest protection in economic policies. The 94/1994 Bill, the 542/2007 Bill, and the forest law issued in 2007 in Ethiopia all emphasized forest protection and forestry development [47]. Meanwhile, a forest conservation program called shade coffee certification is underway in Ethiopia. This program has a positive effect on forest conservation by reducing forest clearing and transformation into agricultural land [48,49].
4.2. Analysis of the Driving Forces of FT
The results of this study should be interpreted cautiously, as the models do not represent any specific country. However, the results of global analyses like this one are useful for understanding FT mechanisms and have implications for further theoretical explorations of FT.
4.2.1. Forest Coverage
On a global scale, forest coverage had a negative effect on the possibility of FT occurrence in developing countries, in agreement with the “forest scarcity pathway” presented by Rudel [10]. In countries with stable demand for forest products but poor ability to import forest products, the scarcity of forest land would increase the prices of forest products [50] and induce trees planting [10], thereby increasing the probability of FT occurrence. This effect is most obvious in Africa, where the average forest coverage is 29.9%, lower than those of North America (53.1%) and South America (51.8%). In Africa, countries with low forest coverage are more likely to experience FT, which is attributed to the demand for forest products and corresponding increase in the prices of forest products [10]. Although forest coverage was lower in Asia than in Africa, its forest import value accounted for 76.5% of all developing countries, higher than in Africa (8.7%) according to FAOSTAT data (Figure 7). Therefore, in Asia, FT was not related to forest coverage because of the high import ability.
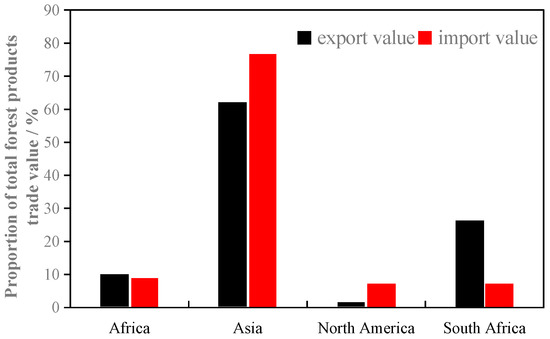
Figure 7.
Average import and export values of forest products in each continent (% of all developing countries) from 1992–2015.
4.2.2. Urbanization Level and GDP per Capita
The positive effect of urbanization level on FT occurrence on both the global and continental scales (Table 2) is in accord with the “economic development pathway” proposed by Rudel [10]. Under urbanization, farm workers leave farms for better paying nonfarm jobs [51], and the abandoned cultivated lands [42,43] are reverted to forest lands [10].
However, the effect of GDP per capita differed in Africa, Asia, and South America (Table 2). The effect of GDP per capita on FT occurrence was positive in Asia and South America but negative in Africa, which can be attributed to the different economic structures in different continents. As shown in Figure 8, the proportion of first industry in Africa is 23.6%, over double those for other continents. The development of GDP per capita in Africa still relies on agriculture and forest products. As a result, increasing land cultivation and deforestation for the purpose of economic development were still extensive during the study period; thus, it was difficult for countries with high GDP per capita in Africa to undergo FT. By contrast, due to the low proportion of first industry in Asia and South America, high GDP per capita corresponded to a high likelihood of FT occurrence because decreased rural activities led to the reversion of idle farmland to forest [52].

Figure 8.
Average first industry value (% of GDP) for developing countries in each continent from 1992–2015.
4.2.3. Trade Ratio of Forest Products
The effect of trade ratio on the probability of FT occurrence was only significant at the 1% level in Asia. According to Figure 7, the trade value of forest products in Asian countries accounted for approximately 70% of the trade value in all developing countries, indicating that the forestry trade is active in Asia. A higher proportion of export value makes it more difficult for FT to occur [22]. Importing forest products facilitates FT by shifting the agricultural demands and pressure on forests to the exporter; to accommodate these demands, the exporting country undergoes large-scale cropland expansion and deforestation, making it difficult to undergo FT [24].
4.3. Comparison of ESA-CCI LC v2 with Other Forest Cover Datasets
Many global forest datasets are available for different purposes. Here, we compared different datasets of forest area and its changes.
The FRA2015 dataset [32] provides annual forest area data from 1990–2015. Based on an analysis of FRA2015 data, forest area in developing countries decreased by 6.3% between 1992 and 2015 (from 21.1 to 19.8 million km2). In comparison, this study indicated a similar trend in forest area in developing countries from 1992–2015 at the global level based on the ESA-CCI LC v2 dataset. However, some differences were observed. First, the ESA-CCI LC v2 dataset resulted in larger forest areas than the FRA2015 dataset. On one hand, the forest area extracted from remote sensing data is higher than that obtained from statistical data in most cases because remote sensing data include other land use types in the forest, such as small ponds and croplands. On the other hand, 79 countries do not submit forest reports, so these are prepared by FAO with estimated values from desk studies [53]. Furthermore, the data for some countries are not updated in a timely fashion, which can affect the accuracy of forest areas determined based on the FRA2015 dataset. For instance, based on FRA2015 data, the forest area remained constant at 220,000 km2 in Gabon from 1992–2015. Second, the analysis of ESA data in this study indicated an increased variation trend in Africa, which is different from the FRA2015 dataset. However, changes in forest area in Africa based on FRA2015 data should be carefully interpreted because of the very low-quality data on African forest area in this dataset; among the 12 countries with the lowest quality FRA2015 data and forest areas exceeding 5 M ha, 10 are African countries [54].
We also compared the global forest area (including developed countries) extracted from ESA-CCI LC v2 data (58.4 million km2 in 2000 and 58.5 million km2 in 2005) with those obtained from other datasets in the literature: 39.3 ± 1.3 million km2 in 2000 and 38.8 ± 1.3 million km2 in 2005 based on the GLCF dataset [35], and 41.5million km2 in 2000 based on GFW data [36]. While the trends in forest area over time are similar, the forest areas based on ESA-CCI LC v2 data are larger than the other reported values. These differences can be primarily attributed to the differences in resolution and threshold criteria for extracting forests among datasets. The coarser spatial resolution of the ESA-CCI LC v2 dataset (300 m) allows more nonforest land use types within forests to be included in the forest area compared to the other datasets with 30-m spatial resolutions. In addition, the tree cover threshold in the ESA-CCI LC v2 dataset (15%) might lead to larger forest areas compared to the GFW (25%) [36] and GLCF (30%) [35] datasets.
Although the ESA-CCI LC v2 dataset has a coarser spatial resolution than other datasets, it is also credible. As the continuous data with the exception of FRA2015, and consistent in the region, the ESA-CCI LC v2 data can provide new information on forest change. However, when studying changes in forest area during a certain period or in specific years, other datasets with higher spatial resolutions might be preferable.
5. Conclusions
Based on the latest annual data published by ESA, we analyzed the spatiotemporal characteristics of forest cover and determined the FT statuses in developing countries from 1992–2015 on the global, continental, and country scales. Finally, we attempted to identify the driving forces of FT in developing countries and different continents. The results are expected to be useful for understanding FT and provide implications for further theoretical explorations of FT. The conclusions are summarized as follows.
(1) The forest area in developing countries decreased from 1992–2015, although the rate of decrease slowed after 2004. The areas of forest reduction were mainly distributed in South America, which had the largest area of forest loss (505,100 km2) and accounted for approximately 85% of total forest loss.
(2) On a national scale, the countries with the largest decreases in forest area between 1992 and 2015 were Brazil, Argentina, Paraguay, and Indonesia, three of which are in South America. The two countries with the largest increases in forest area were African countries, South Sudan and Ethiopia, where forest coverage continued to grow over the study period.
(3) Over 80% of African countries had experienced FT by 2015; in Asia and North America, the percentages exceeded 60.0%. In South America, FT had only occurred in half of the countries by 2015.
(4) The factors influencing FT are different at different scales, and the same variable may have opposite effects in different continents. At a global scale, forest coverage and trade ratio had negative effects on the probability of FT occurrence, whereas the effect of urbanization level was positive.
Author Contributions
Q.D. and M.T. designed the study. Q.D. analyzed the data and wrote the paper. M.T. helped in paper writing and analysis.
Funding
This research was funded by National Natural Science Foundation of China, grant number 41771116, and Strategic Priority Research Program of Chinese Academy of Sciences, Pan-Third Pole Environment Study for a Green Silk Road (Pan-TPE), grant number XDA20040400.
Conflicts of Interest
The authors declare no conflict of interest.
Appendix A
Table A1.
List of developing countries in this study.
Table A1.
List of developing countries in this study.
| Africa | Asia | North America | South America | ||
|---|---|---|---|---|---|
| Senegal | South Sudan | Lebanon | Papua New Guinea | El Salvador | Guyana |
| Ethiopia | Burundi | Pakistan | Republic of Korea | Nicaragua | Ecuador |
| Cameroon | Congo | Mexico | Paraguay | ||
| Chad | United Republic of Tanzania | Nepal | Indonesia | Honduras | Argentina |
| Togo | Malawi | Bangladesh | Thailand | ||
| Sierra Leone | Zambia | Philippines | Viet Nam | Guatemala | Uruguay |
| Liberia | Zimbabwe | Myanmar | Turkey | Costa Rica | Chile |
| Benin | Namibia | India | Sri Lanka | Panama | Venezuela |
| Nigeria | Botswana | China | Malaysia | Jamaica | Peru |
| Sudan | South Africa | Singapore | Brunei Darussalam | Haiti | Bolivia |
| Somalia | Lesotho | Cuba | Brazil | ||
| Equatorial Guinea | Côte d’Ivoire | Colombia | |||
| Uganda | Madagascar | ||||
| Kenya | Angola | ||||
| Gabon | Mozambique | ||||
| Rwanda | Guinea | ||||
| Democratic Republic of the Congo | Central African Republic | ||||
| Guinea-Bissau | Ghana | ||||
| Morocco | Comoros | ||||
| Gambia | |||||
Table A2.
The vegetation types of the forests.
Table A2.
The vegetation types of the forests.
| Types | Qualification |
|---|---|
| Tree cover, broadleaved, evergreen | Closed to open (>15%) |
| Tree cover, broadleaved, deciduous | Closed to open (>15%) |
| Tree cover, needleleaved, evergreen | Closed to open (>15%) |
| Tree cover, needleleaved, deciduous | Closed to open (>15%) |
| Tree cover, mixed leaf type (broadleaved and needleleaved) | - |
| Mosaic tree and shrub / herbaceous cover | (>50%)/(<50%) |
| Tree cover, flooded, fresh or brakish water | - |
| Tree cover, flooded, saline water | - |

Figure A1.
Forest coverage changes of BFT countries.

Figure A2.
Forest coverage changes of PFT countries.
References
- Aleixandre-Benavent, R.; Aleixandre-Tudó, J.L.; Castelló-Cogollos, L.; Aleixandre, J.L. Trends in global research in deforestation. A bibliometric analysis. Land Use Policy 2018, 72, 293–302. [Google Scholar] [CrossRef]
- Leblois, A.; Damette, O.; Wolfersberger, J. What has Driven Deforestation in Developing Countries Since the 2000s? Evidence from New Remote-Sensing Data. World Dev. 2017, 92, 82–102. [Google Scholar] [CrossRef]
- Hosonuma, N.; Herold, M.; de Sy, V.; de Fries, R.S.; Brockhaus, M.; Verchot, L.; Angelsen, A.; Romijn, E. An assessment of deforestation and forest degradation drivers in developing countries. Environ. Res. Lett. 2012, 7, 4009. [Google Scholar]
- Ehrhardt-Martinez, K.; Crenshaw Edward, M.; Jenkins, J.C. Deforestation and the Environmental Kuznets Curve: A Cross-National Investigation of Intervening Mechanisms. Soc. Sci. Q. 2003, 83, 226–243. [Google Scholar] [CrossRef]
- Achard, F.; Eva, H.D.; Stibig, H.-J.; Mayaux, P.; Gallego, J.; Richards, T.; Malingreau, J.-P. Determination of Deforestation Rates of the World’s Humid Tropical Forests. Science 2002, 297, 999–1002. [Google Scholar] [CrossRef]
- Zambrano-Monserrate, M.A.; Carvajal-Lara, C.; Urgilés-Sanchez, R.; Ruano, M.A. Deforestation as an indicator of environmental degradation: Analysis of five European countries. Ecol. Indic. 2018, 90, 1–8. [Google Scholar] [CrossRef]
- Bakkegaard, R.K.; Hogarth, N.J.; Bong, I.W.; Bosselmann, A.S.; Wunder, S. Measuring forest and wild product contributions to household welfare: Testing a scalable household survey instrument in Indonesia. For. Policy Econ. 2017, 84, 20–28. [Google Scholar] [CrossRef]
- Ros-Tonen, M.; Wiersum, K.F. The Importance of Non-Timber Forest Products for Forest-Based Rural Livelihoods: Agenda. In Proceedings of the The International Conference on Rural Livelihoods, Forests and Biodiversity, Bonn, Germany, 19–23 May 2003. [Google Scholar]
- Chao, S. Forest Peoples: Numbers across the World; Forest Peoples Programme: Moreton-in-Marsh, UK, 2012. [Google Scholar]
- Rudel, T.K.; Coomes, O.T.; Moran, E.; Achard, F.; Angelsen, A.; Xu, J.; Lambin, E. Forest transitions: Towards a global understanding of land use change. Glob. Environ. Chang. 2005, 15, 23–31. [Google Scholar] [CrossRef]
- Cunningham, S.C.; Mac Nally, R.; Baker, P.J.; Cavagnaro, T.R.; Beringer, J.; Thomson, J.R.; Thompson, R.M. Balancing the environmental benefits of reforestation in agricultural regions. Perspect. Plant Ecol. Evol. Syst. 2015, 17, 301–317. [Google Scholar] [CrossRef]
- Kramer, R.A.; Richter, D.D.; Pattanayak, S.; Sharma, N.P. Ecological and Economic Analysis of Watershed Protection in Eastern Madagascar. J. Environ. Manag. 1997, 49, 277–295. [Google Scholar] [CrossRef]
- Ammer, U.; Breitsameter, J.; Zander, J. Contribution of Mountain Forests Towards The Prevention of Surface Runoff And Soil-Erosion. Forstwiss. Cent. 1995, 114, 232–249. [Google Scholar] [CrossRef]
- Houghton, R.A.; Skole, D.L.; Nobre, C.A.; Hackler, J.L.; Lawrence, K.T.; Chomentowski, W.H. Annual fluxes or carbon from deforestation and regrowth in the Brazilian Amazon. Nature 2000, 403, 301–304. [Google Scholar] [CrossRef]
- Lugo, A.E. The apparent paradox of reestablishing species richness on degraded lands with tree monocultures. For. Ecol. Manag. 1997, 99, 9–19. [Google Scholar] [CrossRef]
- Li, L.; Liu, J. Forest Transiton—A Literature Review. For. Econ. 2012, 10, 98–103. [Google Scholar]
- Mather, A.S. The forest transition. Area 1992, 24, 367–379. [Google Scholar]
- Redo, D.J.; Grau, H.R.; Aide, T.M.; Clark, M.L. Asymmetric forest transition driven by the interaction of socioeconomic development and environmental heterogeneity in Central America. Proc. Natl. Acad. Sci. USA 2012, 109, 8839–8844. [Google Scholar] [CrossRef] [PubMed]
- Youn, Y.-C.; Choi, J.; de Jong, W.; Liu, J.; Park, M.S.; Camacho, L.D.; Tachibana, S.; Huudung, N.D.; Bhojvaid, P.P.; Damayanti, E.K.; et al. Conditions of forest transition in Asian countries. For. Policy Econ. 2017, 76, 14–24. [Google Scholar] [CrossRef]
- Mather, A.S. Recent Asian Forest Transitions in Relation to Forest-Transition Theory. Int. For. Rev. 2010, 9, 491–502. [Google Scholar]
- Park, M.S.; Youn, Y.-C. Reforestation policy integration by the multiple sectors toward forest transition in the Republic of Korea. For. Policy Econ. 2017, 76, 45–55. [Google Scholar] [CrossRef]
- Li, L.; Liu, J.; Long, H.; de Jong, W.; Youn, Y.-C. Economic globalization, trade and forest transition-the case of nine Asian countries. For. Policy Econ. 2017, 76, 7–13. [Google Scholar] [CrossRef]
- Rudel, T.K. Paths of destruction and regeneration: Globalization and forests in the tropics. Rural Sociol. 2002, 67, 622–636. [Google Scholar] [CrossRef]
- Meyfroidt, P.; Rudel, T.K.; Lambin, E.F. Forest transitions, trade, and the global displacement of land use. Proc. Natl. Acad. Sci. USA 2010, 107, 20917. [Google Scholar] [CrossRef] [PubMed]
- Lambin, E.F.; Meyfroidt, P. Land use transitions: Socio-ecological feedback versus socio-economic change. Land Use Policy 2010, 27, 108–118. [Google Scholar] [CrossRef]
- Zhai, D.; Xu, J.; Dai, Z.; Schmidt-Vogt, D. Lost in transition: Forest transition and natural forest loss in tropical China. Plant Divers. 2017, 39, 149–153. [Google Scholar] [CrossRef]
- Singh, M.P.; Bhojvaid, P.P.; de Jong, W.; Ashraf, J.; Reddy, S.R. Forest transition and socio-economic development in India and their implications for forest transition theory. For. Policy Econ. 2017, 76, 65–71. [Google Scholar] [CrossRef]
- Heilmayr, R.; Echeverría, C.; Fuentes, R.; Lambin, E.F. A plantation-dominated forest transition in Chile. Appl. Geogr. 2016, 75, 71–82. [Google Scholar] [CrossRef]
- Bae, J.S.; Joo, R.W.; Kim, Y.-S. Forest transition in South Korea: Reality, path and drivers. Land Use Policy 2012, 29, 198–207. [Google Scholar] [CrossRef]
- Ashraf, J.; Pandey, R.; de Jong, W. Assessment of bio-physical, social and economic drivers for forest transition in Asia-Pacific region. For. Policy Econ. 2017, 76, 35–44. [Google Scholar] [CrossRef]
- Wolfersberger, J.; Delacote, P.; Garcia, S. An empirical analysis of forest transition and land-use change in developing countries. Ecol. Econ. 2015, 119, 241–251. [Google Scholar] [CrossRef]
- MacDicken, K.G. Global Forest Resources Assessment 2015: What, why and how? For. Ecol. Manag. 2015, 352, 3–8. [Google Scholar] [CrossRef]
- Chen, J.; Cao, X.; Peng, S.; Ren, H.R. Analysis and Applications of GlobeLand30: A Review. ISPRS Int. J. Geo-Inf. 2017, 6, 17. [Google Scholar] [CrossRef]
- Jun, C.; Anping, L.; Jin, C.; Shu, P.; Lijun, C.; Hongwei, Z. 30-Meter Global Land Cover Data Product- GlobeLand30. Geomat. World 2017, 24, 8. [Google Scholar]
- Feng, M.; Sexton, J.O.; Huang, C.; Anand, A.; Channan, S.; Song, X.-P.; Song, D.-X.; Kim, D.-H.; Noojipady, P.; Townshend, J.R. Earth science data records of global forest cover and change: Assessment of accuracy in 1990, 2000, and 2005 epochs. Remote Sens. Environ. 2016, 184, 73–85. [Google Scholar] [CrossRef]
- Hansen, M.C.; Potapov, P.V.; Moore, R.; Hancher, M.; Turubanova, S.A.; Tyukavina, A.; Thau, D.; Stehman, S.V.; Goetz, S.J.; Loveland, T.R.; et al. High-Resolution Global Maps of 21st-Century Forest Cover Change. Science 2013, 342, 850. [Google Scholar] [CrossRef] [PubMed]
- Li, W.; MacBean, N.; Ciais, P.; Defourny, P.; Lamarche, C.; Bontemps, S.; Houghton, R.A.; Peng, S. Gross and net land cover changes in the main plant functional types derived from the annual ESA CCI land cover maps (1992–2015). Earth Syst. Sci. Data 2018, 10, 219–234. [Google Scholar] [CrossRef]
- Rudel, T.K.; Schneider, L.; Uriarte, M. Forest transitions: An introduction. Land Use Policy 2010, 27, 95–97. [Google Scholar] [CrossRef]
- UCL-Geomatics. Land Cover Cci Product User Guide Version 2.0; UCL-Geomatics: London, UK, 2017; p. 10. [Google Scholar]
- Binary, F.E.H. Logistic Regression. In Regression Modeling Strategies; Springer: Cham, Switzerland, 2015. [Google Scholar]
- Xiao, R.; Liu, Y.; Huang, X.; Shi, R.; Yu, W.; Zhang, T. Exploring the driving forces of farmland loss under rapidurbanization using binary logistic regression and spatial regression: A case study of Shanghai and Hangzhou Bay. Ecol. Indic. 2018, 95, 455–467. [Google Scholar] [CrossRef]
- Foster, A.D.; Rosenzweig, M.R. Economic Growth and the Rise of Forests. Q. J. Econ. 2003, 118, 601–637. [Google Scholar] [CrossRef]
- Doran, F.S.; Dangerfield, C.W.; Cubbage, F.W.; Johnson, J.E.; Pease, J.W.; Johnson, L.A.; Hopper, G.M. Tree Crops for Marginal Farmland: Loblolly Pine; Virginia Cooperative Extension (VCE): Blacksburg, VA, USA, 2005. [Google Scholar]
- Gorsevski, V.; Kasischke, E.; Dempewolf, J.; Loboda, T.; Grossmann, F. Analysis of the Impacts of armed conflict on the Eastern Afromontane forest region on the South Sudan—Uganda border using multitemporal Landsat imagery. Remote Sens. Environ. 2012, 118, 10–20. [Google Scholar] [CrossRef]
- Gorsevski, V.; Geores, M.; Kasischke, E. Human dimensions of land use and land cover change related to civil unrest in the Imatong Mountains of South Sudan. Appl. Geogr. 2013, 38, 64–75. [Google Scholar] [CrossRef]
- Kaimowitz, D.; Fauné, A. Contras and Comandantes. J. Sustain. For. 2003, 16, 21–46. [Google Scholar] [CrossRef]
- Zou, D.; Zhang, P.; Chen, S.; He, Y.; Wang, Y. Overview on Forestry Development in Ethiopia. World For. Res. 2014, 27, 83–88. [Google Scholar]
- Takahashi, R.; Todo, Y. Coffee Certification and Forest Quality: Evidence from a Wild Coffee Forest in Ethiopia. World Dev. 2017, 92, 158–166. [Google Scholar] [CrossRef]
- Takahashi, R.; Todo, Y. The impact of a shade coffee certification program on forest conservation: A case study from a wild coffee forest in Ethiopia. J. Environ. Manag. 2013, 130, 48–54. [Google Scholar] [CrossRef] [PubMed]
- Bishop, J.T. Valuing Forests: A Review of Methods and Applications in Developing Countries; IIED: London, UK, 1999. [Google Scholar]
- Binswanger-Mkhize, H.P.; Johnson, T.; Samboko, P.C.; You, L. The Impact of Urban Growth on Agricultural and Rural Non-Farm Growth in Kenya. Tata-Cornell Institute for Agriculture and Nutrition (TCI). Available online: https://ageconsearch.umn.edu/bitstream/249274/2/329.%20Urban%20 growth%20on%20agricultural%20and%20non-farm%20income%20in%20Kenya.pdf (accessed on 5 March 2019).
- Izquierdo, A.E.; De Angelo, C.D.; Aide, T.M. Thirty years of human demography and land-use change in the Atlantic Forest of Misiones, Argentina: An evaluation of the forest transition model. Ecol. Soc. 2008, 13, 3. [Google Scholar] [CrossRef]
- FAO. Global Forest Resources Assessment 2015; Desk Reference; FAO: Rome, Italy, 2015. [Google Scholar]
- Keenan, R.J.; Reams, G.A.; Achard, F.; de Freitas, J.V.; Grainger, A.; Lindquist, E. Dynamics of global forest area: Results from the FAO Global Forest Resources Assessment 2015. For. Ecol. Manag. 2015, 352, 9–20. [Google Scholar] [CrossRef]
© 2019 by the authors. Licensee MDPI, Basel, Switzerland. This article is an open access article distributed under the terms and conditions of the Creative Commons Attribution (CC BY) license (http://creativecommons.org/licenses/by/4.0/).