The Effect of Tree-Planting Patterns on the Microclimate within a Courtyard

 ,
,  , ,
, ,
Abstract
:1. Introduction
2. The Subject of Research and Methods
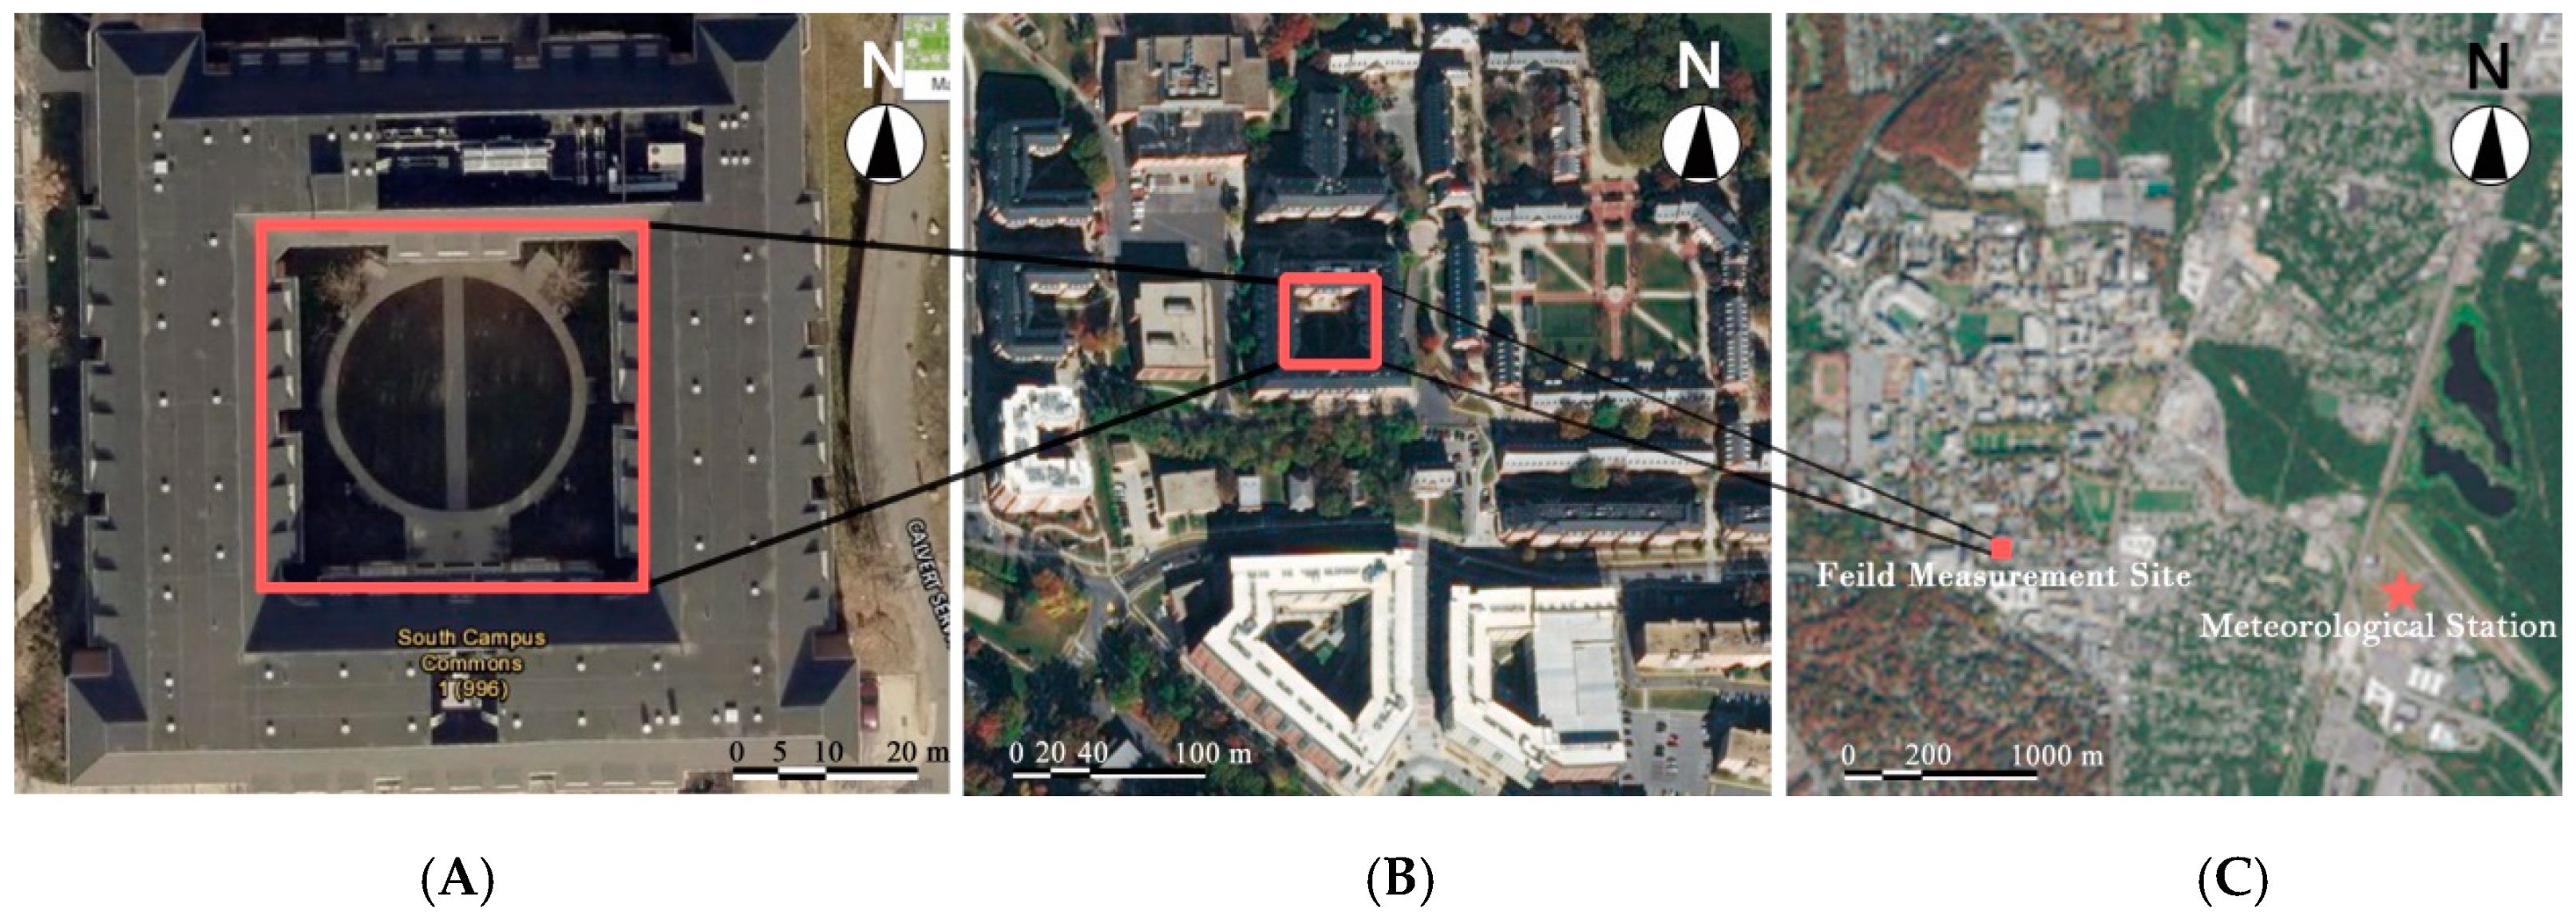
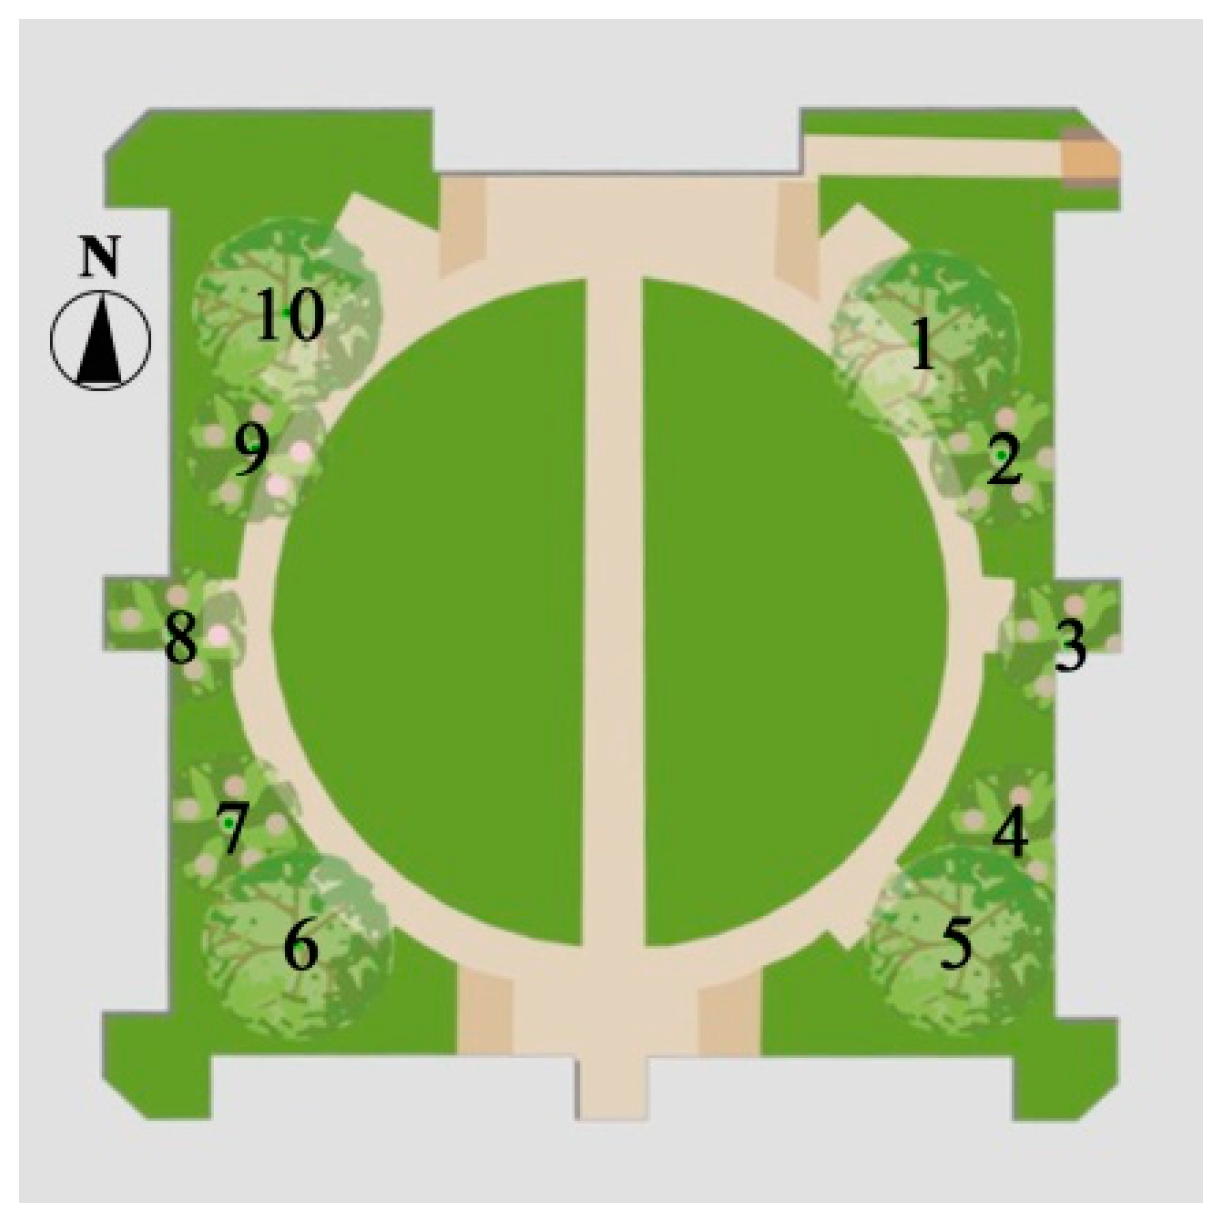
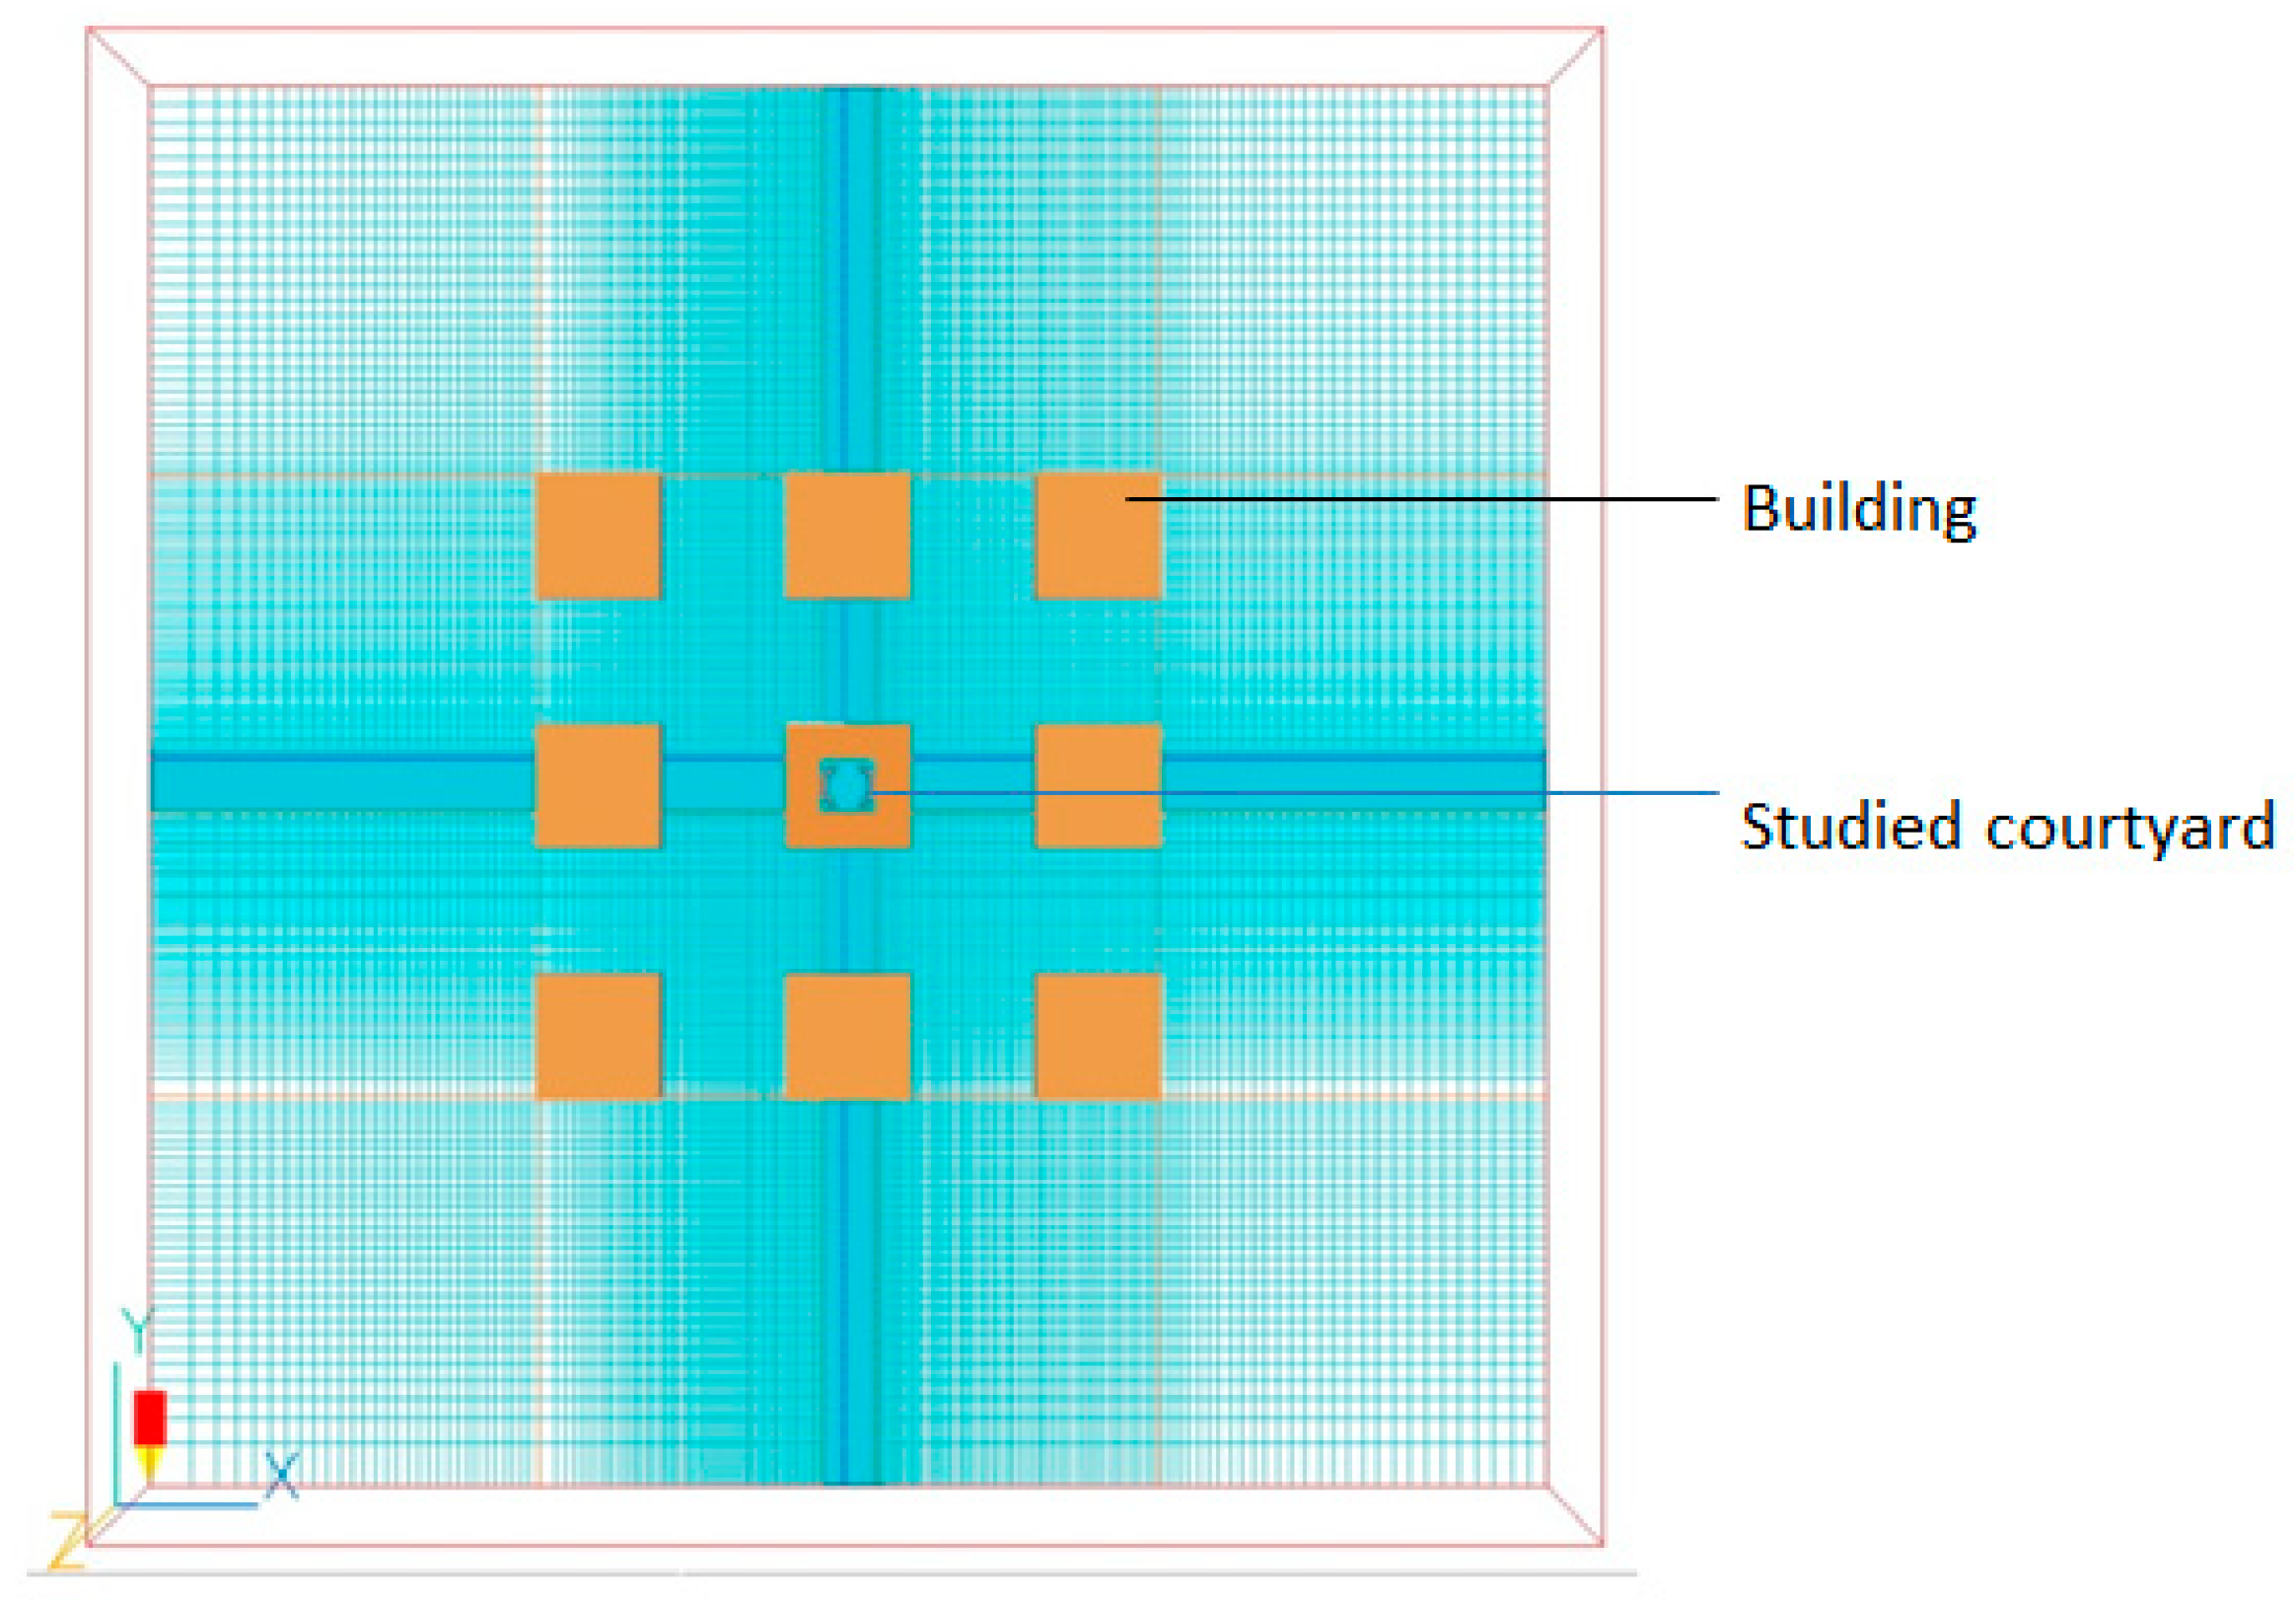
2.1. Subject of Research
2.2. Numerical Model
2.2.1. Turbulence Model
2.2.2. Radiation Flux Model
2.2.3. Vegetation Model
2.2.4. Inlet Boundary Condition
2.3. Climate and Sites
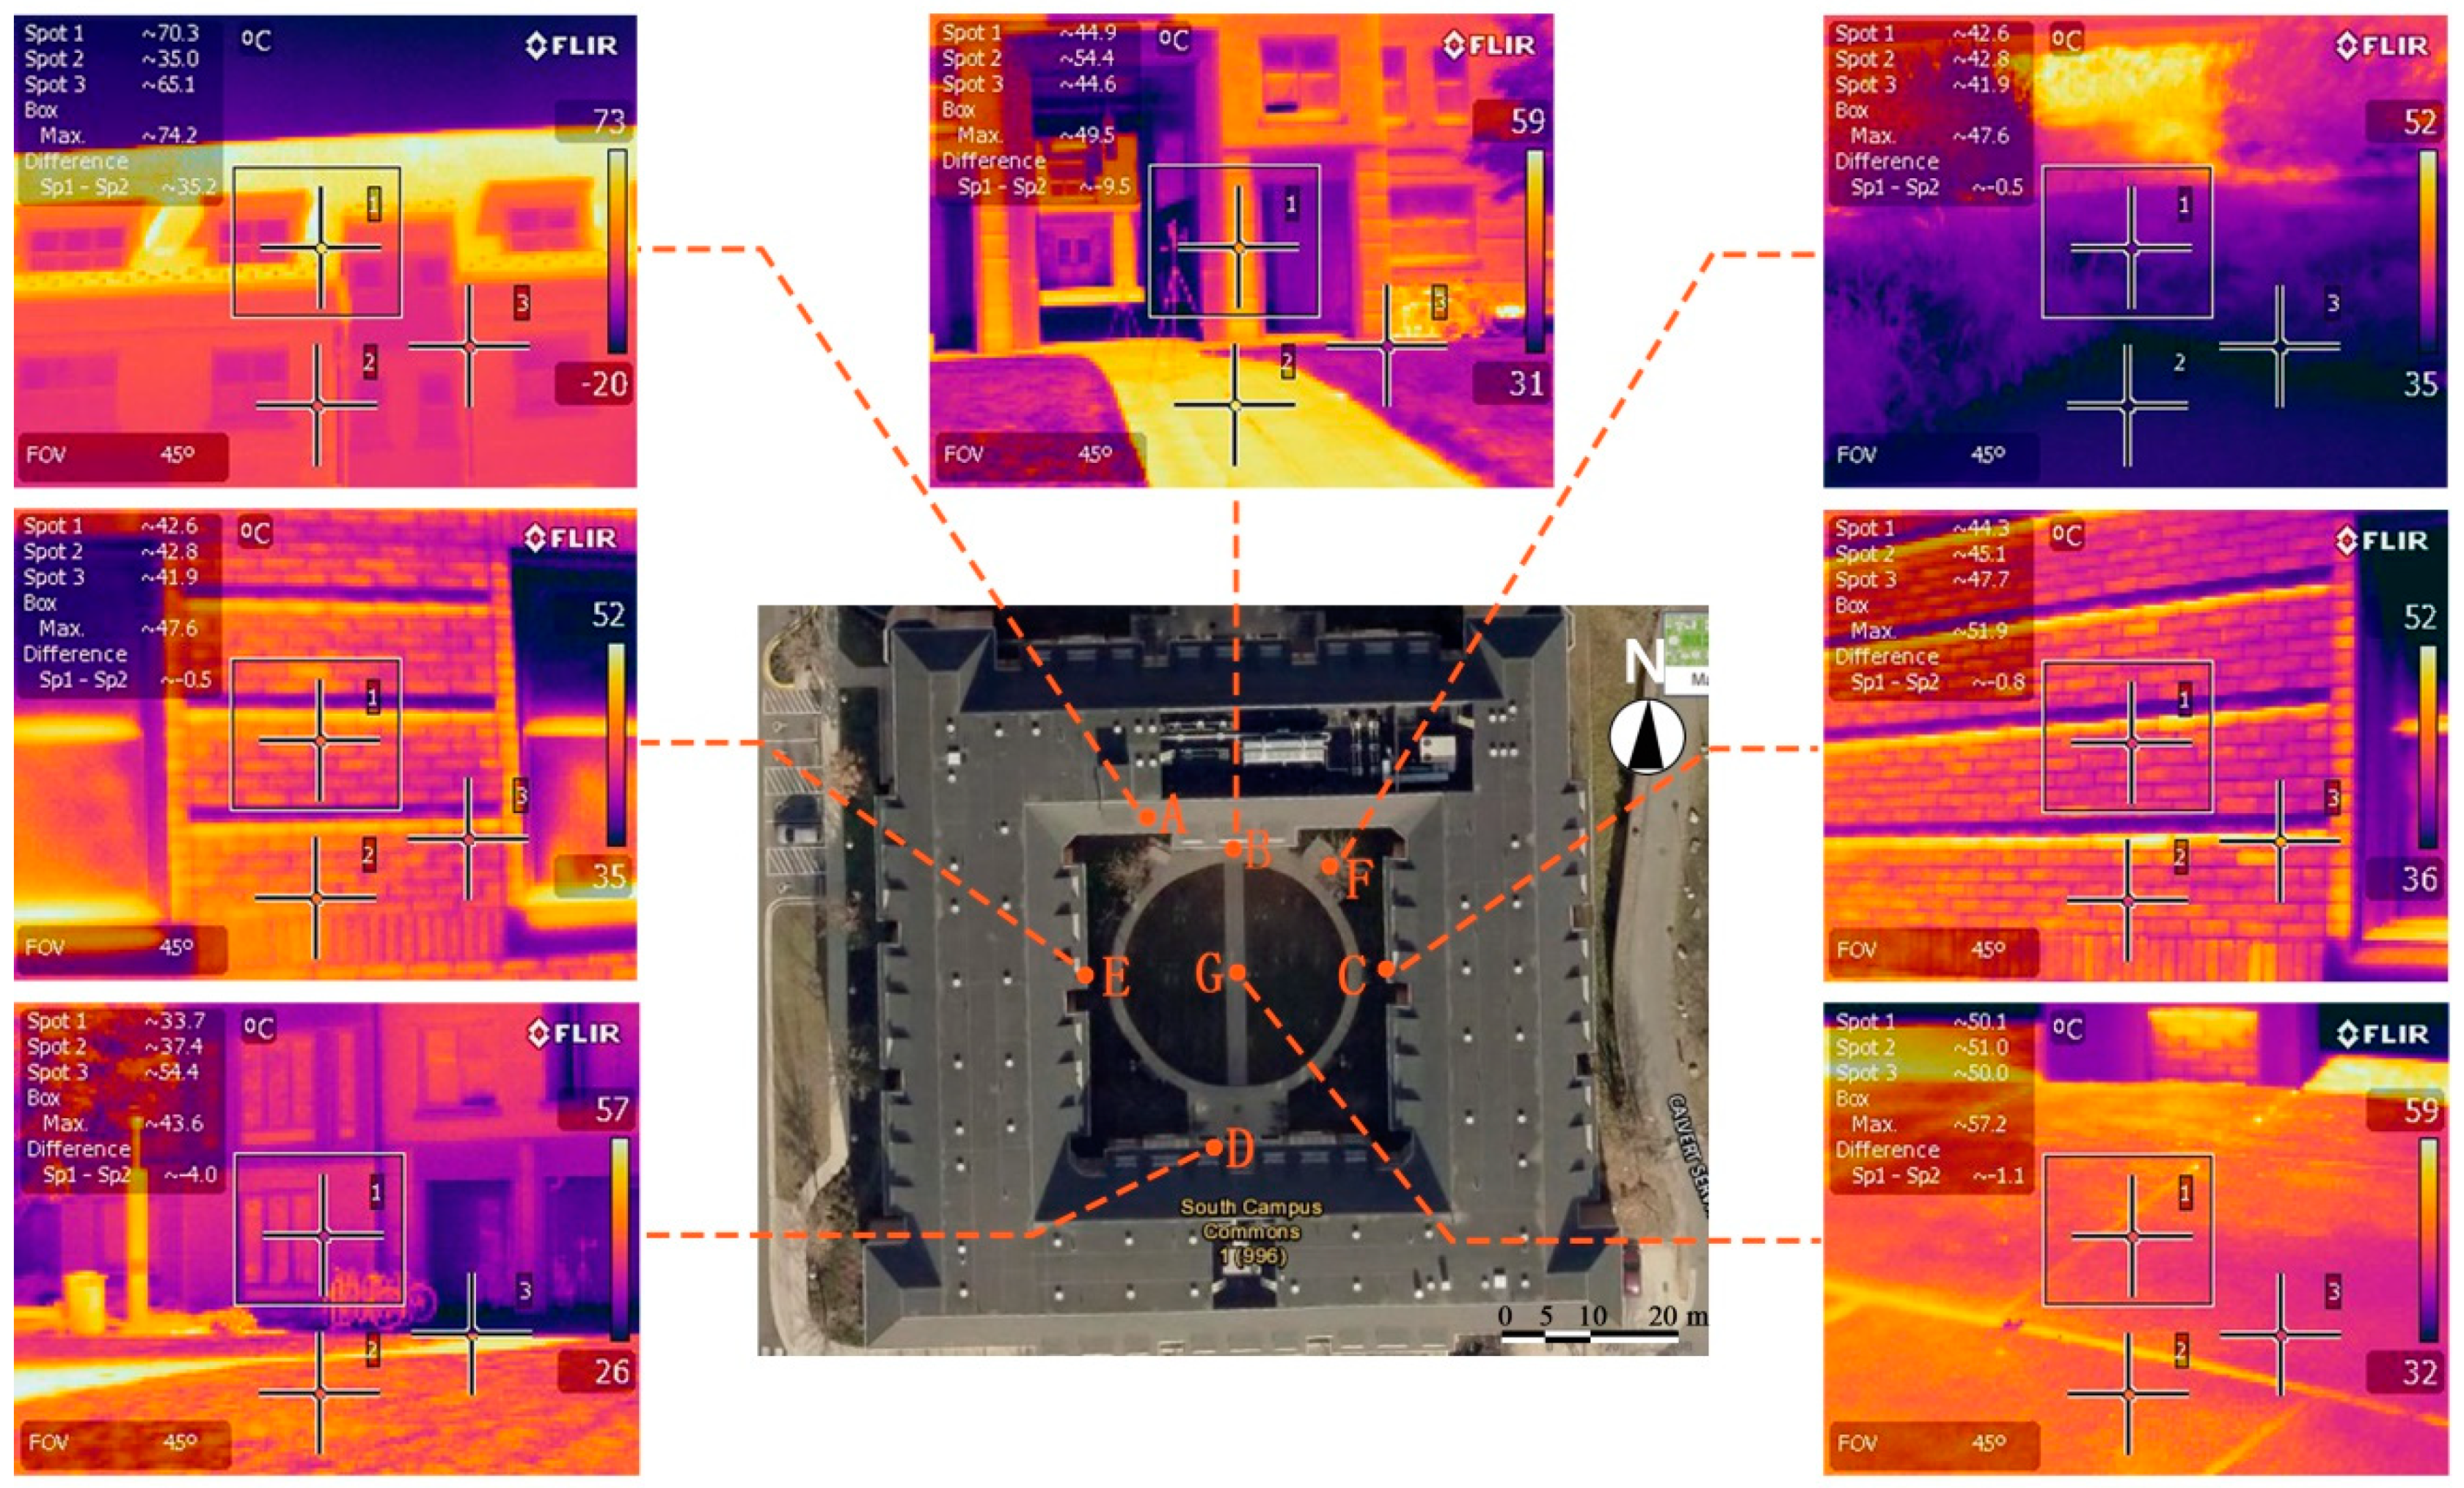
2.4. Field Measurement and PHOENICS Calibration
- -
- The accuracy of the measured temperature was ±0.5 °C within the temperature range -29.0 to 70.0 °C.
- -
- The accuracy of the wind velocity was ±3% of reading within the airspeed range 0.6 to 40.0 m/s, least significant digit or 20 ft/min.
- -
- The response time of the sensors was 2 s.
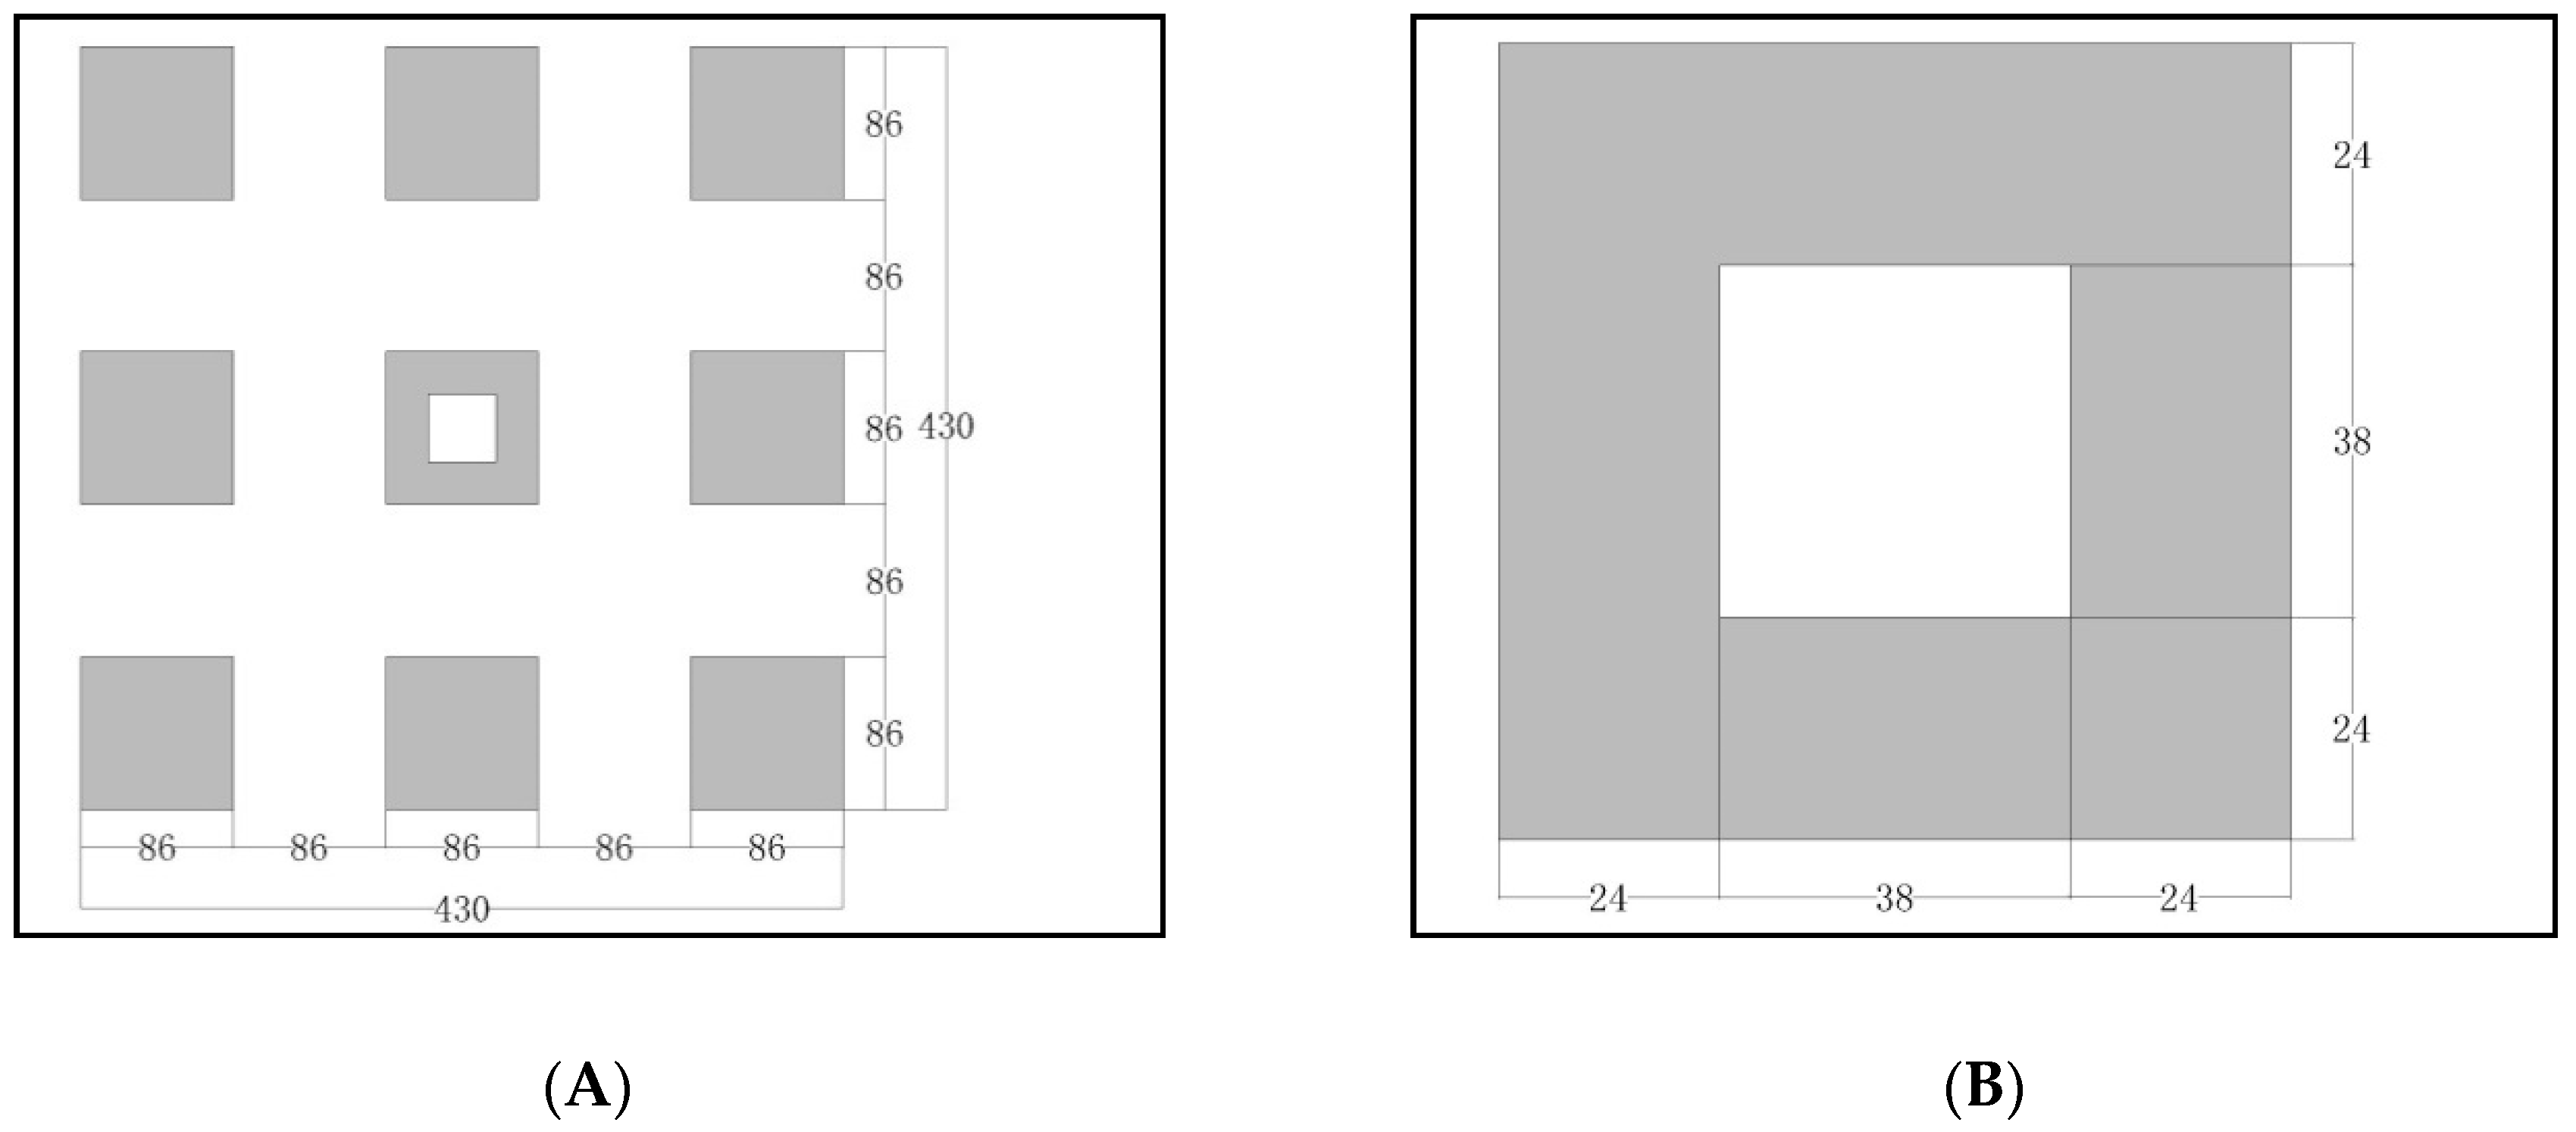
2.5. Numerical Experimentation Setup and Configuration
2.6. Model Initialization
3. Result and Discussion
3.1. Impact of the Tree-Planting Pattern on the Average Air Temperature, Humidity and Wind Velocity
3.2. Impact of the Tree-Planting Pattern on the Air Temperature
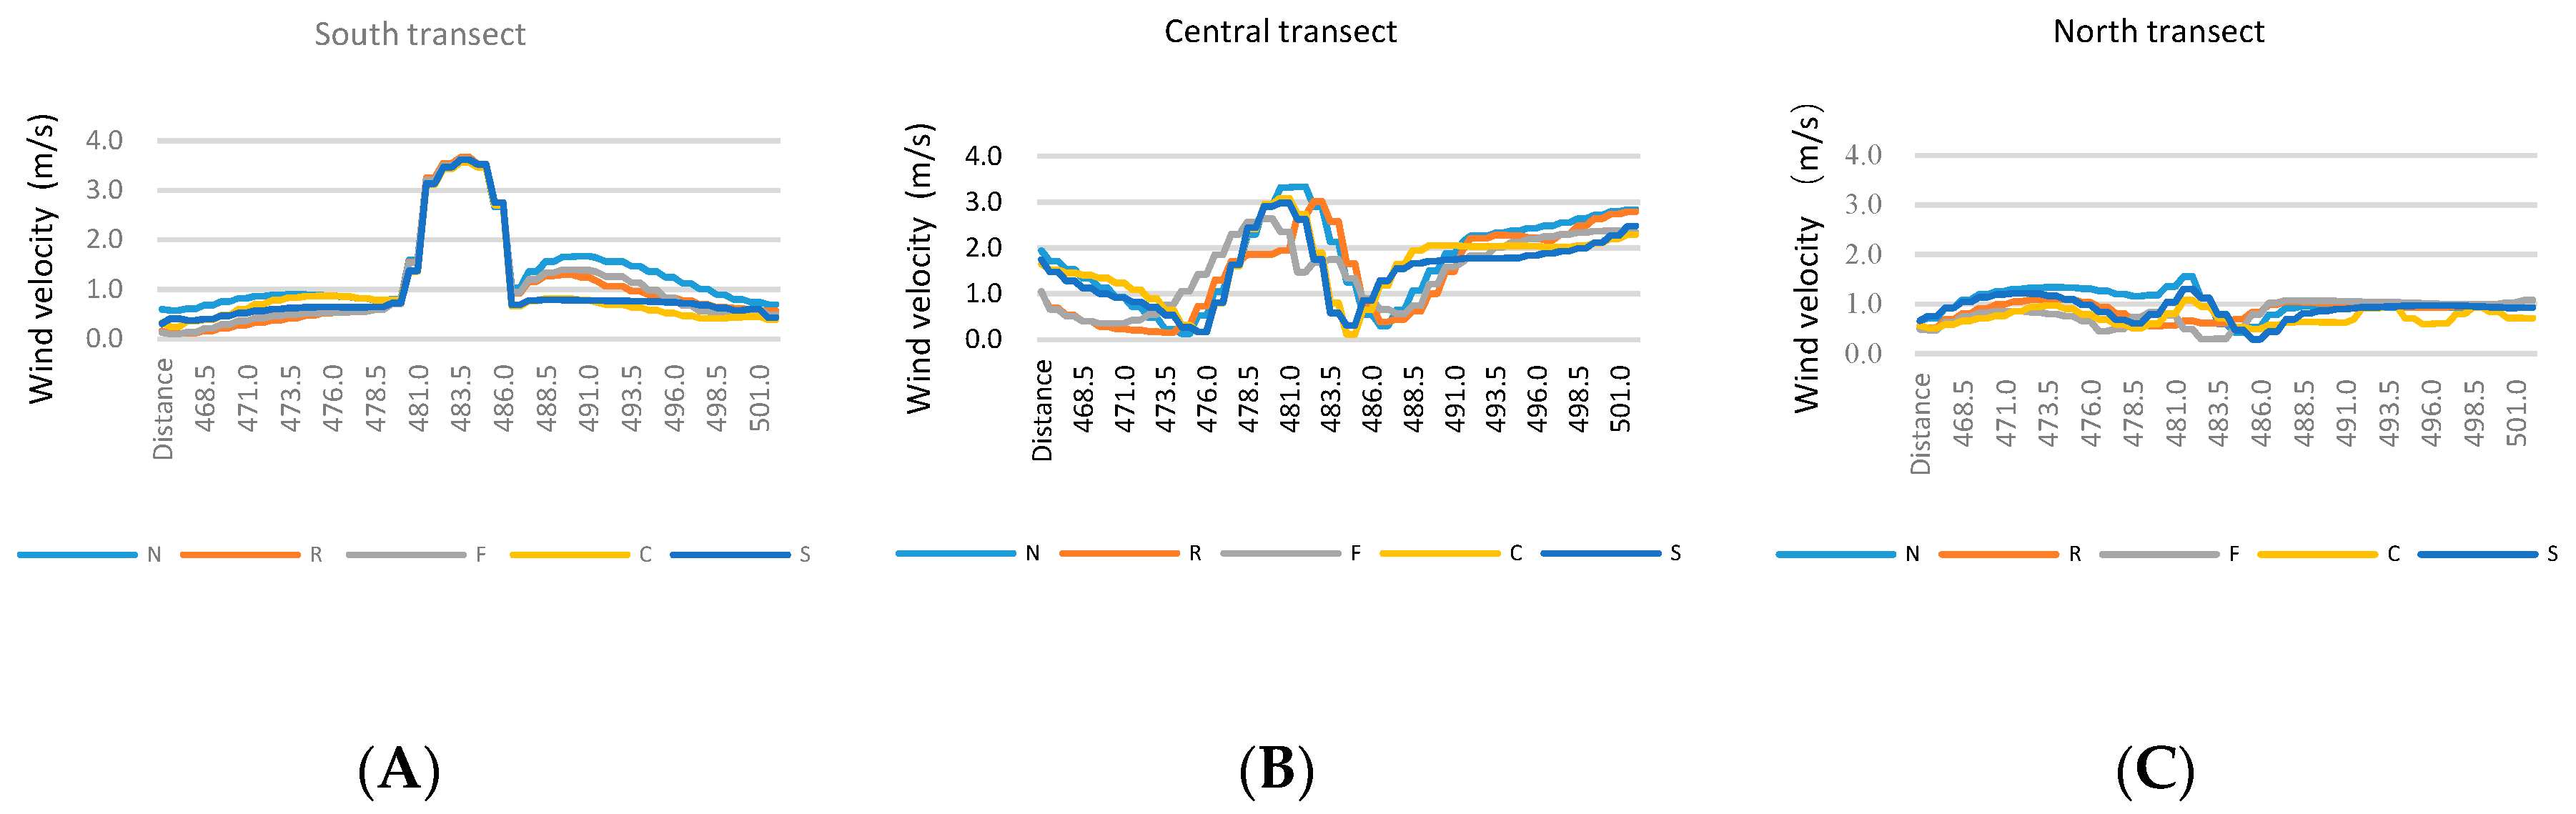
3.3. Impact of Tree-Planting Pattern on Wind Velocity
3.4. Impact of the Tree-Planting Pattern on the Wind Direction
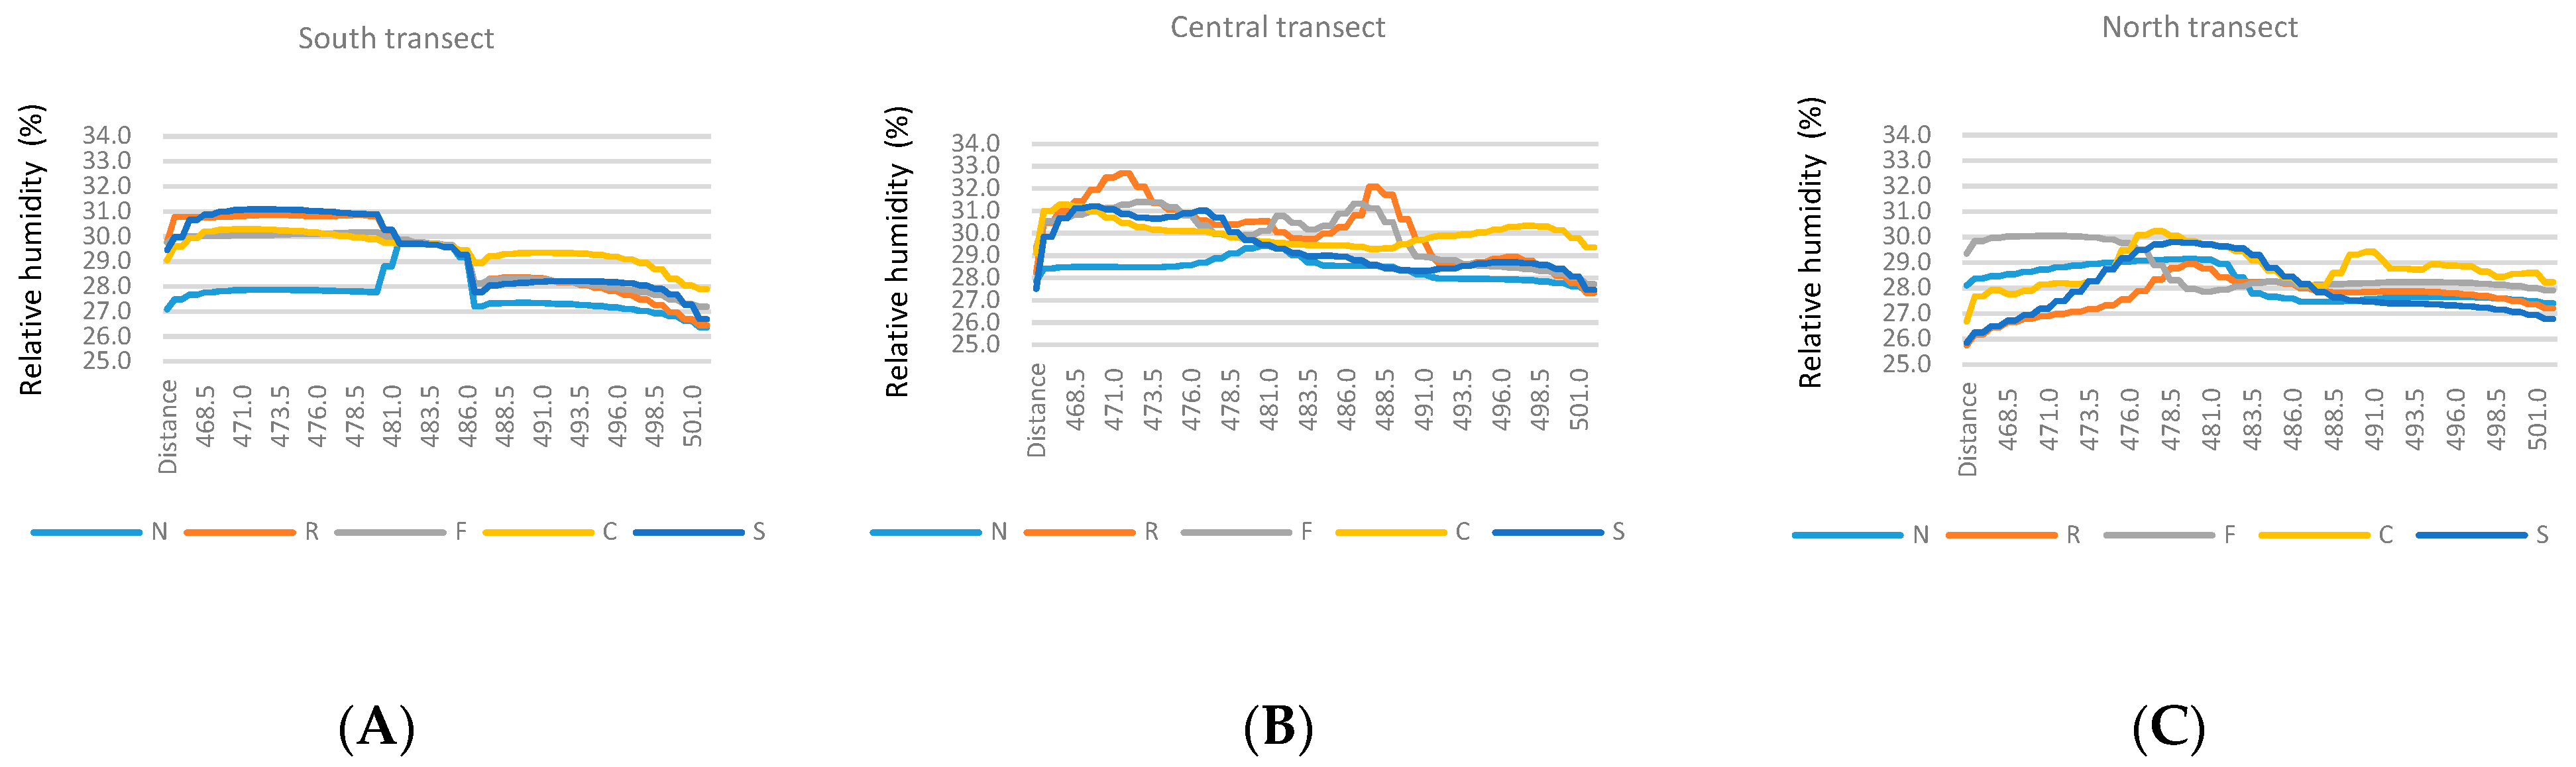
3.5. Impact of the Tree-Planting Pattern on the Relative Humidity
3.6. Discussion
4. Conclusions
Author Contributions
Funding
Acknowledgments
Conflicts of Interest
List of Abbreviations and Symbols Used
| βp | the fraction of mean-flow kinetic energy converted to wake-generated k by canopy drag. |
| βd | the fraction of k dissipated by short-circuiting the Kolmogorov energy cascade. |
| K | the von Karman constant. |
| u* | the friction velocity |
| z0 | the roughness length. |
| Fs | the safe factor. |
| ε | the error between the current and refined mesh |
| r | the grid improvement factor. |
| P | the order of convergence. |
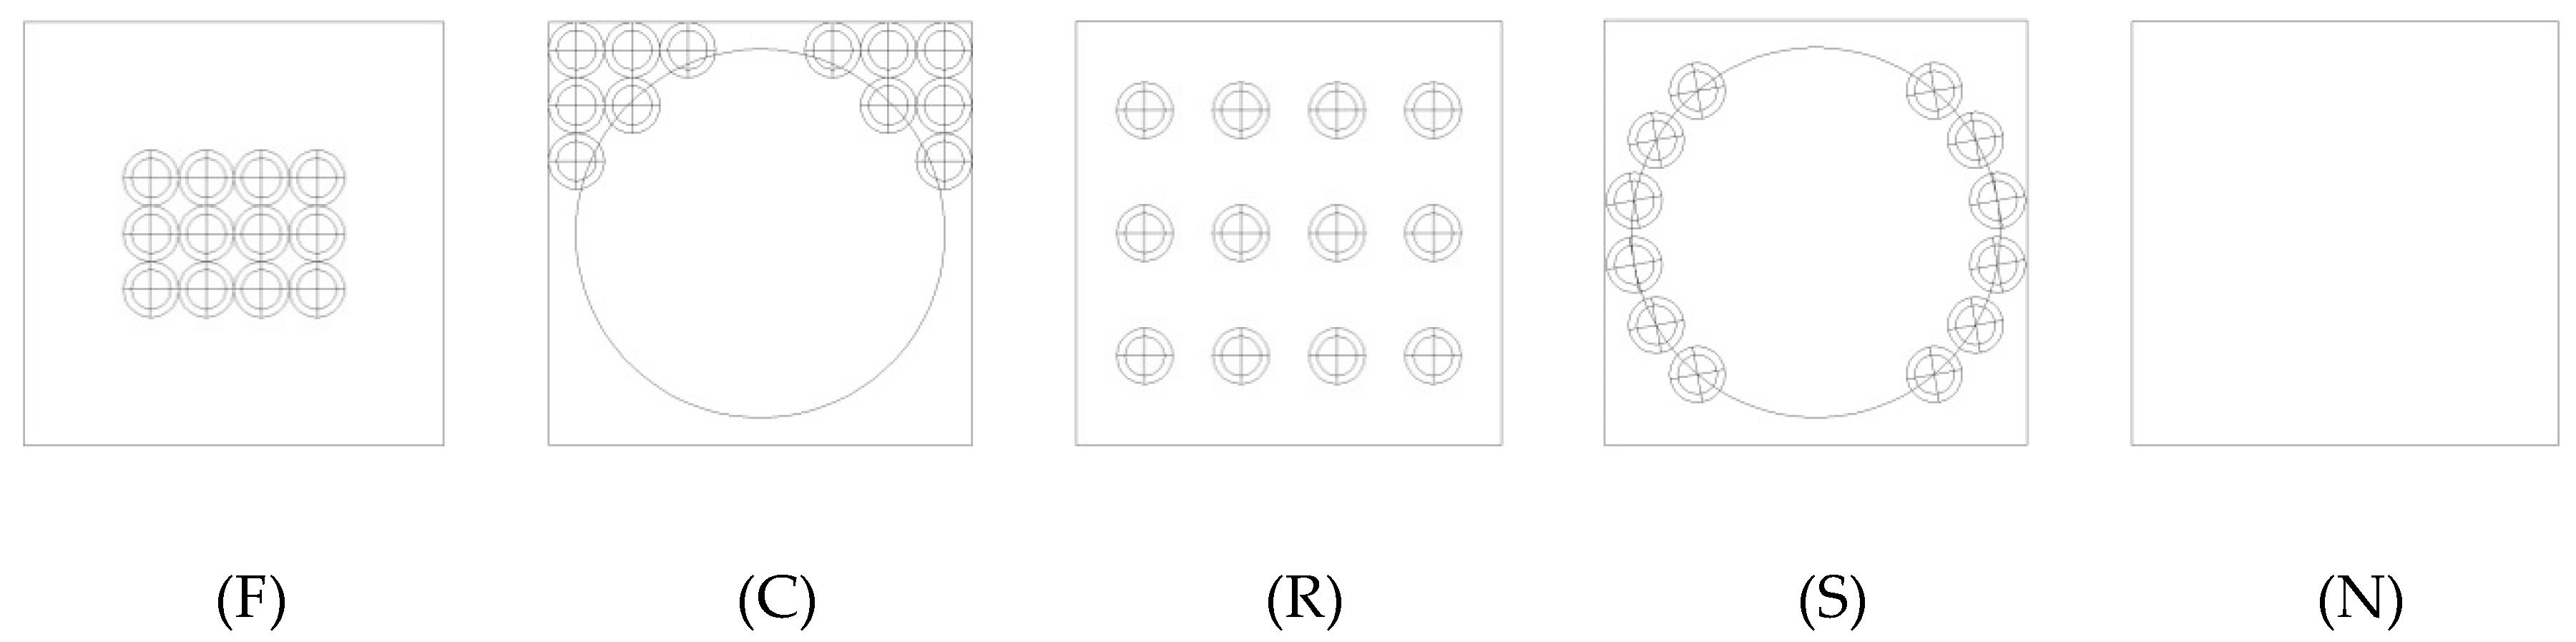
| F | focused tree-planting. |
| C | cornered tree-planting |
| R | multi-row tree-planting |
| S | surround tree-planting |
| N | no tree-planting |
| UHI | Urban Heat Island |
| RNG | Re-Normalization Group |
| CFD | Computational Fluid Dynamics. |
| LAI | Leaf Area Index |
References
- Qin, Y. A review on the development of cool pavements to mitigate urban heat island effect. Renew. Sustain. Energy Rev. 2015, 52, 445–459. [Google Scholar] [CrossRef]
- Taleghani, M. Outdoor thermal comfort by different heat mitigation strategies—A review. Renew. Sustain. Energy Rev. 2018, 81(Part 2), 2011–2018. [Google Scholar] [CrossRef]
- Saito, I.; Ishihara, O.; Katayama, T. Study of the effect of green areas on the thermal environment in an urban area. Energy Build. 1990, 15, 493–498. [Google Scholar] [CrossRef]
- Srivanit, M.; Hokao, K. Evaluating the cooling effects of greening for improving the outdoor thermal environment at an institutional campus in the summer. Build. Environ. 2013, 66, 158–172. [Google Scholar] [CrossRef]
- Santamouris, M.; Ding, L.; Fiorito, F.; Oldfield, P.; Osmond, P.; Paolini, R.; Prasad, D.; Synnefa, A. Passive and active cooling for the outdoor built environment—Analysis and assessment of the cooling potential of mitigation technologies using performance data from 220 large scale projects. Solar Energy 2017, 154, 14–33. [Google Scholar] [CrossRef]
- Tsoka, S. Investigating the Relationship Between Urban Spaces Morphology and Local Microclimate: A Study for Thessaloniki. Procedia Environ. Sci. 2017, 38, 674–681. [Google Scholar] [CrossRef]
- Taleghani, M.; Sailor, D.J.; Tenpierik, M.; van den Dobbelsteen, A. Thermal assessment of heat mitigation strategies: The case of Portland State University, Oregon, USA. Build. Environ. 2014, 73, 138–150. [Google Scholar] [CrossRef]
- Gago, E.J.; Roldan, J.; Pacheco-Torres, R.; Ordóñez, J. The city and urban heat islands: A review of strategies to mitigate adverse effects. Renew. Sustain. Energy Rev. 2013, 25, 749–758. [Google Scholar] [CrossRef]
- O’Malley, C.; Piroozfar, P.; Farr, E.R.P.; Pomponi, F. Urban Heat Island (UHI) mitigating strategies: A case-based comparative analysis. Sustain. Cities Soc. 2015, 19, 222–235. [Google Scholar] [CrossRef] [Green Version]
- Lambers, H.; Chapin, S., III. Plant Physiological Ecology; Springer: New York, NY, USA, 1998. [Google Scholar]
- Kantzioura, A.; Kosmopoulos, P.; Dimoudi, A.; Zoras, S. Experimental investigation of microclimatic conditions in relation to the built environment in a central urban area in Thessaloniki (Northern Greece): A case study. Sustain. Cities Soc. 2015, 19, 331–340. [Google Scholar] [CrossRef]
- Zamani, Z.; Heidari, S.; Hanachi, P. Reviewing the thermal and microclimatic function of courtyards. Renew. Sustain. Energy Rev. 2018, 93, 580–595. [Google Scholar] [CrossRef]
- Nasrollahi, N.; Hatami, M.; Khastar, S.R.; Taleghani, M. Numerical evaluation of thermal comfort in traditional courtyards to develop new microclimate design in a hot and dry climate. Sustain. Cities Soc. 2017, 35, 449–467. [Google Scholar] [CrossRef]
- Kubota, T.; Zakaria, M.A.; Abe, S.; Toe, D.H.C. Thermal functions of internal courtyards in traditional Chinese shophouses in the hot-humid climate of Malaysia. Build. Environ. 2017, 112, 115–131. [Google Scholar] [CrossRef]
- Taleghani, M. Dwelling on Courtyards-Exploring the Energy Efficiency and Comfort Potential of Courtyards for Dwellings in the Netherlands; Mohammad Taleghani: Delft, The Netherlands, 2014. [Google Scholar]
- Jamei, E.; Rajagopalan, P.; Seyedmahmoudian, M.; Jamei, Y. Review on the impact of urban geometry and pedestrian level greening on outdoor thermal comfort. Renew. Sustain. Energy Rev. 2016, 54, 1002–1017. [Google Scholar] [CrossRef]
- Paas, B.; Schneider, C. A comparison of model performance between ENVI-met and Austal2000 for particulate matter. Atmos. Environ. 2016, 145, 392–404. [Google Scholar] [CrossRef]
- Gromke, C.; Blocken, B.; Janssen, W.; Merema, B.; van Hooff, T.; Timmermans, H. CFD analysis of transpirational cooling by vegetation: Case study for specific meteorological conditions during a heat wave in Arnhem, Netherlands. Build. Environ. 2015, 83, 11–26. [Google Scholar] [CrossRef]
- Chatzidimitriou, A.; Yannas, S. Microclimate development in open urban spaces: The influence of form and materials. Energy Build. 2015, 108, 156–174. [Google Scholar] [CrossRef]
- Zheng, S.; Zhao, L.; Li, Q. Numerical simulation of the impact of different vegetation species on the outdoor thermal environment. Urban For. Urban Green. 2016, 18, 138–150. [Google Scholar] [CrossRef]
- Lin, B.; Li, X.; Zhu, Y.; Qin, Y. Numerical simulation studies of the different vegetation patterns’ effects on outdoor pedestrian thermal comfort. J. Wind Eng. Ind. Aerodyn. 2008, 96, 1707–1718. [Google Scholar] [CrossRef]
- Morakinyo, T.E.; Kong, L.; Lau, K.K.-L.; Yuan, C.; Ng, E. A study on the impact of shadow-cast and tree species on in-canyon and neighborhood’s thermal comfort. Build. Environ. 2017, 115, 1–17. [Google Scholar] [CrossRef]
- Tan, Z.; Lau, K.K.-L.; Ng, E. Planning strategies for roadside tree planting and outdoor comfort enhancement in subtropical high-density urban areas. Build. Environ. 2017, 120, 93–109. [Google Scholar] [CrossRef]
- Tan, Z.; Lau, K.K.-L.; Ng, E. Urban tree design approaches for mitigating daytime urban heat island effects in a high-density urban environment. Energy Build. 2016, 114, 265–274. [Google Scholar] [CrossRef]
- Ng, W.Y.; Chau, C.K. Evaluating the role of vegetation on the ventilation performance in isolated deep street canyons. Int. J.Environ. Pollut. 2012, 50, 98–110. [Google Scholar] [CrossRef]
- Gromke, C.; Buccolieri, R.; Di Sabatino, S.; Ruck, B. Dispersion study in a street canyon with tree planting by means of wind tunnel and numerical investigations – Evaluation of CFD data with experimental data. Atmos. Environ. 2008, 42, 8640–8650. [Google Scholar] [CrossRef]
- Hsieh, C.-M.; Jan, F.-C.; Zhang, L. A simplified assessment of how tree allocation, wind environment, and shading affect human comfort. Urban For. Urban Green. 2016, 18, 126–137. [Google Scholar] [CrossRef]
- Zhang, L.; Zhan, Q.; Lan, Y. Effects of the tree distribution and species on outdoor environment conditions in a hot summer and cold winter zone: A case study in Wuhan residential quarters. Build. Environ. 2018, 130, 27–39. [Google Scholar] [CrossRef]
- Cham, L. PHOENICS Software, Version 2015 (64bit Intel); Cham Ltd.: London, UK; Wimbledon: London, UK, 2016. [Google Scholar]
- Wu, J.; Ludwig, J. Flair User’s Guide, Documentation fo Phoenics TR 313. Version: 2010; Cham Ltd.: London, UK, 2010. [Google Scholar]
- Finnigan, J. Turbulence in plant canopies. Annu. Rev. Fluid Mech. 2000, 32, 519–571. [Google Scholar] [CrossRef]
- Green, S. Modeling Turbulent Air Flow in a Stand of Widely Spaced Trees. PHOENICS J. Comput. Fluid Dyn. Appl. 1992, 5, 294–312. [Google Scholar]
- Blocken, B.; Carmeliet, J. High-resolution wind-driven rain measurements on a low-rise building—Experimental data for model development and model validation. J. Wind Eng. Ind. Aerodyn. 2005, 93, 905–928. [Google Scholar] [CrossRef]
- Richards, P.; Hoxey, R. Appropriate boundary conditions for computational wind engineering models using the k-ε turbulence model. In Computational Wind Engineering 1; Elsevier: Amsterdam, The Netherlands, 1993; pp. 145–153. [Google Scholar]
- Blocken, B.; Stathopoulos, T.; Carmeliet, J. CFD simulation of the atmospheric boundary layer: Wall function problems. Atmos. Environ. 2007, 41, 238–252. [Google Scholar] [CrossRef]
- Liu, N.; Qin, Y. Building Thermal Environment; Tsinghua University Press: Beijing, China, 2005. [Google Scholar]
- Liu, J.; Heidarinejad, M.; Gracik, S.; Srebric, J. The impact of exterior surface convective heat transfer coefficients on the building energy consumption in urban neighborhoods with different plan area densities. Energy Build. 2015, 86, 449–463. [Google Scholar] [CrossRef]
- Liu, J.; Srebric, J.; Yu, N. Numerical simulation of convective heat transfer coefficients at the external surfaces of building arrays immersed in a turbulent boundary layer. Int. J. Heat Mass Transf. 2013, 61, 209–225. [Google Scholar] [CrossRef]
- Mochida, A.; Tominaga, Y.; Yoshie, R. AIJ guideline for practical applications of CFD to wind environment around buildings. In Proceedings of the 4th International Symposium on Computational Wind Engineering (CWE2006), Yokohama, Japan, 16–19 July 2006. [Google Scholar]
- Tominaga, Y.; Mochida, A.; Yoshie, R.; Kataoka, H.; Nozu, T.; Yoshikawa, M.; Shirasawa, T. AIJ guidelines for practical applications of CFD to pedestrian wind environment around buildings. J. Wind Eng. Ind. Aerodyn. 2008, 96, 1749–1761. [Google Scholar] [CrossRef]
- Houborg, R.; McCabe, M.F. A hybrid training approach for leaf area index estimation via Cubist and random forests machine-learning. ISPRS J. Photogramm. Remote Sens. 2018, 135, 173–188. [Google Scholar] [CrossRef]
- Zhao, Q.; Sailor, D.J.; Wentz, E.A. Impact of tree locations and arrangements on outdoor microclimates and human thermal comfort in an urban residential environment. Urban For. Urban Green. 2018, 32, 81–91. [Google Scholar] [CrossRef]


| Number | Species | Common Name | Tree Height | Crown Height | Crown Radius | Trunk Height | Leaf Area Index (LAI) |
|---|---|---|---|---|---|---|---|
| 1 | Acer saccharum | Sugar Maple | 8.3 | 4.4 | 2.2 | 3.9 | 3.3 |
| 2 | Prunusserrulata | Japanese Cherry | 7.6 | 4.7 | 2.3 | 2.9 | 1.5 |
| 3 | Prunusserrulata | Japanese Cherry | 7.1 | 3.7 | 1.9 | 3.4 | 1.4 |
| 4 | Prunusserrulata | Japanese Cherry | 7.4 | 4.4 | 2.2 | 3.0 | 1.7 |
| 5 | Acer saccharum | Sugar Maple | 10.1 | 5.0 | 2.5 | 5.1 | 3.7 |
| 6 | Acer saccharum | Sugar Maple | 9.1 | 5.4 | 2.7 | 3.7 | 3.2 |
| 7 | Prunusserrulata | Japanese Cherry | 7.5 | 4.1 | 2.0 | 3.5 | 2.0 |
| 8 | Prunusserrulata | Japanese Cherry | 7.3 | 5.3 | 2.7 | 2.0 | 2.3 |
| 9 | Prunusserrulata | Japanese Cherry | 7.9 | 5.9 | 3.0 | 2.0 | 2.2 |
| 10 | Acer saccharum | Sugar Maple | 8.6 | 4.3 | 2.2 | 4.2 | 3.5 |
| Parameters | Summary of Inputs |
|---|---|
| Simulation day | 20 September 2017 |
| Simulation time | 2:00 p.m. |
| Spatial resolution | 1.0 m (3.3 ft) horizontally 0.2 m (0.7 ft) vertically |
| Longitude | 76°56′41″ W |
| Latitude | 38°59′17″ N |
| Direct solar radiation | 816 W/m2 |
| Diffused solar radiation | 122 W/m2 |
| Initial air temperature | 28.8 °C |
| Wind speed (at 10 m) | 3.1 m/s (9.3 ft/s) |
| Wind direction (N = 0, E = 90) | 350° |
| Building surface temperature | E: 44.3 °C; W: 41.9 °C; N: 44.9 °C; S: 33.7 °C |
| Ground surface temperature (concrete) | 51.0 °C |
| Roof surface temperature | 70.3 °C |
| Relative humidity | 45% |
| Drag coefficient | 0.5 |
| Solar absorption for brick walls | 0.75 |
| Emissivity for brick walls | 0.90 |
| Solar absorption for concrete pavement | 0.74 |
| Emissivity for concrete pavement | 0.94 |
| Solar absorption for roofs | 0.87 |
| Emissivity for roofs | 0.88 |
| Parameters | Summary of Inputs |
|---|---|
| Simulation day | 5 August 2015 |
| Simulation time | 2:00 p.m. |
| Spatial resolution | 1.0 m (3.3 ft) horizontally 0.2 m (0.7 ft) vertically |
| Longitude | 76°56′41″ W |
| Latitude | 38°59′17″ N |
| Direct solar radiation | 829 W/m2 |
| Diffused solar radiation | 160 W/m2 |
| Initial air temperature | 31.0 °C |
| Wind speed (at 10 m) | 5.7 m/s (18.8 ft/s) |
| Wind direction (N = 0, E = 90) | 190° |
| Building surface temperature | E: 45.3 °C; W: 41.6 °C; N: 46.9 °C; S: 36.9 °C |
| Ground surface temperature (concrete) | 49.5 °C |
| Roof surface temperature | 56.0 °C |
| Relative humidity | 31% |
| Drag coefficient | 0.5 |
| Solar absorption for brick walls | 0.75 |
| Emissivity for brick walls | 0.90 |
| Solar absorption for concrete pavement | 0.74 |
| Emissivity for concrete pavement | 0.94 |
| Solar absorption for roofs | 0.87 |
| Emissivity for roofs | 0.88 |
| Number | Pattern | Air Temperature (°C) | Relative Humidity (%) | Wind Velocity (m/s) |
|---|---|---|---|---|
| 1 | F | 31.92 | 29.52 | 1.30 |
| 2 | C | 31.79 | 29.72 | 1.35 |
| 3 | R | 31.95 | 29.50 | 1.30 |
| 4 | S | 32.14 | 29.16 | 1.34 |
| 5 | N | 32.66 | 28.23 | 1.54 |
© 2019 by the authors. Licensee MDPI, Basel, Switzerland. This article is an open access article distributed under the terms and conditions of the Creative Commons Attribution (CC BY) license (http://creativecommons.org/licenses/by/4.0/).
Share and Cite
Li, J.; Liu, J.; Srebric, J.; Hu, Y.; Liu, M.; Su, L.; Wang, S. The Effect of Tree-Planting Patterns on the Microclimate within a Courtyard. Sustainability 2019, 11, 1665. https://doi.org/10.3390/su11061665
Li J, Liu J, Srebric J, Hu Y, Liu M, Su L, Wang S. The Effect of Tree-Planting Patterns on the Microclimate within a Courtyard. Sustainability. 2019; 11(6):1665. https://doi.org/10.3390/su11061665
Chicago/Turabian StyleLi, Junying, Jiying Liu, Jelena Srebric, Yuanman Hu, Miao Liu, Lei Su, and Shunchang Wang. 2019. "The Effect of Tree-Planting Patterns on the Microclimate within a Courtyard" Sustainability 11, no. 6: 1665. https://doi.org/10.3390/su11061665