Study on Efficient Utilization Technology of Coal Pillar Based on Gob-Side Entry Driving in a Coal Mine with Great Depth and High Production


Abstract
:1. Introduction
2. Stress State Analysis of Coal Pillar Structure
2.1. Main Roof Fracture Line Location
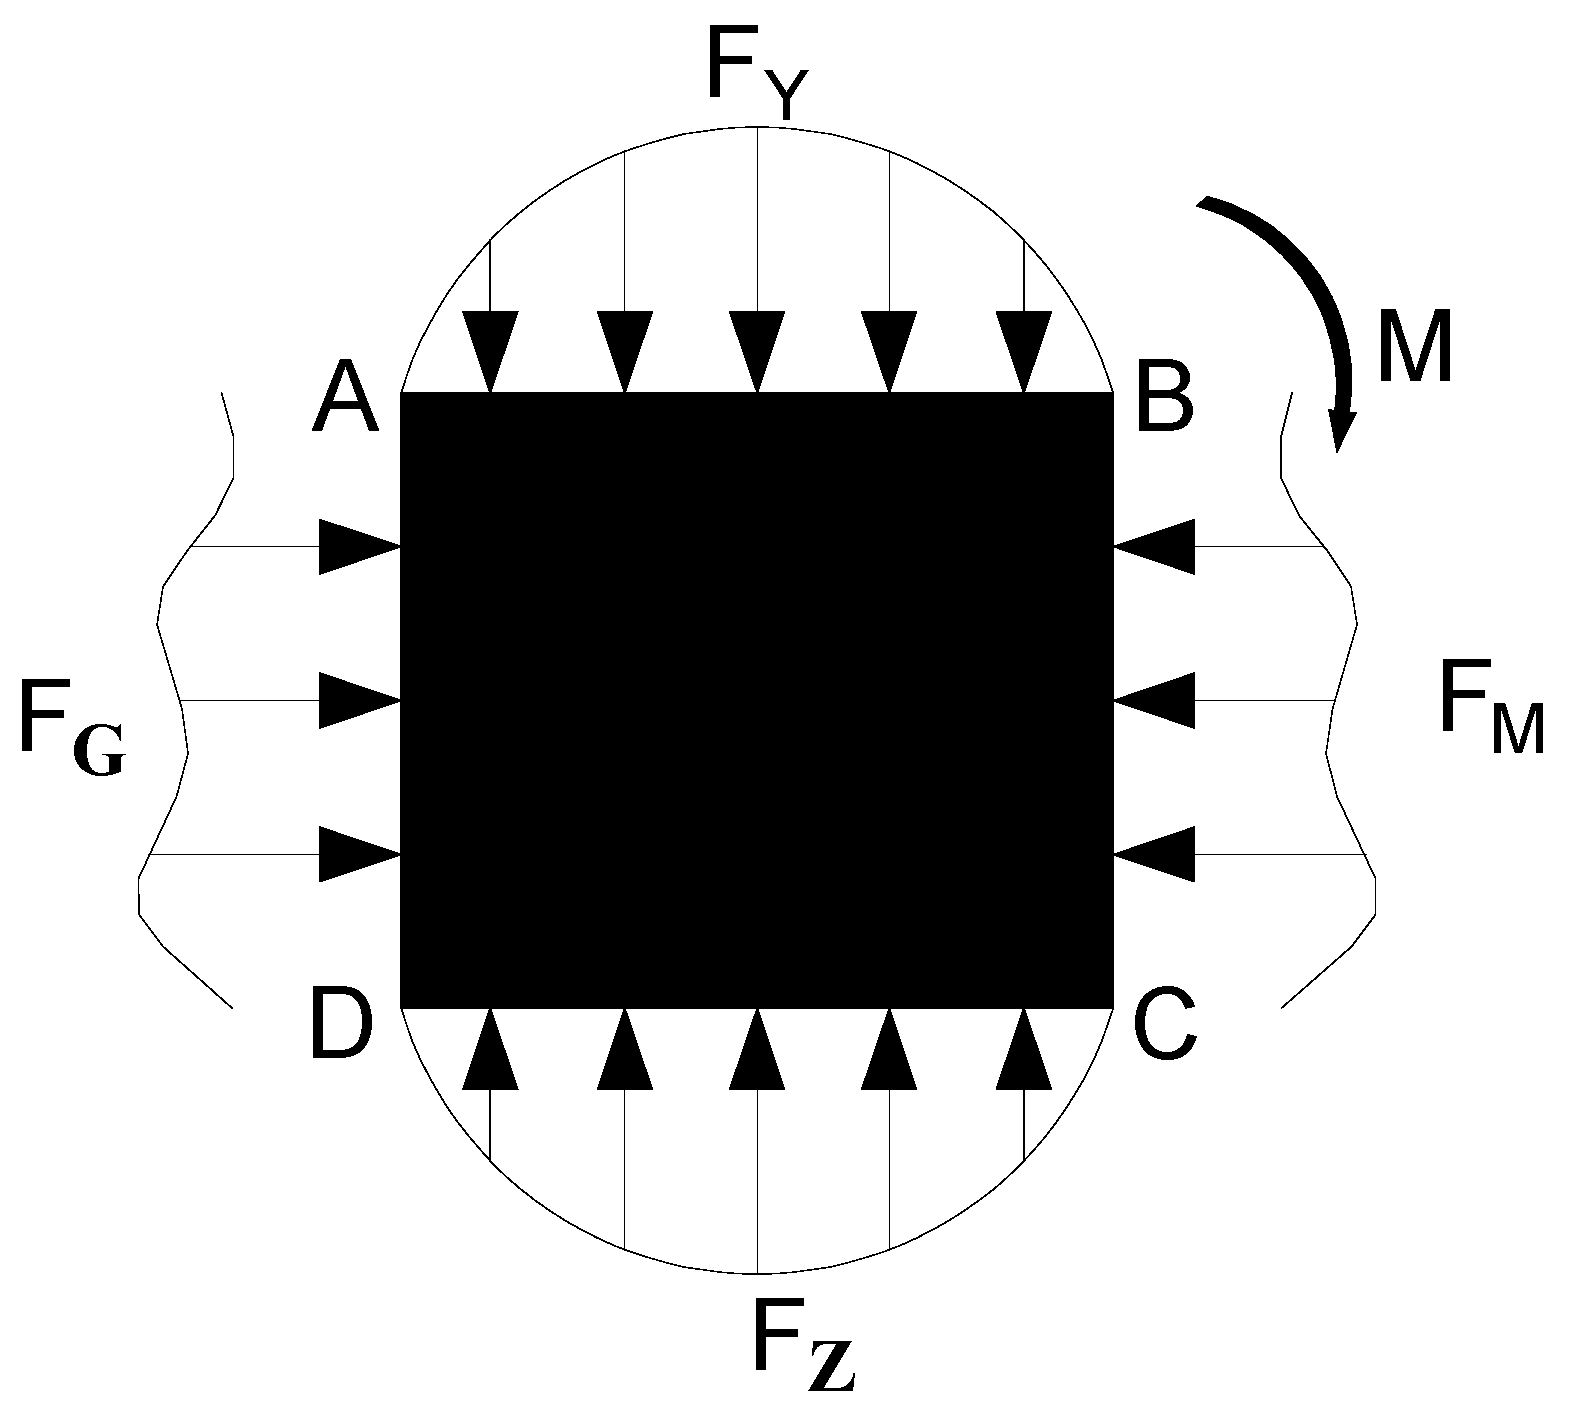
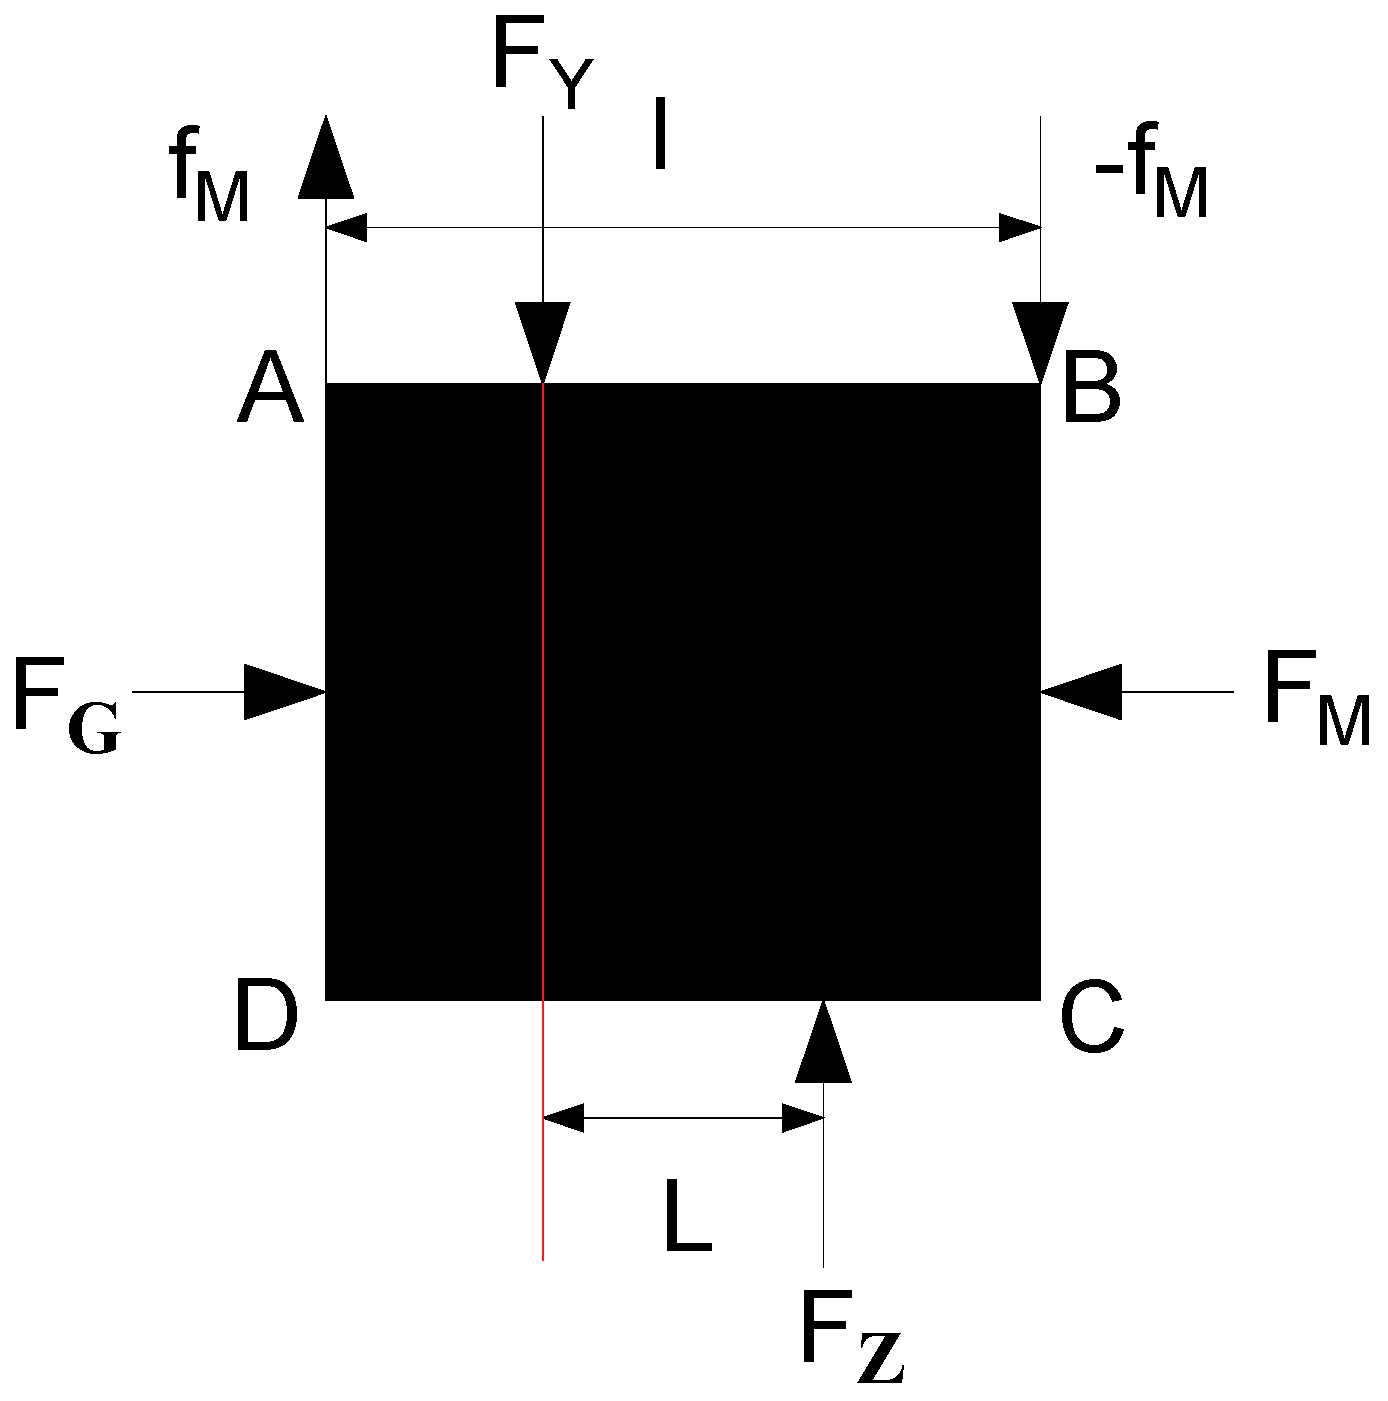
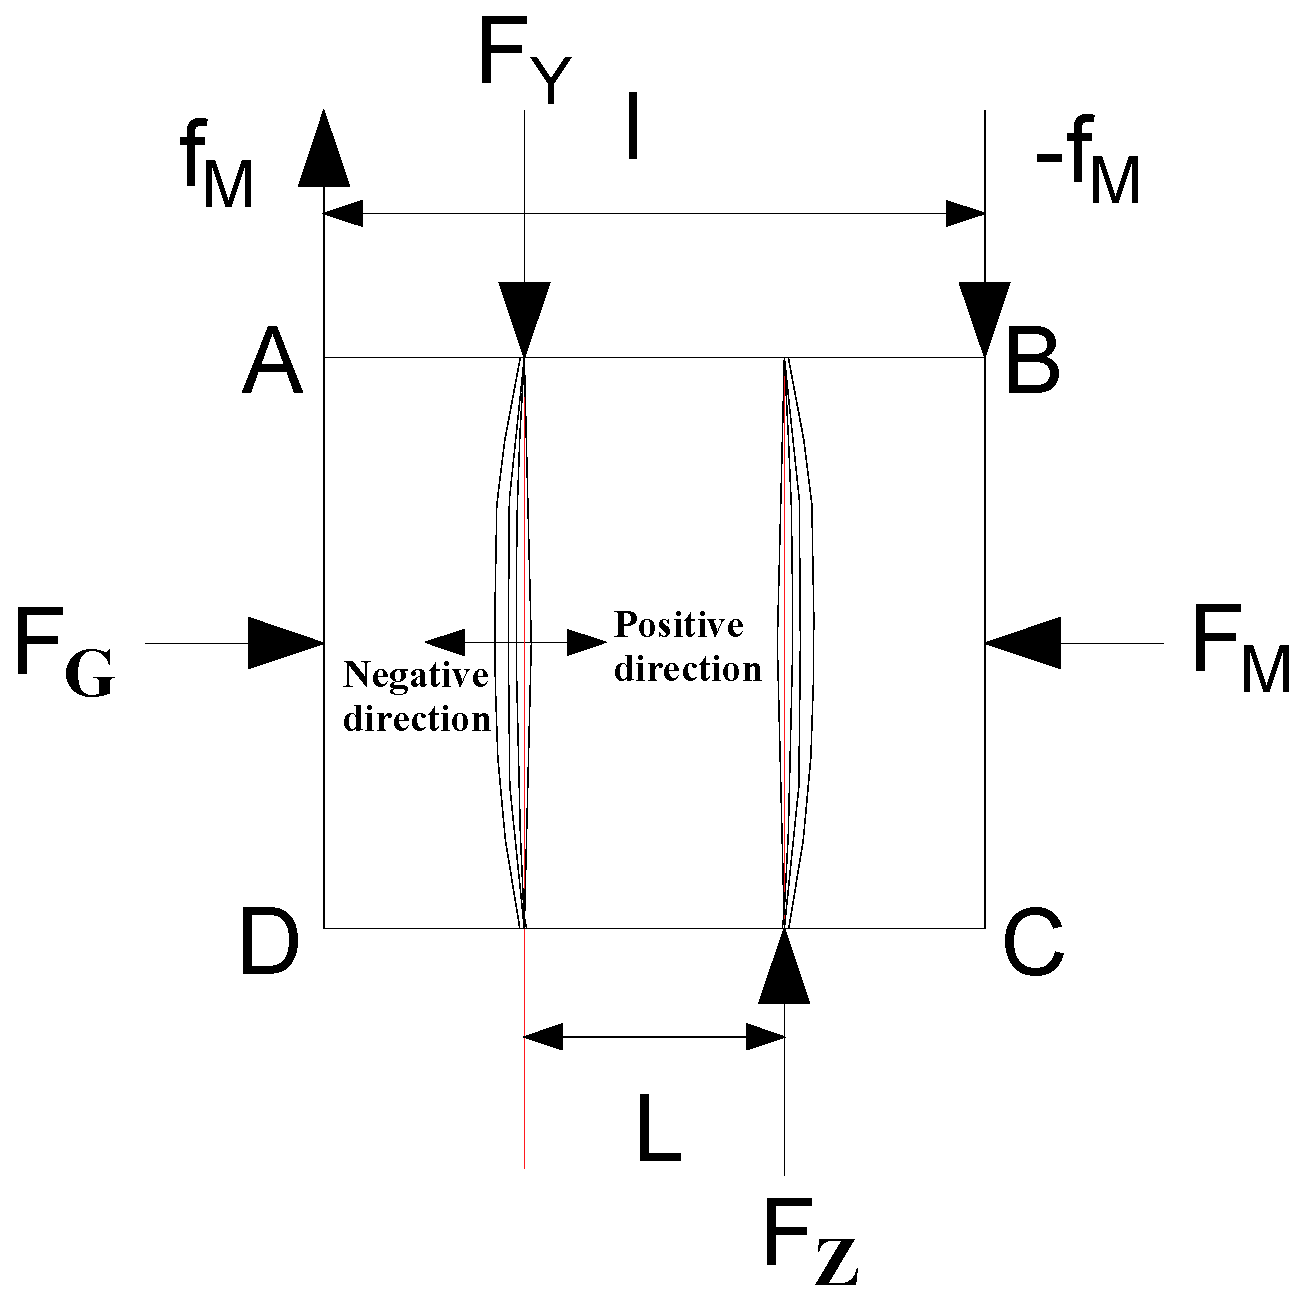
2.2. The Analysis of Coal Pillar Structure Mechanical Model
3. The Failure Law Analysis of Coal Pillar Structure
3.1. Setting Up the Numerical Model
3.2. Stress Characteristics of Coal Pillar in the Excavation Process of Gob-Side Entry Driving
3.3. Distribution Characteristics and Law of Dangerous Zones
4. Field Practice of Gob-Side Entry Driving
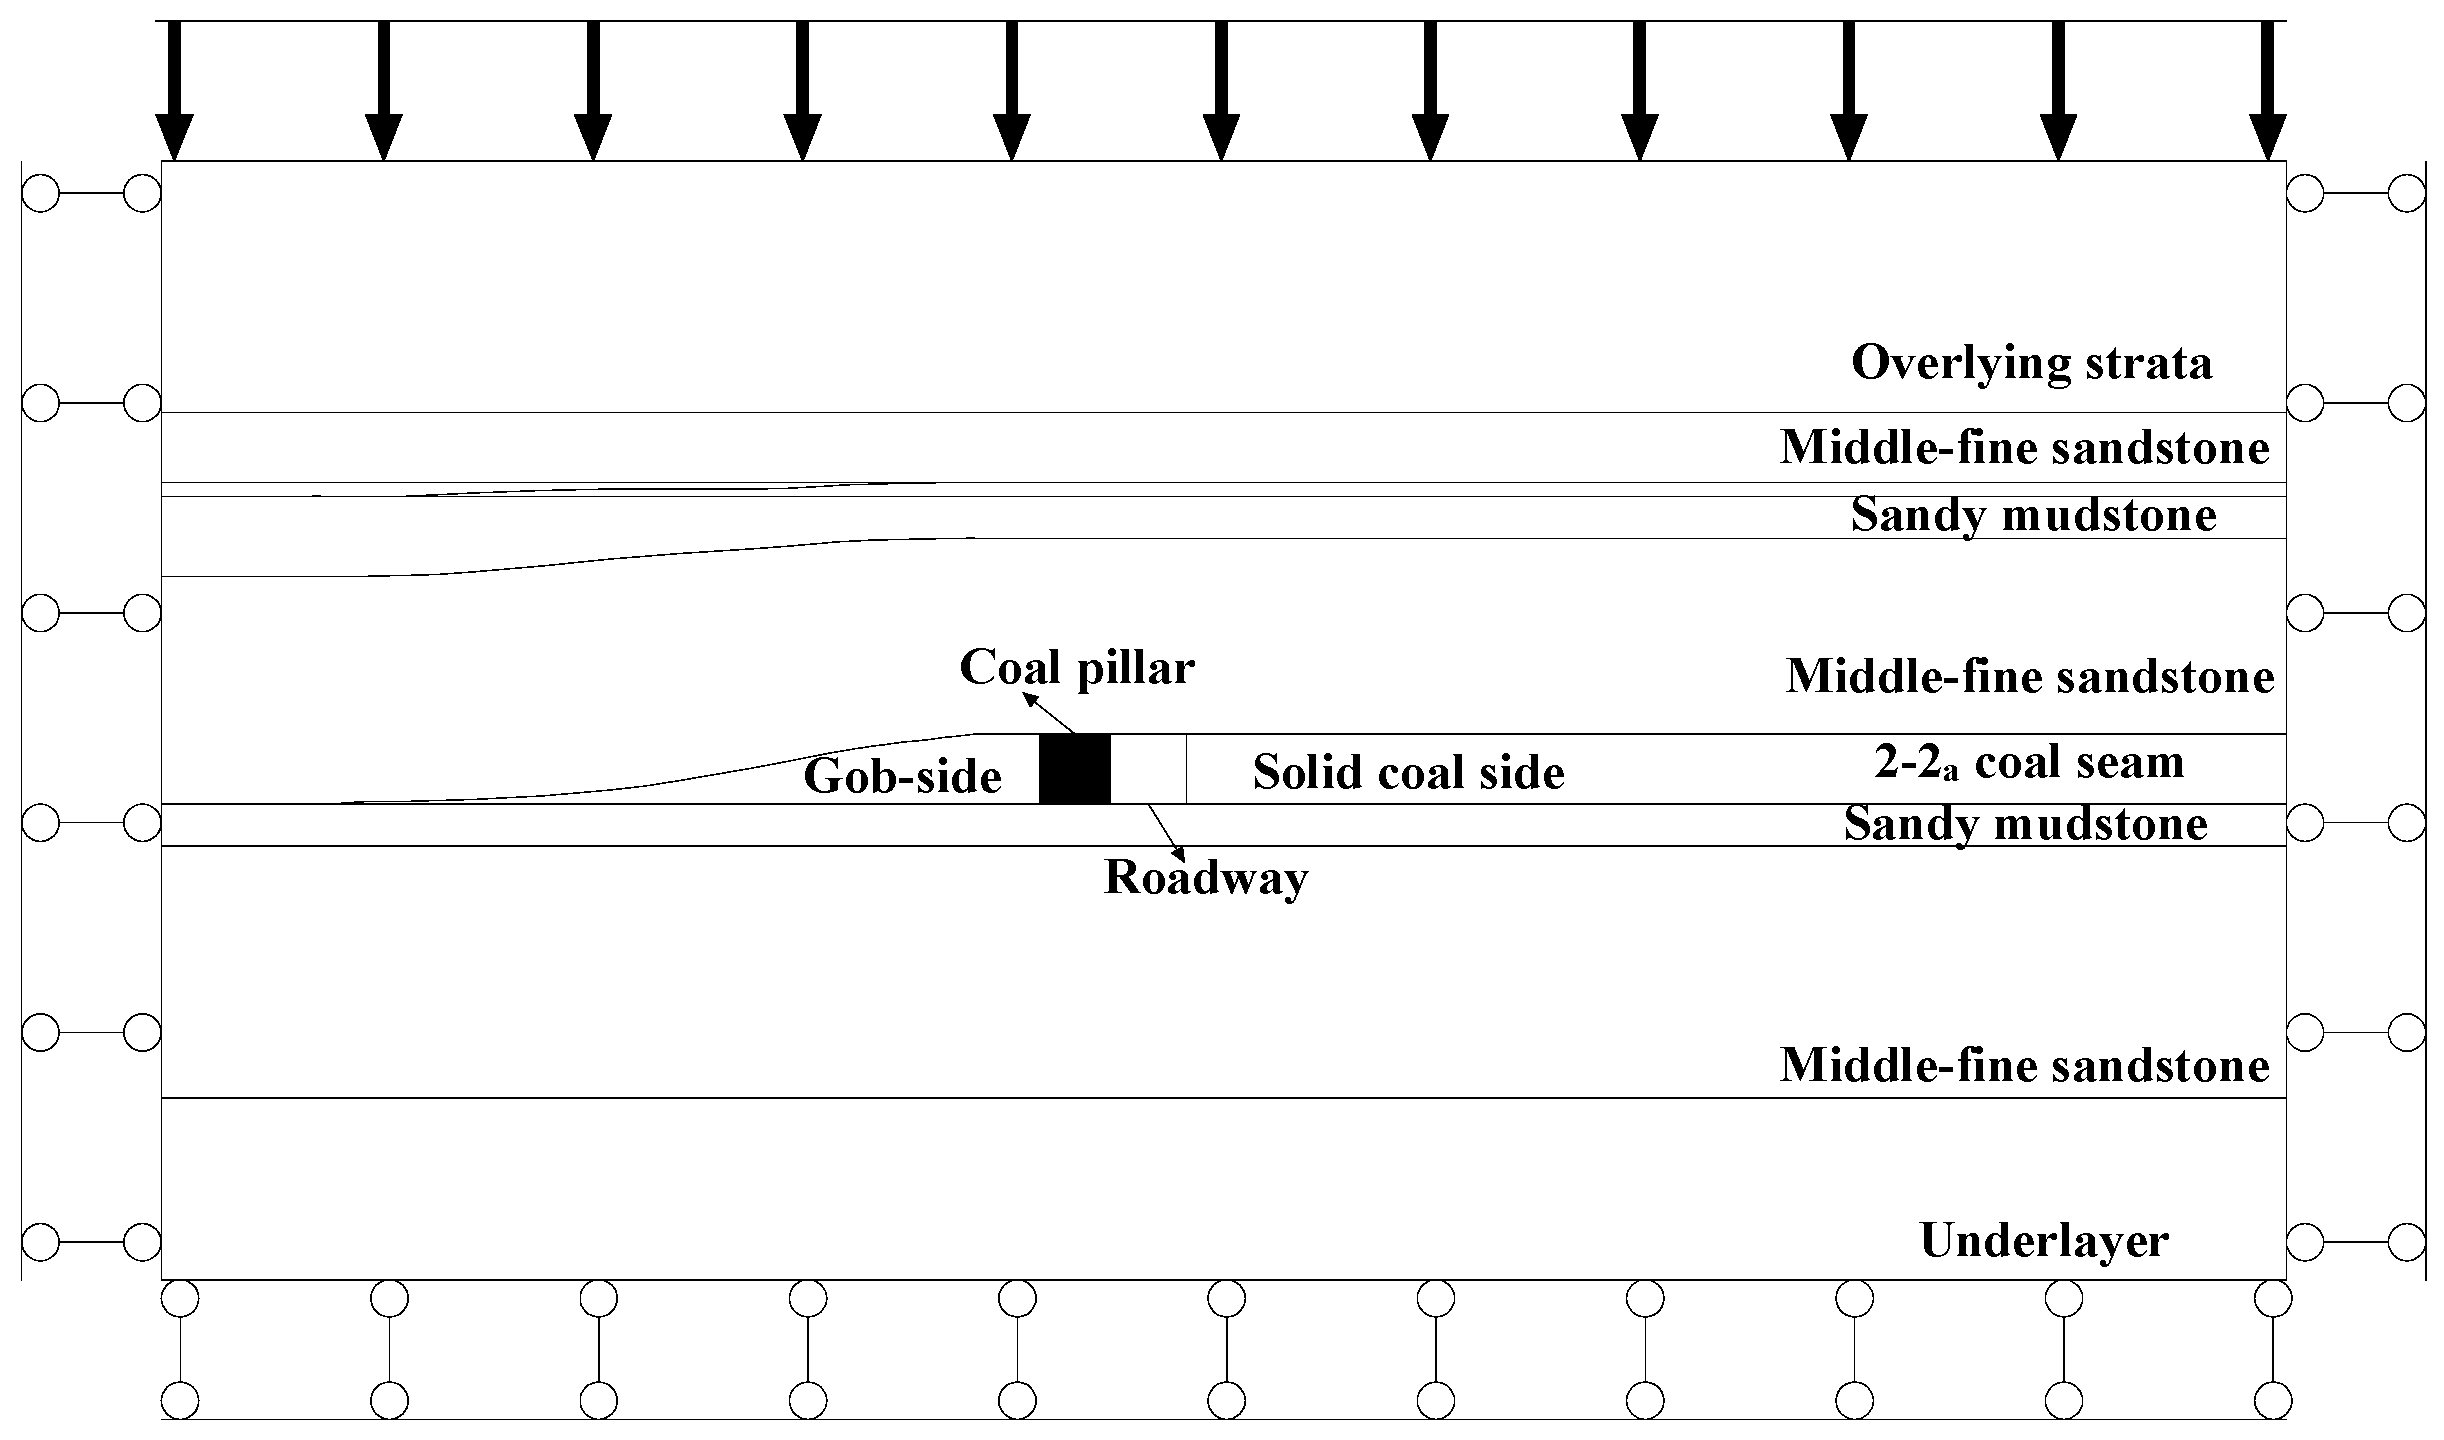
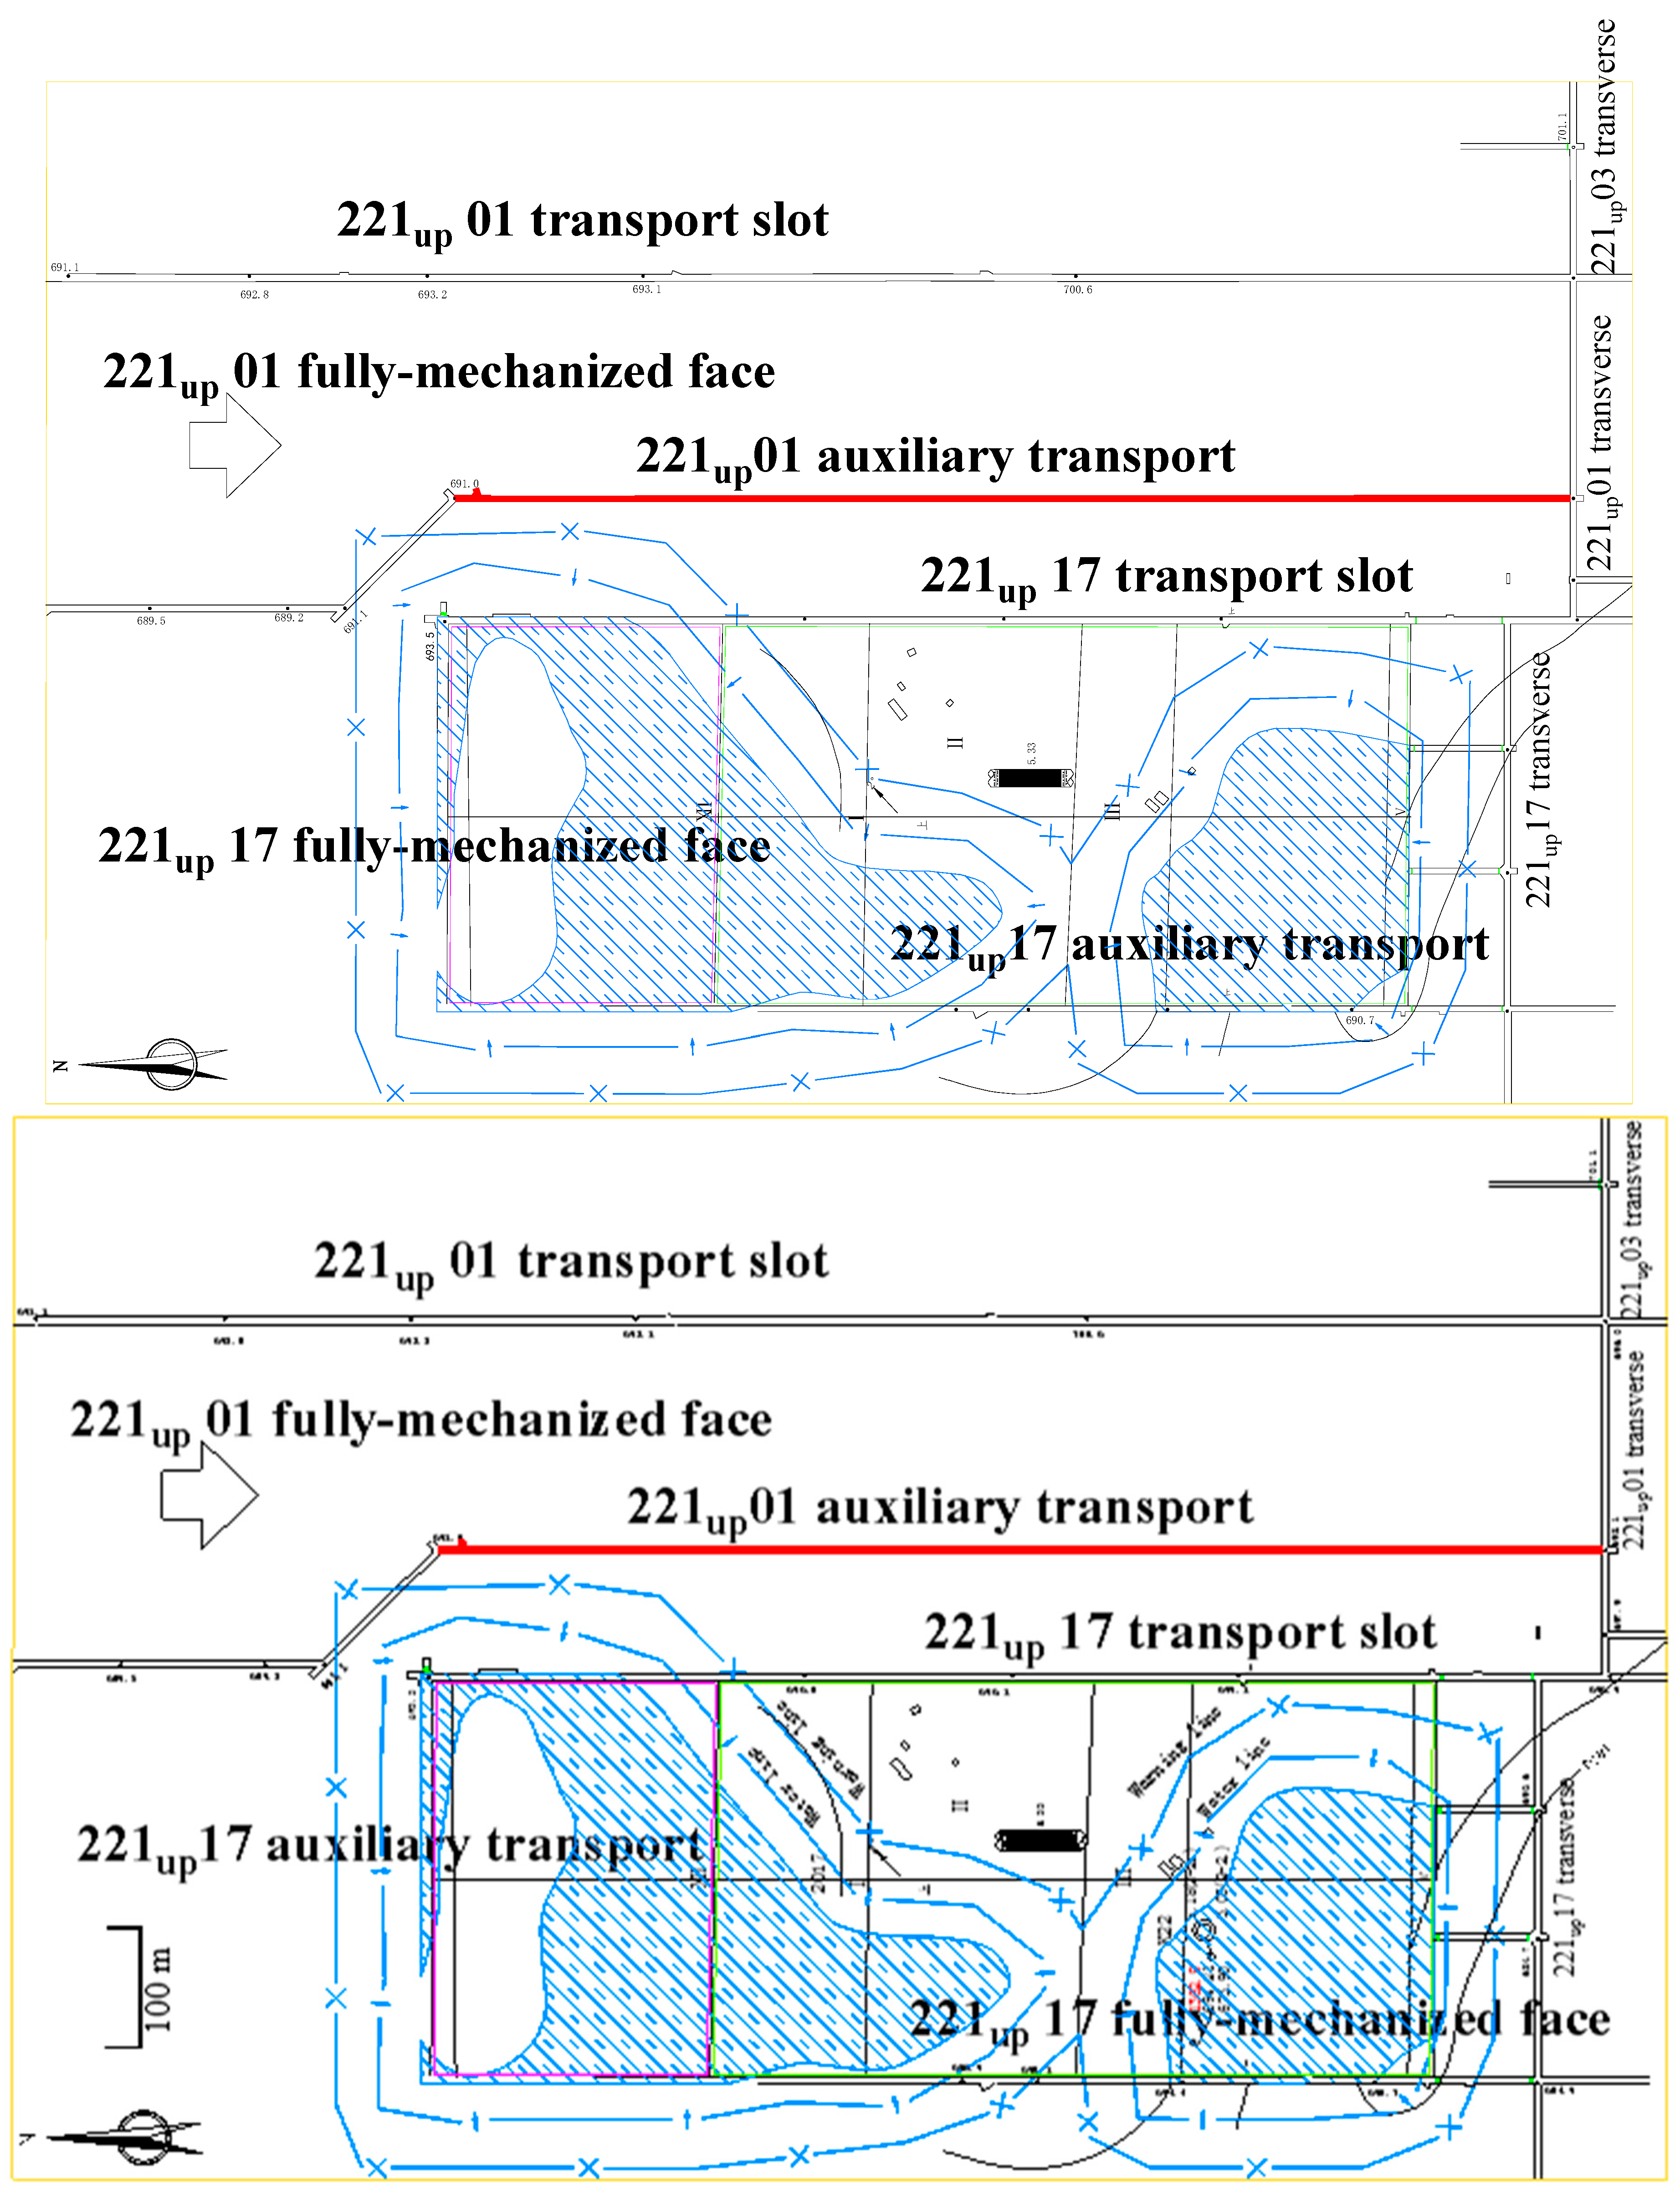
4.1. Engineering Geological Conditions
4.2. Field Support Conditions
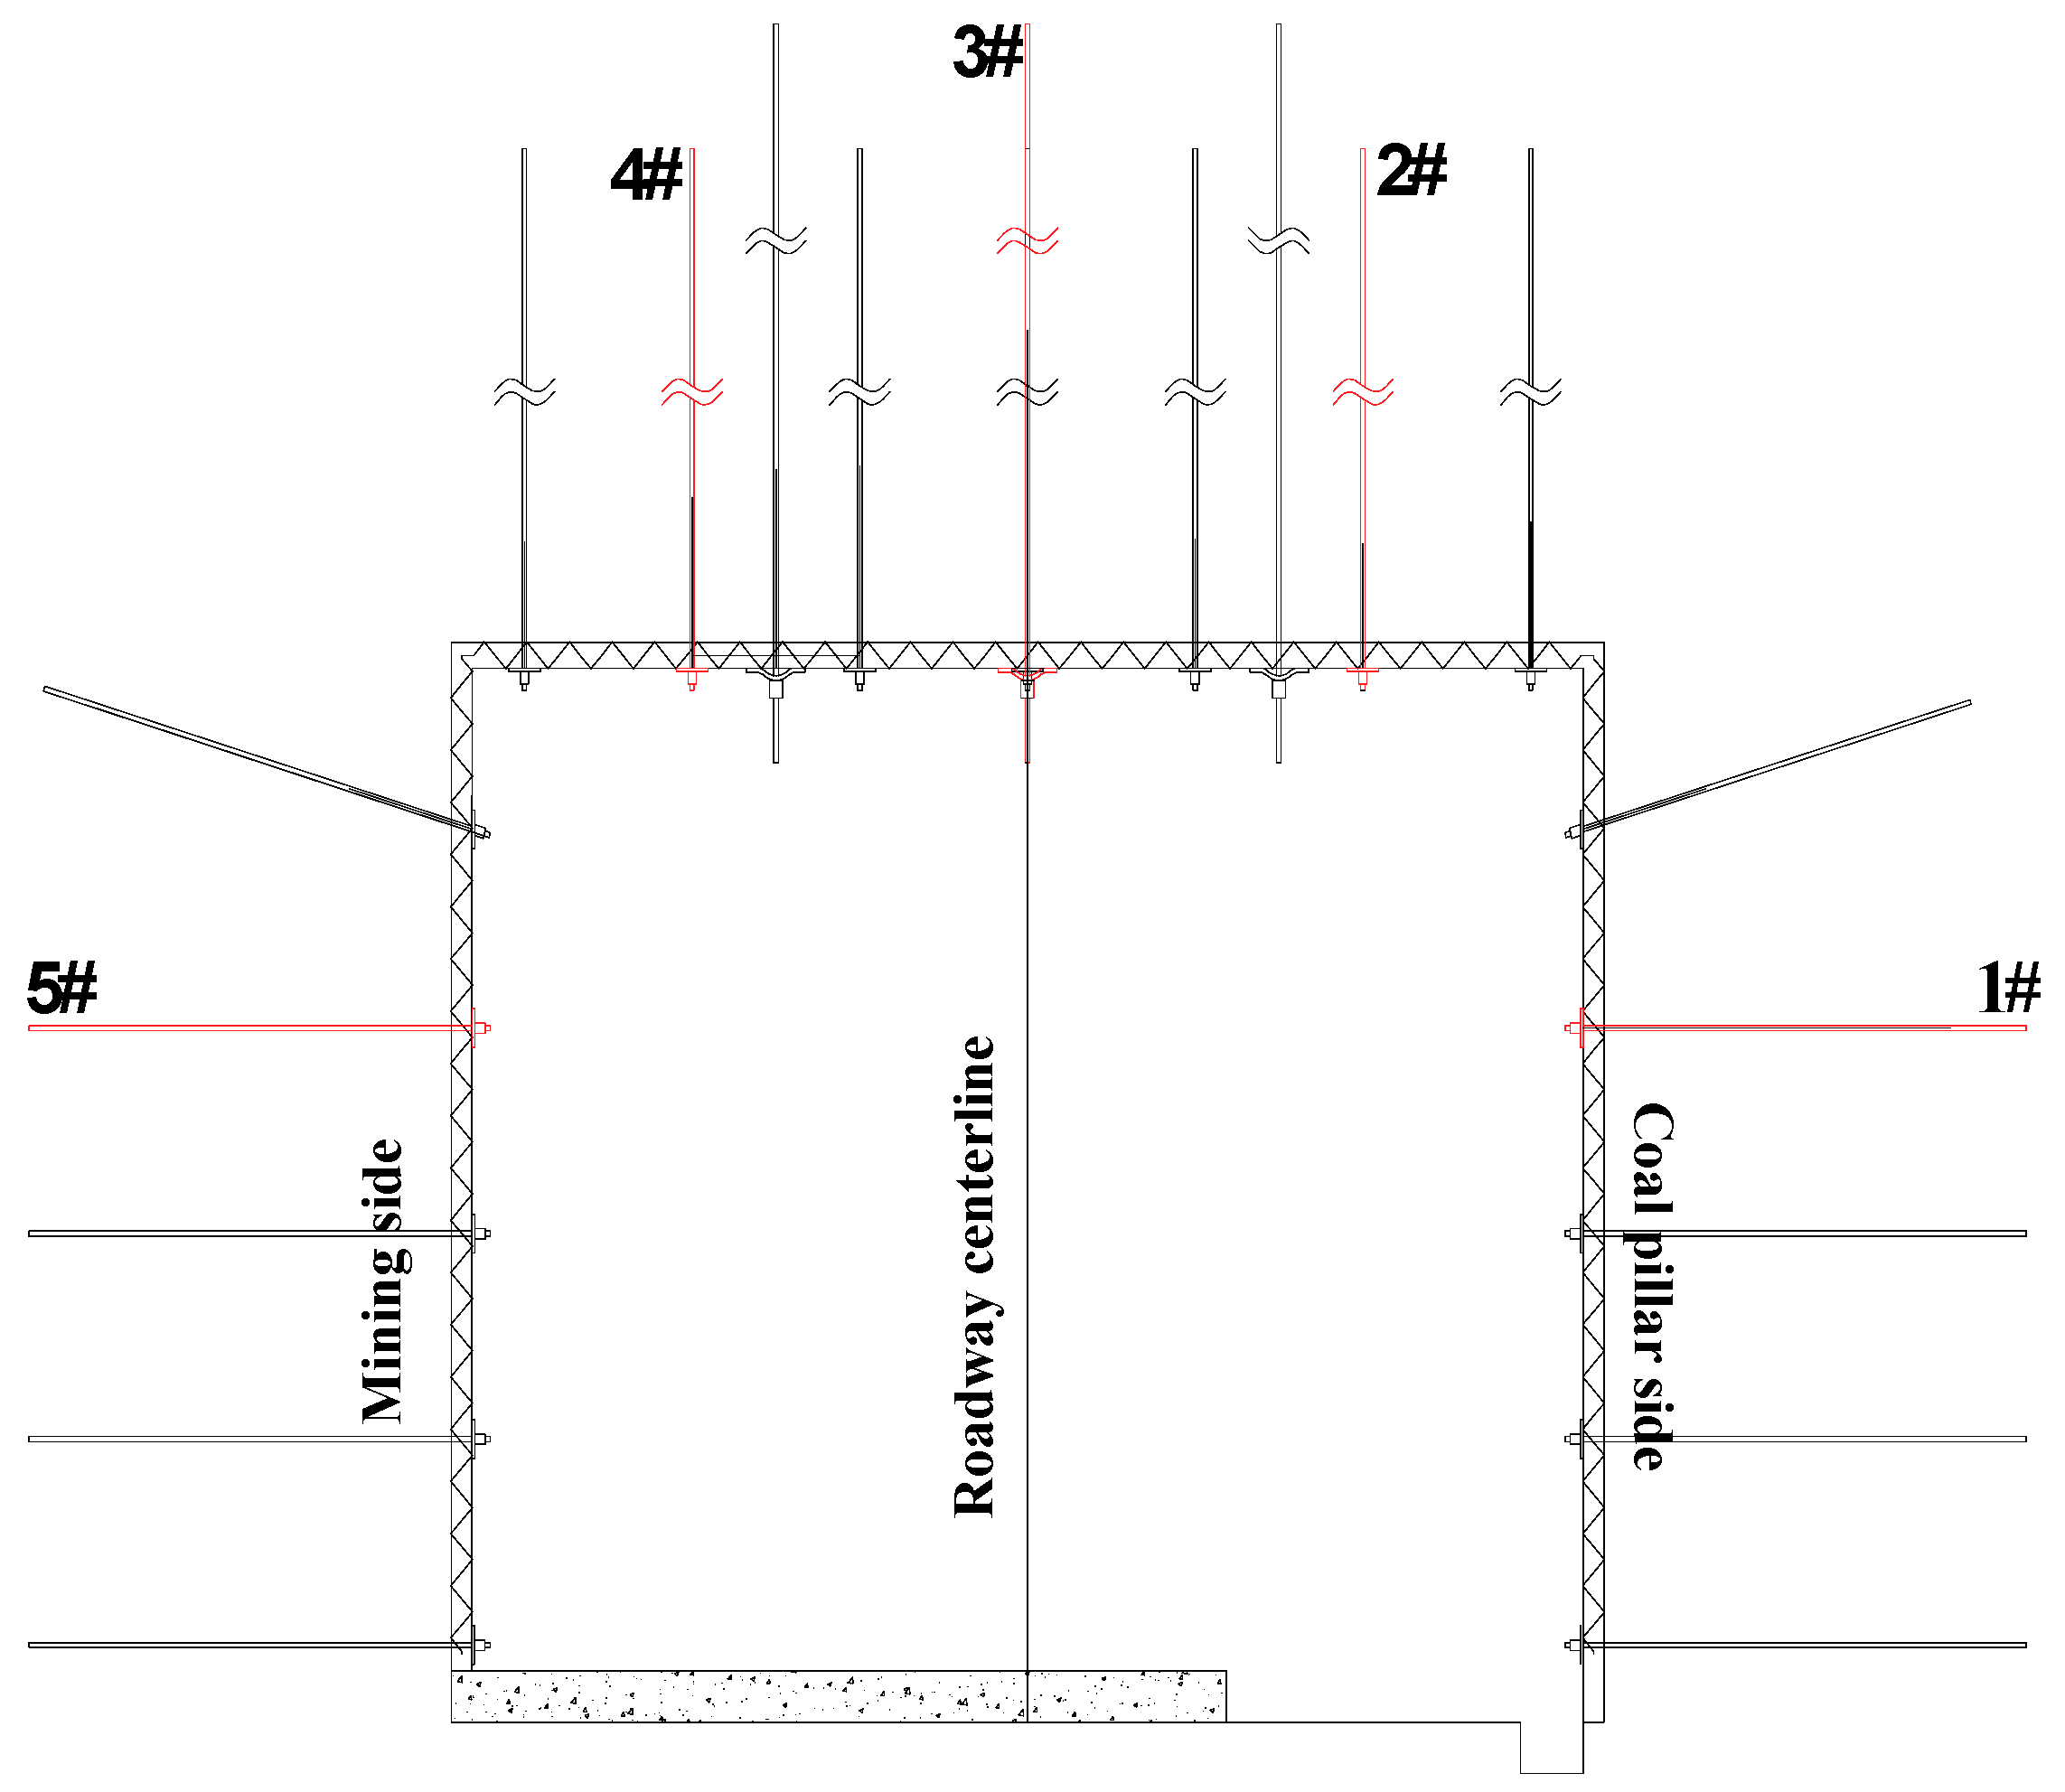
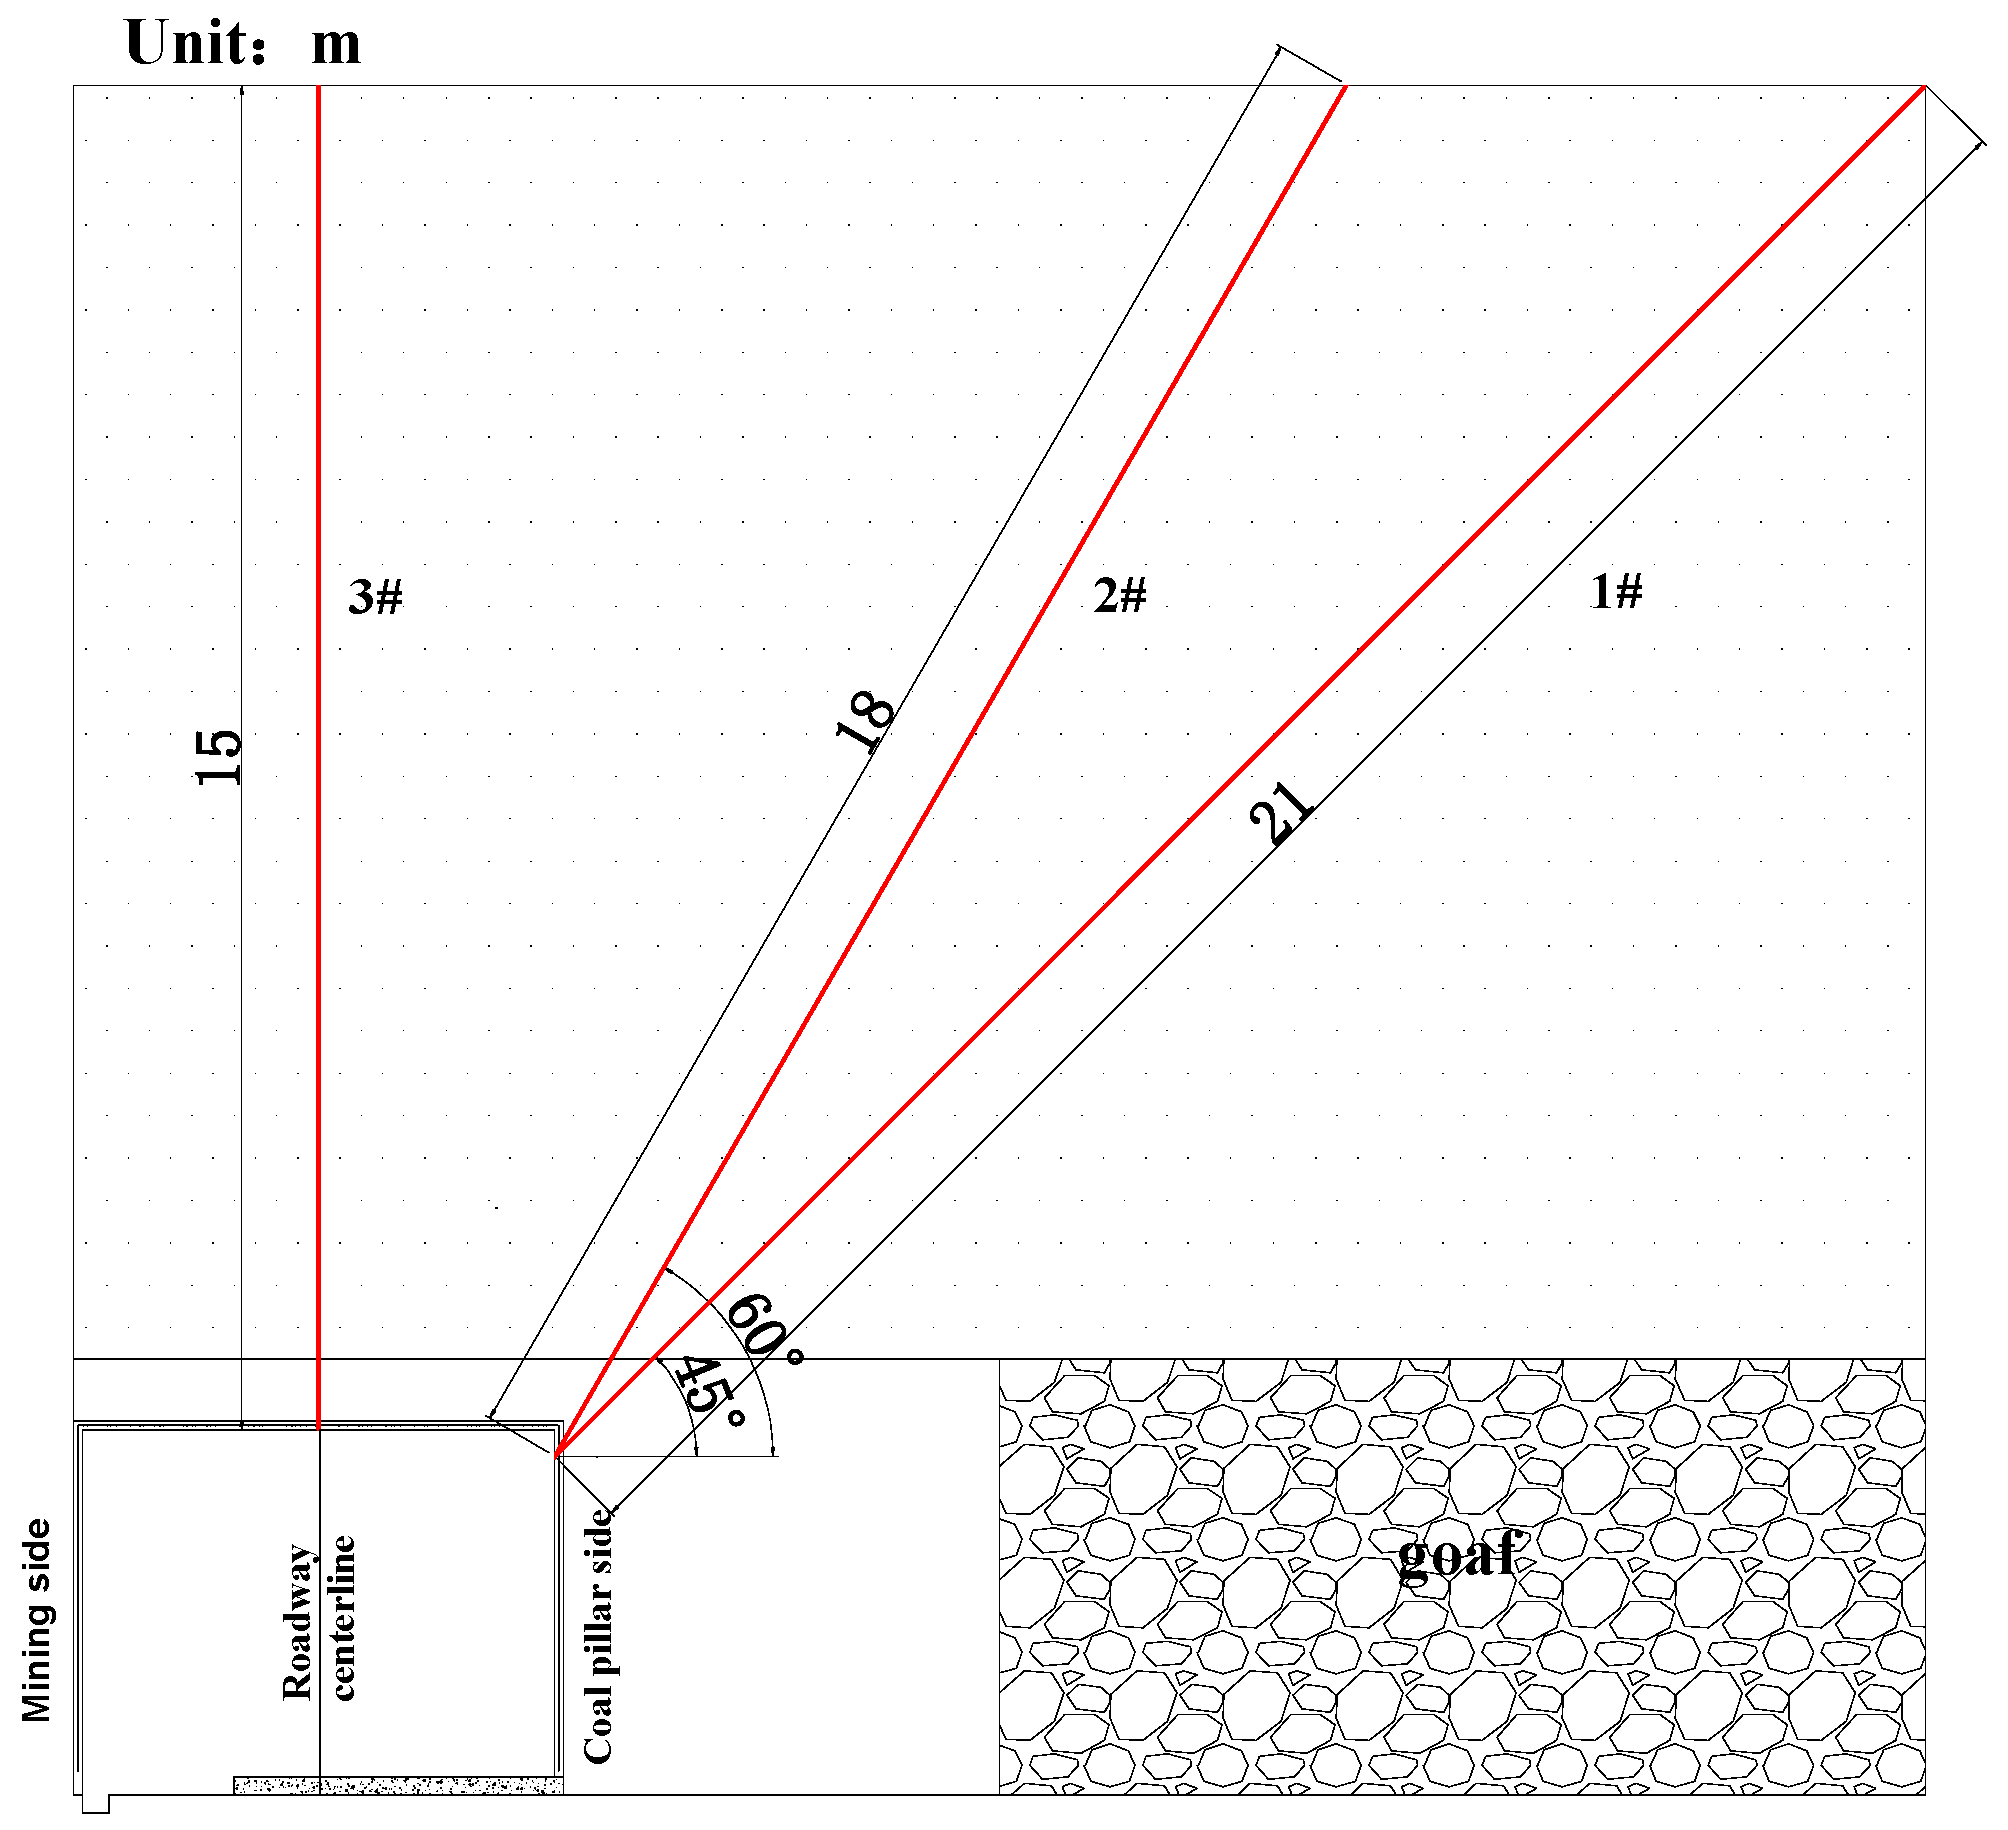
4.3. Field Measurement and Effect Analysis
5. Conclusions
- (1)
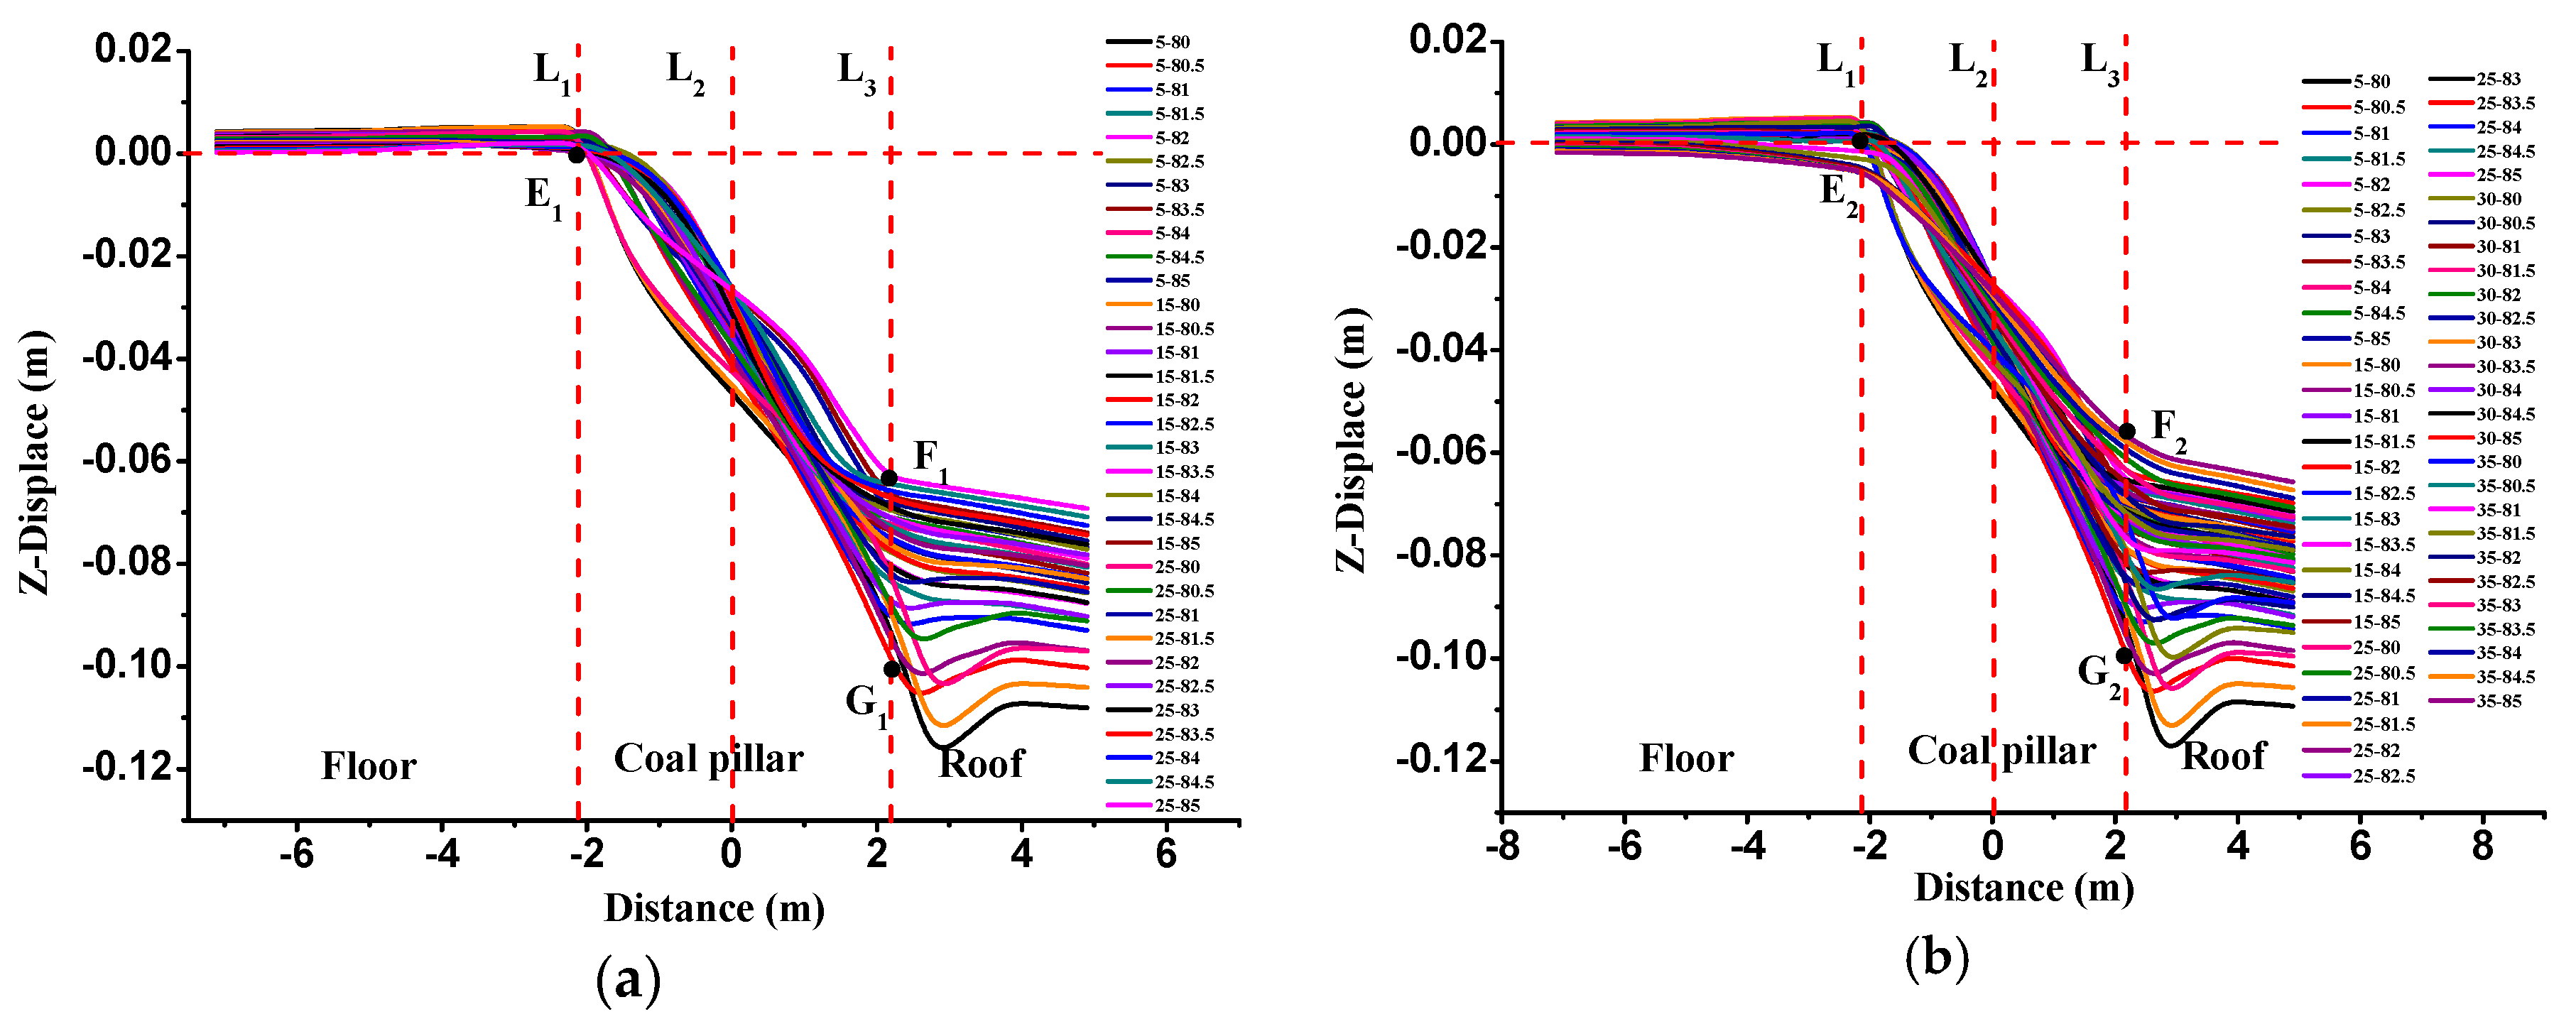
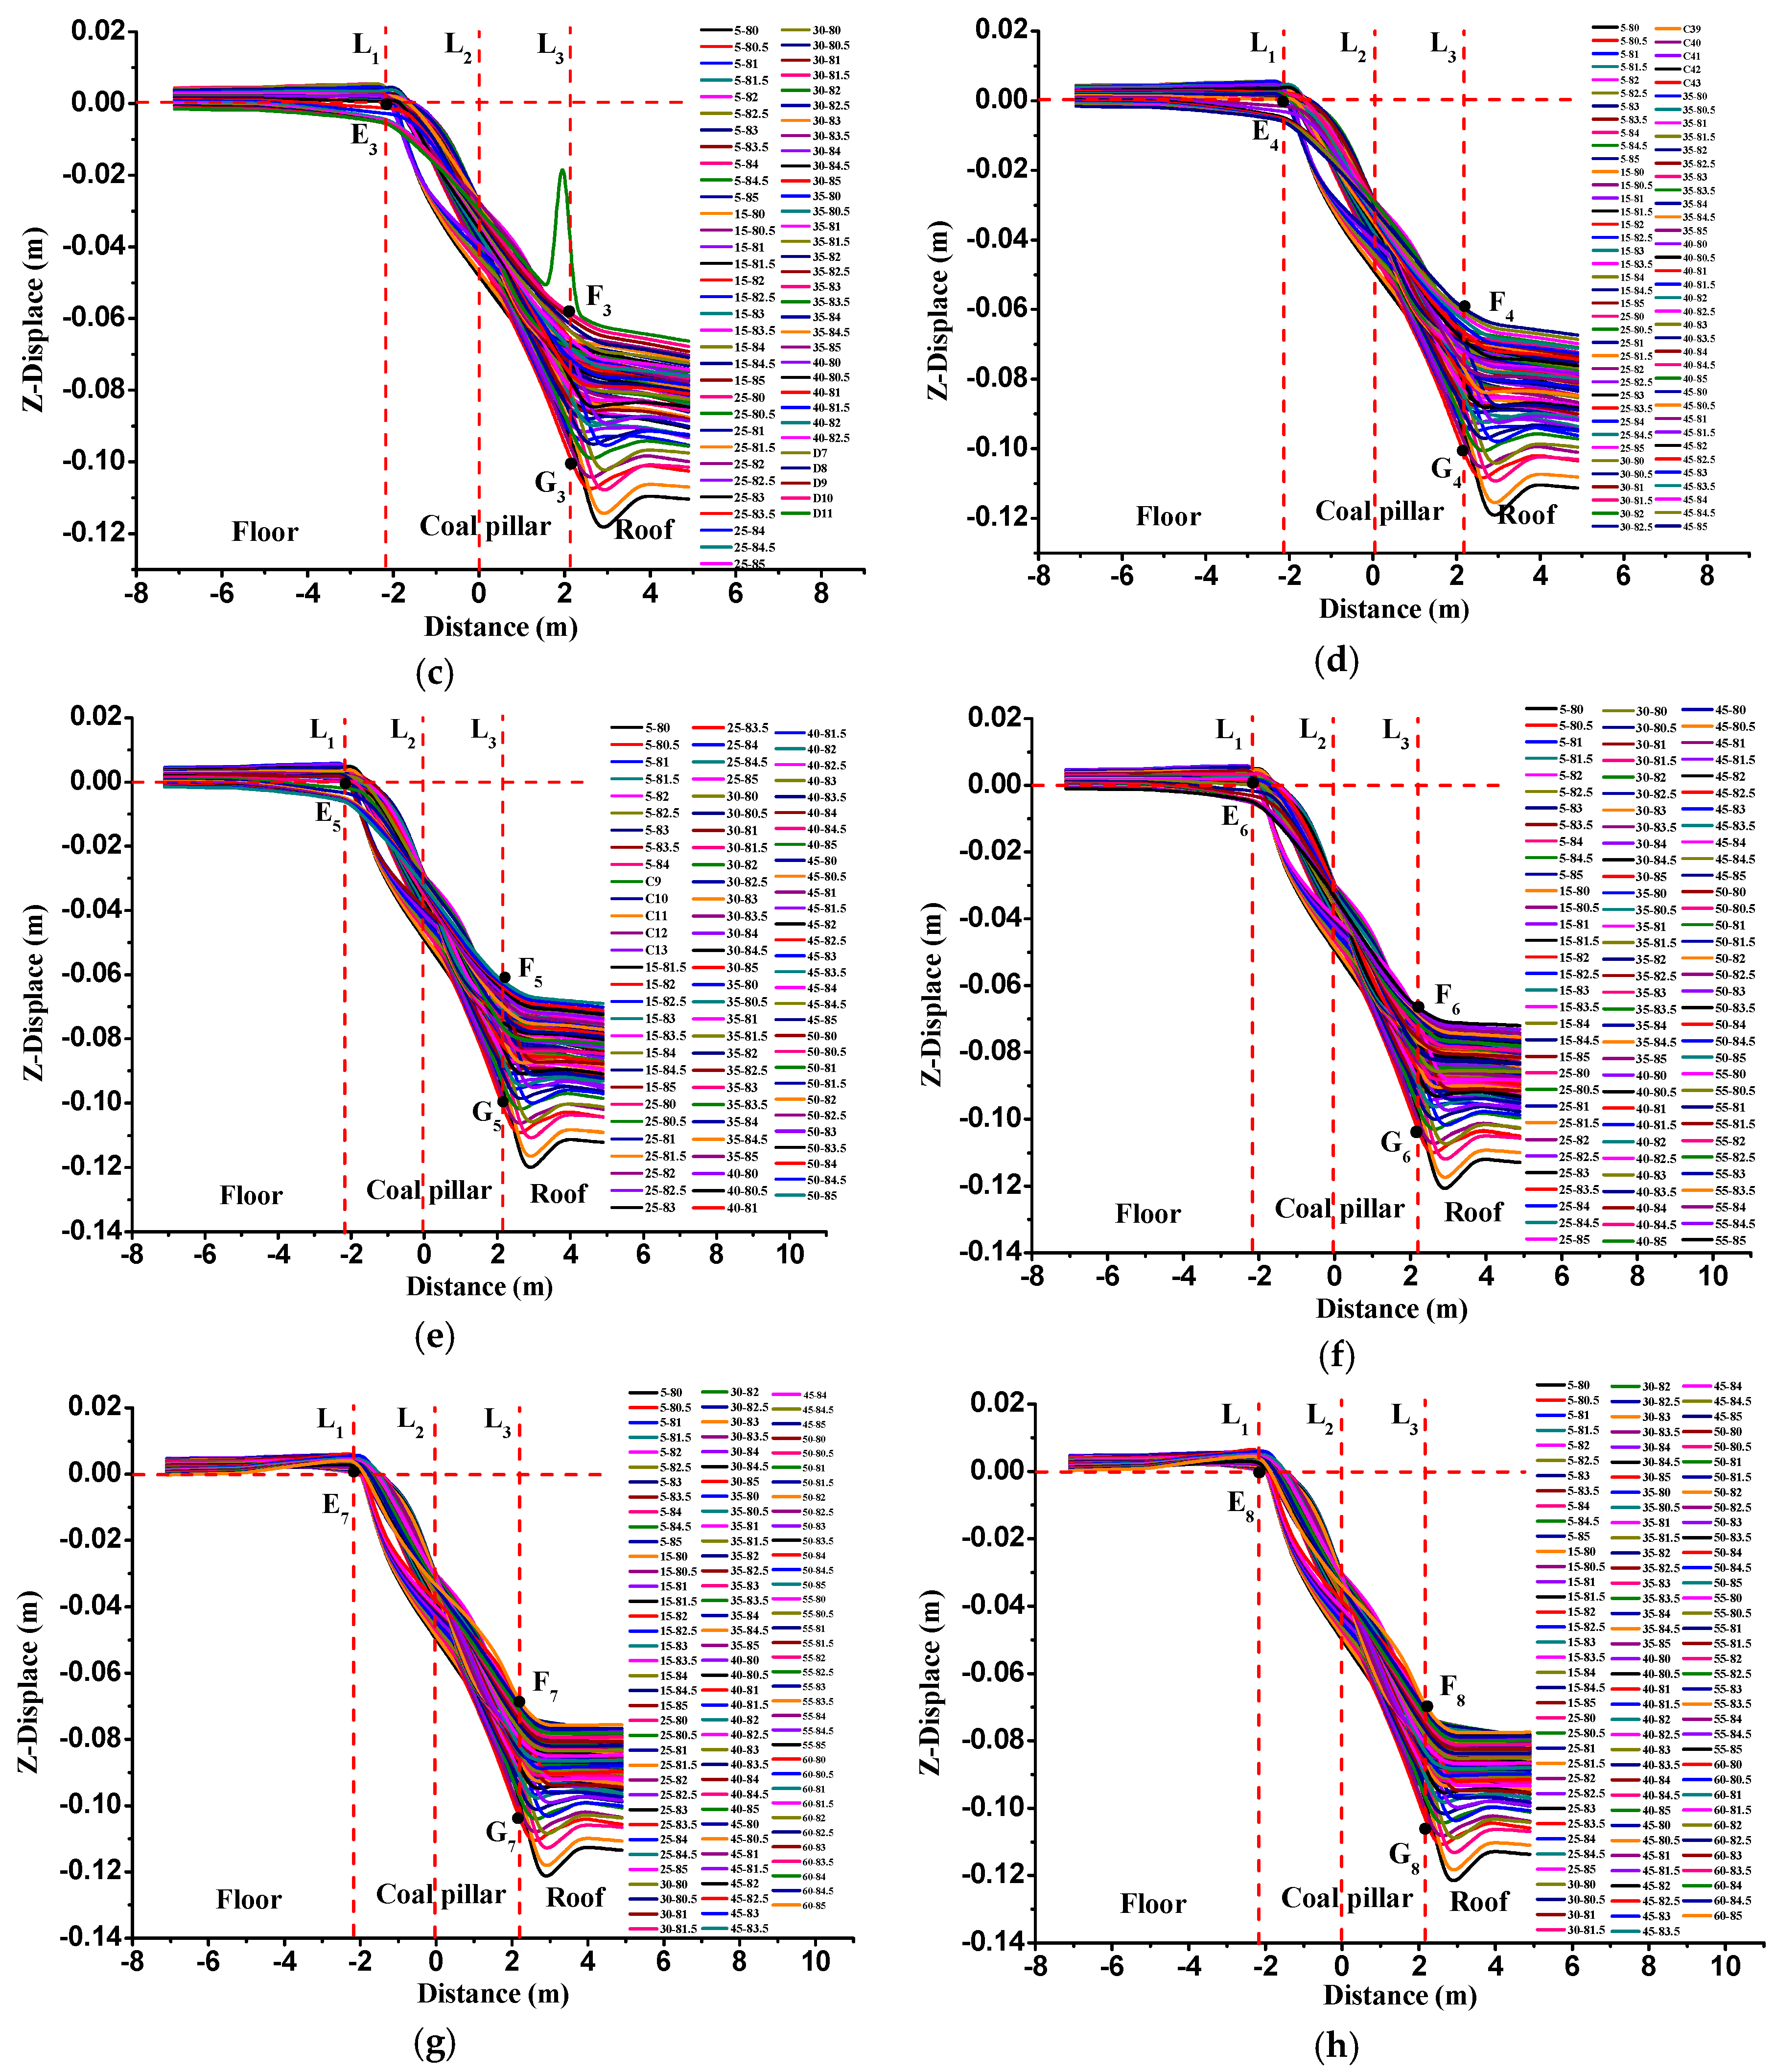
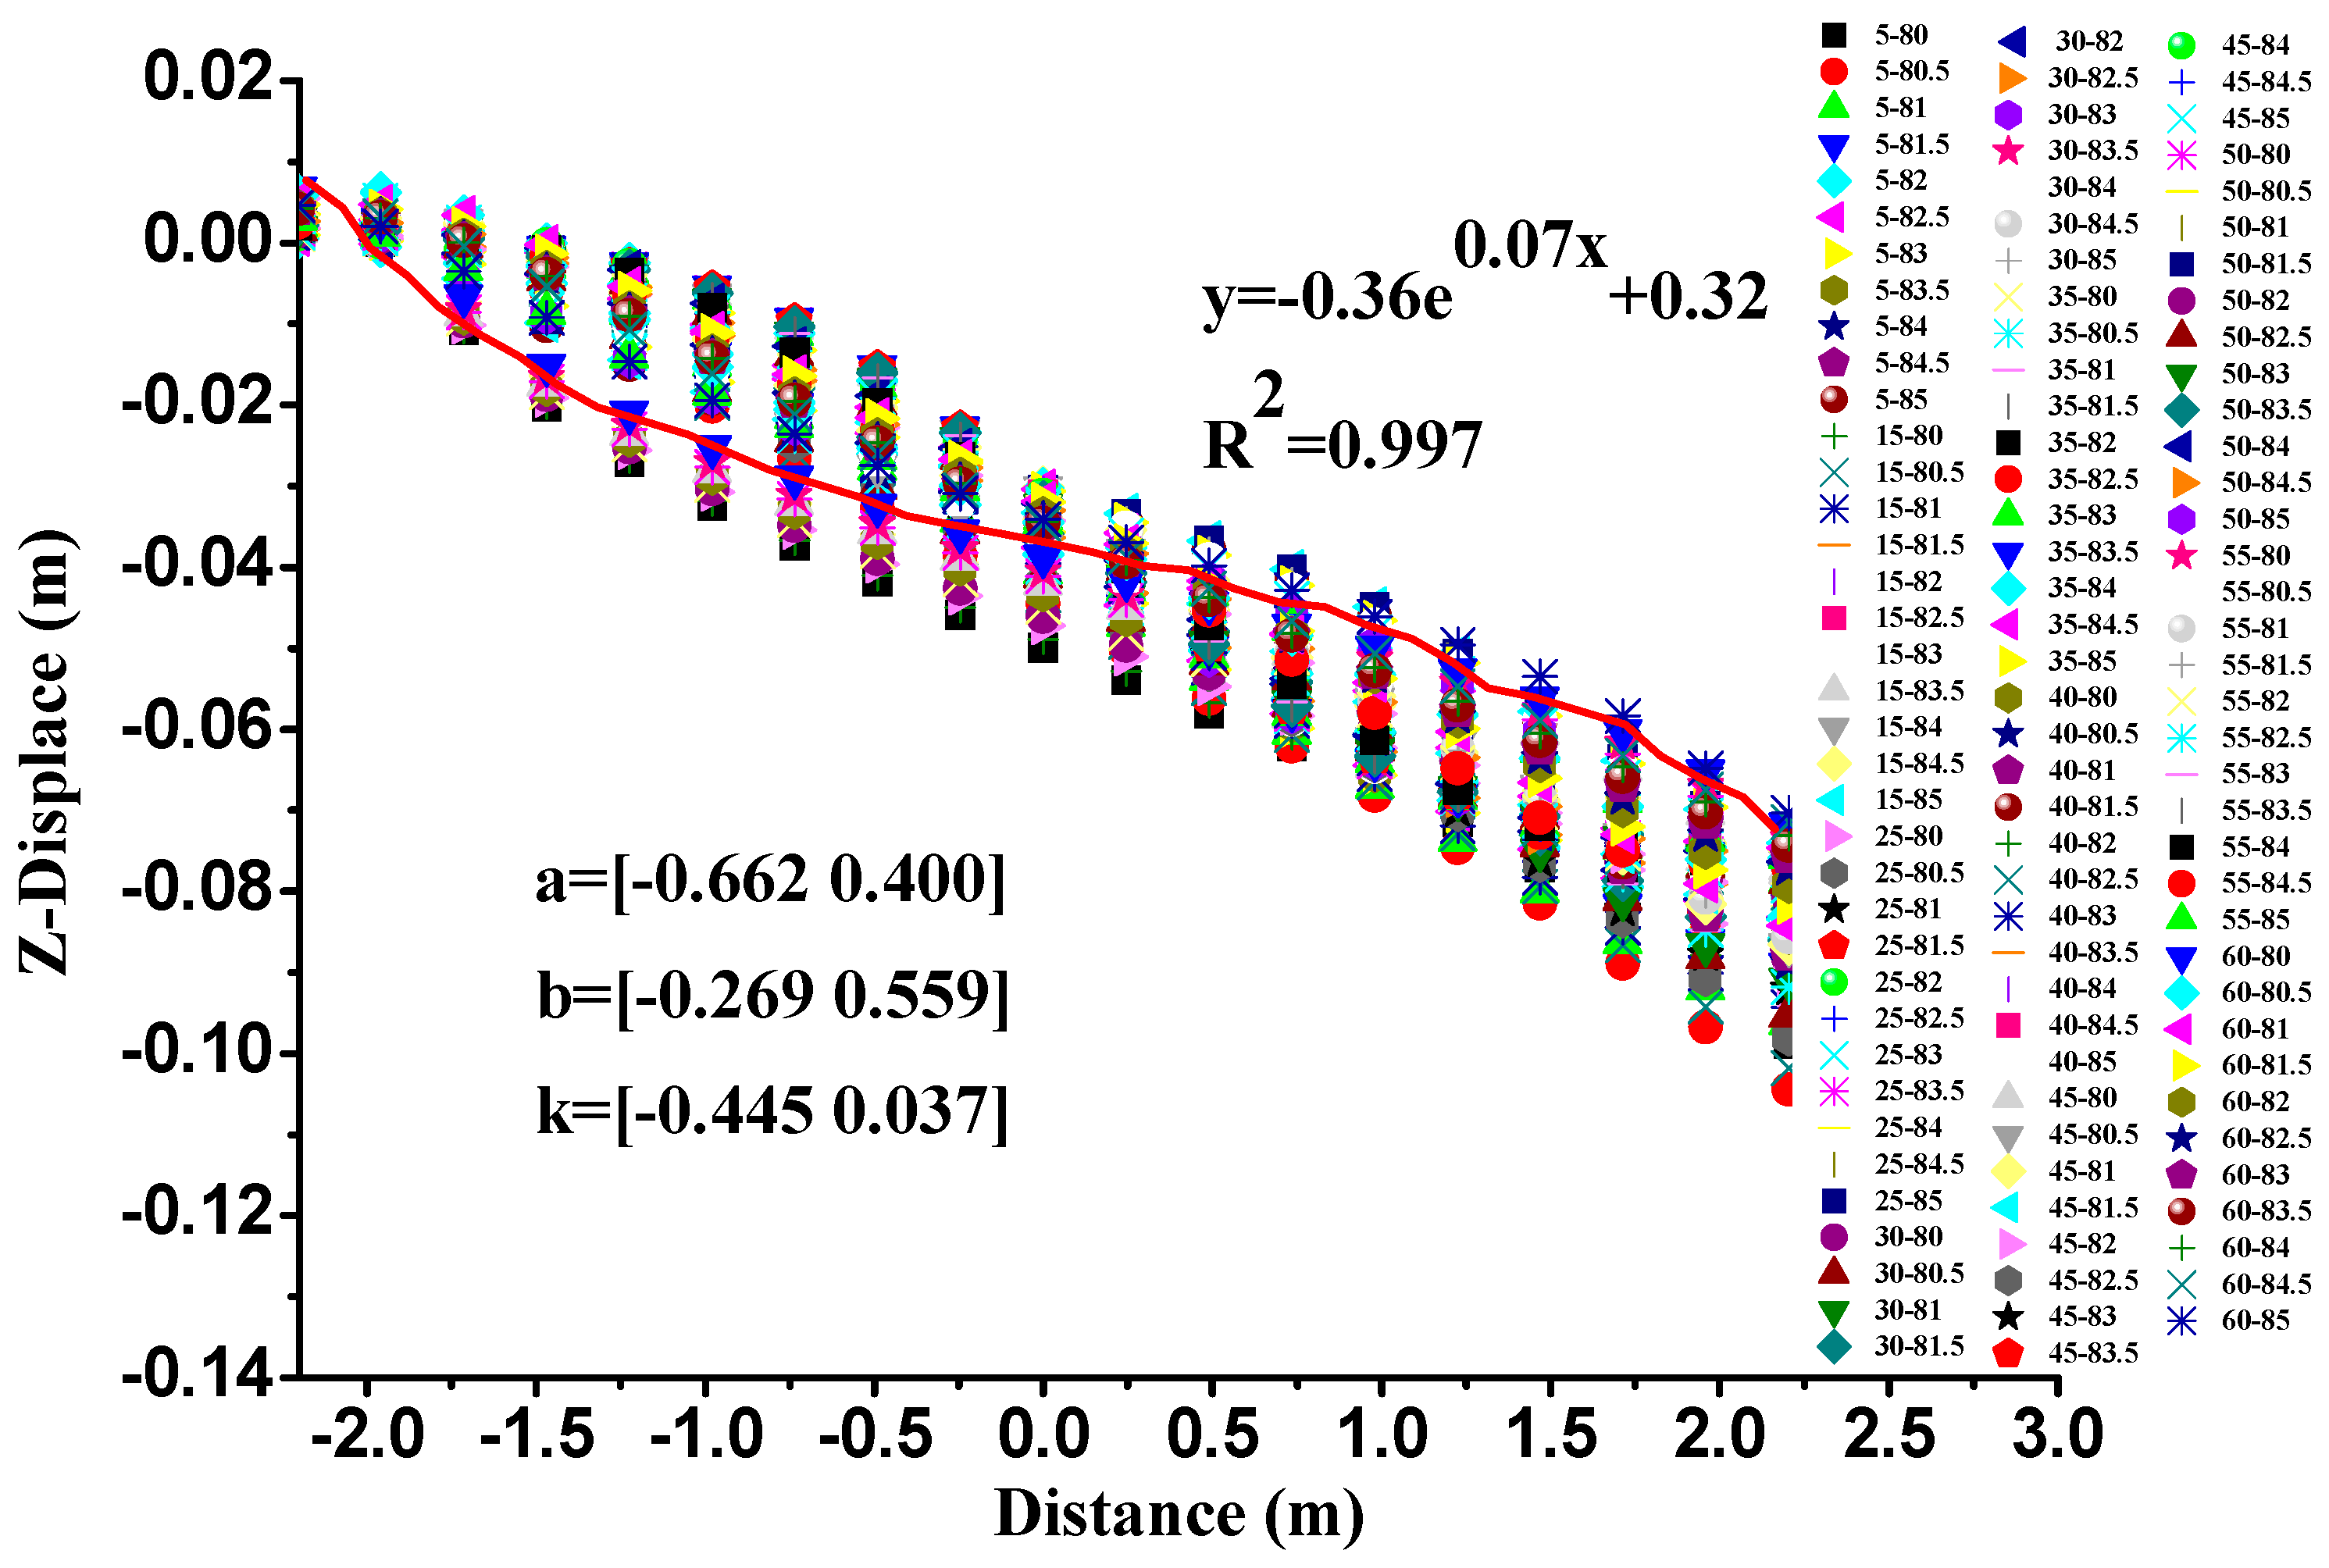
- A numerical model of coal pillar structure is established by constructing the key roof blocks of narrow coal pillar in the process of gob-side entry driving. Through analyzing the apparent steady state of the model established, it can be concluded that there exists a group of shear forces. Due to the heterogeneous transmission of overlying strata, the integrated shear force is located closer to the goaf side. Meanwhile, the strength of the integrated shear force is mainly related with the fracture length of key blocks of overlying strata and the joint development state inside coal pillars. Under the action of the integrated shear force, displacements occur in opposite directions inside the coal pillar structure. All the displacement control points, when connected, constitute a concave surface inside the coal pillar. The curve formed in the plane vertical to the axis of the coal pillar is called the “instability critical line”. This critical line is also the area where displacement is most likely to occur and thus instability and failure are occurrence of the highest probability inside the coal pillar structure.
- (2)
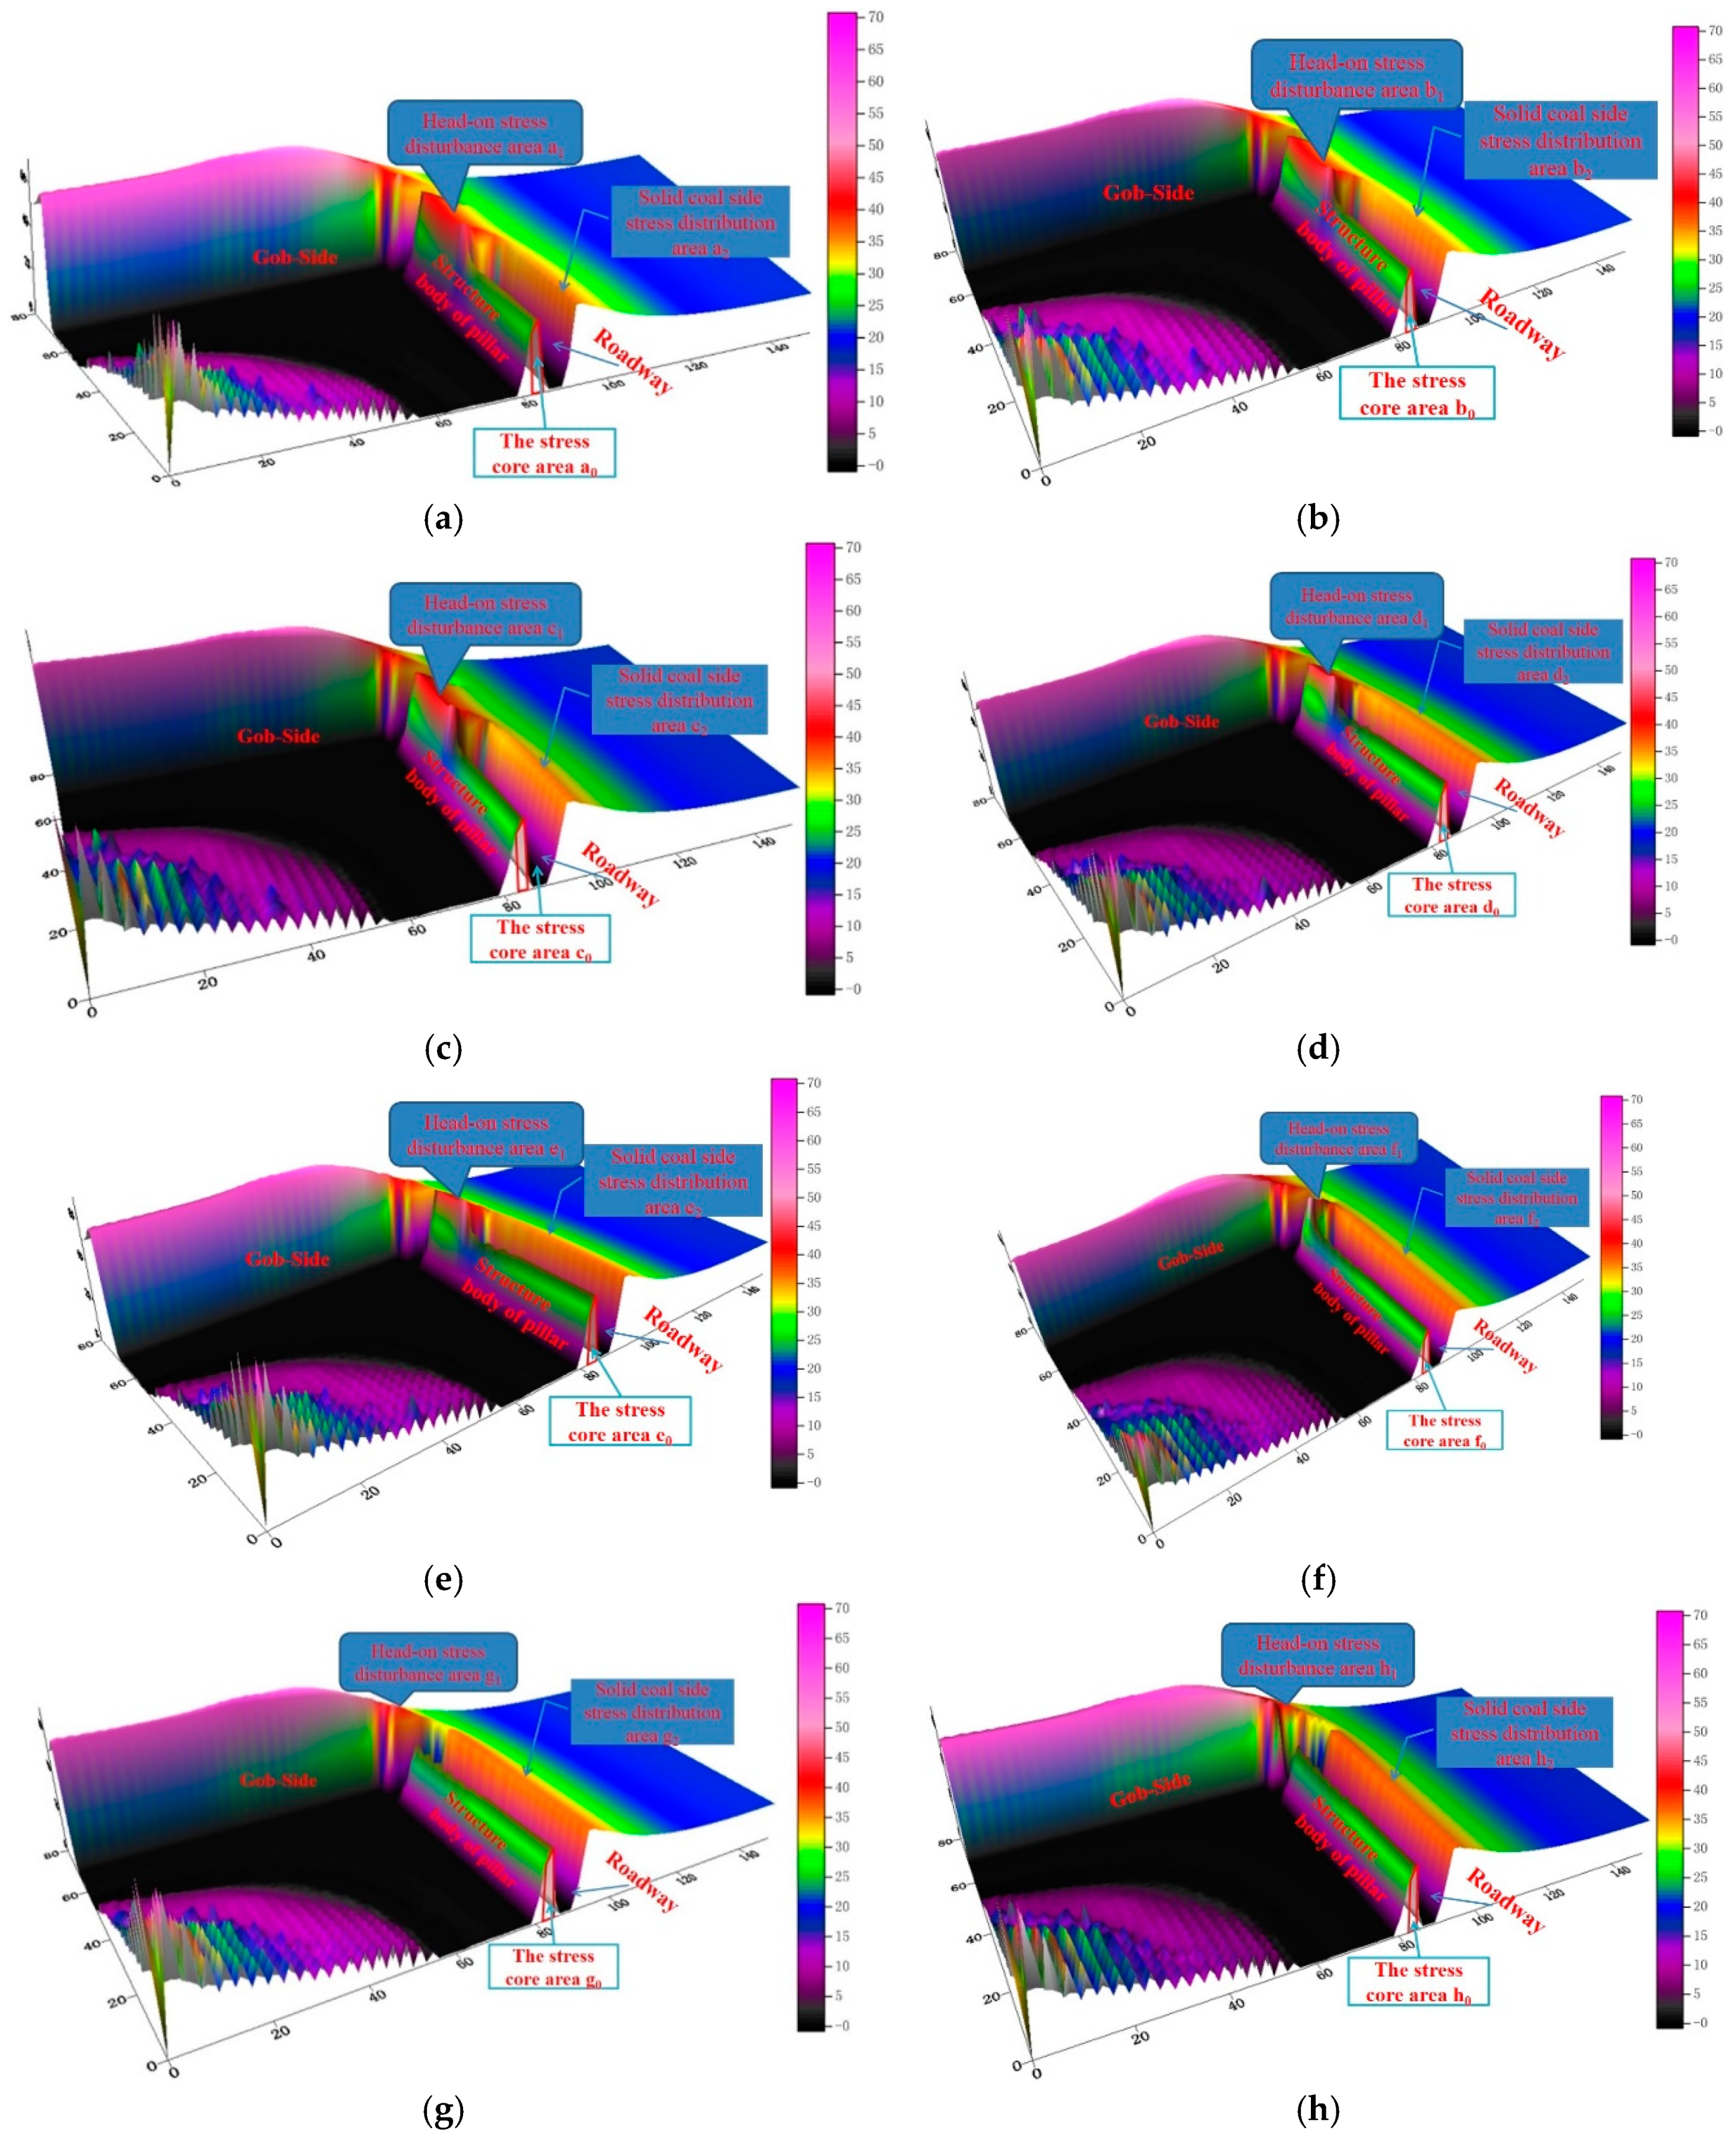
- A three-dimensional stress structure model of gob-side entry driving is established, through which the law of stress peak values in different zones is obtained. To be specific, the stress peak value of the head-on stress disturbance zone is larger than that of the stress distribution zone at the solid coal side, while the latter is larger than that of stress distribution zone in a coal pillar structure. The stress distribution of the stress core area inside a coal pillar structure displays a trend of steady growth and drastic decline. The discontinuity point of peak value in the stress core area is located close to the roadway, and the starting point of the stress core area is close to the gob-side. From the starting point to the discontinuity point, the stress grows steadily; but it falls dramatically after the discontinuity point. In addition, the stress core area is located close to the roadway side as a whole. As the driving distance is over 40 m, the stress distribution of coal pillar structure appears to be tooth-like.
- (3)
- In the loading process, two dangerous zones appear in coal pillar structure. One is due to tensile failure and the other is due to compression/shear failure. The control points of tensile failure constitute a concave surface and form an “instability critical line” in the plane vertical to the axis of the coal pillar structure, which is in line with the calculation results of the coal pillar mechanical structure model. The corresponding structural form is as follows: the control point on the roof is closer to the roadway while that on the floor is located within the range of 1.4–2 m deep inside the coal pillar structure. The dangerous zone caused by compression/shear failure is close to the roof of the coal pillar.
- (4)
- Based on the results of bolt (anchor cable) load monitoring and borehole peep imaging at the coal pillar side, the effects of support parameters for “high pre-tightening force and strong anchorage” in the working face of gob-side entry driving are evaluated. The monitoring results indicate that the rock mass layer of a coal pillar structure is highly smooth with a relatively stable loading effect. A whole set of efficient, hence sustainable, utilization technology for coal pillars are formed accordingly.
Author Contributions
Funding
Acknowledgments
Conflicts of Interest
Abbreviations
| M0 | beam section internal force at the starting point before the fracture of main roof |
| Mx | maximum bending moment before the fracture of main roof |
| F | supporting force on main roof |
| Q | weight and load of fractured strata |
| N | horizontal force caused by the rotation of fractured rock structure |
| E | elasticity modulus of main roof |
| Rs | tensile strength of main roof |
| h | thickness of main roof |
| b | width of main roof |
| γ | unit weight of main roof strata |
| k | cushion coefficient |
| q | load intensity on the overhanging part of fractured rock |
| ∆S | vertical displacement difference between the two ends of fractured rock |
| L | length of fractured rock in main roof |
| FY | regional stress transmitted from the roof |
| FZ | regional stress transmitted from the floor |
| FG | regional stress of coal pillar anchorage zone |
| FM | stress transmitted from coal pillar friction |
| c1 | rotation coefficient of the coal pillar structure |
| c2 | horizontal deviation coefficient of the coal pillar structure |
| c3 | vertical deviation coefficient of the coal pillar structure |
References
- Gao, W.; Ge, M. Stability of a coal pillar for strip mining based on an elastic-plastic analysis. Int. J. Rock Mech. Min. Sci. 2016, 87, 23–28. [Google Scholar] [CrossRef]
- Chen, S.J.; Guo, W.J.; Zhou, H.; Shen, B.T.; Liu, J.B. Field investigation of long-term bearing capacity of strip coal pillars. Int. J. Rock Mech. Min. Sci. 2014, 70, 109–114. [Google Scholar] [CrossRef]
- Zhou, Z.; Chen, L.; Cai, X.; Shen, B.T.; Zhou, J.; Kun, D. Experimental Investigation of the Progressive Failure of Multiple Pillar–Roof System. Rock Mech. Rock Eng. 2018, 51, 1629–1636. [Google Scholar] [CrossRef]
- Guo, W.; Wang, H.; Chen, S. Coal pillar safety and surface deformation characteristics of wide strip pillar mining in deep mine. Arab. J. Geosci. 2016, 9, 137. [Google Scholar] [CrossRef]
- Chen, S.J.; Yin, D.W.; Zhang, B.L.; Ma, H.F.; Liu, X.Q. Mechanical characteristics and progressive failure mechanism of roof-coal pillar structure. Chin. J. Rock Mech. Eng. 2017, 7, 1588–1598. [Google Scholar]
- Chen, S.J.; Zhou, H.; Guo, W.J.; Wang, H.L.; Sun, X.Z. Study on Long-Term Stress and Deformation Characteristics of Strip Pillar. J. Min. Saf. Eng. 2012, 29, 376–380. [Google Scholar]
- Zhou, A.; Wang, K.; Li, L.; Wang, C. A roadway driving technique for preventing coal and gas outbursts in deep coal mines. Environ. Earth Sci. 2017, 76, 236. [Google Scholar] [CrossRef]
- Yang, H.; Cao, S.; Wang, S.; Fan, Y.; Wang, S.; Chen, X. Adaptation assessment of gob-side entry retaining based on geological factors. Eng. Geol. 2016, 209, 143–151. [Google Scholar] [CrossRef]
- Bai, Q.; Tu, S.; Wang, F.; Zhang, C. Field and numerical investigations of gateroad system failure induced by hard roofs in a longwall top coal caving face. Int. J. Coal Geol. 2017, 173, 176–199. [Google Scholar] [CrossRef]
- Han, C.L.; Zhang, N.; Xue, J.H.; Kan, J.G.; Zhao, Y.M. Multiple and Long-Term Disturbance of Gob-Side Entry Retaining by Grouped Roof Collapse and an Innovative Adaptive Technology. Rock Mech. Rock Eng. 2018, 1–13. [Google Scholar] [CrossRef]
- Zhang, M.; Jiang, F.X.; Li, J.Z.; Jiao, Z.H.; Hu, H.; Shu, C.X.; Gao, H.J. Stability of coal pillar on the basis of the co-deformation of thick rock strata and coal pillar. Rock Soil Mech. 2018, 39, 705–714. [Google Scholar]
- Zhang, M.; Jiang, F.X.; Li, K.Q.; Wang, C.; Wu, X.; Gao, H.; Ji, S. Study of the compatible deformation and stability of the system of super thick strata and coal pillars. Chin. J. Rock Mech. Eng. 2017, 36, 326–334. [Google Scholar]
- Zhang, H.; Wan, Z.; Ma, Z.; Zhang, Y. Stability control of narrow coal pillars in gob-side entry driving for the LTCC with unstable overlying strata: A case study. Arab. J. Geosci. 2018, 11, 665. [Google Scholar] [CrossRef]
- Zha, W.; Shi, H.; Liu, S.; Kang, C. Surrounding rock control of gob-side entry driving with narrow coal pillar and roadway side sealing technology in Yangliu Coal Mine. Int. J. Min. Sci. Technol. 2017, 27, 819–823. [Google Scholar] [CrossRef]
- Jiang, L.S.; Zhang, P.P.; Chen, L.J.; Hao, Z.; Sainoki, A.; Mitri, H.S.; Wang, Q.B. Numerical approach for goaf-side entry layout and yield pillar design in fractured ground conditions. Rock Mech. Rock Eng. 2017, 50, 3049–3071. [Google Scholar] [CrossRef]
- Yao, Q.L.; Li, X.H.; Sun, B.Y.; Ju, M.H.; Chen, T.; Zhou, J.; Liang, S.; Qu, Q.D. Numerical investigation of the effects of coal seam dip angle on coal wall stability. Int. J. Rock Mech. Min. Sci. 2017, 12, 298–309. [Google Scholar] [CrossRef]
- Sun, W.; Zhang, Q.; Luan, Y.Z.; Zhang, X.P. A study of surface subsidence and coal pillar safety for strip mining in a deep mine. Environ. Earth Sci. 2018, 77, 5–16. [Google Scholar] [CrossRef]
- Zhou, Z.; Chen, L.; Zhao, Y.; Zhao, T.; Cai, X.; Du, X. Experimental and Numerical Investigation on the Bearing and Failure Mechanism of Multiple Pillars Under Overburden. Rock Mech. Rock Eng. 2017, 50, 995–1010. [Google Scholar] [CrossRef]
- Rafiei Renani, H.; Martin, C.D. Modeling the progressive failure of hard rock pillars. Tunn. Undergr. Space Technol. 2018, 74, 71–81. [Google Scholar] [CrossRef]
- He, Y.Y.; Song, X.M.; Zhao, J.C. A study on damage proneness of coal pillars of different sizes under complicated compression conditions. J. Min. Saf. Eng. 2015, 4, 592–596. [Google Scholar]
- Zhang, X.G.; Yao, Z.G.; Zhang, N. Stress Distribution of Coal Pillar with Gob-Side Entry Driving in the Process of Excavation & Mining. J. Min. Saf. Eng. 2012, 4, 459–465. [Google Scholar]
- Zheng, X.G.; An, T.L.; Guo, Y. Surrounding rock control mechanism and engineering application of in-situ coal pillar in gob-side entry retaining. J. Min. Saf. Eng. 2018, 6, 1091–1098. [Google Scholar]
- Zhao, G.Z.; Ma, Z.G.; Sun, K.; Fan, J.Q.; Li, K. Research on Deformation Controlling Mechanism of the Narrow Pillar of Roadw ay Driving A long Next Goaf. J. Min. Safe Eng. 2010, 4, 517–521. [Google Scholar]
- Kumar, A.; Waclawik, P.; Singh, R. Performance of a coal pillar at deeper cover: Field and simulation studies. Int. J. Rock Mech. Min. Sci. 2019, 113, 322–332. [Google Scholar] [CrossRef]
- Mathey, M.; van der Merwe, J.N. Critique of the South African squat coal pillar strength formula. J. South. Afr. Inst. Min. Metall. 2016, 116, 291–299. [Google Scholar] [CrossRef] [Green Version]
- Xi, J.M.; Mao, J.H.; Yang, G.S.; Wang, J.F. Method for Determining Rational Pillar Width in Mining Roadway Along Goaf. J. Min. Saf. Eng. 2008, 4, 400–403. [Google Scholar]
- Qian, M.G.; Zhao, G.J. The Influence of the Fracture of the Main Roof on the Mining Ground Pressure. J. China Univ. Min. Technol. 1986, 4, 14–22. [Google Scholar]
- Zhang, T.C. Analysis of Influencing Factors and Control on Driving Speed of Coal Roadway in Hulu Su Coal Mine. Available online: http://kreader.cnki.net/Kreader/CatalogViewPage.aspx?dbCode=cdmd&filename=1017950300.nh&tablename=CMFD201801&compose=&first=1&uid= (accessed on 21 March 2019).
- Hou, C.J.; Ma, N.J. Stress in In-seam Roadway Sides and Limit Equilibrium Zone. J. China Coal Soc. 1989, 4, 21–29. [Google Scholar]
- Xie, P. Predictions of Height of Water Flowing Fractured Zone and Water Inflow under Fully Mechanized Top-Coal Caving of Shilawusu Coal Mine. Available online: http://kreader.cnki.net/Kreader/CatalogViewPage.aspx?dbCode=cdmd&filename=1018827078.nh&tablename=CMFD201802&compose=&first=1&uid= (accessed on 21 March 2019).
- Kim, B.; Walton, G.; Larson, M.K.; Berry, S. Experimental study on the confinement-dependent characteristics of a Utah coal considering the anisotropy by cleats. Int. J. Rock Mech. Min. Sci. 2018, 105, 182–191. [Google Scholar] [CrossRef] [Green Version]


| Thickness (m) | Lithology | Remarks |
|---|---|---|
| 6.22 | Sandy mudstone | |
| 0.42 | 2-1 Coal seam | |
| 3.06 | Sandy mudstone | |
| 13.78 | Middle-fine sandstone | Roof |
| 4.99 | 2-2Up Coal seam | Primary mineable coal bed |
| 2.67 | Sandy mudstone | Floor |
| 17.54 | Middle-fine sandstone |
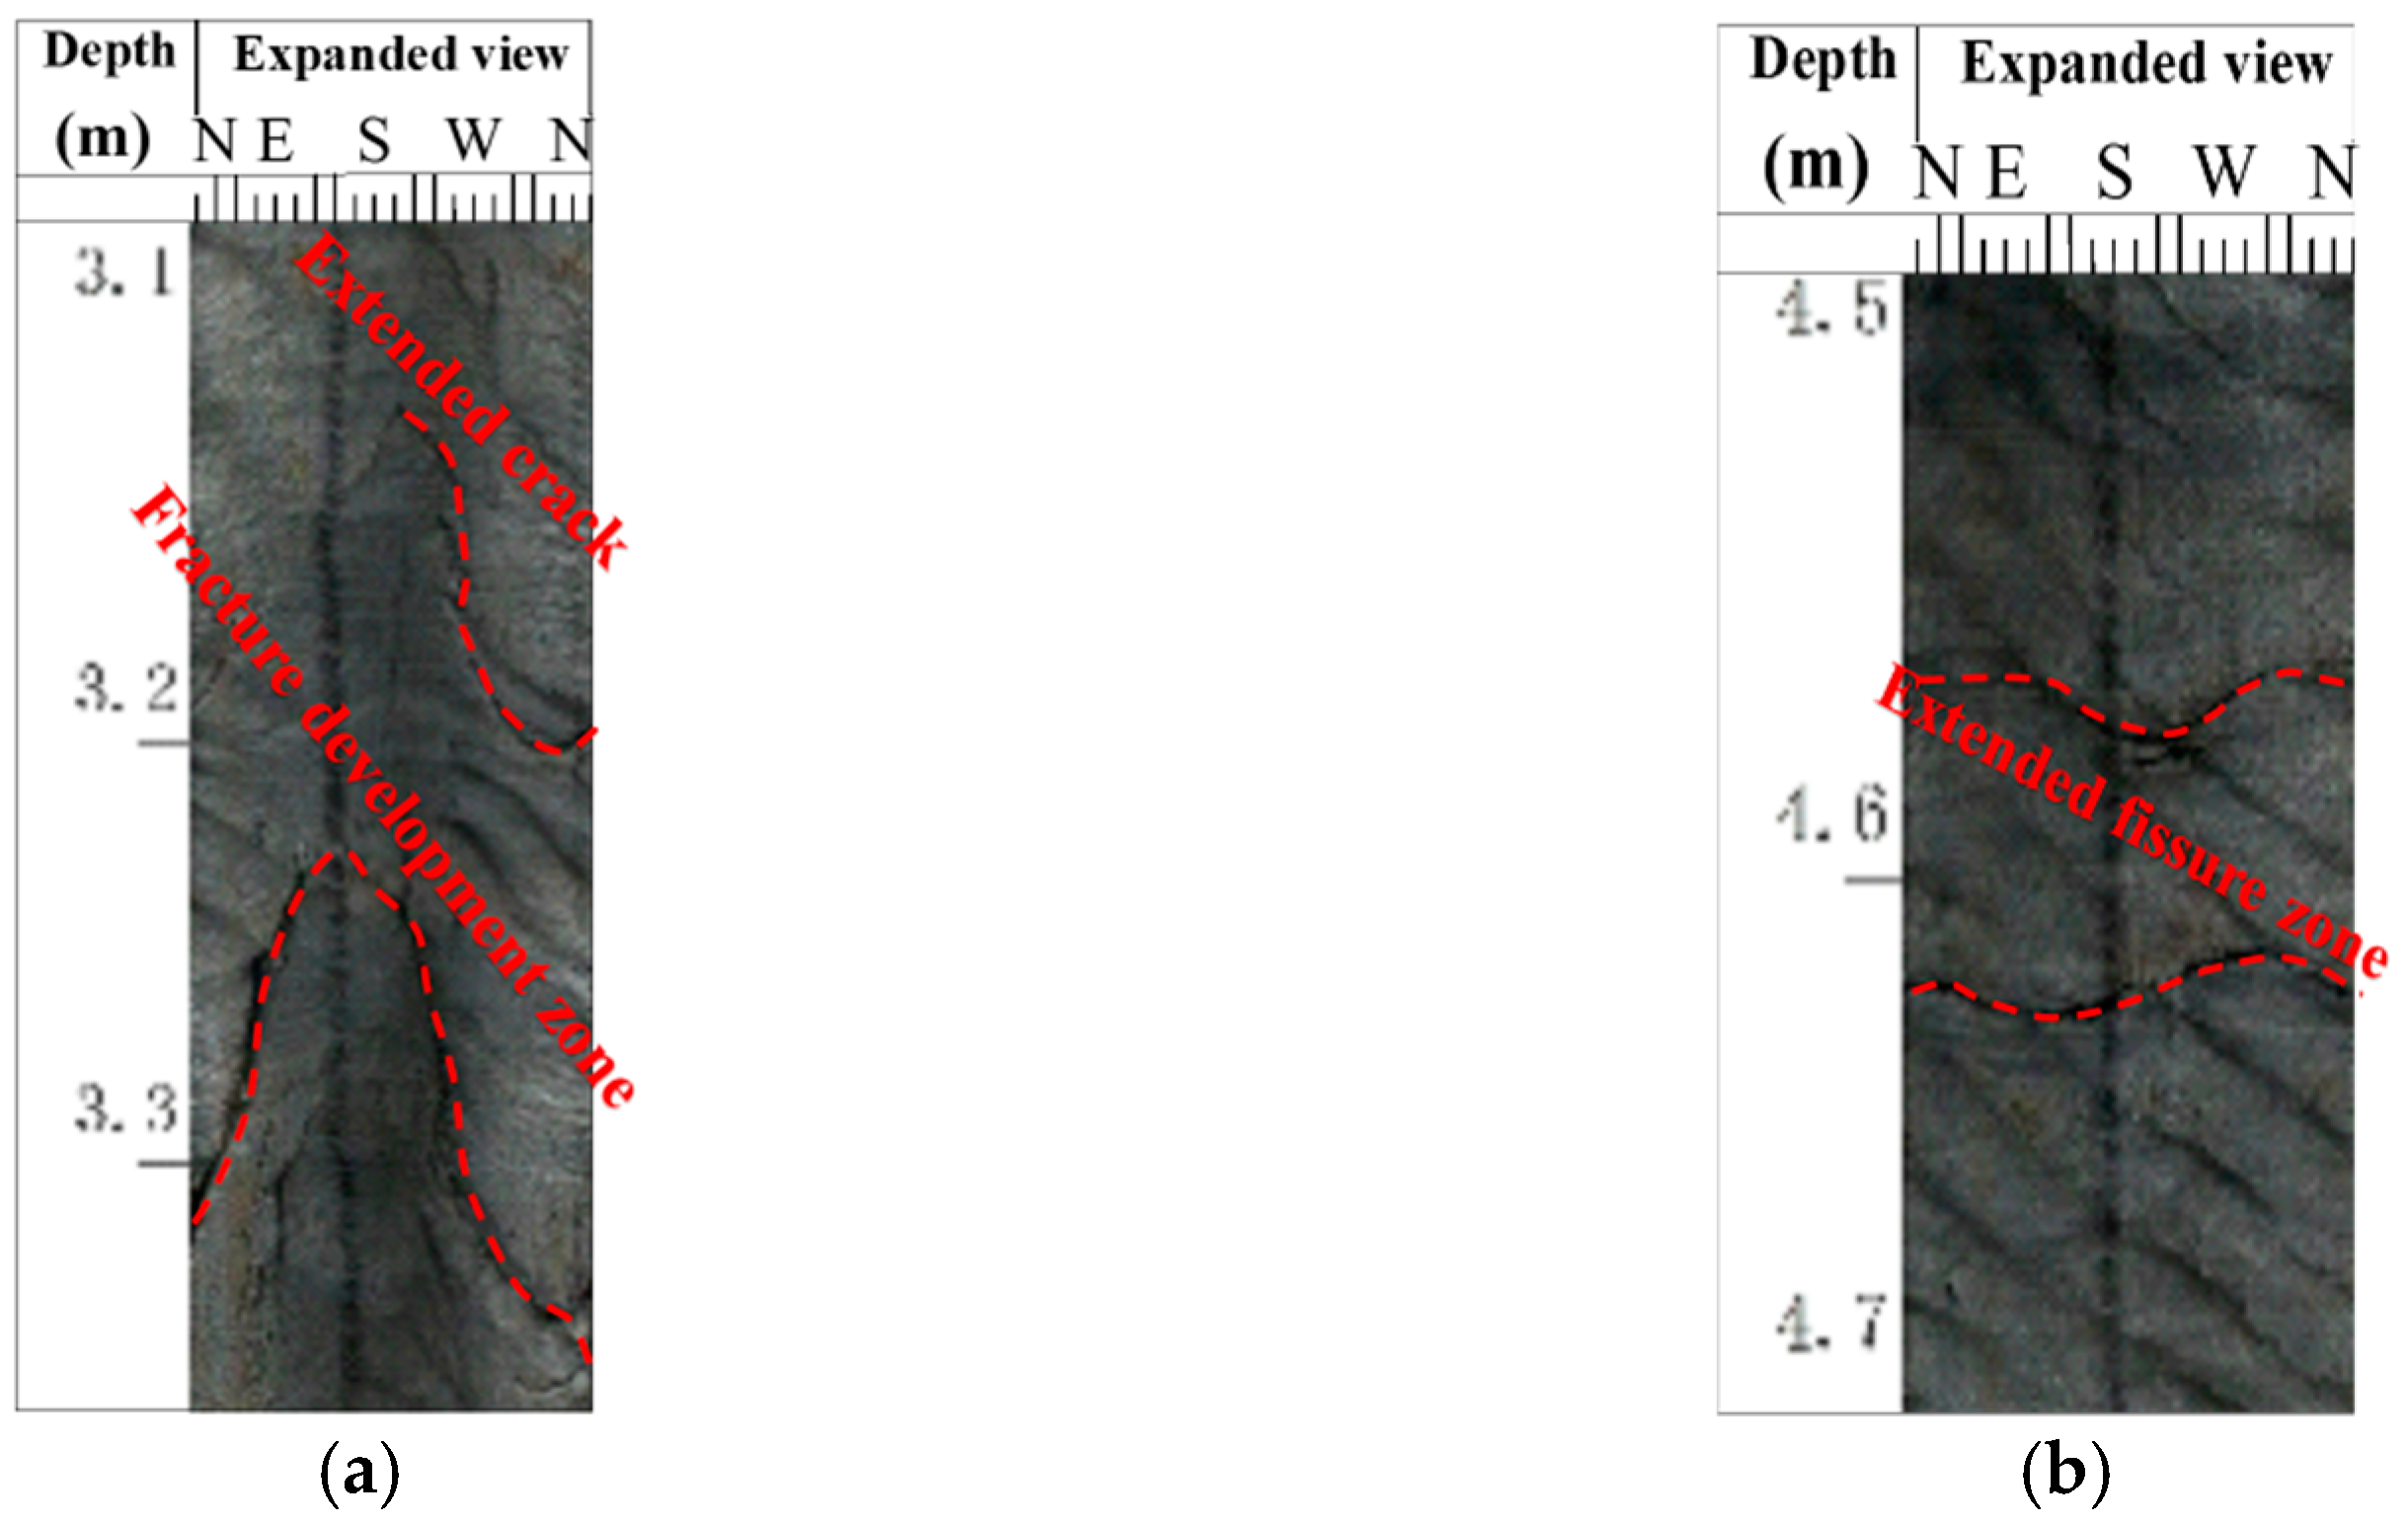
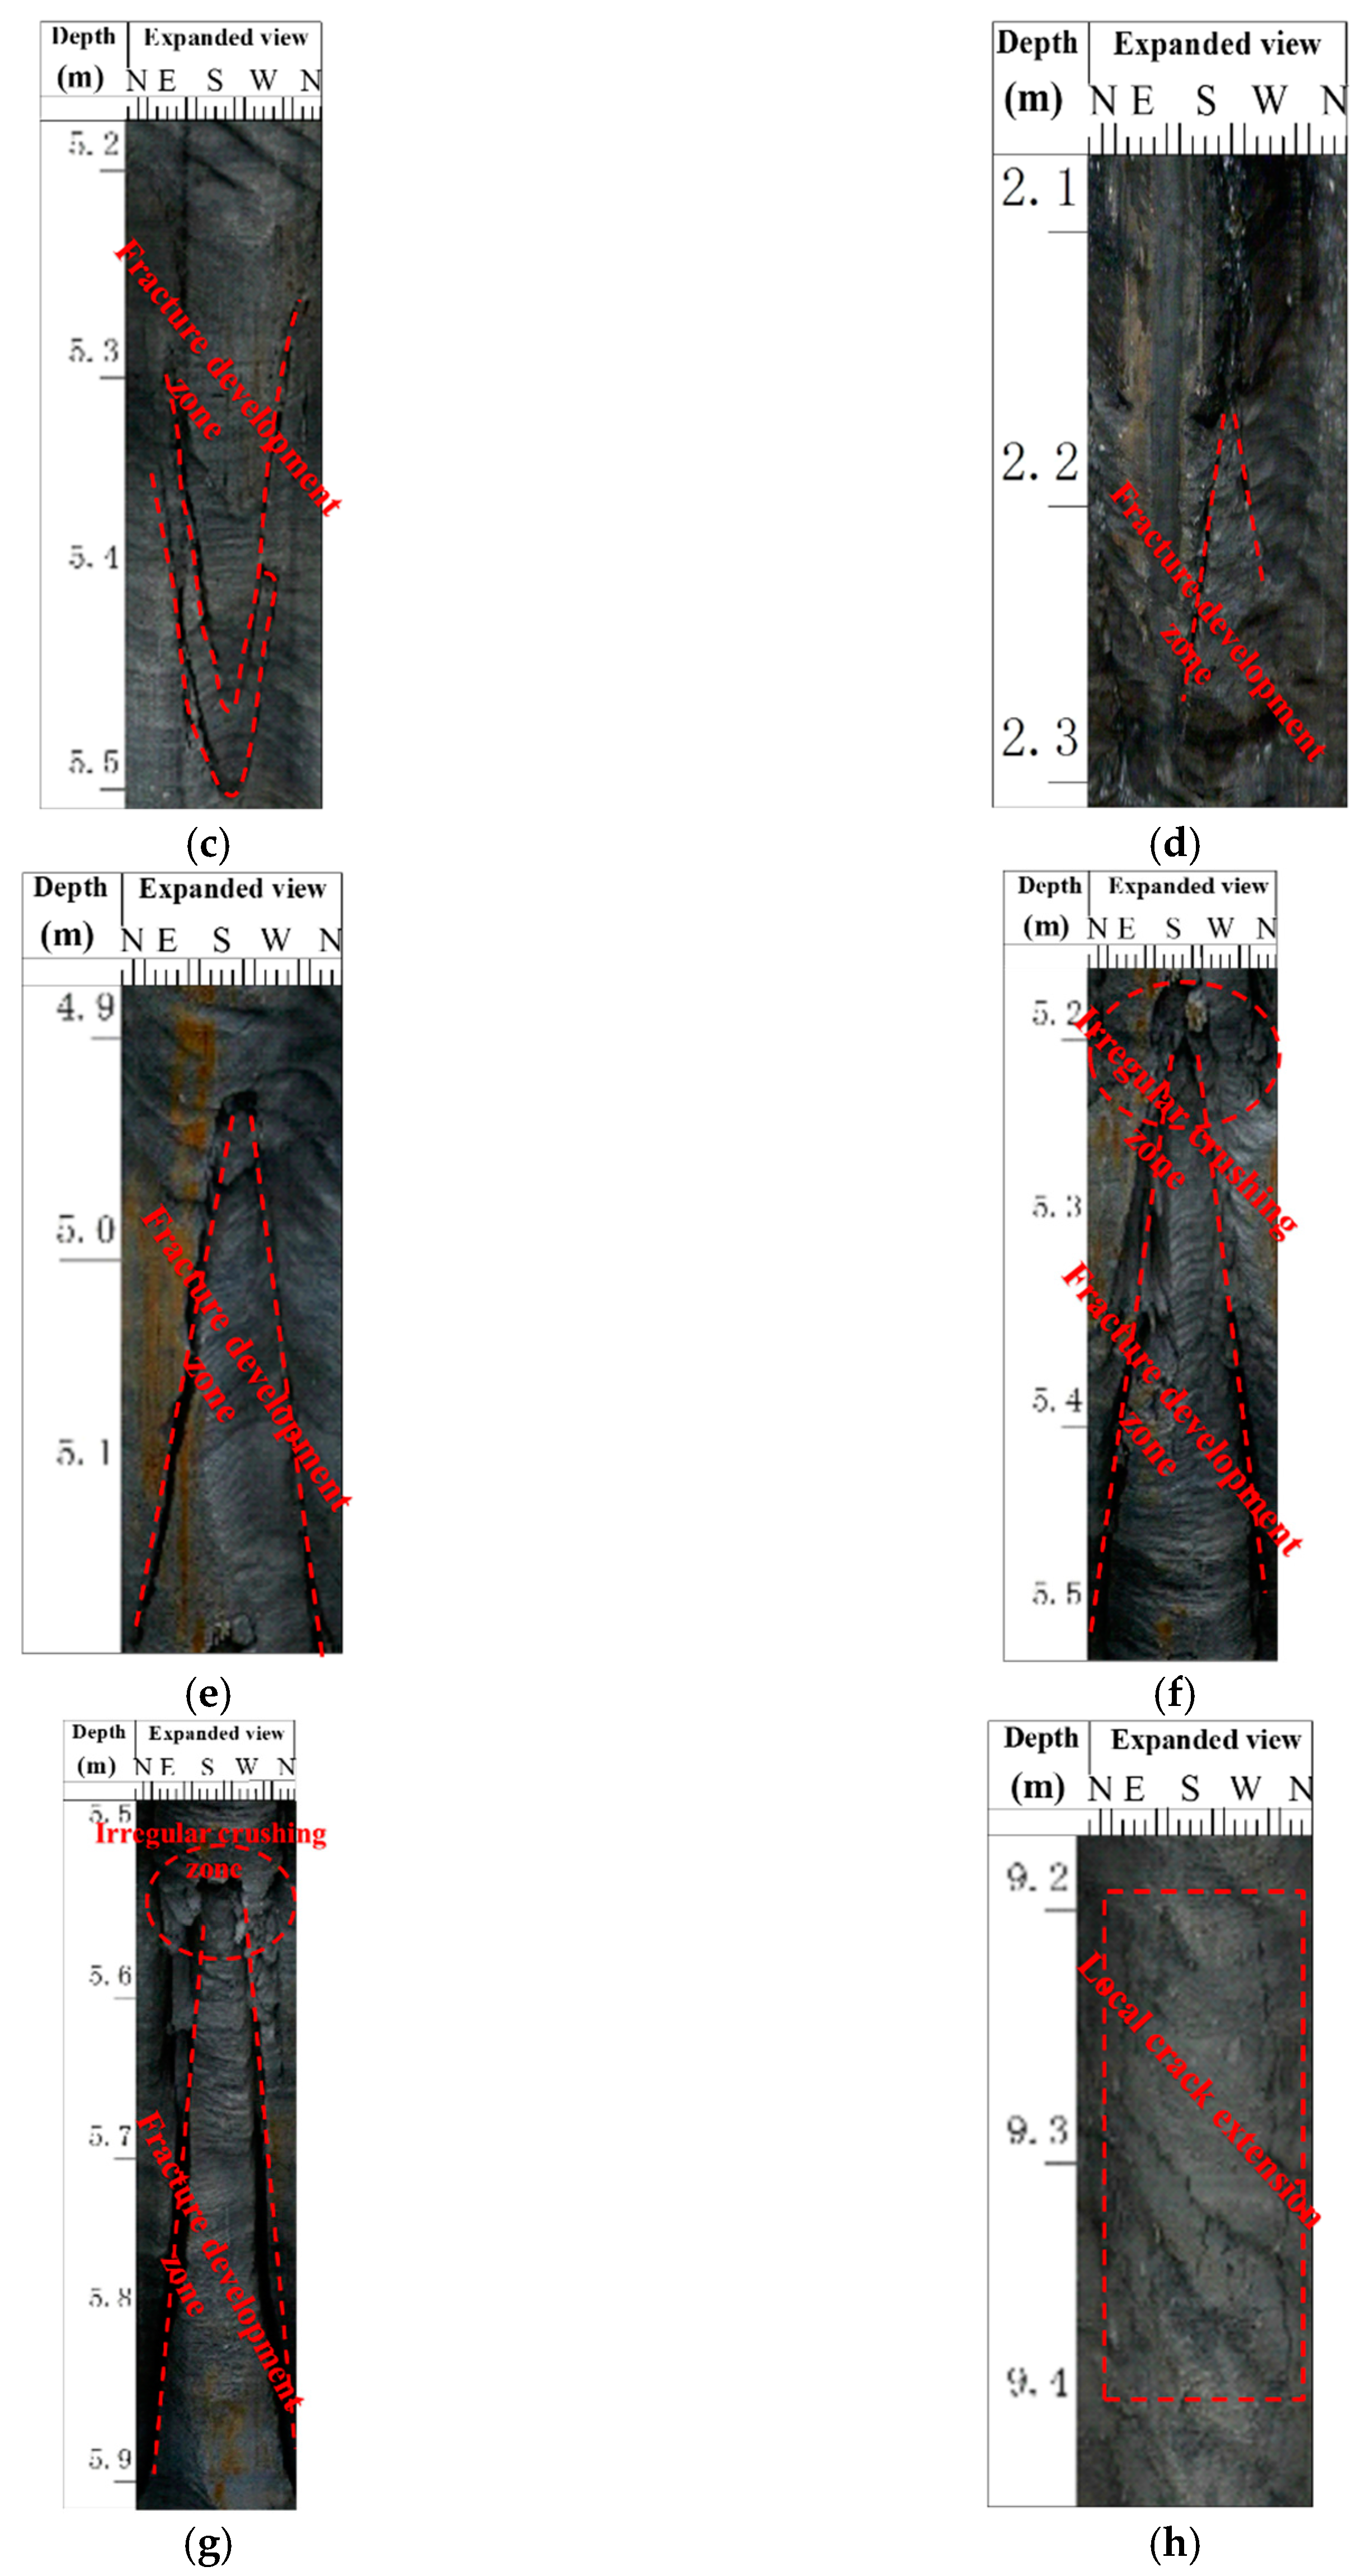
| Borehole Number | Fracture Development Zone (m) | The Depth into Coal Pillar Side (m) | The Depth into the Roof (m) |
|---|---|---|---|
| 1# | 3.1–3.3 | 2.19–2.33 | 2.19–2.33 |
| 4.5–4.7 | 3.18–3.32 | 3.18–3.32 | |
| 5.2–5.5 | 3.68–3.89 | 3.68–3.89 | |
| 2# | 2.1–2.3 | 1.05–1.15 | 1.82–1.99 |
| 4.9–5.2 | 2.45–2.60 | 4.24–4.50 | |
| 5.2–5.5 | 2.60–2.75 | 4.50–4.76 | |
| 5.5–5.9 | 2.75–2.95 | 4.76–5.11 |
© 2019 by the authors. Licensee MDPI, Basel, Switzerland. This article is an open access article distributed under the terms and conditions of the Creative Commons Attribution (CC BY) license (http://creativecommons.org/licenses/by/4.0/).
Share and Cite
Li, X.; Zhang, N.; Xie, Z.; Liang, D.; Zhao, Y. Study on Efficient Utilization Technology of Coal Pillar Based on Gob-Side Entry Driving in a Coal Mine with Great Depth and High Production. Sustainability 2019, 11, 1706. https://doi.org/10.3390/su11061706
Li X, Zhang N, Xie Z, Liang D, Zhao Y. Study on Efficient Utilization Technology of Coal Pillar Based on Gob-Side Entry Driving in a Coal Mine with Great Depth and High Production. Sustainability. 2019; 11(6):1706. https://doi.org/10.3390/su11061706
Chicago/Turabian StyleLi, Xinyue, Nong Zhang, Zhengzheng Xie, Dongxu Liang, and Yiming Zhao. 2019. "Study on Efficient Utilization Technology of Coal Pillar Based on Gob-Side Entry Driving in a Coal Mine with Great Depth and High Production" Sustainability 11, no. 6: 1706. https://doi.org/10.3390/su11061706