Article

Land Use and Land Cover Change in the Kailash Sacred Landscape of China

1
Key Laboratory of Ecosystem Network Observation and Modeling, Institute of Geographic Sciences and Natural Resources Research, Chinese Academy of Sciences, Beijing 100101, China
2
College of Resources and Environment, University of Chinese Academy of Sciences, Beijing 100190, China
*
Author to whom correspondence should be addressed.
Sustainability 2019, 11(6), 1788; https://doi.org/10.3390/su11061788
Submission received: 18 February 2019 / Revised: 19 March 2019 / Accepted: 19 March 2019 / Published: 25 March 2019
(This article belongs to the Special Issue Modelling Land Use Change and Environmental Impact)

Abstract

:
Land use and land cover change (LUCC) is an important driver of ecosystem function and services. Thus, LUCC analysis may lay foundation for landscape planning, conservation and management. It is especially true for alpine landscapes, which are more susceptible to climate changes and human activities. However, the information on LUCC in sacred landscape is limited, which will hinder the landscape conservation and development. We chose Kailash Sacred Landscape in China (KSL-China) to investigate the patterns and dynamics of LUCC and the driving forces using remote sensing data and meteorological data from 1990 to 2008. A supervised classification of land use and land cover was established based on field survey. Rangelands presented marked fluctuations due to climatic warming and its induced drought, for example, dramatic decreases were found in high- and medium-cover rangelands over the period 2000–2008. And recession of most glaciers was also observed in the study period. Instead, an increase of anthropogenic activities accelerated intensive alteration of land use, such as conversion of cropland to built-up land. We found that the change of vegetation cover was positively correlated with growing season precipitation (GSP). In addition, vegetation cover was substantially reduced along the pilgrimage routes particularly within 5 km of the routes. The findings of the study suggest that climatic warming and human disturbance are interacted to cause remarkable LUCC. Tourism development was responsible land use change in urban and pilgrimage routes. This study has important implications for landscape conservation and ecosystem management. The reduction of rangeland cover may decrease the rangeland quality and pose pressure for the carrying capacity of rangelands in the KSL-China. With the increasing risk of climate warming, rangeland conservation is imperative. The future development should shift from livestock-focus animal husbandry to service-based ecotourism in the sacred landscape.

1. Introduction

A large number of studies have investigated land use and land cover change (LUCC) at regional or even global scales [1,2,3,4,5,6,7,8,9]. A series of impacts of LUCC are imposed on biodiversity, soil carbon stocks, climate change, and ecosystem services [10,11,12,13,14,15,16,17]. It is indicated that alpine landscapes have become more vulnerable under climate change and land use change, and alpine ecosystem services are subject to changes owing to LUCC driven by climate and socio-economic changes [18]. In addition, recent regional analyses using remote sensing data have highlighted the consequences of climate change on alpine landscape, particularly the influence of climatic warming, which suggests that it is critical to perform substantial LUCC research in alpine landscapes [19,20,21,22,23,24,25,26,27]. Therefore, it is imperative to better understand LUCC and its driving forces in alpine landscapes.
Using remote sensing data is an operational way to monitor LUCC, and further quantify land use and land cover and understand LUCC in response to climate change and human disturbance in long-term. Therefore, numerous studies detected the dynamics of land use and land cover in long time series using satellite image [28,29,30,31,32,33]. Similarly, previous studies have assessed the accuracy of land classification of high resolution image [34,35,36,37]. In addition, long-term LUCC were associated with climate factors taking advantage of remote sensing time series. For example, relationships of vegetation cover dynamics with climate change were examined using Normalized Difference Vegetation Index (NDVI) and rainfall [38,39,40]. Further, some studies also explored LUCC using satellite images in alpine landscapes [41,42,43,44], and adopting landscape models based on LUCC to support landscape and biodiversity conservation management [45,46,47,48,49]. In particular, LUCC can provide detailed spatial information of land cover for implementing sustainable landscape conservation in alpine regions [50]. However, there is still limited information on the LUCC in sacred landscapes, which is beneficial to better understand LUCC in response to climate change and increasing number of tourists.
The Kailash Sacred Landscape (KSL) is an important transboundary landscape with culture diversity and biodiversity hotspots in Hindu Kush Himalayan region. It is also the holiest shrine for five religions, i.e., Hinduism, Buddhism, Jainism, Ayyavazhi and the Bön faith [51]. However, land use and land cover in this region has changed rapidly in recent years in response to climate change, tourism development, and pilgrimage. Some studies have addressed the LUCC in Himalayan transboundary landscape. For instance, Uddin et al. [52] analyzed LUCC and forest fragmentation in Nepal’s Kailash Sacred Landscape. Rai et al. [53] assessed LUCC and ecosystem services in the transboundary Gandaki River Basin of central Himalayas. All the studies suggest land use and land cover are vulnerable to the pressures from tourism disturbance, infrastructure construction, and climate change in the trans-boundary landscape. Nonetheless, LUCC and its main drive forces remain elusive in Chinese part of the KSL (KSL-China). This knowledge gap may constrain our capacity to conserve the sacred landscape. More importantly, understanding LUCC and its drivers will provide insights into ecosystem management and future landscape conservation in the KSL-China.
Hence, we use satellite images and meteorological data to assess LUCC and examine the major drivers in KSL-China from 1990 to 2008. The main objectives are to explore: (1) the dynamics of LUCC during 1990–2008, (2) the response of LUCC to driving factors, and (3) its implication for landscape conservation and sustainable land use. This study is expected to provide insights into sacred landscape conservation in future land management.

2. Materials and Methods
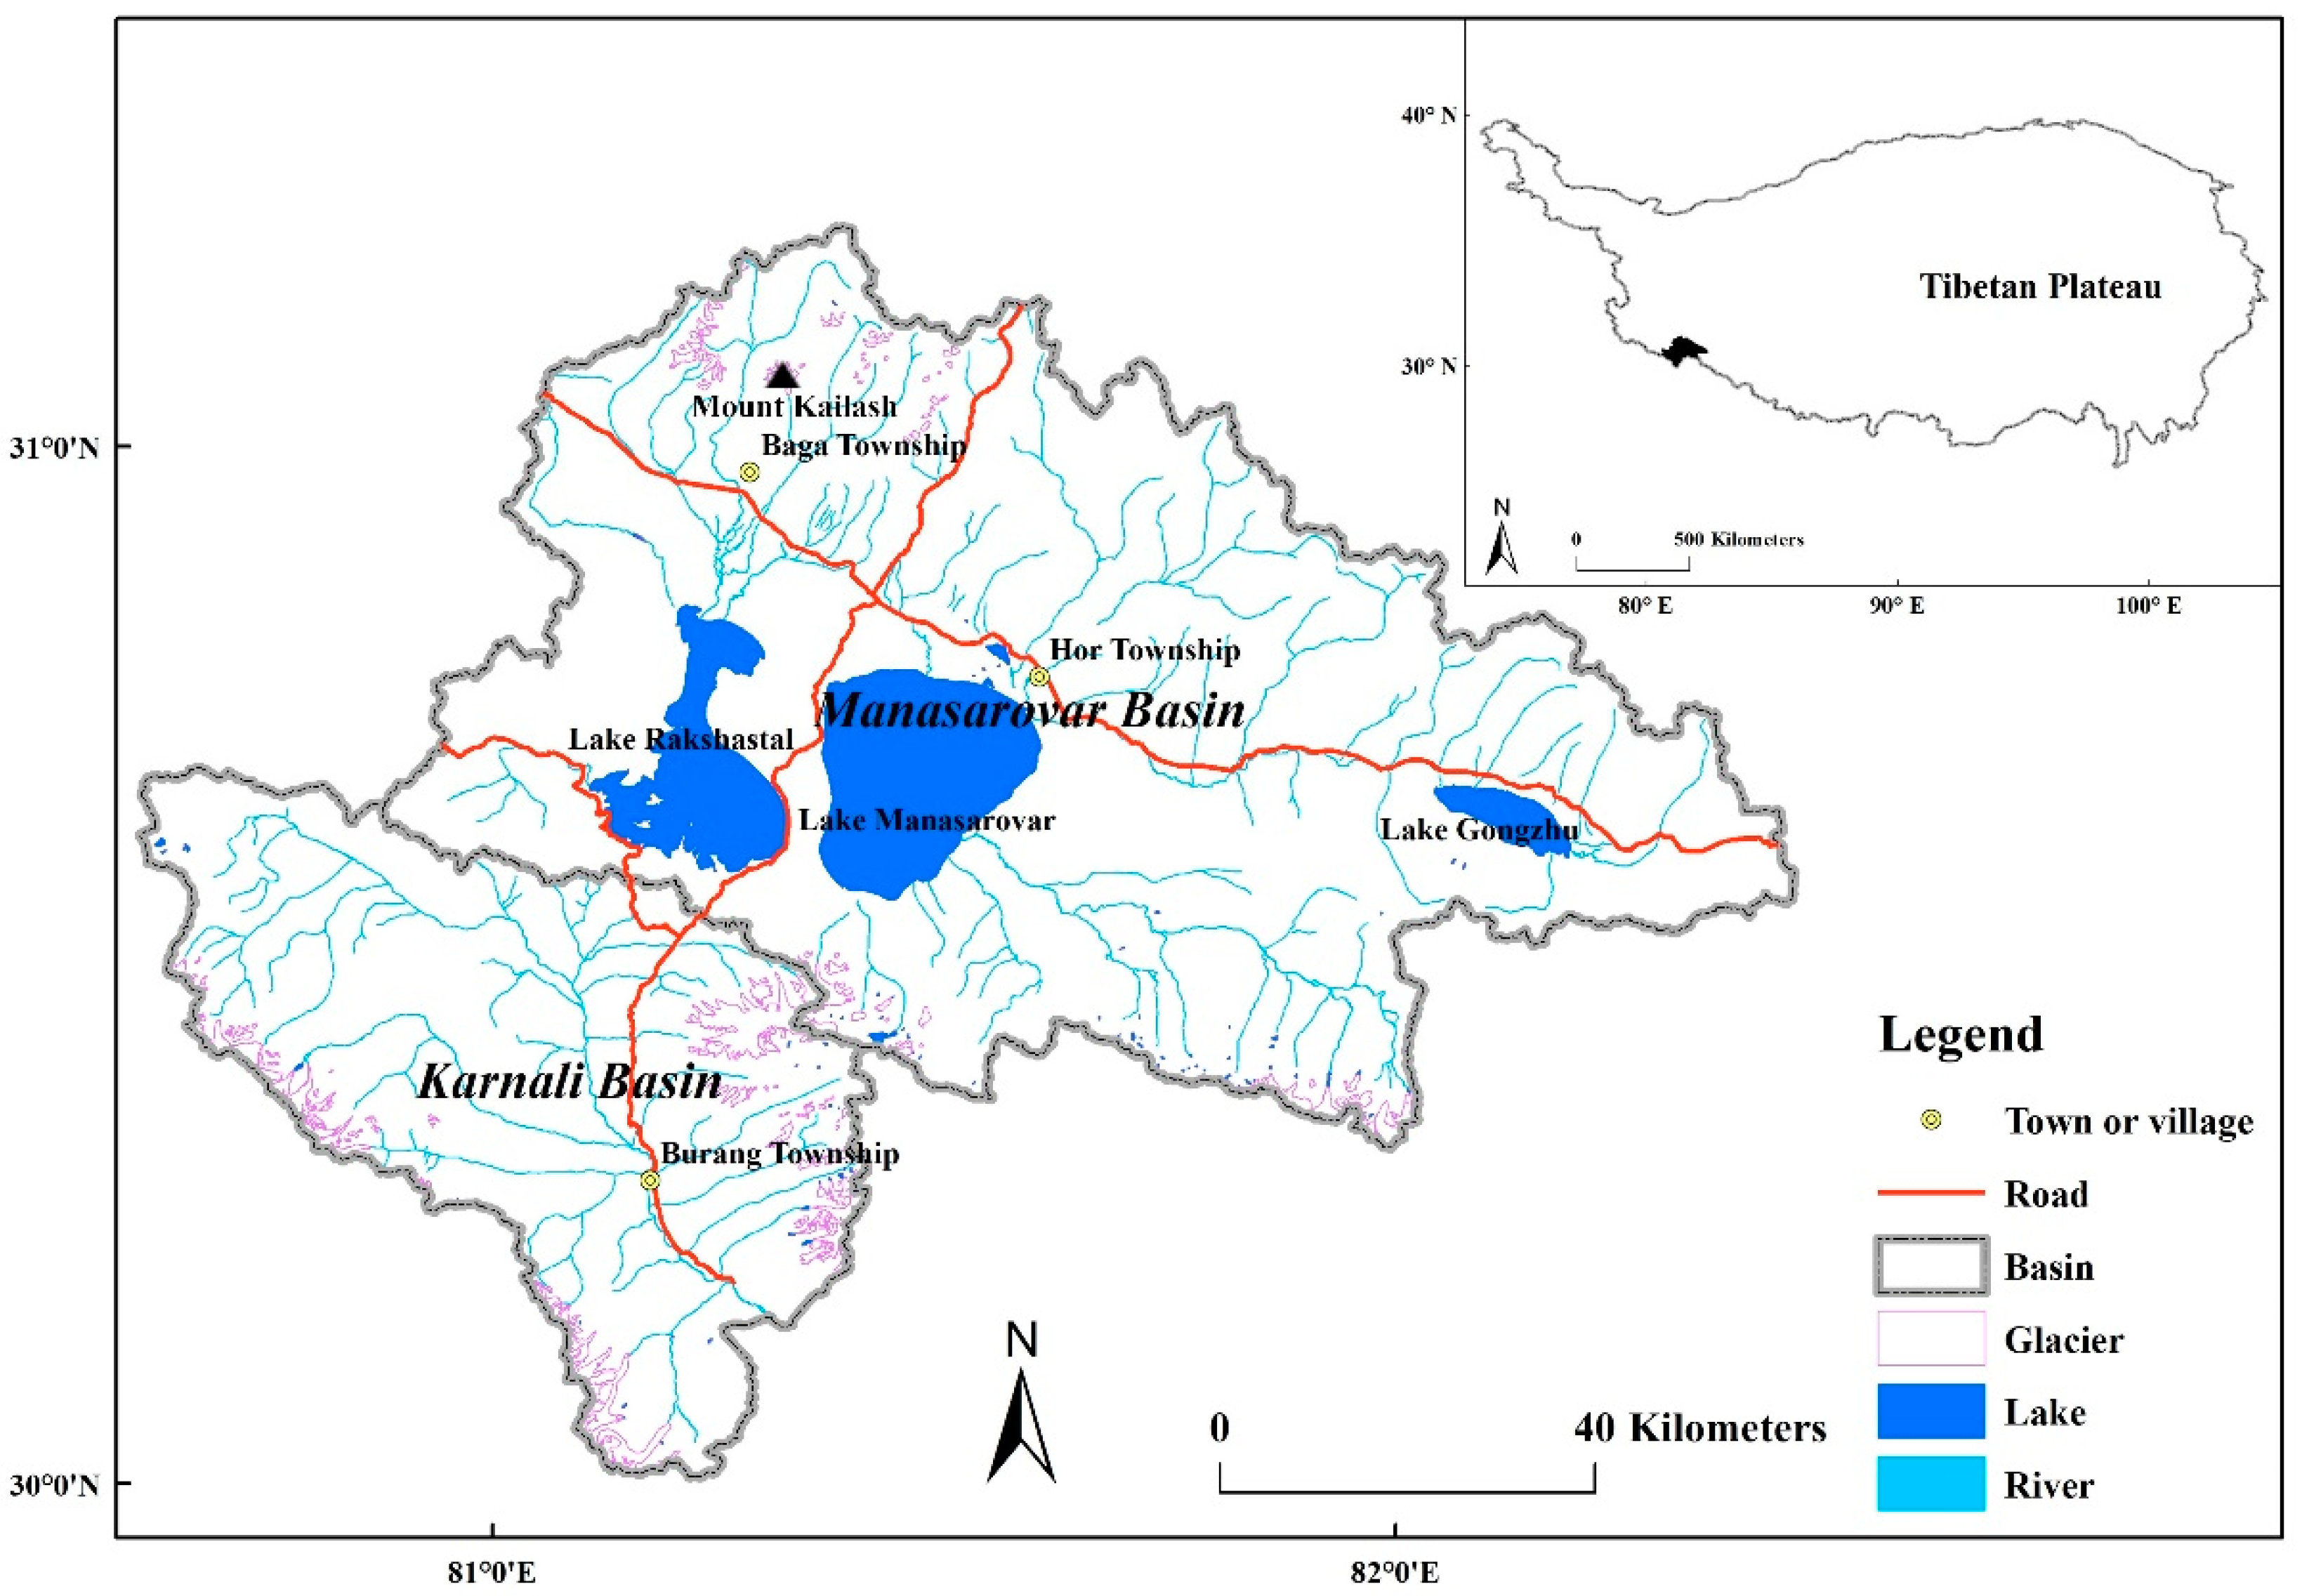
2.1. Study Area

The KSL-China is situated in Burang County, Tibet Autonomous Region (80°27′–82°30′ E, 30°00′–31°13′ N; Figure 1). Mount Kailash and Lake Manasarovar are the landmarks of the Kailash Sacred Landscape. KSL is characterized by diverse culture and bio-resources. Mount Kailash is considered by multi-religion as the Center of the Universe. Every year, tens of thousands of pilgrims with different religious beliefs make pilgrimage to Mount Kailash and pray to back to the soul. Near the Mount Kailash, there are two famous holy lakes, i.e., Lake Manasarovar and Lake Rakshastal. Manasarovar was ratified as national park and national natural reserve in 2004 and 2018, respectively. It is also a Ramsar international wetland site. KSL-China is the habitat for 26 species of Convention on International Trade in Endangered Species (CITES). KSL is also the sources of four important Asian rivers.
The KSL-China is composed of two watersheds according to topography. One is the high-altitude Manasarovar basin with an area of 7780.87 km2 and average altitude of 4700 m. The other is a lower-altitude Karnali basin with an area of 3061.89 km2 and average altitude of 4000 m [54]. Mt Kailash and two holy lakes belong to the Manasarovar basin, where Baga and Hor Townships are located. Burang Township is located in the valley of Karnali River which is staging point for pilgrims to the Mount Kailash. The KSL-China represents typical alpine desert-steppe ecosystem in an arid region, with annual mean temperature of 2–5 ℃ and annual precipitation of 100–250 mm. In the past decades, the KSL-China was subjected to enormous challenges from climate changes and human disturbance including population growth, urbanization, and tourism development, which pose a severe threat to the ecosystems in the sacred landscape [51].

2.2. Remote Sensing Data Acquisition and Processing

Three-phase series (1990, 2000 and 2008) of Landsat satellite images during growing season were used for LUCC assessment. To reduce the impacts of seasonal and phonological variations, the satellite images were selected in the same season (summer and autumn). This study collected Landsat TM (Thematic Mapper) images between 1990 and 1992, 1999 and 2000, Landsat ETM images (Enhanced Thematic Mapper) between 2007 and 2008. Each temporal dataset includes 3 scenes of satellite images covering KSL-China. The path-rows are 143-39, 144-38, and 144-39. All remote sensing data were acquired from the United States Geological Survey (USGS) Earth Resources Observation and Science (EROS) Center. Multi-temporal image registration, radiometric and atmospheric corrections were performed beforehand so that registration error was controlled less than 15 m. ENVI software was used to process the satellite images, and ArcGIS version 10.2 was used to edit the KSL extent, extract land parameters, and analyze LUCC.
The Moderate Resolution Imaging Spectroradiometer (MODIS) dataset MOD13A3 (https://lpdaac.usgs.gov) was collected to examine vegetation cover dynamics after 2000. NDVI and climatic factors during the growing season were adopted to explore the relationship between vegetation cover dynamics and climate changes. Maximum value composites (MVC) was used to obtain the yearly NDVI over the growing season.
Meteorological data (monthly average temperature and precipitation) were provided by Chinese National Meteorological Information Center (http://data.cma.cn). The total precipitation (GSP) and average temperature during the growing season (GST) from 2000 to 2015 were extracted for subsequent correlation analysis.

2.3. Land Classification

According to the resolution of Landsat images in the KSL-China and field survey in many years, land use was classified into eight main classes, i.e., croplands, rangelands, deserts, wetlands, water bodies, built-up lands, glaciers, and barren lands. Among them, rangelands are the most important and widely distributed landscapes. Therefore, we made a further classification for rangelands as low coverage rangeland with vegetation cover range between 10% and 30%, medium coverage rangeland with cover ranging from 30% to 60%, and high coverage rangelands with cover more than 60%. Thus, ten land use classes were therefore classified in this study (Table 1).
Supervised classification method was used to classify water bodies and barren lands because these two types were easy to identify through spectrums analysis. Bands ratio method was used to classify glaciers which are easily to be extracted through TM7/TM3, including the glaciers under mountain shadow. The rangelands and desert were classified through a couple of methods: First, NDVI was used to calculate vegetation coverage through NDVImin and NDVImax. Second, the decision tree method was applied to classify low-, medium-, and high-cover rangelands and desert. Then, some post classification methods such as majority analysis, clump classes and sieve classes were used to process the discrete pixels. In addition, the expert system method and Google Earth were used to identify croplands, wetlands and built-up lands. At last, all the classification results were converted from raster to vector format.

2.4. LUCC Change Rate

The changes of land use and land cover in the study period were calculated as the following rate,
C r = C e n d C s t a r t C s t a r t × 1 T × 100 %
in which Cr is the change rate of land use and land cover in the study period. Cstart and Cend are the areas of a certain land type at the start and at the end of the research period, respectively. T is years of the study interval.

2.5. Land Use and Land Cover Transition Matrix

The land use and land cover transition matrix is used to examine land area conversion of different types in two stages [55,56,57,58]. The matrix was calculated by the following equation:
P = [ P 11 P 12 P 1 j P 21 P 22 P 2 j P i 1 P i 2 P i j ]
in which Pij is the land area in transition from landscape i to j. Each element in the transition matrix is assumed to satisfy that (1) Pij is non-negative and (2) j = 1 n P i j = 1 . Due to substantial change rate after 2000, land use and land cover transition matrix was calculated between 2000 and 2008 in this study.

2.6. Buffer Analysis

To test the influence of pilgrimage routes on surrounding environment, distances to the Kora routes of Mount Kailash were used as buffer zones, ranging from 0 to 5 km, 5 to 10 km, and 10 to 15 km. The vegetation covers of buffer zones were extracted to indicate changes in surrounding environment of pilgrimage route.

3. Results

3.1. LUCC Patterns in KSL

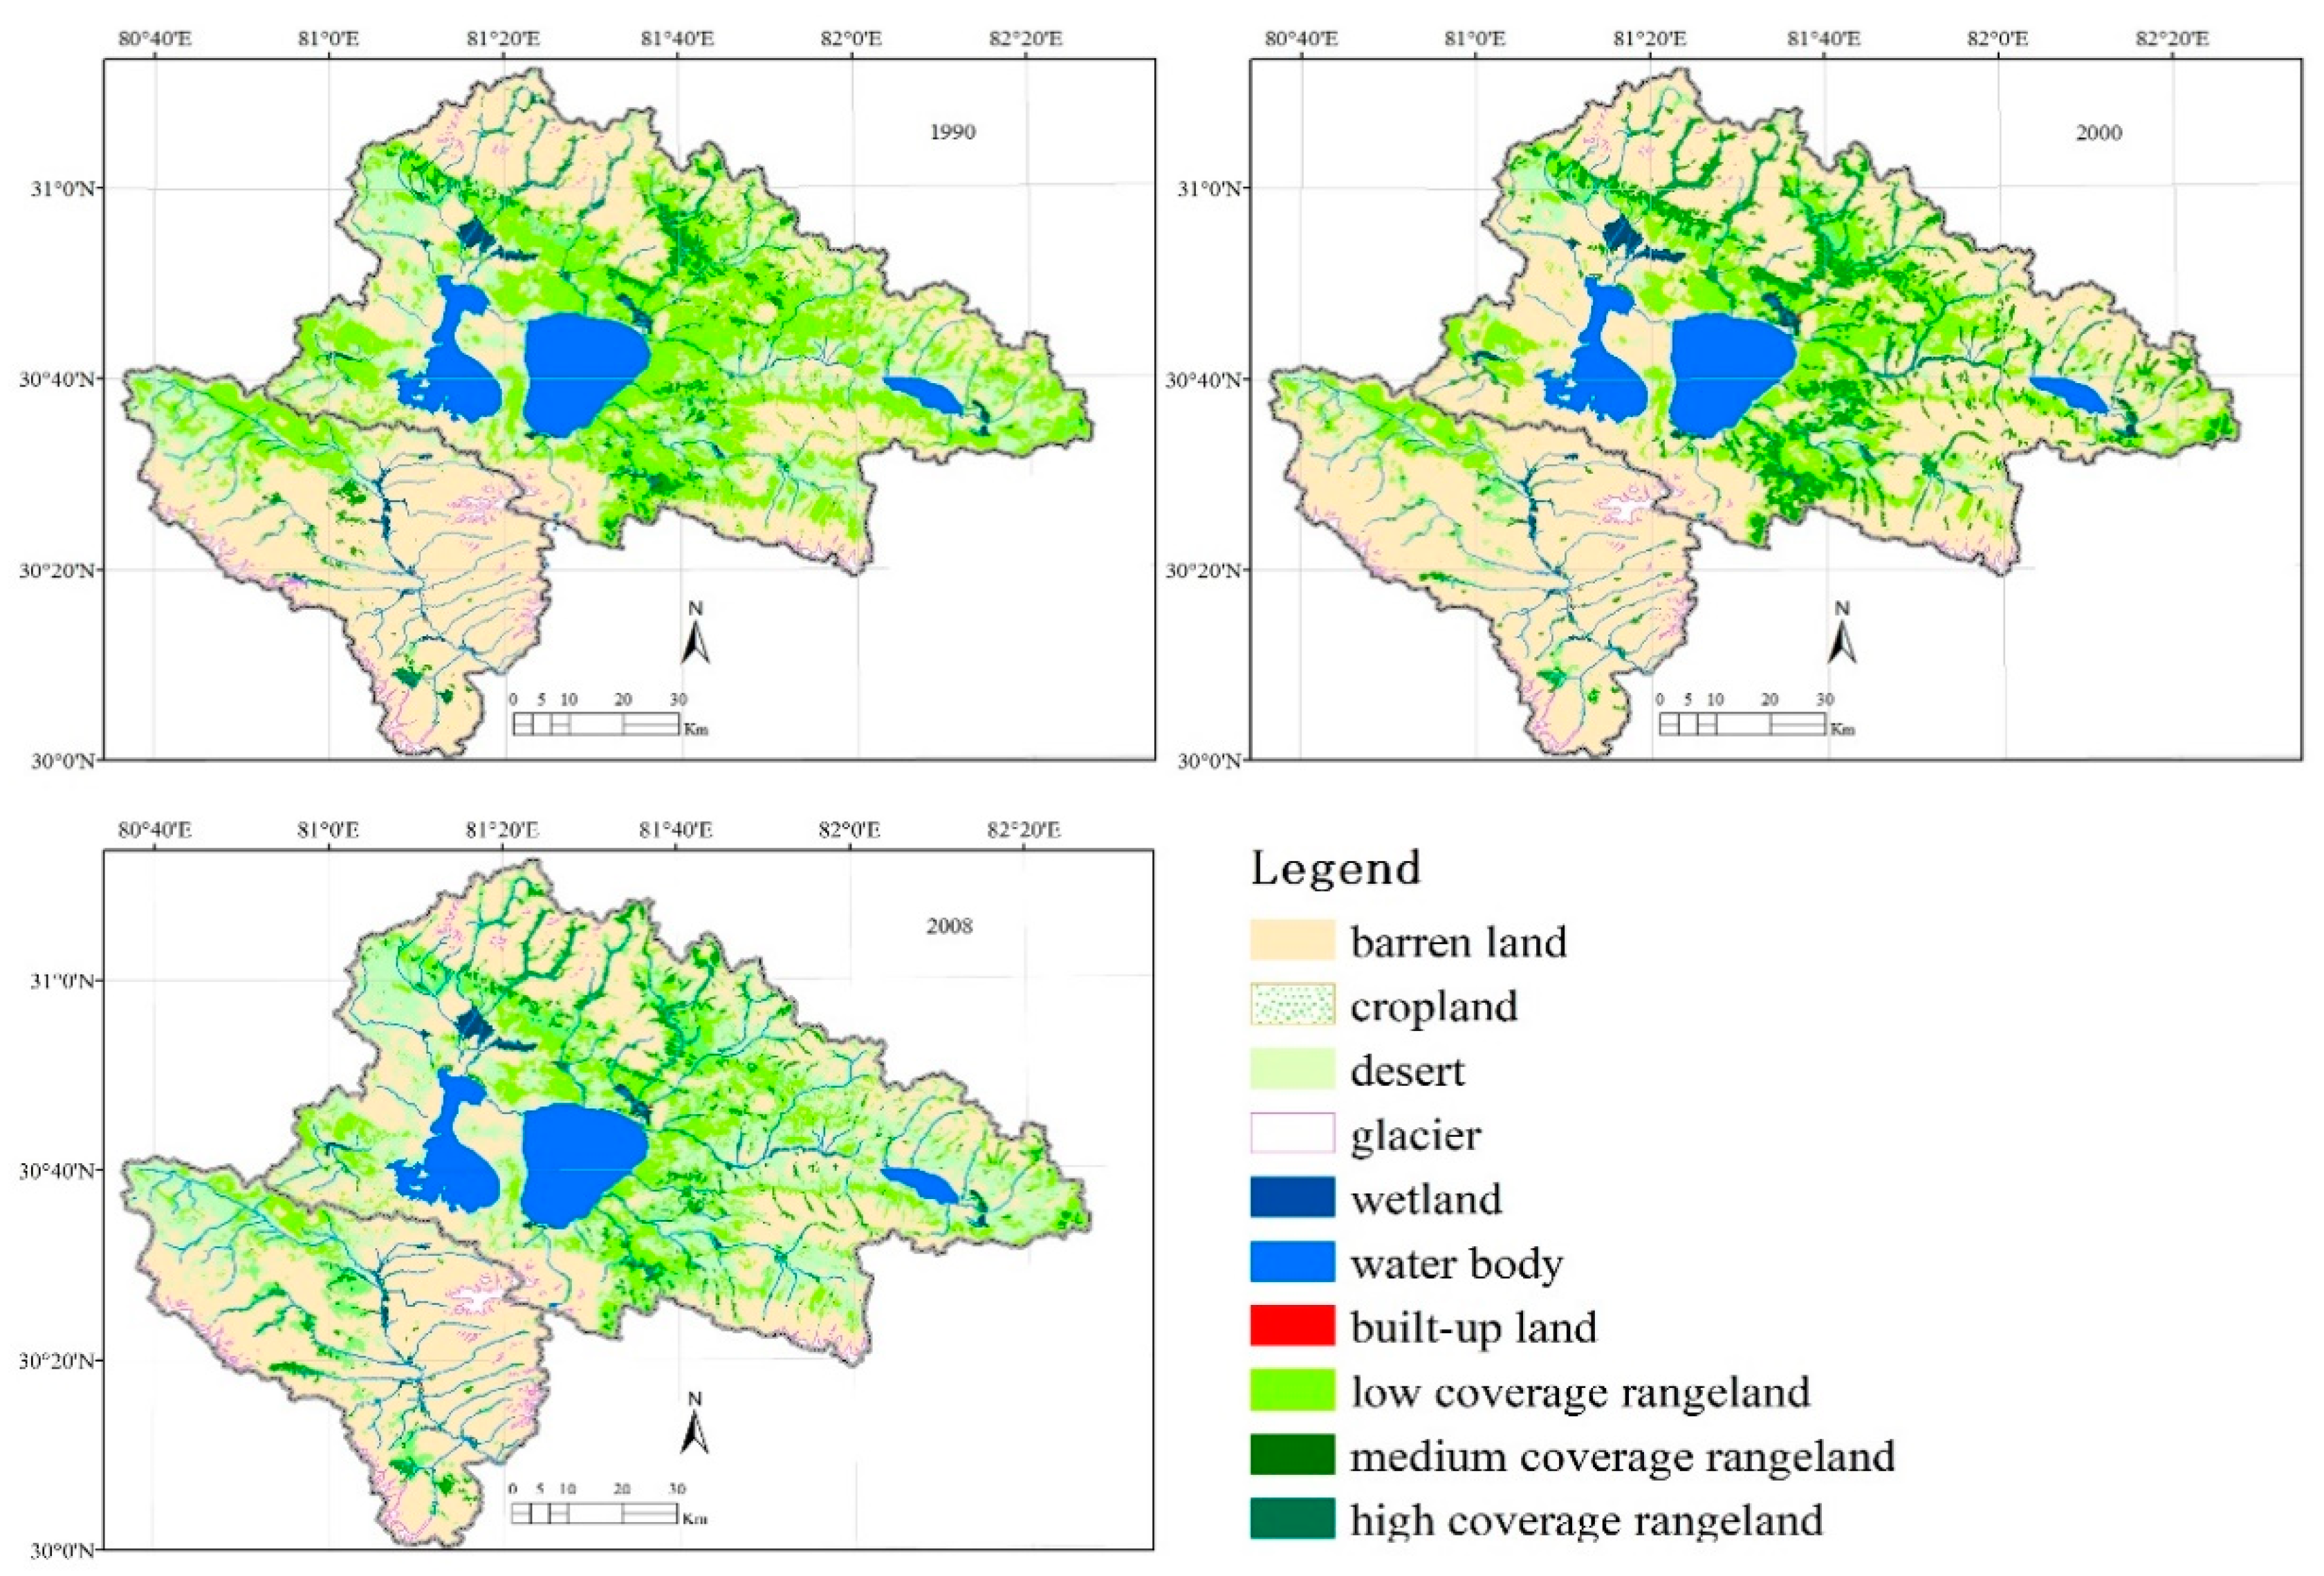
3.1.1. Land Use and Land Cover Pattern in 2008

The land use and land cover of KSL-China were dominated by barren land, deserts, and low coverage rangeland. The other types of land only accounted for 14% of total cover (Table 2). Built-up land, cropland, and high coverage rangeland covered the least area. Natural and semi-natural landscapes, i.e., glacier, lake, desert, rangeland, wetland, and barren land, occupied most of the total area in the Manasarovar basin (Figure 2). While human-made landscapes, i.e., cropland and built-up land, were mostly distributed in the Karnali basin. Rangeland amounted to about 30% of total area in the Manasarovar basin, whereas less than 17% of the total in the Karnali basin (Table 2). Wetland was mostly distributed in Manasarovar basin with an area of 80.36 km2. The areas of water bodies were 735.15 km2, and 4.11 km2 in the Manasarovar basin and the Karnali basin, respectively. In contrast, barren land amounted to 50% of the total lands in Karnali basin, which is 20% higher than that in the Manasarovar basin. In addition, the total glacier covers in Karnali basin (182.60 km2) are over twice of those in Manasarovar basin (79.72 km2).

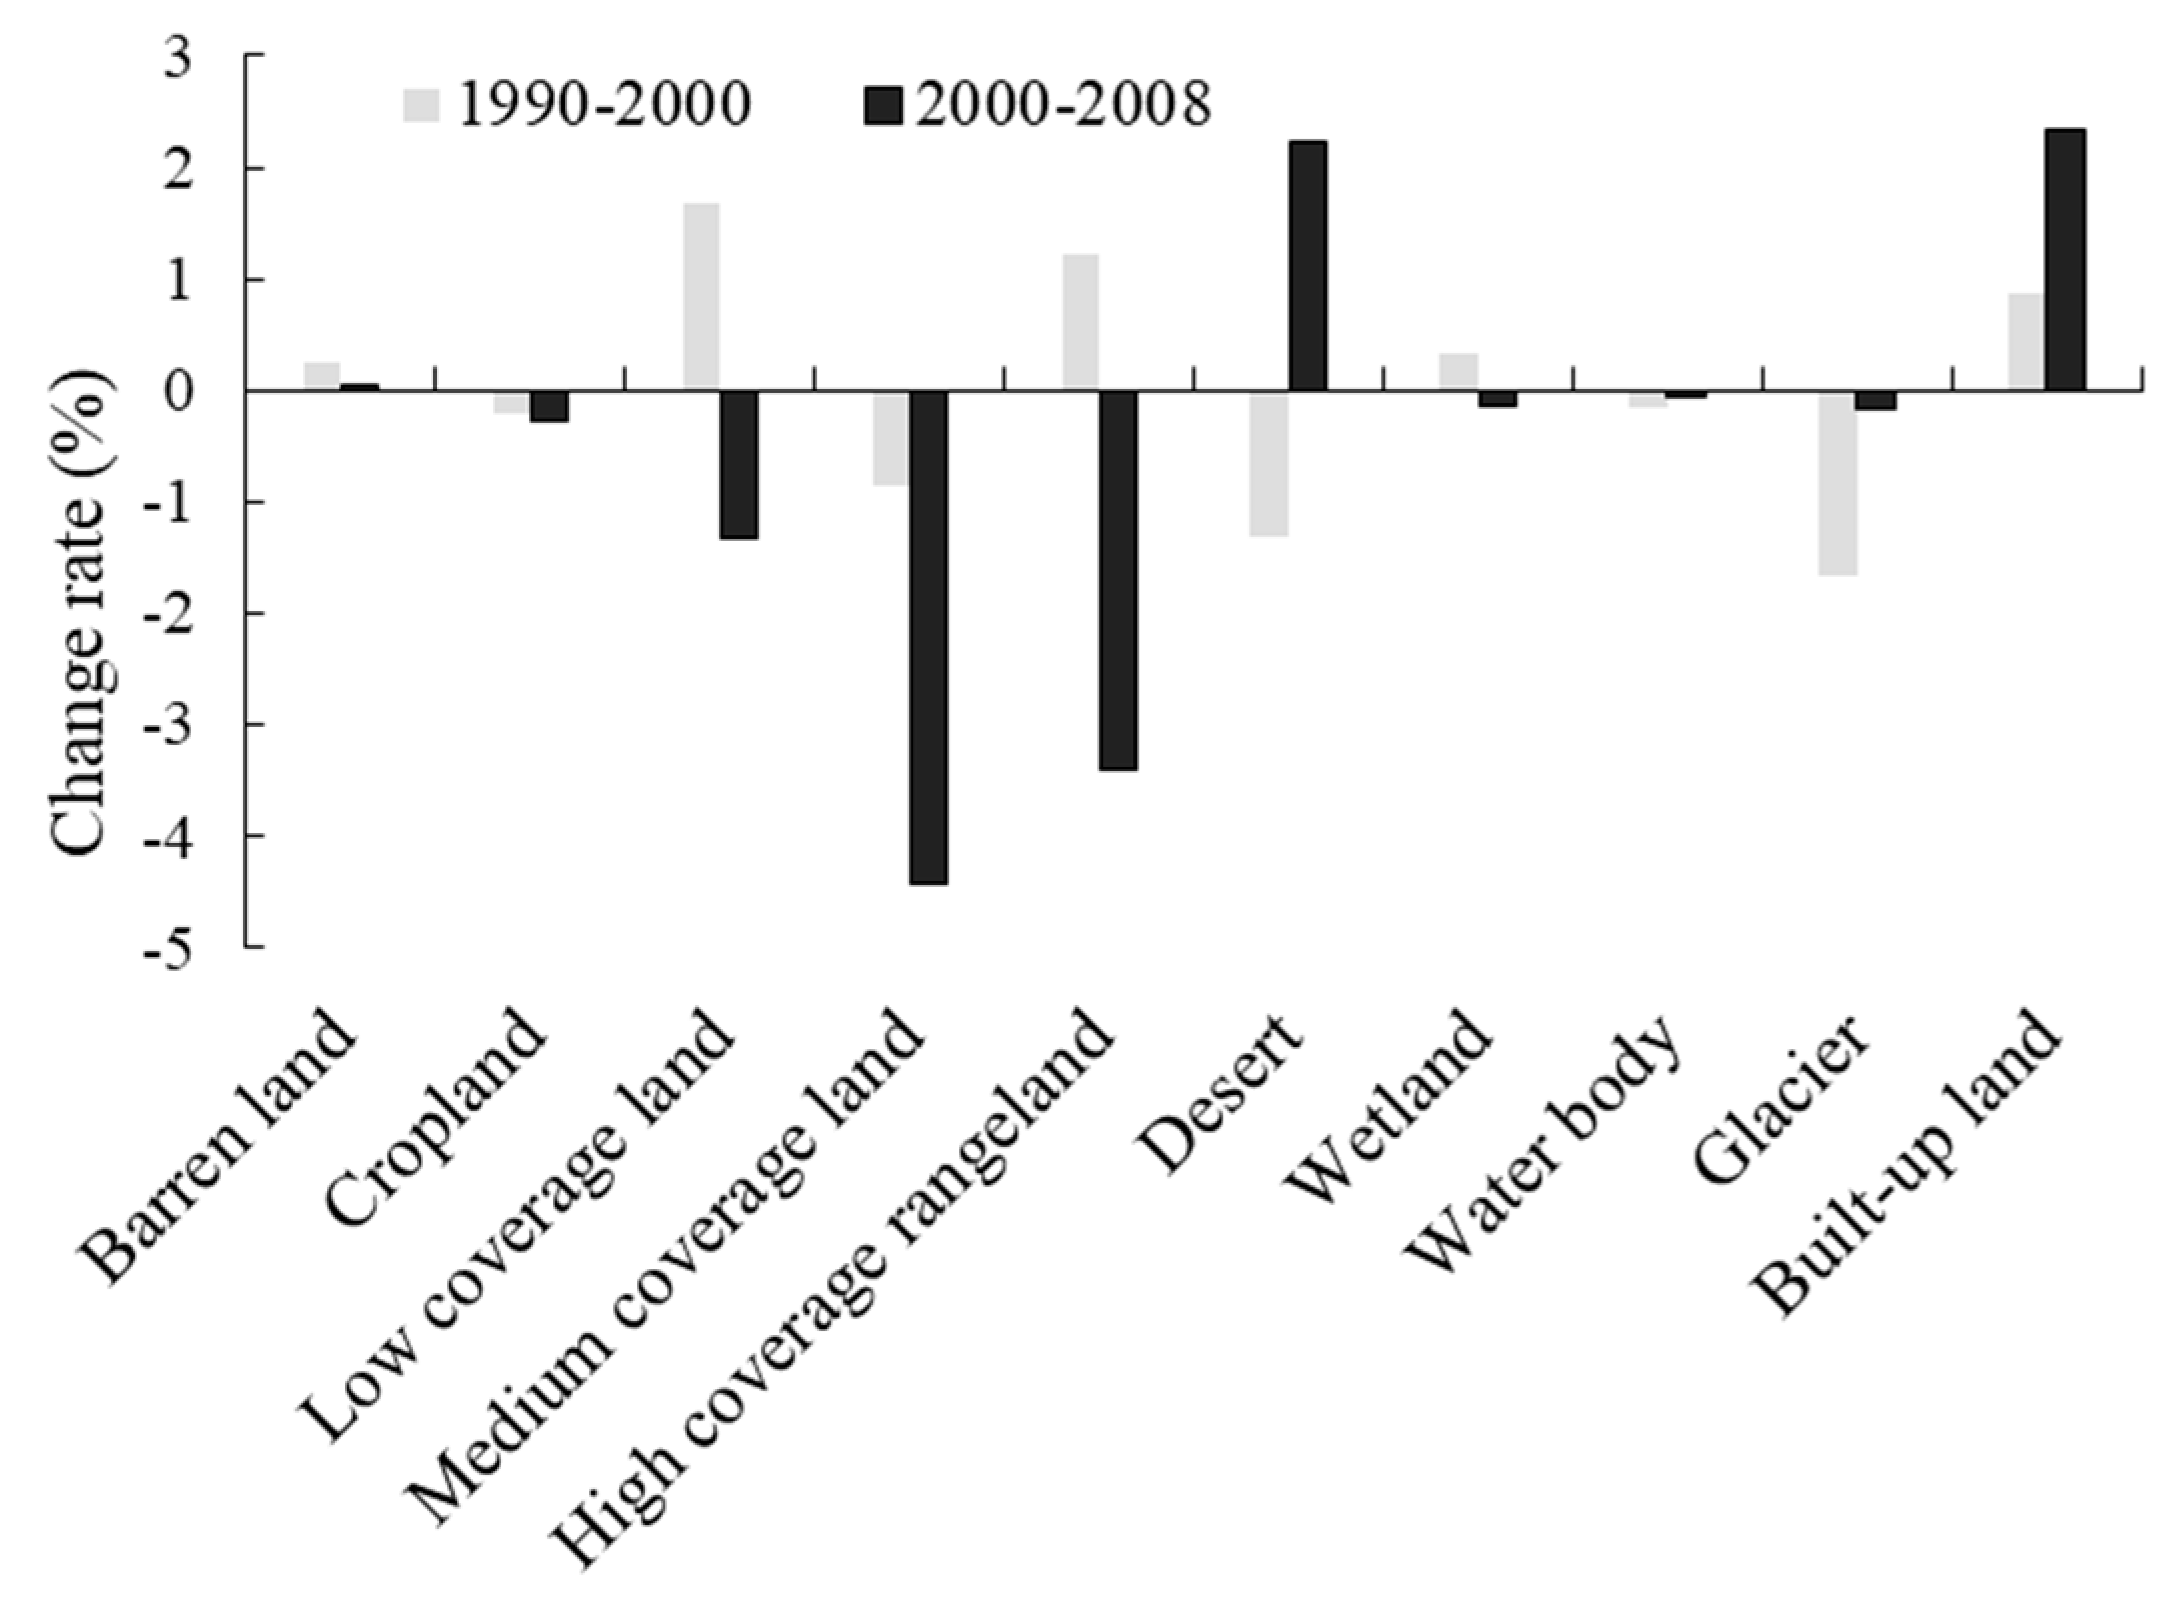
3.1.2. Spatio-Temporal Dynamics of LUCC during the Period 1990–2008

The spatial distribution of LUCC in KSL-China differed in the three phases, particularly in rangelands (Figure 2). During the period between 1990 and 2000, the most obvious changes were increase of low coverage and, high-coverage rangeland, built-up land, and a decrease in glaciers as well as desert (Figure 3). Most of the glaciers experienced dramatic retreat. The total glacier area reduced 16.70% from 319.52 km2 in 1990 to 266.17 km2 in 2000 (Table 3). The total area of lakes (including glacial lakes) also decreased 12.34 km2 within 10 years, but there was no obvious change for the largest lake, i.e., Lake Manasarovar. Some small lakes (especially glacial lakes) even expanded into the Karnali Basin.
In the period between 2000 and 2008, rangelands showed obvious decrease of coverage, with decline areas of 161.27 km2 in the medium coverage rangeland (4.43% decrease per year), of 23.71 km2 in high coverage rangeland (3.41% decrease per year). In addition, the conversion of agricultural land to infrastructure land caused decrease of 0.24 km2 cropland, with 0.28% of decreasing rate every year. At the same time, the total built-up land increased 0.40 km2, with 2.33% of increasing every year. About 60% of this change took place in urban area and 40% in rural area. The conversion of agricultural land into infrastructural land is concentrated in Burang Township and Hor Township.
A remarkable conversion from rangeland to desert was found in the period 2000–2008. The area of land transition was 546.77 km2 (Table 4). At the same period, 3.71 km2 of glacier recession area was converted into barren land. As for man-made landscape, the largest land transformation was from cropland to built-up land, with an area of 0.23 km2, mostly concentrated in the Karnali basin.

3.2. Impacts of Climate Change and Human Disturbance on Land Cover

3.2.1. Climate Change and Its Relationship with Vegetation Cover

In the period 2000–2015, growing season precipitation (GSP) varied yearly but showed a relatively stable trend (Figure 4), whereas the mean growing season temperature (GST) showed an obvious increase trend, indicated that climatic warming was prevailing in this period. In the growing season, NDVI declined in the period 2000–2009, positively correlated with GSP (r = 0.66, p < 0.05), suggesting that GSP could be the key factor driving vegetation cover changes (Figure 4).

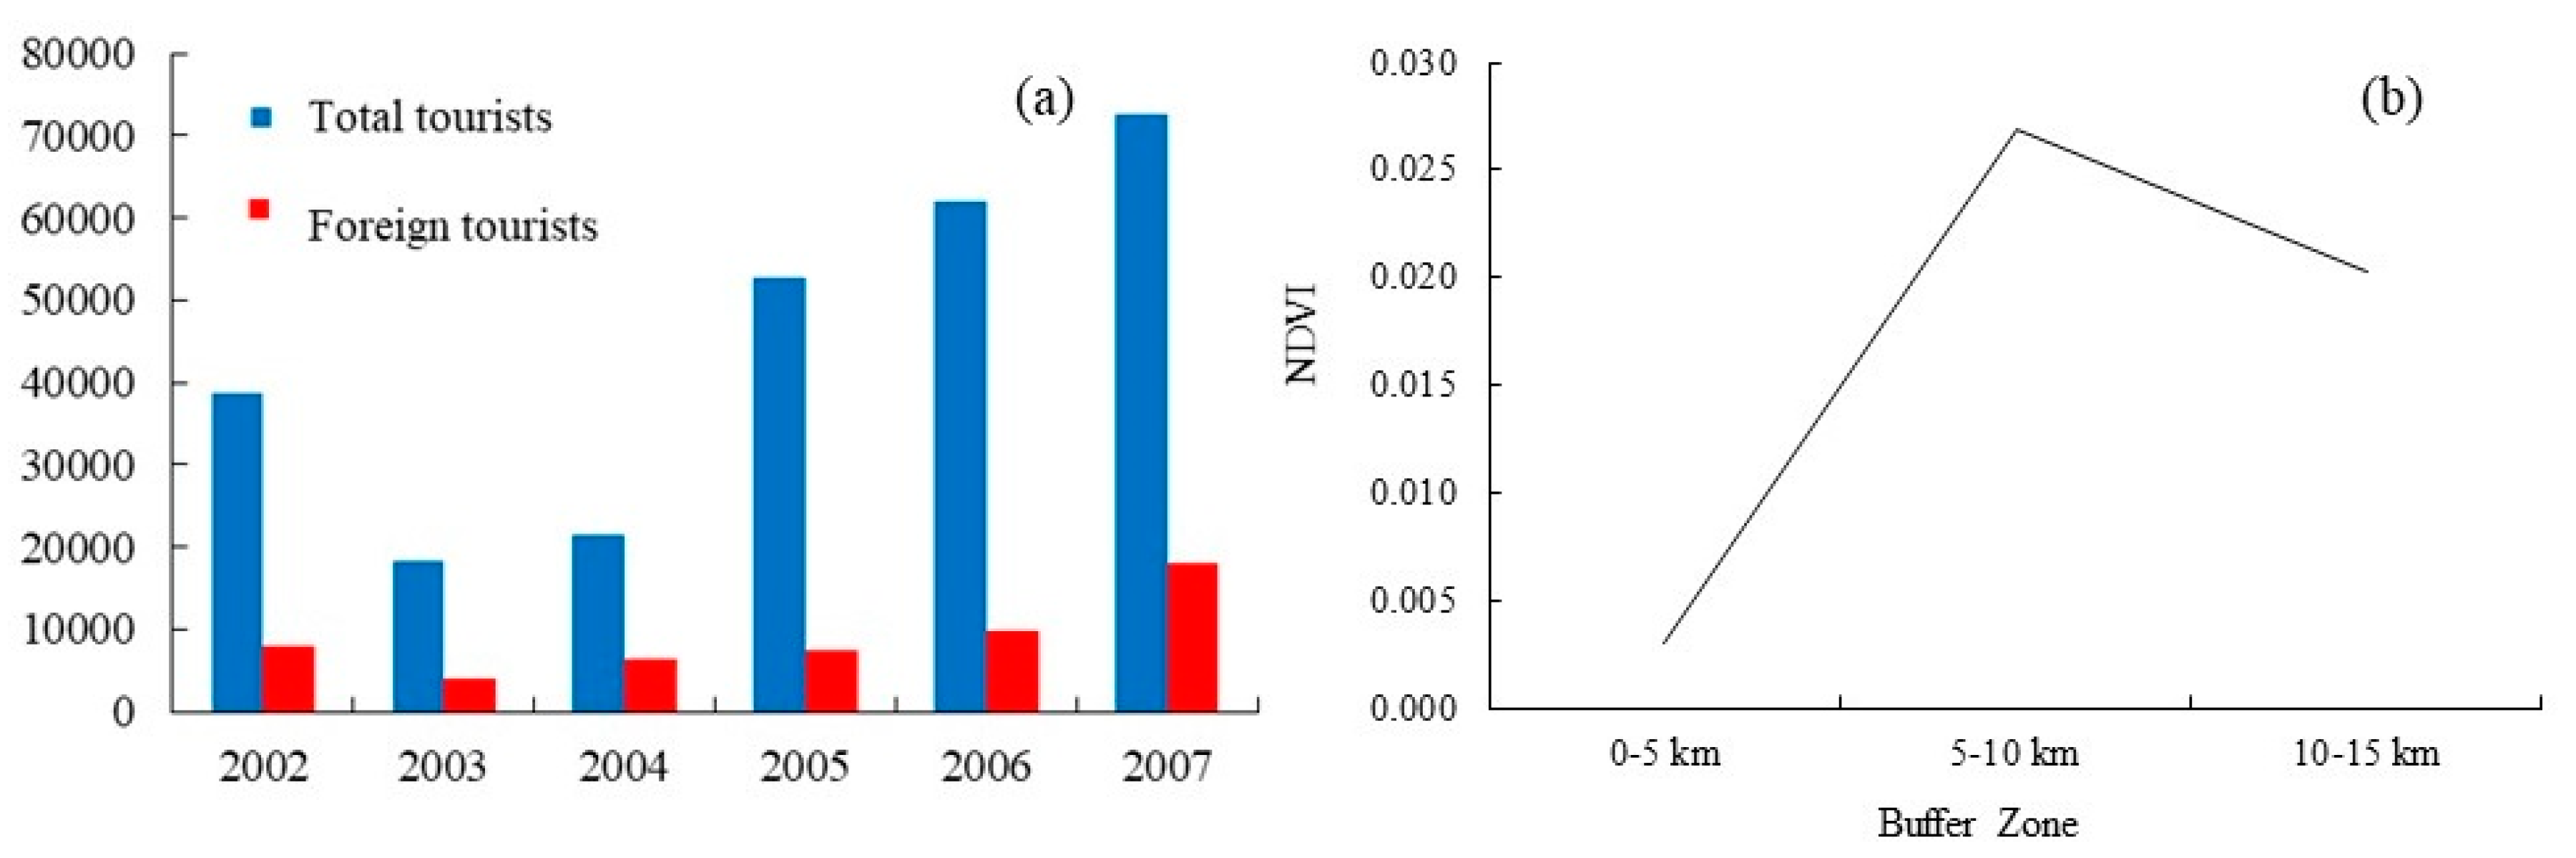
3.2.2. Impact of Tourism on Vegetation Cover

The number of tourists to Kailash has been increasing since 2000 and reached over 70,000 in 2007 according to local recorded data (Figure 5a). Tourist trampling had adverse impact on vegetation cover within certain distance to the pilgrimage routes (Figure 5b). Remote sensing analysis showed that vegetation cover reduced lowest along the pilgrimage routes within a 5km distance, but gradually increased within 5–10 km, and reached stable state over 15 km.

4. Discussion

4.1. LUCC and Its Primary Driving Factors in the KSL-China

The arid rangelands in the KSL-China dominated by alpine desert-steppe are sensitive to climate change, especially to the interaction between climatic warming and interannual variation of precipitation, and its induced extreme climatic events and drought. Evidence showed that there was an increasing warming and drought trend over the western Tibetan Plateau in the past decades [59,60,61,62]. In particular, temperature extremes, such as maximum temperature and the warmest days have being increased [63]. According to the data of Burang Meteorological Observation, annual air temperature increased by 1.2 °C, while the annual precipitation decreased by about 50 mm (25% of the total annual precipitation) in the past 30 years. The decreasing precipitation and increasing evapotranspiration with the climate warming exacerbated the drought in the study landscape.
Our study found that the coverage of rangeland exhibited dramatic fluctuations due to the increasing drought and climate warming. In addition, quite a number of rangelands were degraded to desert from 2000 to 2008. In line with previous studies, decreasing precipitation and increasing climate warming was shown to contribute to dramatic LUCC and rangeland degradation. For example, Wang et al. [64] found that climatic variation had more negative impact on rangeland, and such effect was significantly higher than overgrazing-induced rangeland disservice Similarly, some studies suggested increasing warming would decrease rangeland quality and net primary productivity on the Tibetan Plateau [65,66]. The Tibetan Plateau has experienced significant climate warming and rainfall decline in the past decades [63]. We also found that climatic warming was prevailing in the study period, and vegetation cover declined with increasing warming in the KSL-China. Moreover, decreasing precipitation could interact with climate warming to exacerbate vegetation degradation. The dramatic decline of vegetation cover in the period 2000–2009 was in consistent with the observation of grassland degradation by Chen et al. [67] on the Tibetan Plateau.
Although overgrazing is commonly considered to reduce vegetation cover and result in rangeland degradation, there are limited impacts of grazing on LUCC in this study. Duan et al. [54] found the livestock stocking rate remained within rangeland carrying capacity in KSL-China from 2000 to 2015, mostly owing to controlled livestock population by local government. These results and facts suggested that climate change might exert overwhelming impacts on land cover change, in consistent with the more importance of climate change on vegetation change in western Tibetan Plateau by Chen et al. [67]. Although disturbance from pilgrims and tourists was also one of the reasons for the rangeland cover change due to pressure of increasing number of visitors, the impacts were actually limited, especially along the Kora routes of Mount Kailash and Lake Manasarovar. This was proved by the buffer analysis of vegetation cover change from different distances to the routes.
With increasing warming, most of the glaciers in the KSL-China were subject to dramatic deglaciation from 1990 to 2008, with 17.9% of area decrease. Ye et al. [68] also found accelerated glacier recession in the Manasarovar basin after 1990s owing to climatic warming. Previous studies indicated that glaciers had shown an accelerating trend of more negative mass balance since the early 1990s in the Himalayas region [69,70,71,72]. Yao et al. [73] also revealed that air temperature presented a modest warming trend in Tibet since 1960. Therefore, increasing glacial melting induced by the warming is the dominant contributor to glacial recession in KSL-China.
Additionally, our results showed that increasing urbanization and rural settlement expansion induced cropland conversion into built-up land in the period 2000–2008. Population and travelers increase, and subsequent infrastructure construction may boost this change. Population increased from 7900 in 2000 to 10,000 in 2010 in Burang County. Spreading human land use has caused remarkable increase of urban area over the world [74]. The KSL-China has been undergoing a great boom of recreation industry since 2000. Travelers reached tens of thousands each year. Tourists and pilgrims are both the factors driving built-up land expansion, particularly focus on the Burang Township, Baga and Hor Township. However, Zhumanova et al. [75] found that farmers’ decision-making could influence land use changes in agro-pastoral systems, especially when considering income and profit of land increment. Pursuing the improvement of dwelling condition and homestead inn for tourism service also to some extent enhanced land requirement for rural settlement. As a result, more croplands were transformed into built-up lands in KSL-China.

4.2. Implication for Landscape Management

Climatic warming and human activities have played a vital role in reducing in rangeland quality and cropland area in the study period. The resultant LUCC due to climate changes and human disturbance has been stressed in the Himalayas in previous studies, particularly cropland and rangeland changes in remote mountainous area [76,77]. Maselli [78] suggested that grazing management should be improved in alpine rangelands. Together with previous LUCC studies, we found that rangeland degradation and cropland lost were common phenomena owing to climatic warming and human disturbance in the Himalayan region.
On the other hand, tourism to local sacred places is regarded as the pillar industry which is encouraged and promoted by local government. However, human disturbance by visitors is prone to cause the loss of biodiversity and ecosystem services [79]. Therefore, tourism within environment carrying capacity must be advocated. Ecotourism development can provide a safeguarding for culture, recreation, and environment in mountain communities [80]. Ecotourism has been proved to be an effective pathway to ameliorate ecosystem degradation and conserve local cultures and traditional lifestyles in mountain communities [81]. More importantly, ecotourism can accelerate economic development through tertiary industry in remote area. Despite increasing growth of tourism also leads to intensive land use [82], the land area conversion to built-up land is relatively limited. Considering quite a great number of rangeland is still undergoing quality degradation in the KSL-China, rangeland conservation is particularly urgent. Therefore, service-based ecotourism is suggested as a sustainable alternative to livestock-focused animal husbandry in the sacred landscape. In fact, local people in the KSL-China are inclined to work in a non-traditional tertiary sector due to rapid change in economic structure. But Reif et al. [83] warned that tourism should be prudently developed in traditional cultural landscapes. Otherwise, it is likely to cause pollution and environmental degradation. Wisdom to balance economic development and landscape conservation is required for sustainable development of the sacred landscape.

5. Conclusions

Land use and land cover experienced remarkable changes in the KSL-China because of climatic warming and human disturbance during the period of 1990–2008. On the one hand, the rangeland suffered from obvious fluctuations owing to climatic warming and drought, specifically with dramatic decrease of high- and medium-coverage rangeland. Most of the glaciers also retreated due to melting caused by increasing climatic warming. On the other hand, increasing human disturbance has accelerated intensive land use, particularly conversion from cropland to built-up land for infrastructure construction due to tourism development. We conclude that climatic warming and human disturbance may jointly affect LUCC in the KSL-China. Balanced agriculture and service-based ecotourism development is suggested for a substitute for livestock-focused animal husbandry.

Author Contributions

P.S. and C.D. conceived the paper; C.D. and C.Z. analyzed the data; C.D. wrote the paper; and P.S., M.S., X.Z. and N.Z. revised the paper.

Funding

This study was funded by the GIZ and DIFID supported ICIMOD program of Kailash Sacred Landscape Conservation and Development Initiative, and the National Key Research and Development Program of China (2016YFC0502001).

Conflicts of Interest

The authors declare no conflict of interest.

References

  1. Song, W.; Deng, X. Land-use/land-cover change and ecosystem service provision in China. Sci. Total Environ. 2017, 576, 705–719. [Google Scholar] [CrossRef]
  2. Gao, G.; Fu, B.; Wang, S.; Liang, W.; Jiang, X. Determining the hydrological responses to climate variability and land use/cover change in the Loess Plateau with the Budyko framework. Sci. Total Environ. 2016, 557–558, 331–342. [Google Scholar] [CrossRef] [PubMed]
  3. Willcock, S.; Phillips, O.L.; Platts, P.J.; Swetnam, R.D.; Balmford, A.; Burgess, N.D.; Ahrends, A.; Bayliss, J.; Doggart, N.; Doody, K. Land cover change and carbon emissions over 100 years in an African biodiversity hotspot. Glob. Chang. Biol. 2016, 22, 2787–2800. [Google Scholar] [CrossRef] [Green Version]
  4. Lozano-García, B.; Parras-Alcántara, L.; Cantudo-Pérez, M. Land use change effects on stratification and storage of soil carbon and nitrogen: Application to a Mediterranean nature reserve. Agric. Ecosyst. Environ. 2016, 231, 105–113. [Google Scholar] [CrossRef]
  5. Costanza, R.; de Groot, R.; Sutton, P.; van der Ploeg, S.; Anderson, S.J.; Kubiszewski, I.; Farber, S.; Turner, R.K. Changes in the global value of ecosystem services. Glob. Environ. Chang. 2014, 26, 152–158. [Google Scholar] [CrossRef]
  6. Li, C. Effect of different land use and land use change on ammonia oxidiser abundance and N2O emissions. Soil Biol. Biochem. 2016, 96, 169–175. [Google Scholar] [CrossRef]
  7. Post, W.M.; Kwon, K.C. Soil carbon sequestration and land-use change: Processes and potential. Glob. Chang. Biol. 2010, 6, 317–327. [Google Scholar] [CrossRef]
  8. Goldewijk, K.K. Estimating global land use change over the past 300 years: The HYDE Database. Glob. Biogeochem. Cycles 2001, 15, 417–433. [Google Scholar] [CrossRef] [Green Version]
  9. Meiyappan, P.; Dalton, M.; O’Neill, B.C.; Jain, A.K. Spatial modeling of agricultural land use change at global scale. Ecol. Model. 2014, 291, 152–174. [Google Scholar] [CrossRef] [Green Version]
  10. Houghton, R.A. The Worldwide Extent of Land-Use Change. Bioscience 1994, 44, 305–313. [Google Scholar] [CrossRef]
  11. Scientific Steering Committee; International Project Office of LUCC; Nunes, C.; Augé, J.I. Land-Use and Land-Cover Change (LUCC): Implementation Strategy; Environmental Policy Collection; IGBP Secretariat: Stockholm, Sweden, 1999. [Google Scholar]
  12. Tscharntke, T.; Klein, A.M.; Kruess, A.; Steffan-Dewenter, I.; Thies, C. Landscape Perspectives on Agricultural Intensification and Biodiversity—Ecosystem Service Management. Ecol. Lett. 2010, 8, 857–874. [Google Scholar] [CrossRef]
  13. Guo, L.B.; Gifford, R.M. Soil carbon stocks and land use change: A meta analysis. Glob. Chang. Biol. 2010, 8, 345–360. [Google Scholar] [CrossRef]
  14. Eugenia, K.; Ming, C. Impact of urbanization and land-use change on climate. Nature 2003, 423, 528–531. [Google Scholar]
  15. Metzger, M.J.; Rounsevell, M.D.A.; Acosta-Michlik, L.; Leemans, R.; Schröter, D. The vulnerability of ecosystem services to land use change. Agric. Ecosyst. Environ. 2006, 114, 69–85. [Google Scholar] [CrossRef]
  16. Titeux, N.; Henle, K.; Mihoub, J.B.; Regos, A.; Geijzendorffer, I.R.; Cramer, W.; Verburg, P.H.; Brotons, L. Biodiversity scenarios neglect future land-use changes. Glob. Chang. Biol. 2016, 22, 2505–2515. [Google Scholar] [CrossRef]
  17. Perring, M.P.; De, F.P.; Baeten, L.; Maes, S.L.; Depauw, L.; Blondeel, H.; Carón, M.M.; Verheyen, K. Global environmental change effects on ecosystems: The importance of land-use legacies. Glob. Chang. Biol. 2016, 22, 1361–1371. [Google Scholar] [CrossRef]
  18. Schröter, D.; Cramer, W.; Leemans, R.; Prentice, I.C.; Araújo, M.B.; Arnell, N.W.; Bondeau, A.; Bugmann, H.; Carter, T.R.; Gracia, C.A.; et al. Ecosystem Service Supply and Vulnerability to Global Change in Europe. Science 2005, 310, 1333. [Google Scholar] [CrossRef]
  19. Bai, J.-H.; Lu, Q.-Q.; Wang, J.-J.; Zhao, Q.-Q.; Ouyang, H.; Deng, W.; Li, A.-N. Landscape pattern evolution processes of alpine wetlands and their driving factors in the Zoige Plateau of China. J. Mt. Sci. 2013, 10, 54–67. [Google Scholar] [CrossRef]
  20. Sharma, L.N.; Vetaas, O.R.; Chaudhary, R.P.; Måren, I.E. Ecological consequences of land use change: Forest structure and regeneration across the forest-grassland ecotone in mountain pastures in Nepal. J. Mt. Sci. 2014, 11, 838–849. [Google Scholar] [CrossRef]
  21. Yu, K.-F.; Lehmkuhl, F.; Falk, D. Quantifying land degradation in the Zoige Basin, NE Tibetan Plateau using satellite remote sensing data. J. Mt. Sci. 2017, 14, 77–93. [Google Scholar] [CrossRef]
  22. Nie, Y.; Sheng, Y.; Liu, Q.; Liu, L.; Liu, S.; Zhang, Y.; Song, C. A regional-scale assessment of Himalayan glacial lake changes using satellite observations from 1990 to 2015. Remote Sens. Environ. 2017, 189, 1–13. [Google Scholar] [CrossRef]
  23. Molau, U.; Nordenhäll, U.; Eriksen, B. Onset of flowering and climate variability in an alpine landscape: A 10-year study from Swedish Lapland. Am. J. Bot. 2005, 92, 422–431. [Google Scholar] [CrossRef]
  24. Heidi, S.; Chris, L.; Painter, T.H.; Justin, A.; Edward, A. Biological consequences of earlier snowmelt from desert dust deposition in alpine landscapes. Proc. Natl. Acad. Sci. USA 2009, 106, 11629–11634. [Google Scholar] [Green Version]
  25. Rehnus, M.; Bollmann, K.; Schmatz, D.R.; Hackländer, K.; Braunisch, V. Alpine glacial relict species losing out to climate change: The case of the fragmented mountain hare population (Lepus timidus) in the Alps. Glob. Chang. Biol. 2018, 24, 3236–3253. [Google Scholar] [CrossRef]
  26. Wipf, S.; Stoeckli, V.; Bebi, P. Winter climate change in alpine tundra: Plant responses to changes in snow depth and snowmelt timing. Clim. Chang. 2009, 94, 105–121. [Google Scholar] [CrossRef]
  27. Song, G.; An, N.; Ning, Z.; He, Y.; Shi, P.; Zhang, J.; He, N. Climate warming impacts on soil organic carbon fractions and aggregate stability in a Tibetan alpine meadow. Soil Biol. Biochem. 2018, 116, 224–236. [Google Scholar]
  28. Fetene, A.; Hilker, T.; Yeshitela, K.; Prasse, R.; Cohen, W.; Yang, Z. Detecting Trends in Landuse and Landcover Change of Nech Sar National Park, Ethiopia. Environ. Manag. 2016, 57, 137–147. [Google Scholar] [CrossRef]
  29. Hansen, M.C.; Loveland, T.R. A review of large area monitoring of land cover change using Landsat data. Remote Sens. Environ. 2012, 122, 66–74. [Google Scholar] [CrossRef]
  30. Fang, X.; Zhu, Q.; Ren, L.; Chen, H.; Wang, K.; Peng, C. Large-scale detection of vegetation dynamics and their potential drivers using MODIS images and BFAST: A case study in Quebec, Canada. Remote Sens. Environ. 2018, 206, 391–402. [Google Scholar] [CrossRef]
  31. Yin, H.; Pflugmacher, D.; Li, A.; Li, Z.; Hostert, P. Land use and land cover change in Inner Mongolia—Understanding the effects of China’s re-vegetation programs. Remote Sens. Environ. 2018, 204, 918–930. [Google Scholar] [CrossRef]
  32. Li, X.; Gong, P.; Liang, L. A 30-year (1984–2013) record of annual urban dynamics of Beijing City derived from Landsat data. Remote Sens. Environ. 2015, 166, 78–90. [Google Scholar] [CrossRef]
  33. Fu, P.; Weng, Q. A time series analysis of urbanization induced land use and land cover change and its impact on land surface temperature with Landsat imagery. Remote Sens. Environ. 2016, 175, 205–214. [Google Scholar] [CrossRef]
  34. Kovalskyy, V.; Roy, D.P. The global availability of Landsat 5 TM and Landsat 7 ETM+ land surface observations and implications for global 30 m Landsat data product generation. Remote Sens. Environ. 2013, 130, 280–293. [Google Scholar] [CrossRef]
  35. Xu, Y.; Yu, L.; Zhao, F.R.; Cai, X.; Zhao, J.; Lu, H.; Gong, P. Tracking annual cropland changes from 1984 to 2016 using time-series Landsat images with a change-detection and post-classification approach: Experiments from three sites in Africa. Remote Sens. Environ. 2018, 218, 13–31. [Google Scholar] [CrossRef]
  36. Coulter, L.L.; Stow, D.A.; Tsai, Y.-H.; Ibanez, N.; Shih, H.-C.; Kerr, A.; Benza, M.; Weeks, J.R.; Mensah, F. Classification and assessment of land cover and land use change in southern Ghana using dense stacks of Landsat 7 ETM+ imagery. Remote Sens. Environ. 2016, 184, 396–409. [Google Scholar] [CrossRef]
  37. Hu, T.; Huang, X.; Li, J.; Zhang, L. A novel co-training approach for urban land cover mapping with unclear Landsat time series imagery. Remote Sens. Environ. 2018, 217, 144–157. [Google Scholar] [CrossRef]
  38. Detsch, F.; Otte, I.; Appelhans, T.; Hemp, A.; Nauss, T. Seasonal and long-term vegetation dynamics from 1-km GIMMS-based NDVI time series at Mt. Kilimanjaro, Tanzania. Remote Sens. Environ. 2016, 178, 70–83. [Google Scholar] [CrossRef]
  39. Leroux, L.; Bégué, A.; Lo Seen, D.; Jolivot, A.; Kayitakire, F. Driving forces of recent vegetation changes in the Sahel: Lessons learned from regional and local level analyses. Remote Sens. Environ. 2017, 191, 38–54. [Google Scholar] [CrossRef]
  40. Zambrano, F.; Vrieling, A.; Nelson, A.; Meroni, M.; Tadesse, T. Prediction of drought-induced reduction of agricultural productivity in Chile from MODIS, rainfall estimates, and climate oscillation indices. Remote Sens. Environ. 2018, 219, 15–30. [Google Scholar] [CrossRef]
  41. Grêtregamey, A.; Bebi, P.; Bishop, I.D.; Schmid, W.A. Linking GIS-based models to value ecosystem services in an Alpine region. J. Environ. Manag. 2008, 89, 197–208. [Google Scholar] [CrossRef]
  42. Bian, J.; Li, A.; Zhang, Z.; Zhao, W.; Lei, G.; Yin, G.; Jin, H.; Tan, J.; Huang, C. Monitoring fractional green vegetation cover dynamics over a seasonally inundated alpine wetland using dense time series HJ-1A/B constellation images and an adaptive endmember selection LSMM model. Remote Sens. Environ. 2017, 197, 98–114. [Google Scholar] [CrossRef]
  43. Santi, E.; Pettinato, S.; Paloscia, S.; Pampaloni, P.; Fontanelli, G.; Crepaz, A.; Valt, M. Monitoring of Alpine snow using satellite radiometers and artificial neural networks. Remote Sens. Environ. 2014, 144, 179–186. [Google Scholar] [CrossRef]
  44. Garrard, R.; Kohler, T.; Price, M.F.; Byers, A.C.; Sherpa, A.R.; Maharjan, G.R. Land Use and Land Cover Change in Sagarmatha National Park, a World Heritage Site in the Himalayas of Eastern Nepal. Mt. Res. Dev. 2016, 36, 299–310. [Google Scholar] [CrossRef]
  45. Maes, J.; Liquete, C.; Teller, A.; Erhard, M.; Paracchini, M.L.; Barredo, J.I.; Grizzetti, B.; Cardoso, A.; Somma, F.; Petersen, J.-E.; et al. An indicator framework for assessing ecosystem services in support of the EU Biodiversity Strategy to 2020. Ecosyst. Serv. 2016, 17, 14–23. [Google Scholar] [CrossRef] [Green Version]
  46. Tammi, I.; Mustajärvi, K.; Rasinmäki, J. Integrating spatial valuation of ecosystem services into regional planning and development. Ecosyst. Serv. 2017, 26, 329–344. [Google Scholar] [CrossRef] [Green Version]
  47. Yu, D.; Han, S. Ecosystem service status and changes of degraded natural reserves—A study from the Changbai Mountain Natural Reserve, China. Ecosyst. Serv. 2016, 20, 56–65. [Google Scholar] [CrossRef]
  48. Zhang, J.; Fu, M.; Hassani, F.P.; Zeng, H.; Geng, Y.; Bai, Z. Land Use-Based Landscape Planning and Restoration in Mine Closure Areas. Environ. Manag. 2011, 47, 739. [Google Scholar] [CrossRef]
  49. Brudvig, L.A.; Leroux, S.J.; Albert, C.H.; Bruna, E.M.; Davies, K.F.; Ewers, R.M.; Levey, D.J.; Pardini, R.; Resasco, J. Evaluating conceptual models of landscape change. Ecography 2017, 40, 74–84. [Google Scholar] [CrossRef]
  50. Grêt-Regamey, A.; Walz, A.; Bebi, P. Valuing Ecosystem Services for Sustainable Landscape Planning in Alpine Regions. Mt. Res. Dev. 2008, 28, 156–165. [Google Scholar] [CrossRef]
  51. Zomer, R.J.; Trabucco, A.; Metzger, M.; Oli, K.P. Environmental stratification of Kailash Sacred Landscape and projected climate change impacts on ecosystems and productivity. Icimod Work. Pap. 2013, 109, 399–415. [Google Scholar]
  52. Uddin, K.; Chaudhary, S.; Chettri, N.; Kotru, R.; Murthy, M.; Chaudhary, R.P.; Ning, W.; Shrestha, S.M.; Gautam, S.K. The changing land cover and fragmenting forest on the Roof of the World: A case study in Nepal’s Kailash Sacred Landscape. Landsc. Urban Plan. 2015, 141, 1–10. [Google Scholar] [CrossRef]
  53. Rai, R.; Zhang, Y.; Paudel, B.; Acharya, B.; Basnet, L. Land Use and Land Cover Dynamics and Assessing the Ecosystem Service Values in the Trans-Boundary Gandaki River Basin, Central Himalayas. Sustainability 2018, 10, 3052. [Google Scholar] [CrossRef]
  54. Duan, C.; Shi, P.; Zhang, X.; Zong, N.; Chai, X.; Geng, S.; Zhu, W. The Rangeland Livestock Carrying Capacity and Stocking Rate in the Kailash Sacred Landscape in China. J. Resour. Ecol. 2017, 8, 551–558. [Google Scholar] [CrossRef]
  55. Takada, T.; Miyamoto, A.; Hasegawa, S.F. Derivation of a yearly transition probability matrix for land-use dynamics and its applications. Landsc. Ecol. 2010, 25, 561–572. [Google Scholar] [CrossRef]
  56. De, R.M.; Vestergaard, O.M.; Staunstrup, J.K.; Trydeman, K.M.; Hermansen, J.E. Identifying Land Use and Land-Use Changes (LULUC): A Global LULUC Matrix. Environ. Sci. Technol. 2017, 51, 7954–7962. [Google Scholar]
  57. Benini, L.; Bandini, V.; Marazza, D.; Contin, A. Assessment of land use changes through an indicator-based approach: A case study from the Lamone river basin in Northern Italy. Ecol. Indic. 2010, 10, 4–14. [Google Scholar] [CrossRef]
  58. Fei, Z.; Kung, H.T.; Johnson, V.C. Assessment of Land-Cover/Land-Use Change and Landscape Patterns in the Two National Nature Reserves of Ebinur Lake Watershed, Xinjiang, China. Sustainability 2017, 9, 724. [Google Scholar] [Green Version]
  59. Wu, Q.; Zhang, T. Recent permafrost warming on the Qinghai-Tibetan Plateau. J. Geophys. Res. 2008, 113. [Google Scholar] [CrossRef] [Green Version]
  60. Liu, X.; Chen, B. Climatic warming in the Tibetan Plateau during recent decades. Int. J. Climatol. 2015, 20, 1729–1742. [Google Scholar] [CrossRef]
  61. Qin, Y.; Yang, D.; Gao, B.; Wang, T.; Chen, J.; Chen, Y.; Wang, Y.; Zheng, G. Impacts of climate warming on the frozen ground and eco-hydrology in the Yellow River source region, China. Sci. Total Environ. 2017, 605–606, 830–841. [Google Scholar] [CrossRef]
  62. You, Q.; Min, J.; Kang, S. Rapid warming in the Tibetan Plateau from observations and CMIP5 models in recent decades. Int. J. Climatol. 2016, 36, 2660–2670. [Google Scholar] [CrossRef]
  63. Wang, S.; Zhang, M.; Wang, B.; Sun, M.; Li, X. Recent changes in daily extremes of temperature and precipitation over the western Tibetan Plateau, 1973–2011. Quat. Int. 2013, 313–314, 110–117. [Google Scholar] [CrossRef]
  64. Wang, Z.; Deng, X.; Song, W.; Li, Z.; Chen, J. What is the main cause of grassland degradation? A case study of grassland ecosystem service in the middle-south Inner Mongolia. Catena 2017, 150, 100–107. [Google Scholar] [CrossRef]
  65. Klein, J.A.; Harte, J.; Zhao, X. Experimental warming, not grazing, decreases rangeland quality on the tibetan plateau. Ecol. Appl. 2007, 17, 541–557. [Google Scholar] [CrossRef] [PubMed]
  66. Gao, Q.; Guo, Y.; Xu, H.; Ganjurjav, H.; Li, Y.; Wan, Y.; Qin, X.; Ma, X.; Liu, S. Climate change and its impacts on vegetation distribution and net primary productivity of the alpine ecosystem in the Qinghai-Tibetan Plateau. Sci. Total Environ. 2016, 34–41. [Google Scholar] [CrossRef] [PubMed]
  67. Chen, B.; Zhang, X.; Tao, J.; Wu, J.; Wang, J.; Shi, P.; Zhang, Y.; Yu, C. The impact of climate change and anthropogenic activities on alpine grassland over the Qinghai-Tibet Plateau. Agric. For. Meteorol. 2014, 189–190, 11–18. [Google Scholar] [CrossRef]
  68. Ye, Q.; Yao, T.; Naruse, R. Glacier and lake variations in the Mapam Yumco basin, western Himalaya of the Tibetan Plateau, from 1974 to 2003 using remote-sensing and GIS technologies. J. Glaciol. 2008, 54, 933–935. [Google Scholar] [CrossRef]
  69. Kaab, A.; Berthier, E.; Nuth, C.; Gardelle, J.; Arnaud, Y. Contrasting patterns of early twenty-first-century glacier mass change in the Himalayas. Nature 2012, 488, 495–498. [Google Scholar] [CrossRef]
  70. Yao, T.; Thompson, L.; Yang, W.; Yu, W.; Gao, Y.; Guo, X.; Yang, X.; Duan, K.; Zhao, H.; Xu, B. Different glacier status with atmospheric circulations in Tibetan Plateau and surroundings. Nat. Clim. Chang. 2012, 2, 663–667. [Google Scholar] [CrossRef]
  71. Brahmbhatt, R.M.; Bahuguna, I.M.; Rathore, B.P.; Kulkarni, A.V.; Shah, R.D.; Rajawat, A.S.; Kargel, J.S. Significance of glacio-morphological factors in glacier retreat: A case study of part of Chenab basin, Himalaya. J. Mt. Sci. 2017, 14, 128–141. [Google Scholar] [CrossRef]
  72. Yao, T.; Yu, W. Recent Glacial Retreat and Its Impact on Hydrological Processes on the Tibetan Plateau, China, and Surrounding Regions. Arct. Antarct. Alp. Res. 2007, 39, 642–650. [Google Scholar] [CrossRef] [Green Version]
  73. Yao, T.D.; Thompson, L.G.; MosleyThompson, E.; Yang, Z.H.; Zhang, X.P.; Lin, P.N. Climatological significance of delta O-18 in north Tibetan ice cores. J. Geophys. Res. Atmos. 1996, 101, 29531–29537. [Google Scholar] [CrossRef]
  74. Lambin, E.F.; Meyfroidt, P. Global land use change, economic globalization, and the looming land scarcity. Proc. Natl. Acad. Sci. USA 2011, 108, 3465–3472. [Google Scholar] [CrossRef] [Green Version]
  75. Zhumanova, M.; Wrage-Mönnig, N.; Darr, D. Farmers’ Decision-making and Land Use Changes in Kyrgyz Agropastoral Systems. Mt. Res. Dev. 2016, 36, 506–517. [Google Scholar] [CrossRef]
  76. Paudel, B.; Gao, J.; Zhang, Y.; Wu, X.; Li, S.; Yan, J. Changes in Cropland Status and Their Driving Factors in the Koshi River Basin of the Central Himalayas, Nepal. Sustainability 2016, 8, 933. [Google Scholar] [CrossRef]
  77. Bhattarai, K.R.; Upadhyay, T.P. Rangeland Management in Sagarmatha (Mount Everest) National Park and Buffer Zone, Nepal: An Ecological Perspective. Mt. Res. Dev. 2013, 33, 19–28. [Google Scholar] [CrossRef]
  78. Maselli, D. Improving Sustainable Grazing Management in Mountain Rangelands of the Hindu Kush–Himalaya. Mt. Res. Dev. 2004, 24, 124–133. [Google Scholar] [CrossRef]
  79. Li, S.; Zhang, Y.; Wang, Z.; Li, L. Mapping human influence intensity in the Tibetan Plateau for conservation of ecological service functions. Ecosyst. Serv. 2018, 30, 276–286. [Google Scholar] [CrossRef]
  80. Aknazarov, O.; Dadabaev, I.; Melnichkov, D. Ecotourism in the Pamir Region: Problems and Perspectives. Mt. Res. Dev. 2002, 22, 188–190. [Google Scholar] [CrossRef]
  81. Nepal, S.K. Mountain Ecotourism and Sustainable Development. Mt. Res. Dev. 2002, 22, 104–109. [Google Scholar] [CrossRef]
  82. Martín, L.M. Tourist Expansion and Development of Rural Communities. Mt. Res. Dev. 2004, 24, 202–205. [Google Scholar] [CrossRef]
  83. Reif, A.; Ruşdea, E.; Păcurar, F.; Rotar, I.; Brinkmann, K.; Auch, E.; Goia, A.; Bühler, J. A Traditional Cultural Landscape in Transformation. Mt. Res. Dev. 2008, 28, 18–22. [Google Scholar] [CrossRef]
Figure 1. Location of the Kailash Sacred Landscape on the Tibetan Plateau.
Sustainability 11 01788 g001
Figure 2. Land use and land cover changes in KSL-China in three phases from1990 to 2008.
Sustainability 11 01788 g002
Figure 3. Change rate in land use and land cover from 1990 to 2008.
Sustainability 11 01788 g003
Figure 4. The relationship between climate change and Normalized difference vegetation index (NDVI) variation. (a) Annual variations of mean growing season temperature and precipitation. (b) NDVI changes from 2000 to 2009. (c) Correlation analysis between NDVI and climatic factors.
Sustainability 11 01788 g004
Figure 5. Tourism development and vegetation cover change of different distance to pilgrimage routes. (a) Statistical change of tourist number. (b) Impacts of tourist on vegetation covers from different distance to the pilgrimage routes.
Sustainability 11 01788 g005
Table 1. Land use classification system in the KSL-China.
Land ClassificationImplication
CroplandAgricultural land, including old and new cultivated lands, fallow land, crop-grass rotation field, agro-fruit land and agro-forestry land
Rangeland with low coverageLand with herbaceous types of cover. Rangeland coverage is between 10% and 30%
Rangeland with medium coverageLand with herbaceous types of cover. Rangeland coverage is between 30% and 60%
Rangeland with high coverageLand with herbaceous types of cover. Rangeland coverage is more than 60%
DesertLand with herbaceous types of cover. Vegetation coverage is between 2% and 10%
WetlandLand with a permanent mixture of water and herbaceous or woody vegetation.
Water bodiesLake, reservoirs, and rivers. Can be either fresh or salt-water bodies
GlacierLand under snow/ice cover throughout the year.
Built-up landLand covered by buildings and other man-made structures in urban and rural settlement.
Barren landLand with exposed soil, sand, rocks, or snow and never has more than 2% vegetated cover during any time of the year.
Table 2. Spatial distribution of land use and land cover in KSL in 2008.
Land Use and Land CoverKarnali BasinManasarovar BasinTotal Region
Area/km2Ratio/%Area/km2Ratio/%Area/km2Ratio/%
Cropland10.130.330.200.0010.330.10
Low coverage rangeland479.2415.651947.9425.032427.1822.39
Medium coverage rangeland29.520.96264.213.40293.732.71
High coverage rangeland1.320.0461.860.8063.190.58
Desert789.1225.772257.7429.023046.8628.10
Wetland14.780.4880.361.0395.140.88
Water body4.110.13735.159.45739.266.82
Glacier182.605.9679.721.02262.322.42
Built-up land1.920.060.630.012.550.02
Barren land1549.1650.592353.0430.243902.2035.99
Total3061.89100.007780.87100.0010,842.76100.00
Table 3. Land area of different land use in different phase (km2).
Land Cover199020002008
Year
Barren land3790.663882.453902.20
Cropland10.7810.5610.33
Low coverage rangeland2323.122715.272427.18
Medium coverage rangeland497.15455.00293.73
High coverage rangeland77.4286.9063.19
Desert2974.142585.143046.86
Wetland92.9696.1695.14
Water body755.03742.96739.26
Glacier319.52266.17262.32
Built-up land1.982.152.55
Table 4. Transition matrix of different land use and land cover types during 2000–2008 (area km2).
2008Barren LandCroplandLow Coverage RangelandMedium Coverage RangelandHigh Coverage RangelandDesertWetlandWater BodyGlacierBuilt-Up Land
2000
Barren land3876.620.000.570.030.005.110.000.110.000.00
Cropland0.0010.310.020.000.000.000.000.000.000.23
Low coverage rangeland0.140.002105.0759.124.01546.720.000.000.000.21
Medium coverage rangeland0.000.00247.04201.736.160.050.000.000.000.00
High coverage rangeland0.000.002.4331.4653.000.000.000.000.000.00
Desert 17.890.0071.471.290.002494.430.050.000.000.00
Wetland0.000.010.000.070.000.0095.081.000.000.00
Water body3.900.000.480.020.000.450.00738.110.000.00
Glacier3.710.000.060.000.000.120.000.00262.150.00
Built-up land0.000.000.040.000.000.000.000.130.002.11

