Abstract
The decomposition of organic wastes contributes to greenhouse gas (GHG) emissions and global warming. This study evaluated the effect of biochar (BC) produced from different farm wastes (chicken, pig and cow manures) on greenhouse gas emissions and soil chemical and biological properties in different grassland soils (volcanic and non-volcanic soils). A 288-day laboratory experiment was carried out, monitoring CO2, N2O and CH4 emissions and evaluating total C, soil pH, microbial biomass and enzymatic activity in three grassland soils. The results varied depending on the soil type and feedstock of BC produced. BC-cow decreased emissions of CO2 and CH4 fluxes for volcanic and non-volcanic soils, probably due to decreases in β-glucosidase activity. Biochars from cow and pig manures increased soil C content, favouring the persistence of C into the soil at 288-days of incubation. Soil pH increased with the application of BC in the soils.
1. Introduction
Soil organic carbon (C) is a key factor that influences both crop productivity and soil functions. However, its role in the mitigation of greenhouse gas emissions has not been fully determined. C-sequestration refers to an increase in soil organic C content caused by a change in land use or management, which can help to mitigate GHG emissions. Paustian et al. [1] have indicated that the potential for climate change mitigation requires the implementation of innovative strategies involving local knowledge to abate GHG emissions.
An alternative to increase soil organic C is through farm wastes or exogenous organic matter (e.g., slurry, manure and others). An alternative fate of the residue needs to be accounted as net transfer of C from the atmosphere to the soil; the repeated application of exogenous organic matter has been shown to increase soil organic C over time but the increase tends to level off as soil organic C content increases [2]. However, these farm wastes tend to have an important fraction of labile C, which rapidly mineralizes in the first time of decomposition (registered as CO2 emissions). Therefore, rapidly mineralizable organic materials with less content of C could be a better alternative to increase net C-sequestration and reduce GHG emissions.
Biochar from organic wastes produces a C-rich product, which is chemically and biologically more stable than its original C sources, deliberately applied into the soil with the purpose of improving soil properties [3]. In this sense, DeLuca et al. [4] compiled diverse studies where show the capacity of BCs to modified soil nutrient transformation as ammonification and nitrification, availability of phosphorous and sulphur. Van Zwieten et al. [5] used BC from papermill waste and determined change in diverse soil properties as increases in soil pH, CEC and total C, likewise a decrease in Aluminium availability in a Ferrosol. Another interest way to understand the contribution of BC modifying soil properties is according to study of Houben et al. [6] and Li et al. [7] who used BC produced from a Si (silicon)-accumulator plant (Miscanthus), demonstrating that BC- Si enriched supplied Si bioavailable and promote the Si biological cycle. On the other hand, changes in soil physical properties have been evaluated with the use of BCs, Laird et al. [8] demonstrate that BC from lignocellulosic materials reduced bulk density and increase water holding capacity (WHC) among other parameters, increasing the soil quality; however, Masiello et al. [9] shown different and contrasting results respect the WHC response until BC application, depending of soil type.
In terms of C accumulation in soils, Lehmann et al. [10] compiled diverse studies that evaluated the persistence of BC in soils, reporting variations between 6-4419 years of mean residence time of BC due to a wide variety of pyrogenic organic materials evaluated in different experiments and conditions. Persistence is relevant for the framework of BC use for environmental management.
Different studies have reported variations in GHG emission due to BC applications [11,12,13,14,15,16,17,18]; Pokharel et al. [19] have indicated that the reduction of GHG emissions from forests and grassland soils resulted from a decrease in the extracellular soil enzyme activities and microbial biomass with the addition of pine sawdust BC. However, meta-analyses show variable results respect to soil GHG emissions, where diverse factors as length of experimental studies, BC properties and application rate, soil texture and crop fertilization vary the response of soils at BC application [20,21]. For that, are necessary more studies over diverse soils (including volcanic soils) and climate conditions to reduce uncertainly for estimate GHG emissions and consider at BC as an alternative to reduce the global impact of agriculture on climate change.
Chile has a north-south climatic gradient (precipitation and temperature) with cooler and wetter regions in the south, which has a strong influence on the soil organic C distribution all across the country. Padarian et al. [22] generated a map with the spatial distribution of soil C for Chile, determining an increase in the north-south gradient; and highlighting the relevance of volcanic soils (Andosols) in increasing soil organic C content. It is important to note that 50-60% of soils with agronomic potential in Chile are of volcanic origin; mainly distributed in Mediterranean and temperate oceanic climate conditions [23]. The climatic and geochemical factors have a key role in C-stabilization in these soils [24]. However, as described by Muñoz et al. [25] these soils are more sensitive to temperature, with a high potential for C mineralization increase with increases in environmental temperature. This is relevant information to consider in the current scenario of climate change.
2. Materials and Methods
2.1. Soils
The studied soils correspond to grassland soils of Central-South Chile and these correspond to three soil orders and classified by Stolpe [26]. The soils were named by their respective soil series: Bulnes soil is developed on fine alluvial sedimentary materials, classified as thermic duric Argixerolls of the Mediterranean Humid climate zone, located in the Ñuble Region (36°34′S, 72°06′W); Cauquenes soil is an Alfisol developed on granitic material, classified as Ultic Palexeralfs under Mediterranean arid climate, it is located in the Cauquenes Province (Maule Region; coordinates 35°57′S, 72°19′W); and Collipulli soil is developed on ancient volcanic ash, classified as Mesic Xeric Paleumults, this soil is localized in Araucanía Region (37°57′S 72°26′W), south of Chile. Climatic data and soil properties of the sites are shown in Table 1 and Table 2. The top 0.10 m of soils were collected in triplicates during autumn 2016, having 20 subsamples for each soil sample.

Table 1.
Soils characterization.
Table 2.
Soils characterization.
2.2. Feedstock
Farm wastes were obtained from local farms of the Biobío and Ñuble regions of Chile; these consisted of: (a) chicken manure, (b) cow manure and (c) pig manure. The material was collected once in November of 2016, approximately 100 kg per each one (wet weight basis). The waste material was air-dried at ambient temperature for 2 weeks, stirred periodically to homogenize and sieved at 5 mm. Subsequently, the material was oven dried at 60 °C to reduce water content to less than 20%.
2.3. Pyrolysis Process
Slow pyrolysis process with highest heating temperature of 500 °C (during 2 h) was applied for farm wastes, the final yield of chicken, pig and cow manure was 82%, 42% and 41%, respectively. The gases produced through the pyrolysis process were trapped using a condenser and an electrostatic precipitator. It was produced 3 types of BC according with feedstock: BC-chicken, BC-cow and BC-pig. The BC produced was sieved through a 250 µm mesh and kept at ambient temperature in desiccators until used.
2.4. Chemical and Physical Characterization of Dry Manure and BCs
Total C and N of feedstock were analysed by dry combustion in an elemental analyser (Truspec CN, LECO, St. Joseph, MI, USA). The elemental C, N, H compositions of BCs were done (Elementar Analysensyteme GmbH, Hanau, Germany). Inorganic C of BCs was done by titrimetric method [27,28]. The organic C (Corg) of BC was then estimated by difference between total C minus inorganic C [29]. The pH and contents of nitrate, ammonium, available phosphorus and potassium content were analysed according to protocols for compost [30]. The chemical and physical properties of the different feedstocks and BCs produced are showed in Table 3.
Table 3.
Characterization of feedstocks and BCs.
2.5. Incubation Experiments
The assay consisted of incubations of soil mixed with the BC produced at 20 °C [31,32]. An amount of 25 g of soil mixed with BC at a dose of 1% (1g BC per 100 g soil; [33]) was placed into 50-mL Falcon tubes with rubber septum caps by gas sampling (in triplicates). Distilled water was added to the tubes to increase moisture content of the mixture to 60% of water filled pore space (WFPS) for each soil. Simultaneously, an incubation experiment was conducted under the same conditions of temperature and water content, using the same soils but without BC as blanks. Soil samples were pre-incubated for 7–10 days and then rehydrated as needed during 288-days (10 months approximately) in order to maintain soil water content constant. Considering the bulk densities of the different soils, the BC application rates used corresponded to 13, 14.5 and 14.2 t BC ha−1 for Bulnes, Cauquenes and Collipulli soils, respectively.
2.6. Gas Emissions Measurement
The CO2 emissions were analysed by infra-red spectroscopy using a CO2 gas analyser (Li-820, LI-COR Bioscience, Shelton, CT, USA) at days 3, 5, 7, 15, 25, 35, 45 and 55 after the start of the incubation and then twice a month until day 288 of incubation. The analyses of CH4 and N2O were performed using gas chromatography; an aliquot of 2–5 mL of gas was extracted from the headspace of each incubation tube and gases were analysed in a gas chromatograph (Perkin Elmer model Clarus 600, Akron, OH, USA) equipped with FID and ECD detectors.
Data of the gases obtained at each time interval were then analysed by linear interpolation, following the model of , where y is the day-emission estimated, x the days, α the ratio of change between two consecutive periods of time (Equation (1)) and β corresponds at the y-intercept (Equation (2)); obtaining a fit model; where (x1, y1) and (x2, y2) represent two different time periods. The cumulative gas emission was obtained through the sum of gas emission obtained between two consecutive dates for each time period during the whole incubation.
To convert the total gas emission obtained at 288-days to CO2-eq, the following global warming potentials (GWP) were used: 1, 21 and 310 for CO2, CH4 and N2O, respectively, considering a timeframe of 100 years [34]. The results were extrapolated to 365 days and expressed in kg CO2-eq ha−1 y−1.
2.7. Soil Organic Carbon Content
Soil organic C content was analysed in the soil samples incubated, considering three incubation phases: early, middle (4 months) and late (10 months). The analysis was made by dry combustion in a CN analyser (Truspec CN, LECO, USA). C stock was converted using the bulk density values of 1.30; 1.45 and 1.42 t m−3 for Bulnes, Cauquenes and Collipulli, respectively.
2.8. Biological Parameters
Microbial biomass was determined using fluorescein diacetate (FDA) hydrolysis [35]; the production of fluoresce in hydrolysed from FDA was evaluated. Absorbance was determined using a UV/VIS spectrophotometer (Thermo Spectronic model Genesys TM 5, Vernon Hills, IL, USA) at 490 ηm. In addition, urease activity was determined using a colorimetric method based on the ammonia released [36] after incubating the samples at 37 °C for two hours. β-glucosidase activity was determined according to the colorimetric method proposed by Eivazi and Tabatabai [37], in which incubation is done at 37 °C for one hour in darkness. Both urease and β-glucosidase activities were determined at 636 ηm and 400 ηm, respectively, using a UV/VIS spectrophotometer (Thermo Spectronic model Genesys TM 5, USA).
2.9. Statistical Analysis
Data were analysed using one-way analysis of variance for a completely randomized design, consisting of 3 soils x 4 treatments (BCs and controls) with 3 replicates per treatment (n = 3). Shapiro Wilks modified [38] was used to verify normality of residuals. Duncan test was used to determine significant differences between treatments at p ≤ 0.05. For the analysis of GHG emissions, only the cumulative emission over the whole experimental period (288 days of incubation) was considered. The data of N2O and CH4 emissions were transformed with normal scores, prior to parametric analysis. Whole data set was used for Pearson correlation coefficient to obtain the correlation between two response variables with a p-value of 0.05. Statistical software Infostat version 2008 was used [39].
3. Results and Discussion
3.1. GHG Emissions
According to the European Biochar Certificate [3] and IBI guidelines [40], different properties allow us classify a product as BC. In this study, the BC-cow and BC-pig have Corg content upper than 30% and a molar H/Corg ratio lesser than 0.7 (Table 3), performing both materials with the classification as BC. BC-chicken has lesser Corg content (6.84%) and it is not considered as BC according to both guidelines; knowing this fact, we will consider this treatment as carbonaceous material and it continues named as BC-chicken for this study to simplify comparisons and discussion between treatments. However, Song and Guo [41] studied the variation in the quality of BC produced from poultry litter under different temperature of pyrolysis, having in all cases higher total C and Corg content that on our study, despite that in this study the temperature pyrolysis used was the same that they recommended (500 °C). Even so, this material (BC-chicken) has a higher ammonium content (9.6 mg kg−1; Table 3), which may account for its higher response in microbial activity, expressed in terms of CO2 emissions (Figure 1) and lower C/N ratio (C/N =19; Table 3).

Figure 1.
Cumulate carbon dioxide fluxes (mg CO2 kg−1 h−1) in soils with BC application (Different small case letters means statistical difference by Duncan at p ≤ 0.05).
The C concentration in BC-cow was higher than the other BCs; the lowest values were obtained with BC-chicken (11.5%; Table 3). The cumulative evolution of CO2 in soils is shown in Figure 1A–C. After 288-days of incubation, the soils with BC showed an increase of CO2 emission respect to the control in Bulnes and Cauquenes soils (Figure 1A,B); BC-chicken did not have statistical difference with BC-pig, with an average of cumulative CO2 emissions of 130 mg CO2 kg soil−1 h−1 for Bulnes soil and 97 mg CO2 kg soil−1 h−1 for Cauquenes soil. However, BC-chicken was statistically higher (25% higher) than BC-cow for both soils. In Collipulli soil (Figure 1C), BC-pig and BC-cow had similar results to the control soil, whereas BC-chicken presented higher cumulative CO2 emissions (53%) than other treatments. In all soils, the highest CO2 emissions were produced the first 20 days and then decreased considerably, maintaining a CO2 flux relatively stable after this period.
Similarly, the application of BC at different soils resulted in an increase in C concentration from early to late incubation (288-days of incubation; Table 4) in treatments of BC-cow and BC-pig but lesser increase in C concentration in soils was obtained with BC-chicken. The persistence of the soil C increase obtained after time of incubation is probably due to the type of C contained in BCs, which are mainly aromatic C-types [42].
Table 4.
Variation of total C in treatments during incubation period; C stock in the top 0.10 m of soil and CO2-eq after 288-days of incubation.
The CO2 emissions monitoring during 288-days of incubation showed a marked effect of type of feedstock used. In general, BC-chicken presented higher CO2 emissions in the three soils under study, comparing with BC-cow and BC-pig. Similarly, Šlapáková et al. [43] show not effect on soil respiration in soils amended with a BC of digestate from Zea mays (80%) and cellulose fibre (20%) in two soils incubated during 1-year. On the other hand, the higher levels of CO2 emissions obtained from BC-chicken could be produced by the release of carbonates contained in the BC which could be higher in acidic soils according to Sheng and Zhu [44], who reported higher CO2 emissions from an acidic Ferrasols (pH 5.19) rather than Phaeozems (pH 7.81).
It is important to note that this study was done under aerobic conditions (60% WFPS); because of this, the potential N2O and CH4 emissions are not evaluated since both processes are predominant under anaerobic conditions [45]. However, other studies have described a lesser-known way of non-microbial CH4 production from aerobic soils [46,47].
The cumulative N2O emissions from soils are showed in Figure 2A–C. The results show that all treatments resulted in decreased N2O emissions in Bulnes soil (Figure 2A), showing statistical differences (p ≤ 0.05) respect to BC-chicken (55% less). In Cauquenes soil (Figure 2B), the emissions obtained from BC-chicken and BC-pig were similar to the control but BC-cow reduced N2O emissions by 38%. A different response was obtained in Collipulli soil (Figure 2C), where BC-chicken increased emissions by 62%. It is important to note that Cauquenes and Collipulli soils presented considerably lower N2O emissions compared to Bulnes soil (see different scales in Figure 2A–C), with maximum values of 3.9, 0.77 and 0.34 mg N2O kg soil−1 h−1 in the control soils for Bulnes, Cauquenes and Collipulli, respectively .
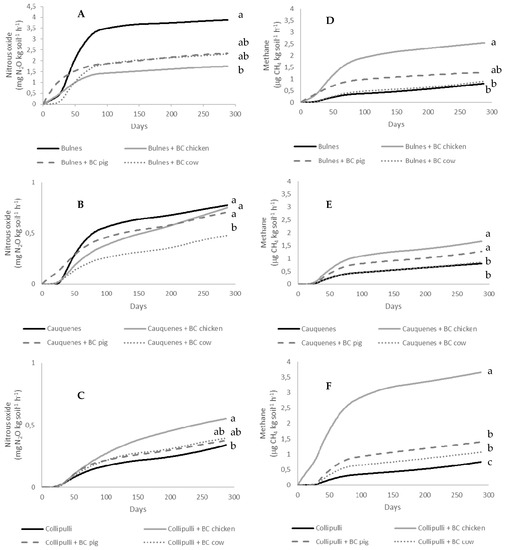
Figure 2.
Cumulate nitrous oxide (mg N2O kg−1 h−1; A–C) and methane (mg CH4 kg−1 h−1; D–F) in soils with BC application (Different small case letters means statistical difference by Duncan at p ≤ 0.05).
Emissions of N2O from soils depend on diverse factors such as soil water content, level of oxygen, soil pore space, sulphur and organic matter content, among other factors [48]. In agricultural soils, addition of organic residues [49] and nitrogen fertilization [50,51] produce relevant flush of N2O emissions to the atmosphere, mainly in the first days after application of fertilizers [52]. In the case of BCs, it has been acknowledged that thermic decomposition produce the stabilization of C-materials and the volatilization of labile forms of nutrients, for example, nitrogen loss with increased pyrolysis temperature due to the volatilization of organic matter, resulting in a reduction of half of their N at 400 °C [53]. BC-chicken has narrow C/N ratio (Table 3) in comparison to BC-cow (value of 36), which shows that in BC-chicken more labile organic compounds remain in its structure; this was evidenced with the high denitrifying activity at early incubation (see first 35 days of incubation in Figure 2A,B).
Cumulative CH4 fluxes are shown in Figure 2D–F. Unlike N2O emissions, most BC treatments produced higher emissions than the control soils. In BC-chicken in Bulnes soil (Figure 2D), CH4 emissions were 3-fold greater than the control soil. Similarly, emissions resulting from BC-chicken and BC-pig were 2-fold higher than the control in Cauquenes soil (Figure 2E). A similar response was observed with the application of BC-chicken to Collipulli soil (Figure 2F) and resulted in a 2-fold increase in CH4 emissions compared to the control soil; in this sense, the results showed that BC-chicken > BC-pig = BC-cow > control.
In the case of cumulative CH4 emissions, BC-chicken and BC-pig presented higher emissions than the control soils; BC-chicken produced higher emissions in three soils, indicating that methanogen activity increased with the addition of this type of BC. The literature describes variable results respect to the effect of BC on methanogenic/methanotrophic microorganisms. However, Jeffery et al. [54] conducted a meta-analysis in soils with acid pH and determined that the application of BC increased pH, as well as sink and source processes of CH4. However, methanotrophic microorganisms may be more sensible to increases of soil pH and thus the effect of BC on acid soils (pH < 6) tends to mitigate CH4 emissions. Conversely, emissions tend to increase in soils with pH between 6 and 8. In our study, CH4 emissions increased with BC (except BC-cow in Bulnes and Cauquenes soils; Figure 2D,E) but cumulative CH4 emissions were positively correlated to soil pH (Pearson’s correlation = 0.50 at p ≤ 0.05); CH4 fluxes increased in the soils that presented increasing soil pH, particularly with application of BC-chicken; where pH increased from 5.18 to 6.3 in Bulnes soil and from 5.33 to 7.06 in Cauquenes soil. Additionally, He et al. [55] showed the relevance of particle-size BC in response to CH4 emissions from aerobic composting, indicating that fine material (diameter < 1 cm) increased CH4 emissions by 58.8%; but materials with higher particle-size (4 mm to 1 cm) reduced the emissions of this gas. This could partly explain our results as the BC used was previously sieved at 250 µm to guarantee a complete incorporation with soil into experimental mesocosm; this particle-size probably had lower pore connectivity and aeration, favouring anaerobic spaces that increase the methanogenic activity. Respect to particle-size of biochar, Genesio et al. [56] indicate that particles smaller than 2.5 µm of black C could cause a positive radiative forcing when is transport to high altitudes (direct) or is deposited over ice or snow (indirect); for that in the production and others forms of manipulation the release of fine particles of BCs should be avoided, in this sense, Maienza et al. [57] studied the impact of pellet and non-pellet formulations.
3.2. Soil Carbon Content and CO2-eq
Soil C concentration (Table 4) varied under different BC treatments compared to the control. At early incubation, the incorporation of BC increased the C concentration in all soils, particularly with BC-cow and BC-pig. No statistical differences were found between BC-chicken and the control. At 4 months, fewer differences were found between treatments; however, the soils with BC-pig and BC-cow were higher in most of the cases. At late incubation (288-days), all BC treatments in Bulnes soil resulted in higher C concentration compared to the control. In Cauquenes and Collipulli soils, BC-pig and BC-cow were statistically higher than the rest of the treatments. By quantifying these differences as C stock (Table 4), BC-pig and cow resulted in increases of 5, 6 and 8 t C per hectare in Bulnes, Cauquenes and Collipulli soils, respectively.
CO2-eq allowed quantify differences between treatments considering GHG emissions produced. In Bulnes and Cauquenes soils, none of the treatments were different from the control soils, with an average of 1503 and 544 kg CO2-eq ha−1 y−1, respectively. For Collipulli soil, BC-chicken resulted in higher emissions of 497 kg CO2-eq ha−1 y−1; no statistical differences were found between the other treatments and the control soil.
Our results demonstrate that both BC-pig and BC-cow are an adequate alternative to increase soil C content with a low increase in CO2 fluxes, which in turn provide promising results to reduce the C footprint for pig and cow farms. Similarly, Gascó et al. [13] evaluated the incorporation of BC-pig with a dose of 8% in a Cambisols with sandy loam texture and reported higher levels of CO2 emissions than the control treatment (without BC) but lower than those obtained from pig manure in an incubation of 219-days. In addition, Troy et al. [17] applied BC from pig manure in an Acid Brown Earth (equivalent doses of 18 t ha−1), producing lesser CO2 fluxes respect to feedstock; having less than 1% the C of the BC mineralized during short-term experiment (28-days).
3.3. pH
The pH of soils increased with the application of BC in all soils and treatments (Table 5). BC-chicken was the treatment that recorded the highest increases of 1.12, 1.73 and 0.77 units of pH for Bulnes, Cauquenes and Collipulli respectively. In this sense, BC treatments behaved as follows: BC-chicken > BC-pig > BC-cow.
Table 5.
Changes in chemical and biological soil parameters after 288-days of incubation.
The application of all BCs produced a pH increase that averaged 0.9 ± 0.5 units, which is relevant for acid soils. This increase was variable depending on the type of soil (Table 5); Collipulli soil (an Ultisol) presented a higher increase that reached +1.7 units of pH. Soil pH is a relevant factor that determines soil biological processes, where the biological activity could be increased or decreased depending of soil pH. In terms of denitrification activity, alkaline soil pH resulted in a higher reduction of N2O to N2 and inhibition of this process in acidic soils, increasing N2O emissions [33]. In this sense, Van Zwieten et al. [58] indicated that the liming effect of BC in acidic soils decrease N2O/N2 ratio under flooded soil, favouring the dinitrogen formation. However, Wu et al. [8] have indicated that the potential of alkaline BCs to mitigate N2O emissions in acidic soils are dependent on soil nitrate content, because higher N2O emissions are produced in a time period when soil nitrate was high, decreasing significantly in periods with lower nitrate content soil. In our study, there was an inverse Pearson correlation (−0.57 at p ≤ 0.05; Table 6) between soil pH and N2O emissions, indicating lower N2O emissions with increases of soil pH. This fact was particularly observed in Bulnes and Cauquenes soils as N2O emissions decreased with the application of BC-chicken and BC-cow, respectively (Figure 2A,B).
Table 6.
Pearson coefficient correlation between the parameters studied.
3.4. Microbial Biomass and Enzymatic Activity
No statistical differences were found in the microbial biomass between treatments in Cauquenes soil. However, the other soils had a different behaviour, for example, Bulnes soil (control) presented higher microbial biomass compared to the BCs treatments, reaching values 13% higher than BC-cow and 26% higher than the other BCs. On the contrary, Collipulli soil with BC-cow and BC-pig presented more microbial biomass than the control soil but levels obtained with the BC-chicken were similar.
In the case of β-glucosidase activity, BCs reduced the activity of this enzyme between 24 and 40% in all soils, except for BC-pig in Collipuli soil. Regarding urease activity, BCs reduced the activity in this enzyme in Bulnes soil, particularly with BC-cow (51% decrease). However, there was an increase in the urease activity with the application of BCs in Cauquenes and Collipulli soils. In fact, BC-pig increased the urease activity between 60 and 135%.
Almost all BCs applied produced a decrease in β-glucosidase activity in the three studied soils (Table 5), decreasing until 35-39% respect to the control soils; which probably affected the C-degradation and the low CO2 emissions obtained in BC-cow and BC-pig (Figure 2). Similarly, Pokharel et al. [19] find that the application of pine sawdust BC in forest soil affect β-glucosidase after 10 days of incubation (26–35%), while the effect was evidenced at 50 days of incubation in a grassland soil. The effect on β-glucosidase activity could be explained by the high capacity of BCs to adsorb substrates, reducing the availability of soluble substrate for enzymes. For instance, Lammirato et al. [59] determined that β-glucosidase activity decreased by 30% probably due to the application of chestnut wood char, hypothesizing that adsorption is produced by non-coulombic forces between uncharged regions of both proteins and char; similarly Teutscherova et al. [60] applied BC from holm oak pruning residues in two contrasting soils, where the β-glucosidase activity not vary in a Calcisol but decreased in an Acrisol with BC application, suggesting that mechanisms of adsorption onto BC surface could affect the response the soils. Therefore, soils amended with charred materials could reduce the organic matter degradation rate, stabilizing nutrients and enhancing soil fertility [59]. On the other hand, changes in soil microbial community have been reported with the application of BCs to soils. Shen and Zhu [44] reported a shift in microbial community composition due to the liming effect produced by BC; higher BC doses led to higher soil pH and bacterial diversity, increasing copiotrophic phylum and decreasing abundance of Acidobacteria after the addition of BC obtained from rice straw.
3.5. Relation Between Parameters
Pearson correlation coefficients are shown in Table 6. GHG emissions are correlated with different soil parameters. CO2 emissions have a positive Pearson correlation coefficient (r value) with total N (0.59) and urease activity (0.59). N2O emissions have a positive correlation with total N (0.72), microbial biomass (0.49), β-glucosidase (0.52) and urease (0.73) but a negative correlation with soil pH (−0.57). In addition, CH4 emissions present a positive r value with soil pH (0.50) but a negative correlation with β-glucosidase activity (−0.43).
4. Conclusions
Biochar applied into soils had a strong impact on diverse soil chemical and biological properties and, consequently, on the fluxes of greenhouse gases. The response in greenhouse emissions varied depending on feedstock and soil type. Biochar produced from cow manure decreased emissions of CO2 and CH4 fluxes for volcanic and non-volcanic soils, probably due to decreases in β-glucosidase activity. Biochars from cow and pig manures increased soil C content, favouring the persistence of C into the soil after 288-days of incubation. Soil pH increased with the application of biochar into the soils, which is relevant for agricultural areas with problems related to acid soils.
Author Contributions
Conceptualization, C.M. and E.Z.; methodology, C.M. and M.G; formal analysis, C.M and M.G.; investigation, C.M and M.G.; resources, C.M..; writing—original draft preparation, C.M.; writing—review and editing, M.G.; supervision, E.Z.; project administration, C.M.; funding acquisition, C.M. All authors read, discussed and approved the final manuscript.
Funding
This research was funded by project Fondecyt Regular 1160795.
Acknowledgments
The authors would also like to thank Marcela Vergara for her collaboration at the laboratory analysis; and at Marta Camps-Arbestain for elemental analysis at biochars.
Conflicts of Interest
The authors declare no conflict of interest.
References
- Paustian, K.; Lehmann, J.; Ogle, S.; Reay, D.; Robertson, G.P.; Smith, P. Climate-smart soils. Nature 2016, 532, 49–57. [Google Scholar] [CrossRef] [PubMed]
- Powlson, D.S.; Whitmore, A.P.; Goulding, K.W. Soil carbon sequestration to mitigate climate change: A critical re-examination to identify the true and the false. Eur. J. Soil Sci. 2011, 62, 42–55. [Google Scholar] [CrossRef]
- Schmidt, H.P. European Biochar Certificate—Guidelines for a Sustainable Production of Biochar; Version 6.1 of 19 June 2015; European Biochar Foundation (EBC): Arbaz, Switzerland, 2012. [Google Scholar]
- DeLuca, T.H.; Gundale, M.J.; MacKenzie, M.D.; Jones, D.L. Biochar effects on soil nutrient transformations. In Biochar for Environmental Management: Science, Technology and Implementation, 2nd ed.; Lehmann, J., Joseph, S., Eds.; Earths Can: London, UK, 2015; pp. 420–454. [Google Scholar]
- Van Zwieten, L.; Kimber, S.; Morris, S.; Chan, K.Y.; Downie, A.; Rust, J.; Joseph, S.; Cowie, A. Effects of biochar from slow pyrolysis of papermill waste on agronomic performance and soil fertility. Plant Soil 2010, 327, 235–246. [Google Scholar] [CrossRef]
- Houben, D.; Sonnet, P.; Cornelis, J.-T. Biochar from Miscanthus: A potential silicon fertilizer. Plant Soil 2014, 374, 871–882. [Google Scholar] [CrossRef]
- Li, Z.; Delvaux, B.; Yans, J.; Dufour, N.; Houben, D.; Cornelis, J.-T. Phytolith-rich biochar increases cotton biomass and silicon-mineralomass in a highly weathered soil. J. Plant Nutr. Soil Sci. 2018, 181, 537–546. [Google Scholar] [CrossRef]
- Laird, D.A.; Fleming, P.; Davis, D.D.; Horton, R.; Wang, B.; Karlen, D.L. Impact of biochar amendments on the quality of a typical Midwestern agricultural soil. Geoderma 2010, 158, 443–449. [Google Scholar] [CrossRef]
- Masiello, C.A.; Dugan, B.; Brewer, C.E.; Spokas, K.A.; Novak, J.M.; Liu, Z.; Sorrenti, G. Biochar effects on soil hydrology. In Biochar for Environmental Management: Science, Technology and Implementation, 2nd ed.; Lehmann, J., Joseph, S., Eds.; Earths Can: London, UK, 2015; pp. 543–562. [Google Scholar]
- Lehmann, J.; Abiven, S.; Kleber, M.; Pan, G.; Singh, B.P.; Sohi, S.P.; Zimmerman, A.R. Persistence of biochar in soil. In Biochar for Environmental Management: Science, Technology and Implementation, 2nd ed.; Lehmann, J., Joseph, S., Eds.; Earths Can: London, UK, 2015; pp. 235–274. [Google Scholar]
- Cayuela, M.L.; Van Zwieten, L.; Singh, B.P.; Jeffery, S.; Roig, A.; Sánchez-Monedero, M.A. Biochar’s role in mitigating soil nitrous oxide emissions: A review and meta-analysis. Agric. Ecosyst. Environ. 2014, 191, 5–16. [Google Scholar] [CrossRef]
- Cayuela, M.L.; Jeffery, S.; Van Zwieten, L. The molar H: Corg ratio of biochar is a key factor in mitigating N2O emissions from soil. Agric. Ecosyst. Environ. 2015, 202, 135–138. [Google Scholar] [CrossRef]
- Gascó, G.; Paz-Ferreiro, J.; Cely, P.; Plaza, C.; Méndez, A. Influence of pig manure and its biochar on soil CO2 emissions and soil enzymes. Ecol. Eng. 2016, 95, 19–24. [Google Scholar] [CrossRef]
- Wu, D.; Senbayram, M.; Zang, H.; Ugurlar, F.; Aydemir, S.; Brüggemann, N.; Blagodatskaya, E. Effect of biochar origin and soil pH on greenhouse gas emissions from sandy and clay soils. Appl. Soil Ecol. 2018, 129, 121–127. [Google Scholar] [CrossRef]
- Wang, Z.; Zheng, H.; Luo, Y.; Deng, X.; Herbert, S.; Xing, B. Characterization and influence of biochars on nitrous oxide emission from agricultural soil. Environ. Pollut. 2013, 174, 289–296. [Google Scholar] [CrossRef] [PubMed]
- Yang, X.; Meng, J.; Lan, Y.; Chen, W.; Yang, T.; Yuan, J.; Liu, S.; Han, J. Effects of maize stover and its biochar on soil CO2 emissions and labile organic carbon fractions in Northeast China. Agric. Ecosyst. Environ. 2017, 240, 24–31. [Google Scholar] [CrossRef]
- Troy, S.M.; Lawlor, P.G.; O’ Flynn, C.J.; Healy, M.G. Impact of biochar addition to soil on greenhouse gas emissions following pig manure application. Soil Biol. Biochem. 2013, 60, 173–181. [Google Scholar] [CrossRef]
- Muñoz, C.; Góngora, S.; Zagal, E. Use of biochar as a soil amendment: A brief review. Chil. J. Agric. Anim. Sci. Agro-Cien. 2016, 32, 37–47. [Google Scholar]
- Pokharel, P.; Kwak, J.H.; Ok, Y.S.; Chang, S.X. Pine sawdust biochar reduces GHG emission by decreasing microbial and enzyme activities in forest and grassland soils in a laboratory experiment. Sci. Total Environ. 2018, 625, 1247–1256. [Google Scholar] [CrossRef]
- Song, X.; Pan, G.; Zhang, C.; Zhang, L.; Wang, H. Effects of biochar application on fluxes of three biogenic greenhouse gases: A meta-analysis. Ecosyst. Health Sustain. 2016, 2, e01202. [Google Scholar] [CrossRef]
- He, Y.; Zhou, X.; Jiang, L.; Li, M.; Du, Z.; Zhou, G.; Shao, J.; Wang, X.; Xu, Z.; Hosseini Bai, S.; et al. Effects of biochar application on soil greenhouse gas fluxes: A meta-analysis. GCB Bioenergy 2017, 9, 743–755. [Google Scholar] [CrossRef]
- Padarian, J.; Minasny, B.; Mcbratney, A.B. Chile and the Chilean soil grid: A contribution to Global Soil Map. Geoderma Reg. 2017, 9, 17–28. [Google Scholar] [CrossRef]
- Besoain, E. Los suelos volcánicos. In Suelos Volcánicos de Chile; Tosso, J., Ed.; Instituto de Investigaciones Agropecuarias (INIA): Providencia, Chile, 1985; pp. 25–106. [Google Scholar]
- Doetterl, S.; Stevens, A.; Six, J.; Merckx, R.; Van Oost, K.; Casanova-Pinto, M.; Casanova-Katny, A.; Muñoz, C.; Boudin, M.; Zagal, E.; et al. Soil carbon storage controlled by interactions between geochemistry and climate. Nat. Geosci. 2015, 8, 780–783. [Google Scholar] [CrossRef]
- Muñoz, C.; Cruz, B.; Rojo, F.; Campos, J.; Casanova, M.; Doetterl, S.; Boeckx, P.; Zagal, E. Temperature sensitivity of carbon decomposition in soil aggregates along a climatic gradient. J. Soil Sci. Plant Nutr. 2016, 16, 461–476. [Google Scholar] [CrossRef]
- Stolpe, N. Descripciones de los Principales suelos de la VIII Región de Chile; Publications of Department of Soils and Natural Resources, Faculty of Agronomy, Universidad de Concepción: Chillán, Chile, 2006. [Google Scholar]
- Wang, T.; Camps-Arbestain, M.; Hedley, M.; Singh, B.P.; Calvelo Pereira, R.; Wang, C. Determination of carbonate-C in biochar. Soil Res. 2014, 52, 495–504. [Google Scholar] [CrossRef]
- Calvelo Pereira, R.; Camps-Arbestain, M.; Wang, T.; Enders, A. Inorganic carbon. In Biochar: A Guide to Analytical Methods, 1st ed.; Singh, B., Camps-Arbestain, M., Lehmann, J., Eds.; Csiro Publishing: Boca Raton, FL, USA; London, UK; New York, NY, USA, 2017; pp. 51–63. [Google Scholar]
- Camps-Arbestain, M.; Amonette, J.E.; Singh, B.; Wang, T.; Schmidt, H.P. A Biochar classification system and associated test methods. In Biochar for Environmental Management: Science, Technology and Implementation, 2nd ed.; Lehmann, J., Joseph, S., Eds.; Earths Can: London, UK, 2015; pp. 165–193. [Google Scholar]
- Sadzawka, A.; Carrasco, M.A.; Grez, R.; Mora, M.L. Métodos de Análisis de Compost; Serie Actas Inia No 30; Instituto de Investigaciones Agropecuarias: Santiago, Chile, 2005; 142p. [Google Scholar]
- Cheng, C.-H.; Lehmann, J.; Thies, J.E.; Burton, S.D.; Engelhard, M.H. Oxidation of black carbon by biotic and abiotic processes. Org. Geochem. 2006, 37, 1477–1488. [Google Scholar] [CrossRef]
- Cheng, C.-H.; Lehmann, J.; Thies, J.E.; Burton, S.D. Stability of black carbon in soils across a climatic gradient. J. Geophys. Res. Biogeosci. 2008, 113, G02027. [Google Scholar] [CrossRef]
- Muñoz, C.; Quilodrán, C.; Navia, R. Evaluation of biochar-plant extracts complexes on soil nitrogen dynamics. J. Biobased Mater. Bioenergy 2014, 8, 377–385. [Google Scholar] [CrossRef]
- IPCC. Climate Change 2007: The Physical Science Basis. Summary for Policymakers. Contribution of Working Group I to the Fourth Assessment Report of the Intergovernmental Panel on Climate Change (IPCC); Solomon, S., Qin, D., Manning, M., Chen, Z., Marquis, M., Averyt, K.B., Tignor, M., Miller, H.L., Eds.; Cambridge University Press: Cambridge, UK, 2007; pp. 1–18. [Google Scholar]
- Alef, K.; Nannipieri, P. (Eds.) Methods in Applied Soil Microbiology and Biochemistry; Academic Press: London, UK, 1995. [Google Scholar]
- Sastre-Conde, I.; Lobo, M.C. Técnicas de Análisis de Parámetros Bioquímicos en Suelos: Medida de Actividades Enzimáticas y Biomasa Microbiana; García, C., Gil, F., Hernández, T., Trasar, C., Eds.; Ediciones Mundi-Prensa: Madrid, España, 2003; pp. 123–147. [Google Scholar]
- Eivazi, F.; Tabatabai, M. Glucosidases and galactosidases in soils. Soil Biol. Biochem. 1988, 20, 601–606. [Google Scholar] [CrossRef]
- Mahibbur, R.M.; Govindarajulu, Z. A modification of the test of Shapiro and Wilks for normality. J. Appl. Stat. 1997, 24, 219–235. [Google Scholar]
- Di Rienzo, J.A.; Casanoves, F.; Balzarini, M.G.; Gonzalez, L.; Tablada, M.; Robledo, C.W. InfoStat, versión 2008; Grupo InfoStat, FCA, Universidad Nacional de Córdoba: Córdoba, Argentina, 2008.
- IBI. Standardized Products Definition and Product Testing Guidelines for Biochar that Is Used in Soil. International Biochar Initiative. 2012. Available online: www.biochar-international.org (accessed on 15 March 2019).
- Song, W.; Guo, M. Quality variations of poultry litter biochar generated at different pyrolysis temperatures. J. Anal. Appl. Pyrolysis 2012, 94, 138–145. [Google Scholar] [CrossRef]
- Lehmann, J.; Czimczik, C.; Laird, D.; Sohi, S. Stability of Biochar in Soil. In Biochar for Environmental Management: Science and Technology; Lehmann, J., Joseph, S., Eds.; Earths Can: London, UK, 2009; pp. 183–205. [Google Scholar]
- Šlapáková, B.; Jeřábková, J.; Voříšek, K.; Tejnecký, V.; Drábek, O. The biochar effect on soil respiration and nitrification. Plant Soil Environ. 2018, 64, 114–119. [Google Scholar] [CrossRef]
- Sheng, Y.; Zhu, L. Biochar alters microbial community and carbon sequestration potential across different soil pH. Sci. Total Environ. 2018, 622–623, 1391–1399. [Google Scholar] [CrossRef] [PubMed]
- Reay, D.; Hewitt, C.N.; Smith, K.; Grace, J. (Eds.) Greenhouse Gas Sinks; CAB International: Wallingford, UK, 2007; 290p. [Google Scholar]
- Jugold, A.; Althoff, F.; Hurkuck, M.; Greule, M.; Lenhart, K.; Lelieveld, J.; Keppler, F. Non-microbial methane formation in oxic soils. Biogeosciences 2012, 9, 5291–5301. [Google Scholar] [CrossRef]
- Serrano-Silva, N.; Sarria-Guzmán, Y.; Dendooven, L.; Luna-Guido, M. Methanogenesis and Methanotrophy in Soil: A Review. Pedosphere 2014, 24, 291–307. [Google Scholar] [CrossRef]
- Navarro Blaya, S.; Navarro García, G. (Eds.) Química Agrícola. El Suelo y los Elementos Químicos Esenciales Para la Vida Vegetal; Mundi-Prensa: Madrid, España, 2003; pp. 183–217. [Google Scholar]
- Gregorutti, C.C.; Caviglia, O.P. Nitrous oxide emission after the addition of organic residues on soil surface. Agric. Ecosyst. Environ. 2017, 246, 234–242. [Google Scholar] [CrossRef]
- Yue, Q.; Ledo, A.; Cheng, K.; Albanito, F.; Lebender, U.; Sapkota, T.B.; Hillier, J. Re-assessing nitrous oxide emissions from croplands across Mainland China. Agric. Ecosyst. Environ. 2018, 268, 70–78. [Google Scholar] [CrossRef]
- Millar, N.; Urrea, A.; Kahmark, K.; Shcherbak, I.; Robertson, G.P.; Ortiz-monasterio, I. Nitrous oxide (N2O) flux responds exponentially to nitrogen fertilizer in irrigated wheat in the Yaqui Valley, Mexico. Agric. Ecosyst. Environ. 2018, 261, 125–132. [Google Scholar] [CrossRef]
- Muñoz, C.; Saggar, S.; Berben, P.; Giltrap, D.; Jha, N. Influence of waiting time after insertion of base chamber. Chil. J. Agric. Res. 2011, 71, 610–614. [Google Scholar] [CrossRef]
- Chan, K.Y.; Xu, Z. Biochar: Nutrient Properties and Their Enhancement. In Biochar for Environmental Management: Science and Technology; Lehmann, J., Joseph, S., Eds.; Earths Can: London, UK, 2009; pp. 67–84. [Google Scholar]
- Jeffery, S.; Verheijen, F.G.A.; Kammann, C.; Abalos, D. Biochar effects on methane emissions from soils: A meta-analysis. Soil Biol. Biochem. 2016, 101, 251–258. [Google Scholar] [CrossRef]
- He, X.; Yin, H.; Sun, X.; Han, L.; Huang, G. Effect of different particle-size biochar on methane emissions during pig manure/wheat straw aerobic composting: Insights into pore characterization and microbial mechanisms. Bioresour. Technol. 2018, 268, 633–637. [Google Scholar] [CrossRef]
- Genesio, L.; Vaccari, F.P.; Miglietta, F. Black carbon aerosol from biochar threats its negative emission potential. Global Chang. Biol. 2016, 22, 2313–2314. [Google Scholar] [CrossRef] [PubMed]
- Maienza, A.; Genesio, L.; Acciai, M.; Miglietta, F.; Pusceddu, E.; Vaccari, F.P. Impact of Biochar Formulation on the Release of Particulate Matter and on Short-Term Agronomic Performance. Sustainability 2017, 9, 1131. [Google Scholar] [CrossRef]
- Van Zwieten, L.; Kimber, S.; Morris, S.; Downie, A.; Berger, E.; Rust, J.; Scheer, C. Influence of biochars on flux of N2O and CO2 from Ferrosol. Aust. J. Soil Res. 2010, 48, 555–568. [Google Scholar] [CrossRef]
- Lammirato, C.; Miltner, A.; Kaestner, M. Effects of wood char and activated carbon on the hydrolysis of cellobiose by b-glucosidase from Aspergillusniger. Soil Biol. Biochem. 2011, 43, 1936–1942. [Google Scholar] [CrossRef]
- Teutscherova, N.; Lojka, B.; Houška, J.; Masaguer, A.; Benito, M.; Vazquez, E. Application of holm oak biochar alters dynamics of enzymatic and microbial activity in two contrasting Mediterranean soils. Eur. J. Soil Biol. 2018, 88, 15–26. [Google Scholar] [CrossRef]


© 2019 by the authors. Licensee MDPI, Basel, Switzerland. This article is an open access article distributed under the terms and conditions of the Creative Commons Attribution (CC BY) license (http://creativecommons.org/licenses/by/4.0/).