Article

Grazing Exclusion, a Choice between Biomass Growth and Species Diversity Maintenance in Beijing—Tianjin Sand Source Control Project

1
Key Laboratory of Land Surface Pattern and Simulation, Institute of Geographical Sciences and Natural Resources Research, Chinese Academy of Sciences, Beijing 100101, China
2
School of Geography, Huaqiao University, Xiamen 361021, China
*
Authors to whom correspondence should be addressed.
Sustainability 2019, 11(7), 1941; https://doi.org/10.3390/su11071941
Submission received: 16 March 2019 / Revised: 28 March 2019 / Accepted: 29 March 2019 / Published: 2 April 2019
(This article belongs to the Section Sustainable Agriculture)

Abstract

:
Grasslands in northern China form an important ecological barrier that prevents and controls desertification. The Beijing–Tianjin Sand Source Control (BTSSC) Project has been implemented to restore grassland in order to control sand sourced pollution. This study aimed to understand the impacts of four applied restoration practices on the productivity, composition, and species diversity of vegetation communities in the BTSSC Project. The results indicated the following: (1) All the restoration practices tended to increase the height and cover of communities, and the effect was most obvious where grazing was excluded; (2) total biomass (87%), above-ground biomass (164%) and below-ground biomass (58%) only increased consistently when grazing was excluded from the steppe; (3) fenced and grazing exclusion practice significantly increased the abundance of species in communities, but all the practices tended to decrease the evenness of species; and, (4) the correlation analysis revealed that the Shannon–Wiener diversity index, and Pielou evenness index, showed significant negative correlations with the above-ground biomass of grassland communities after restoration, while no significant relationships were shown in reference plots. Our comparison of applied practices in the BTSSC project revealed that grazing exclusion might be a high priority for more successful restoration in this region.

Graphical Abstract

1. Introduction

Rapid grassland degradation in China caused by intensive human activities and climate change has resulted in a series problems, such as the decline of grassland productivity, land desertification, soil erosion, and sandstorms [1,2,3]. In recent years, Inner Mongolia has experienced the greatest grassland degradation mainly in the western Xilingol steppe [3]. This rapidly degrading and fragile area, 600 km northwest of Beijing, is the most important source of sandstorms which affect China’s core urban agglomerations, such as Beijing and Tianjin. The development of effective ecological barriers to protect urban agglomerations from sandstorms is an urgent need to strengthen urban resilience [4]. To build an effective ecological barrier, the Chinese government has initiated and implemented a series of ecological restoration projects, such as the Beijing–Tianjin Sand Source Control (BTSSC) Project, the Three-North Shelterbelt Project, and the Grain for Green Project which are aimed to improve regional environmental conditions and restore degraded ecosystems.
So far, China has invested about 60.8 billion US dollars in national major ecological projects [5], such as the Three-North Shelterbelt, the Grain for Green, and BTSSC Projects. It is critical to accurately understand the effects of restoration and clarify the remaining flaws of the major ecological projects that have been applied [6], so that we can optimize the implementation plans and ensure the positive effect of these projects. This evaluation and optimization process can not only benefit people living in China but also contribute to the development and test of theories in ecological restoration.
Since the beginning of this century, increasing attention has been paid to assess the effect of applied ecological projects, with the aim of optimizing and improving their effectiveness. The evaluation methods used for assessment are diverse and change rapidly. The Conservation Effects Assessment Project (CEAP), initiated by the U.S. Department of Agriculture in 2002, assessed the effect of ecological projects at national and regional scales [7], through comparisons between the inside and outside of the project area [8] and before and after the project’s implementation [9]. The technical methods applied in CEAP were diverse and comprehensive, and their assessment concepts and methods had a worldwide influence. For instance, previous research quantified the improvement of different ecological services in a watershed from a wetland conservation plan by comparing changes inside and outside the project area [10,11]. Comparing changes inside and outside a project area is easy to implement, which makes it the most common and universal method for quantifying the effect of project implementation.
The species composition and biodiversity, as well as productivity and its components are important characteristics of grassland communities and supply a range of grassland ecological services [12]. However, it is difficult to quantify the monetary values of the changes that occur in species diversity, so the change in diversity has rarely been taken into consideration in previous large-scale assessments [1]. In addition, due to a lack of field survey data and limitations of the applied models, fine scale changes in productivity, such as the compositional change of plant functional groups, and the proportion of the above- and below-ground biomass, were usually not described accurately [1,12]. Nonetheless, species diversity, as well as the components and amounts of productivity, are often greatly influenced by human land use and grassland management practices, hence it is important to understand these aspects [13,14,15].
When assessing project benefits, most previous studies only focused on the changes inside versus outside the project area or before versus after the project’s implementation. By comparison, the differences arising from specific restoration practices have received less attention [16,17]. These deficiencies limit our ability to evaluate the suitability and optimize the effectiveness of restoration applications. Ecological restoration projects for degraded grassland have been applied for many years in the steppe area of northern China, and many different measures have been used [1,18]. Summarizing and identifying the regional differences, the effectiveness, and the suitability of these ecological projects can help improve the management and effectiveness of subsequent projects.
The typical temperate steppe of Xilingol has a harsh natural environment and a relatively fragile and unstable ecosystem [19]. Due to unsustainable human activities, almost 50% of the steppe has been degraded, resulting in a variety of ecological and environmental problems [20]. It has experienced many years of restoration projects with a variety of restoration practices in this region. Therefore, this region is an ideal area for a comparative analysis of the influence of different restoration practices applied in the BTSSC area. Although the BTSSC project was considered to be restoring steppe productivity effectively in previous research [1,21], there is still a lack of detailed understanding of the difference in the effect between those most applied practices of BTSSC project, especially on grassland productivity and its relationship with changes in species diversity. This gap hinders the optimization of restoration practices and may reduce the efficient use of investment in restoration. In this study, four of the most commonly used project practices were compared, including fenced grazing exclusion, seed replenishment, integrated control of small watersheds, and basic ranch construction (planting of artificial pasture), which have been extensively applied in the BTSSC project for years. We surveyed and compared the species and biomass composition, as well as the plant species diversity, inside and outside the project area among the four most applied restoration practices.
Our aim in this paper was to: (1) Evaluate if the practices of the BTSSC project effectively restored community biomass and consistently promoted the species diversity of project implement area; (2) compare the effect difference of the most applied four typical practices of BTSSC project, and discuss the prior practices suitable for temperate steppe; and (3) try to clarify how the implementation of restoration programs affected the relationship between community productivity and species diversity.

2. Materials and Methods

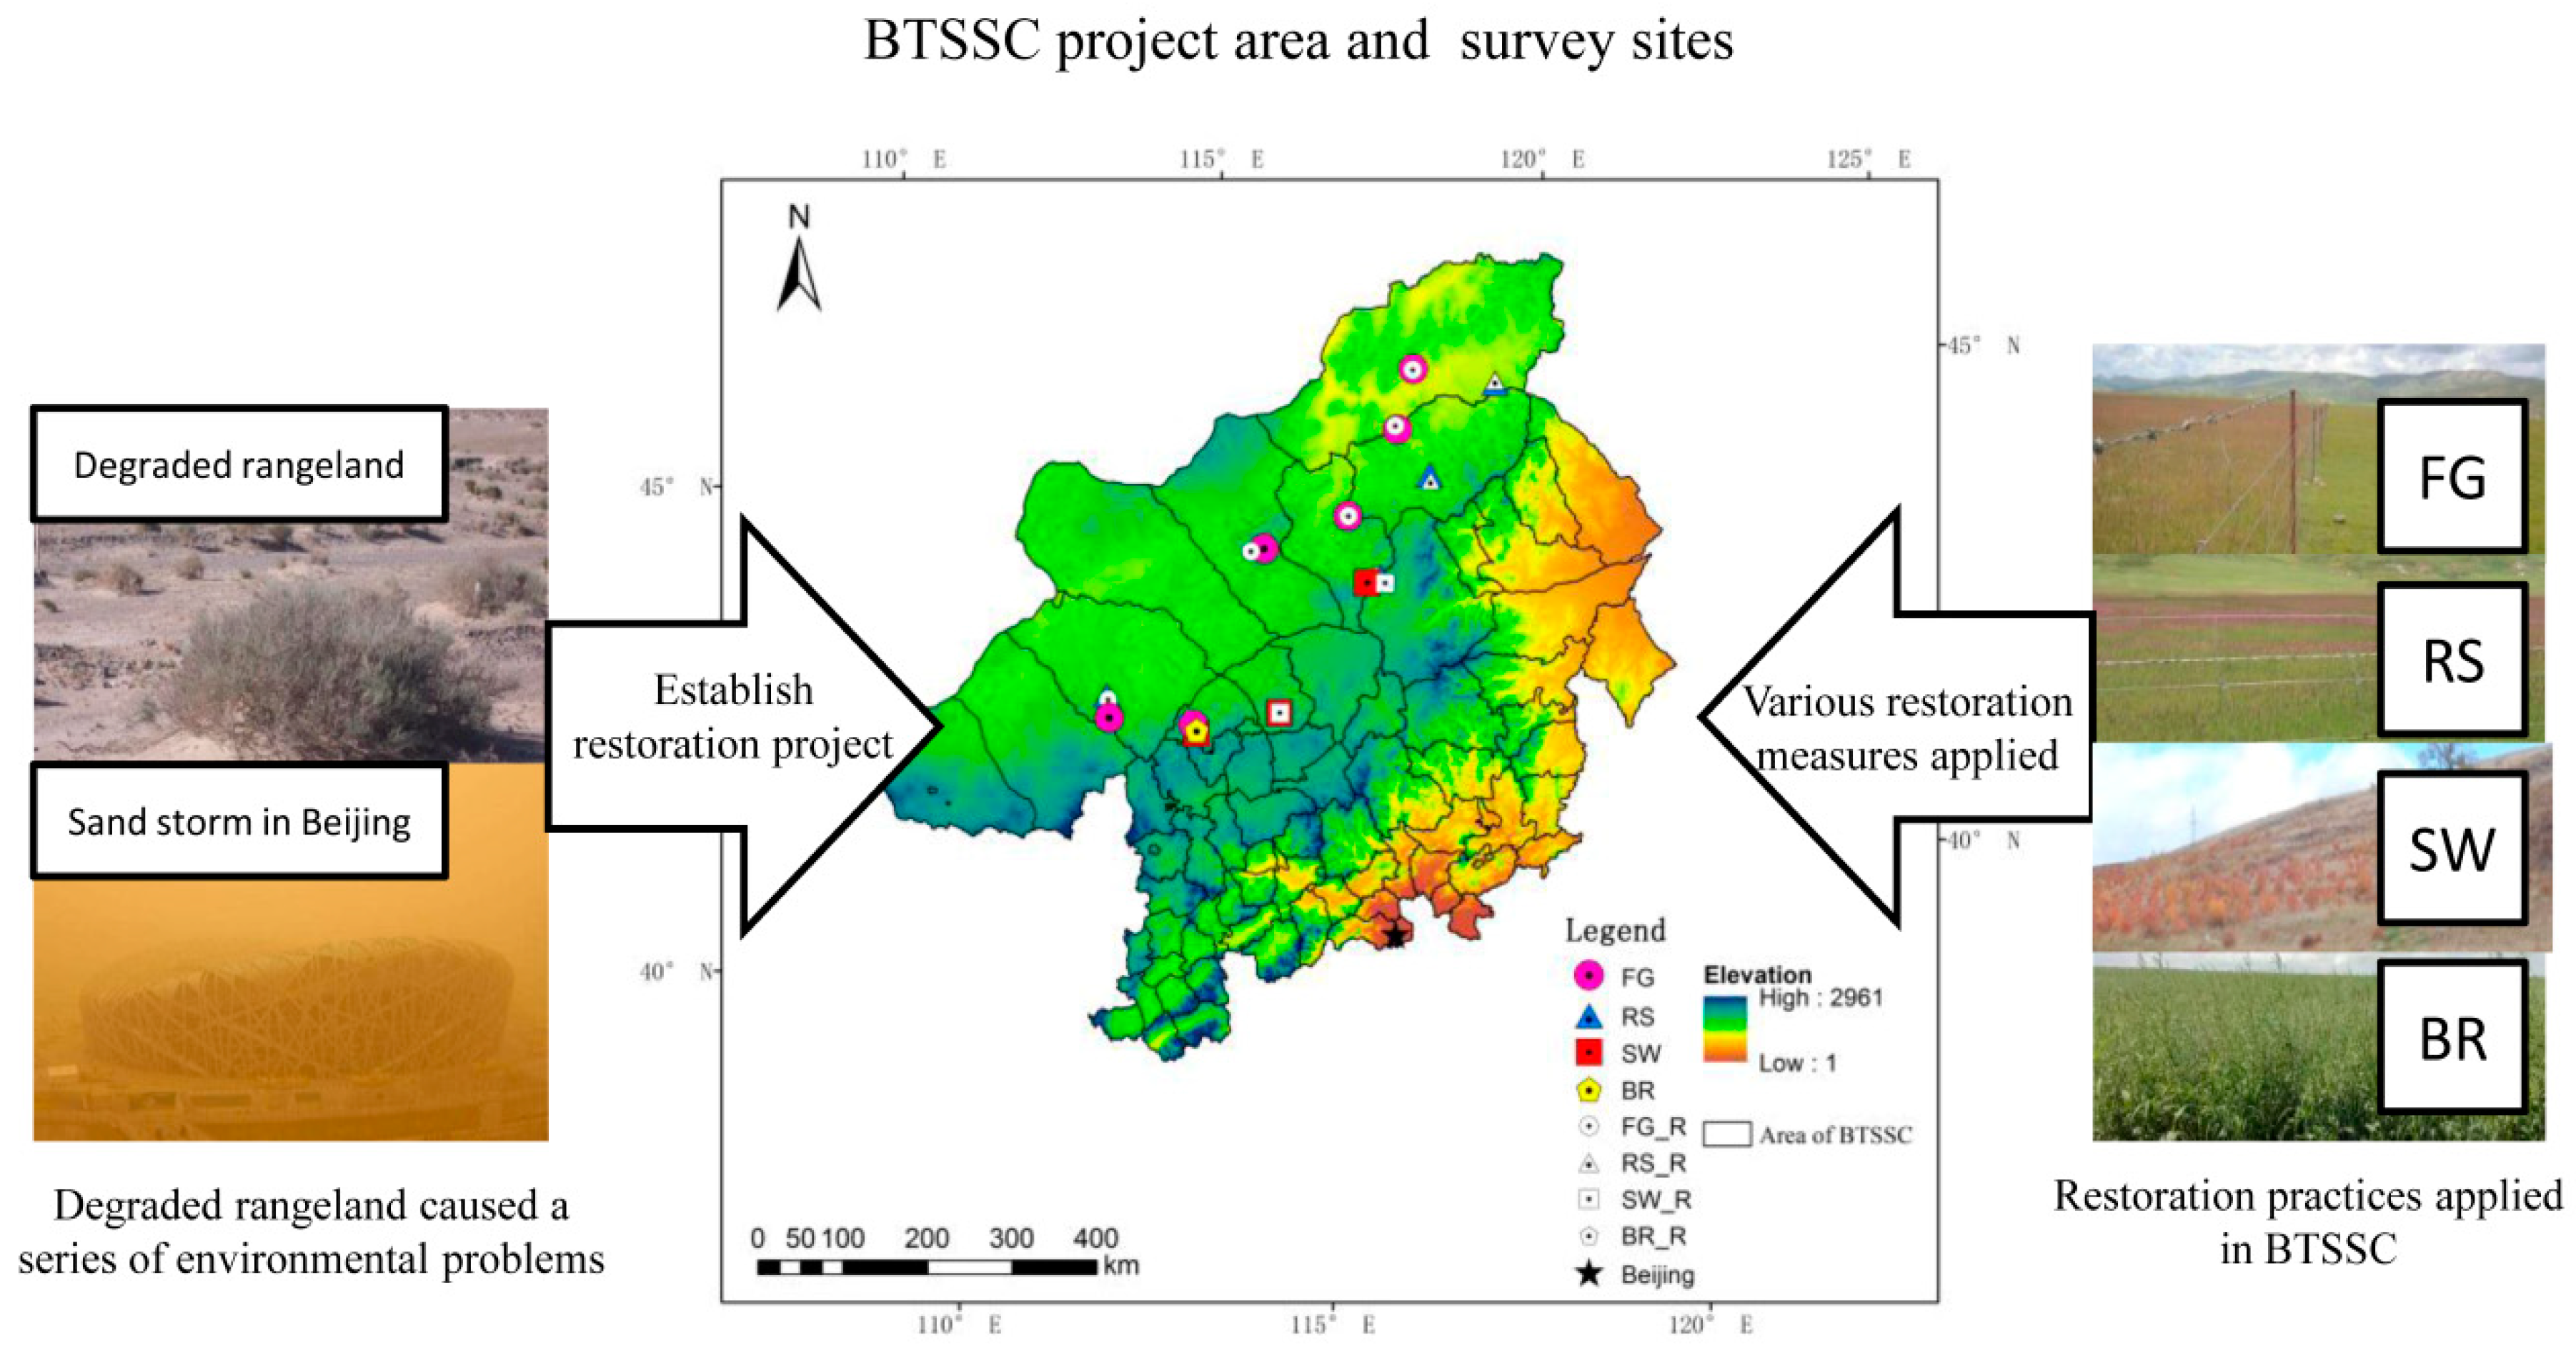
2.1. Study Area Description
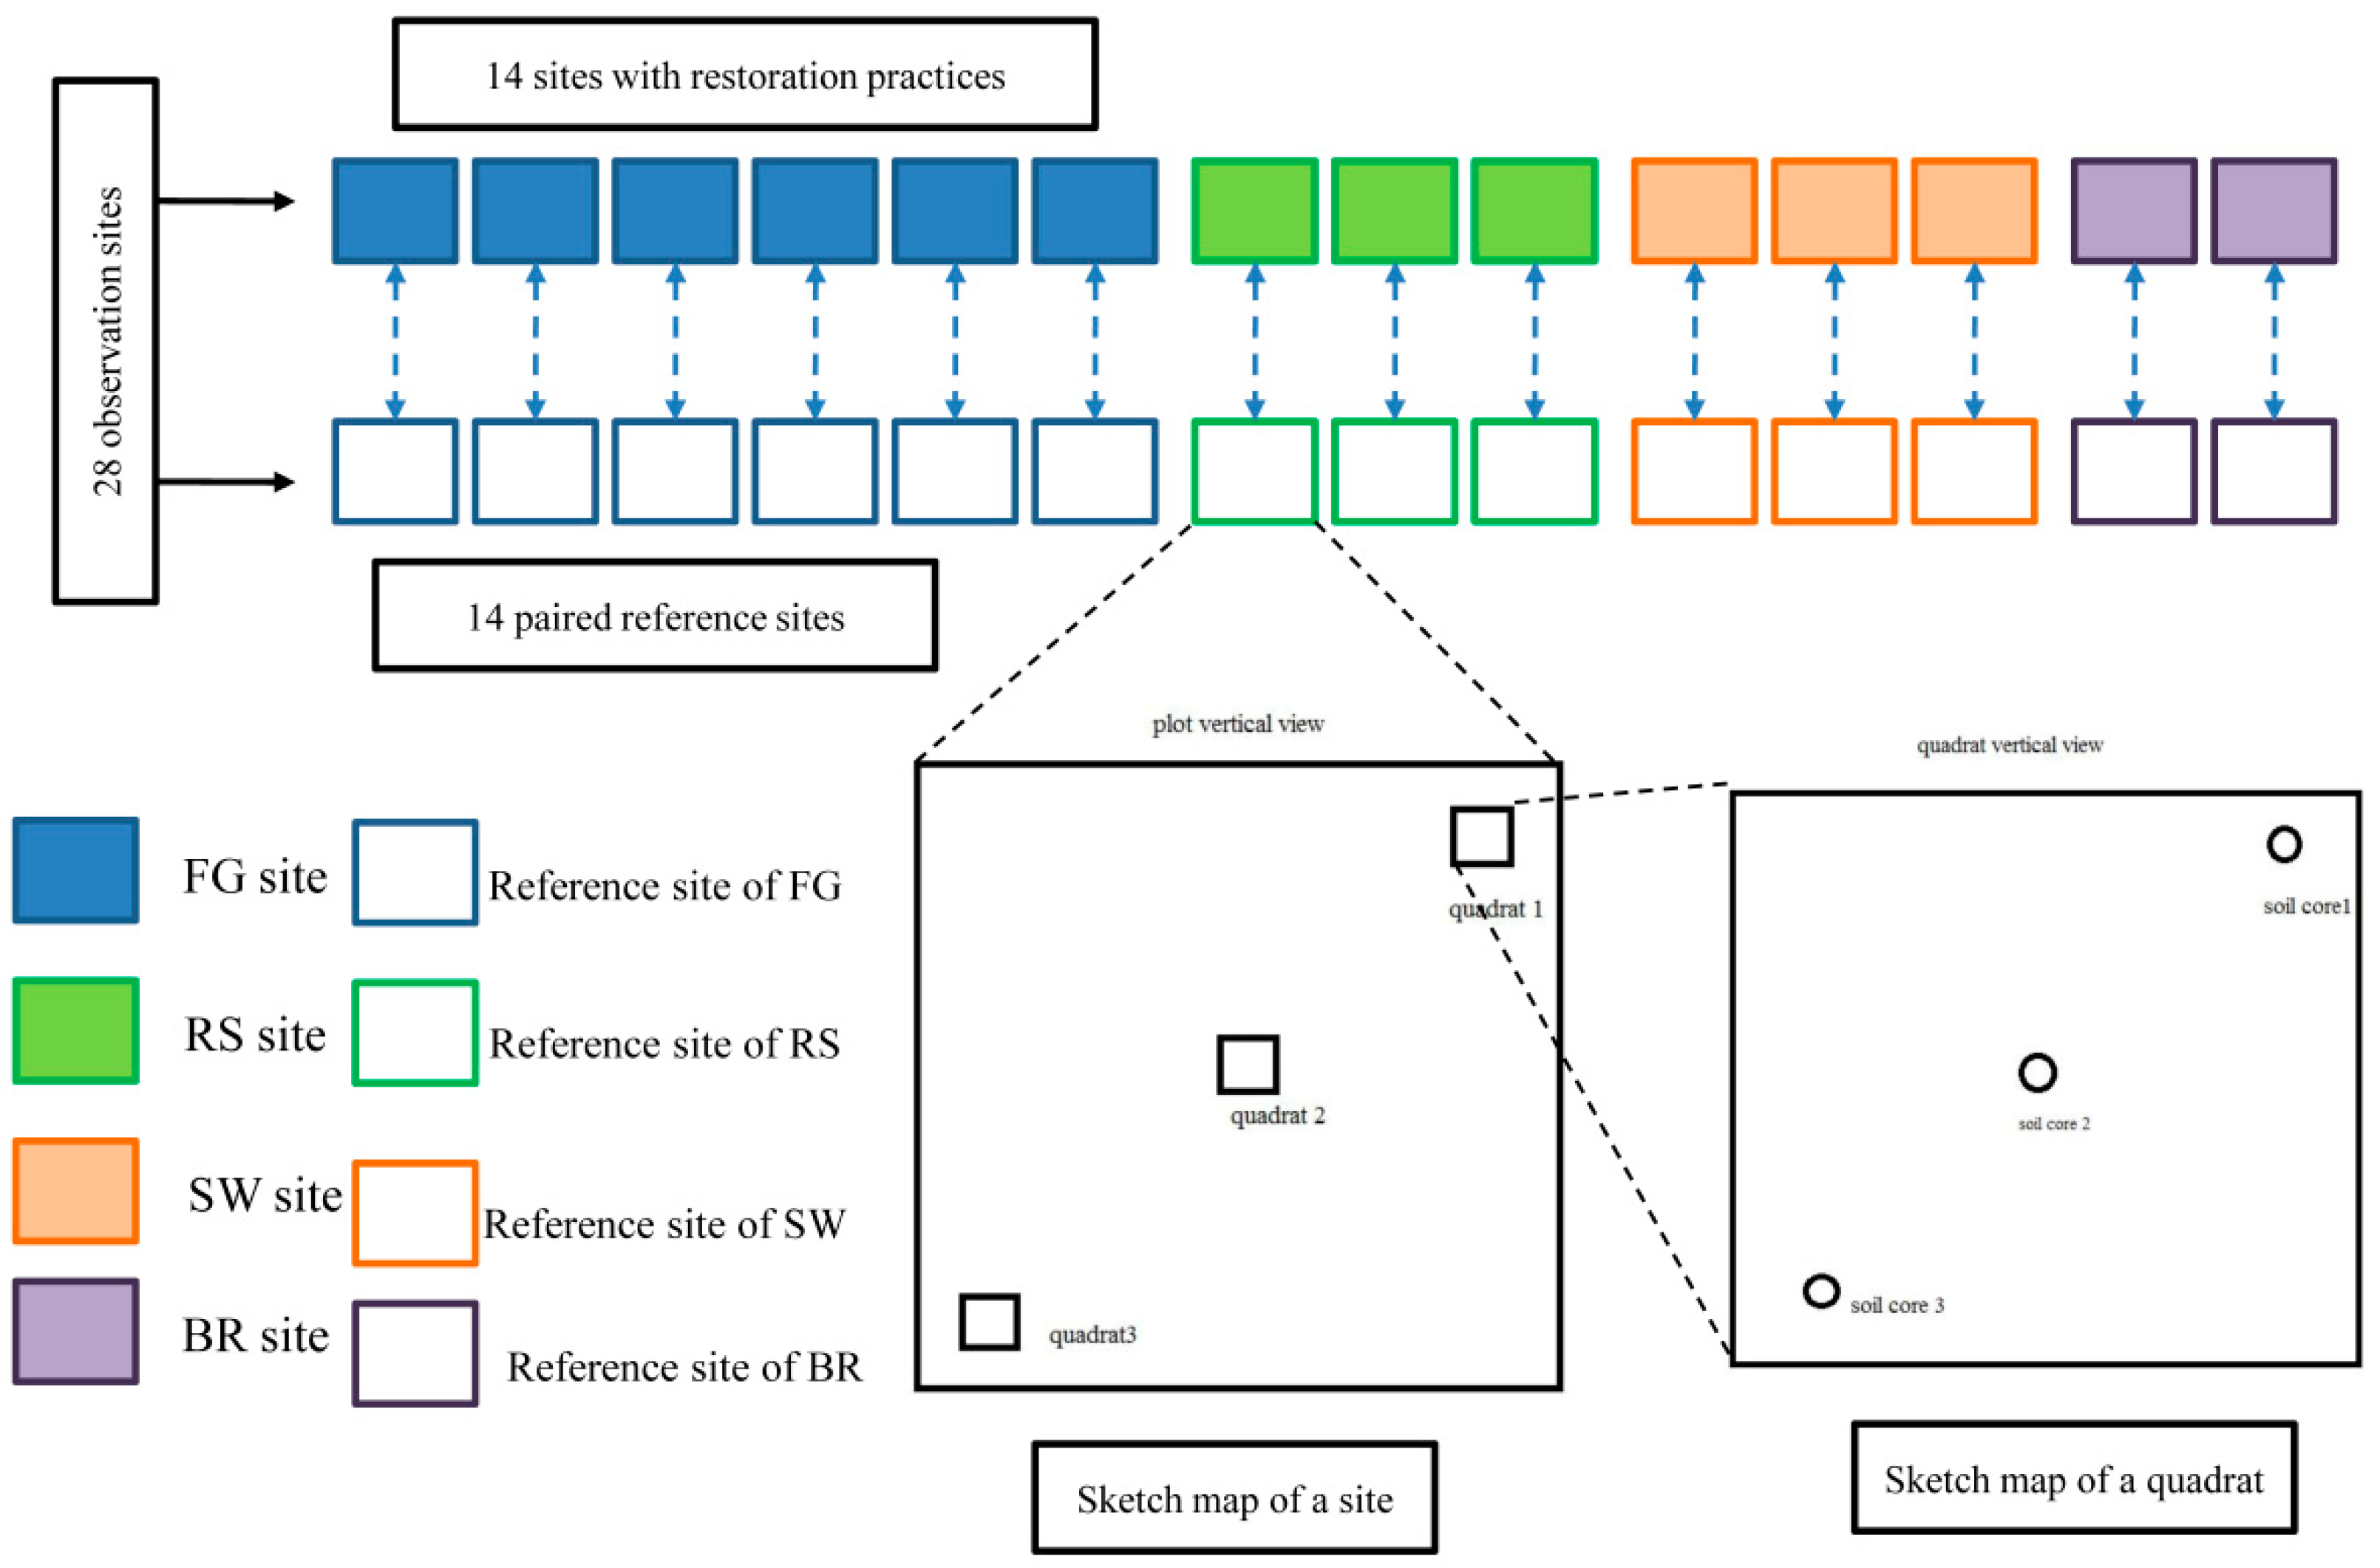
The BTSSC project covers an area from the Darhan Muminggan Joint Banner of Inner Mongolia in the west to the Ar Khorchin Banner of Inner Mongolia in the east, and from Dai County in Shanxi Province in the south to the East Ujimqin Banner of Inner Mongolia in the north. This project area covers 75 counties in five provinces in China. It ranges between 38°50′–46°40′ N and 109°30′–119°20′ E, with a total area of 4.58 × 10⁷ km2 (Figure 1). Here, we mainly focused on the influence of different grassland restoration practices on the grassland ecosystem in the steppe area. In the grassland control area of the BTSSC project, grassland restoration projects were carried out over a total of 3.746 million ha during the period 2000–2009. Among the different restoration practices, grazing exclusion accounted for the largest area, reaching 2.958 million ha, followed by artificial grassland (36,7000 ha), basic ranch construction (23,8000 ha), and seed replenishment (15,6000 ha) [22]. In addition, a combination of water source conservation measures, namely integrated control of small watersheds, were implemented over 2.235 million ha in the whole project area [3], a considerable part of which was distributed in the steppe area surveyed in this study. In a belt transect survey implemented in 2013, we systematically surveyed the influence of four restoration practices on the restoration of degraded grassland in ten banners within the Xilingol steppe area where the project was implemented. These four practices were fenced and grazing exclusion (FG), seed replenishment (RS), integrated control of small watersheds (SW), and basic ranch construction (BR).
The selected study area Xilingol is a temperate steppe of the BTSSC project area. It has an elevation of 1000–1400 m and is part of the central Inner Mongolian Plateau, with a semi-arid and arid monsoon climate influenced by mid-latitude westerlies. The average annual temperature is –0.4 °C, and the average temperatures for January and July are –23 °C and 17.9 °C, respectively [18]. The average annual rainfall is 350 mm, which is mainly concentrated in June–August [13]. The weather is mainly windy and dry throughout the year. The main soil type is chestnut soil [3].
The main zonal climax vegetation type in the study area is typical temperate steppe, such as Stipa grandis and S. sareptana var. krylovii. Due to terrain differences and grassland degradation, there are also local occurrences of regional meadow steppe and desert steppe.

2.2. Plot Settings

The field survey was conducted in August 2013. Twenty-eight observation sites with different restoration practices and reference ecosystems were selected in eight counties that were included in the BTSSC project area (Figure 1), and all the surveyed practices were put into application for about four years. Site selection was based on a distribution map of the project implementation areas in these banners provided by Inner Mongolia Agricultural University, in combination with the results of a questionnaire given to herdsmen near the survey area. The grazing steppe set as reference ecosystems were selected from adjacent winter ranges, which would not be eaten by cattle before winter. At each site, three biomass survey plots were established and ten sampling frames were randomly scattered to measure community species composition and frequency. In each biomass survey plot, three mowing quadrats were set to survey community structure and biomass composition. The 28 observation sites covered four representative restoration practices of the project, including six FG sites, three RS sites, three SW sites, and two BR sites (Figure A1). For a paired comparison, a reference site was set in an adjacent free-grazing area with a similar terrain outside the fence of each project observation site (400 m from the nearest fence of the restoration area). A total of 14 reference sites were used to quantify and accurately assess the change in the grassland ecosystem influenced by the restoration practices.
All the observation sites were spatially distant from each other, the average distances between most adjacent sites was 79.73 km. This prevented individual project implementation areas from being affected by the same background factors, such as special regional terrain and microclimates, and by case management and protection conditions, thereby reducing the bias in the assessment of the effect of restoration practices caused by sample site selection.

2.3. Measures Applied in Restoration Practices

Among the selected restoration practices, FG was a restoration measure that prevented cattle entering the restoration area by fencing it off, which eliminated the trampling and grazing effects of livestock on the grassland. RS involved artificial dissemination of forage grass seeds in the spring. In this survey, the sown species of forage grass were mainly natural local grasses with high fodder value, such as Leymus chinensis and Elymus nutans. In the BR areas surveyed in this study, the artificial planting of forage grasses was implemented after plowing as a restoration measure. In the SW areas, the land use and management measures were determined for each block in the watershed, so that they could be coordinated with each other, forming an integrated system mainly aimed at preventing and controlling soil and water erosion. The specific measures include a silt dam, interception ditches on slopes, shrub and grass seed replenishment for vegetation restoration, dams to block sand, and planting grass checkerboards.

2.4. Community Features and Vegetation Analyses

In each survey sites (including restoration practices and reference areas), a randomized quadrat design was applied with a scale of 10 quadrats (1 m × 1 m) to record the frequency of the plant species that appeared in the sites. The coordinates and elevation of the survey sites were recorded with GPS positioning. In every survey site, three sampling plots (25 m × 25 m) with consistent topographical features and representative community status were selected. In each of the plots, three quadrats of 1 m × 1 m were established diagonally. For every quadrat, the species composition, the maximum and average height and the entire cover of the community, as well as the maximum and average height of each species were measured, and the percentage cover of each species was estimated with a common phytosociological investigation method.

2.5. Measurement of Above- and Below-Ground Biomass

The above-ground biomass was measured by harvesting, the above-ground tissue of each species in the three quadrats of 1 m × 1 m in every sampling plot was clipped to the ground level and kept separately in different envelopes according to species. Soon afterward, it was dried in an oven at 65 °C for 48 h and weighed. The below-ground biomass was collected with the root drill method (with a diameter of 70 mm), in every quadrat with all above-ground tissue removed, three layers of 10 cm depth (0–10, 10–20, 20–30 cm) were collected from three different soil cores distributed diagonally [23]. In each site, three layers were sampled and each layer had three replicates. Roots and soil were separated with water through a 0.3 mm mesh sieve and remaining non-root impurities, such as sands and stones, were separated from the roots with a 20-mesh screen. Afterwards, the below-ground biomass was dried in an oven at 65 °C for 48 h and weighed.

2.6. Calculation of Species Diversity Indices

(1) species richness
S, the total number of species appeared in observation site
(2) diversity indices
Gleason index: dGl = S/lnA
Shannon-Wiener index: H’ = −ΣPilnPi
(3) evenness index
Pielou index: J = H’/lnS
where, S is the number of species; A is the area of applied quadrat (m2); Pi is the importance value of species i; refer to previous research, the importance value (IV) was calculated:
IV = (relative height + relative coverage + relative frequency)/3

2.7. Data Analysis

Linear mixed effect model analysis (LMEM) with normality (Shapiro-Wilk test) and variance equality test (Levene) was applied to determine the differences of the vegetation characteristics, biomass and its components, and species diversity index among the various program practices and their reference ecosystems. Paired T-test was used to determine the difference between the practices and their reference ecosystem in site scale. The effect difference of components of biomass and species diversity index between practices were analyzed by LMEM. Linear regression analysis was used to evaluate the relationships between above-ground biomass and species diversity index. All the statistical analyses were conducted using SPSS 12.0 (SPSS Inc, Chicago, IL, USA).

3. Results

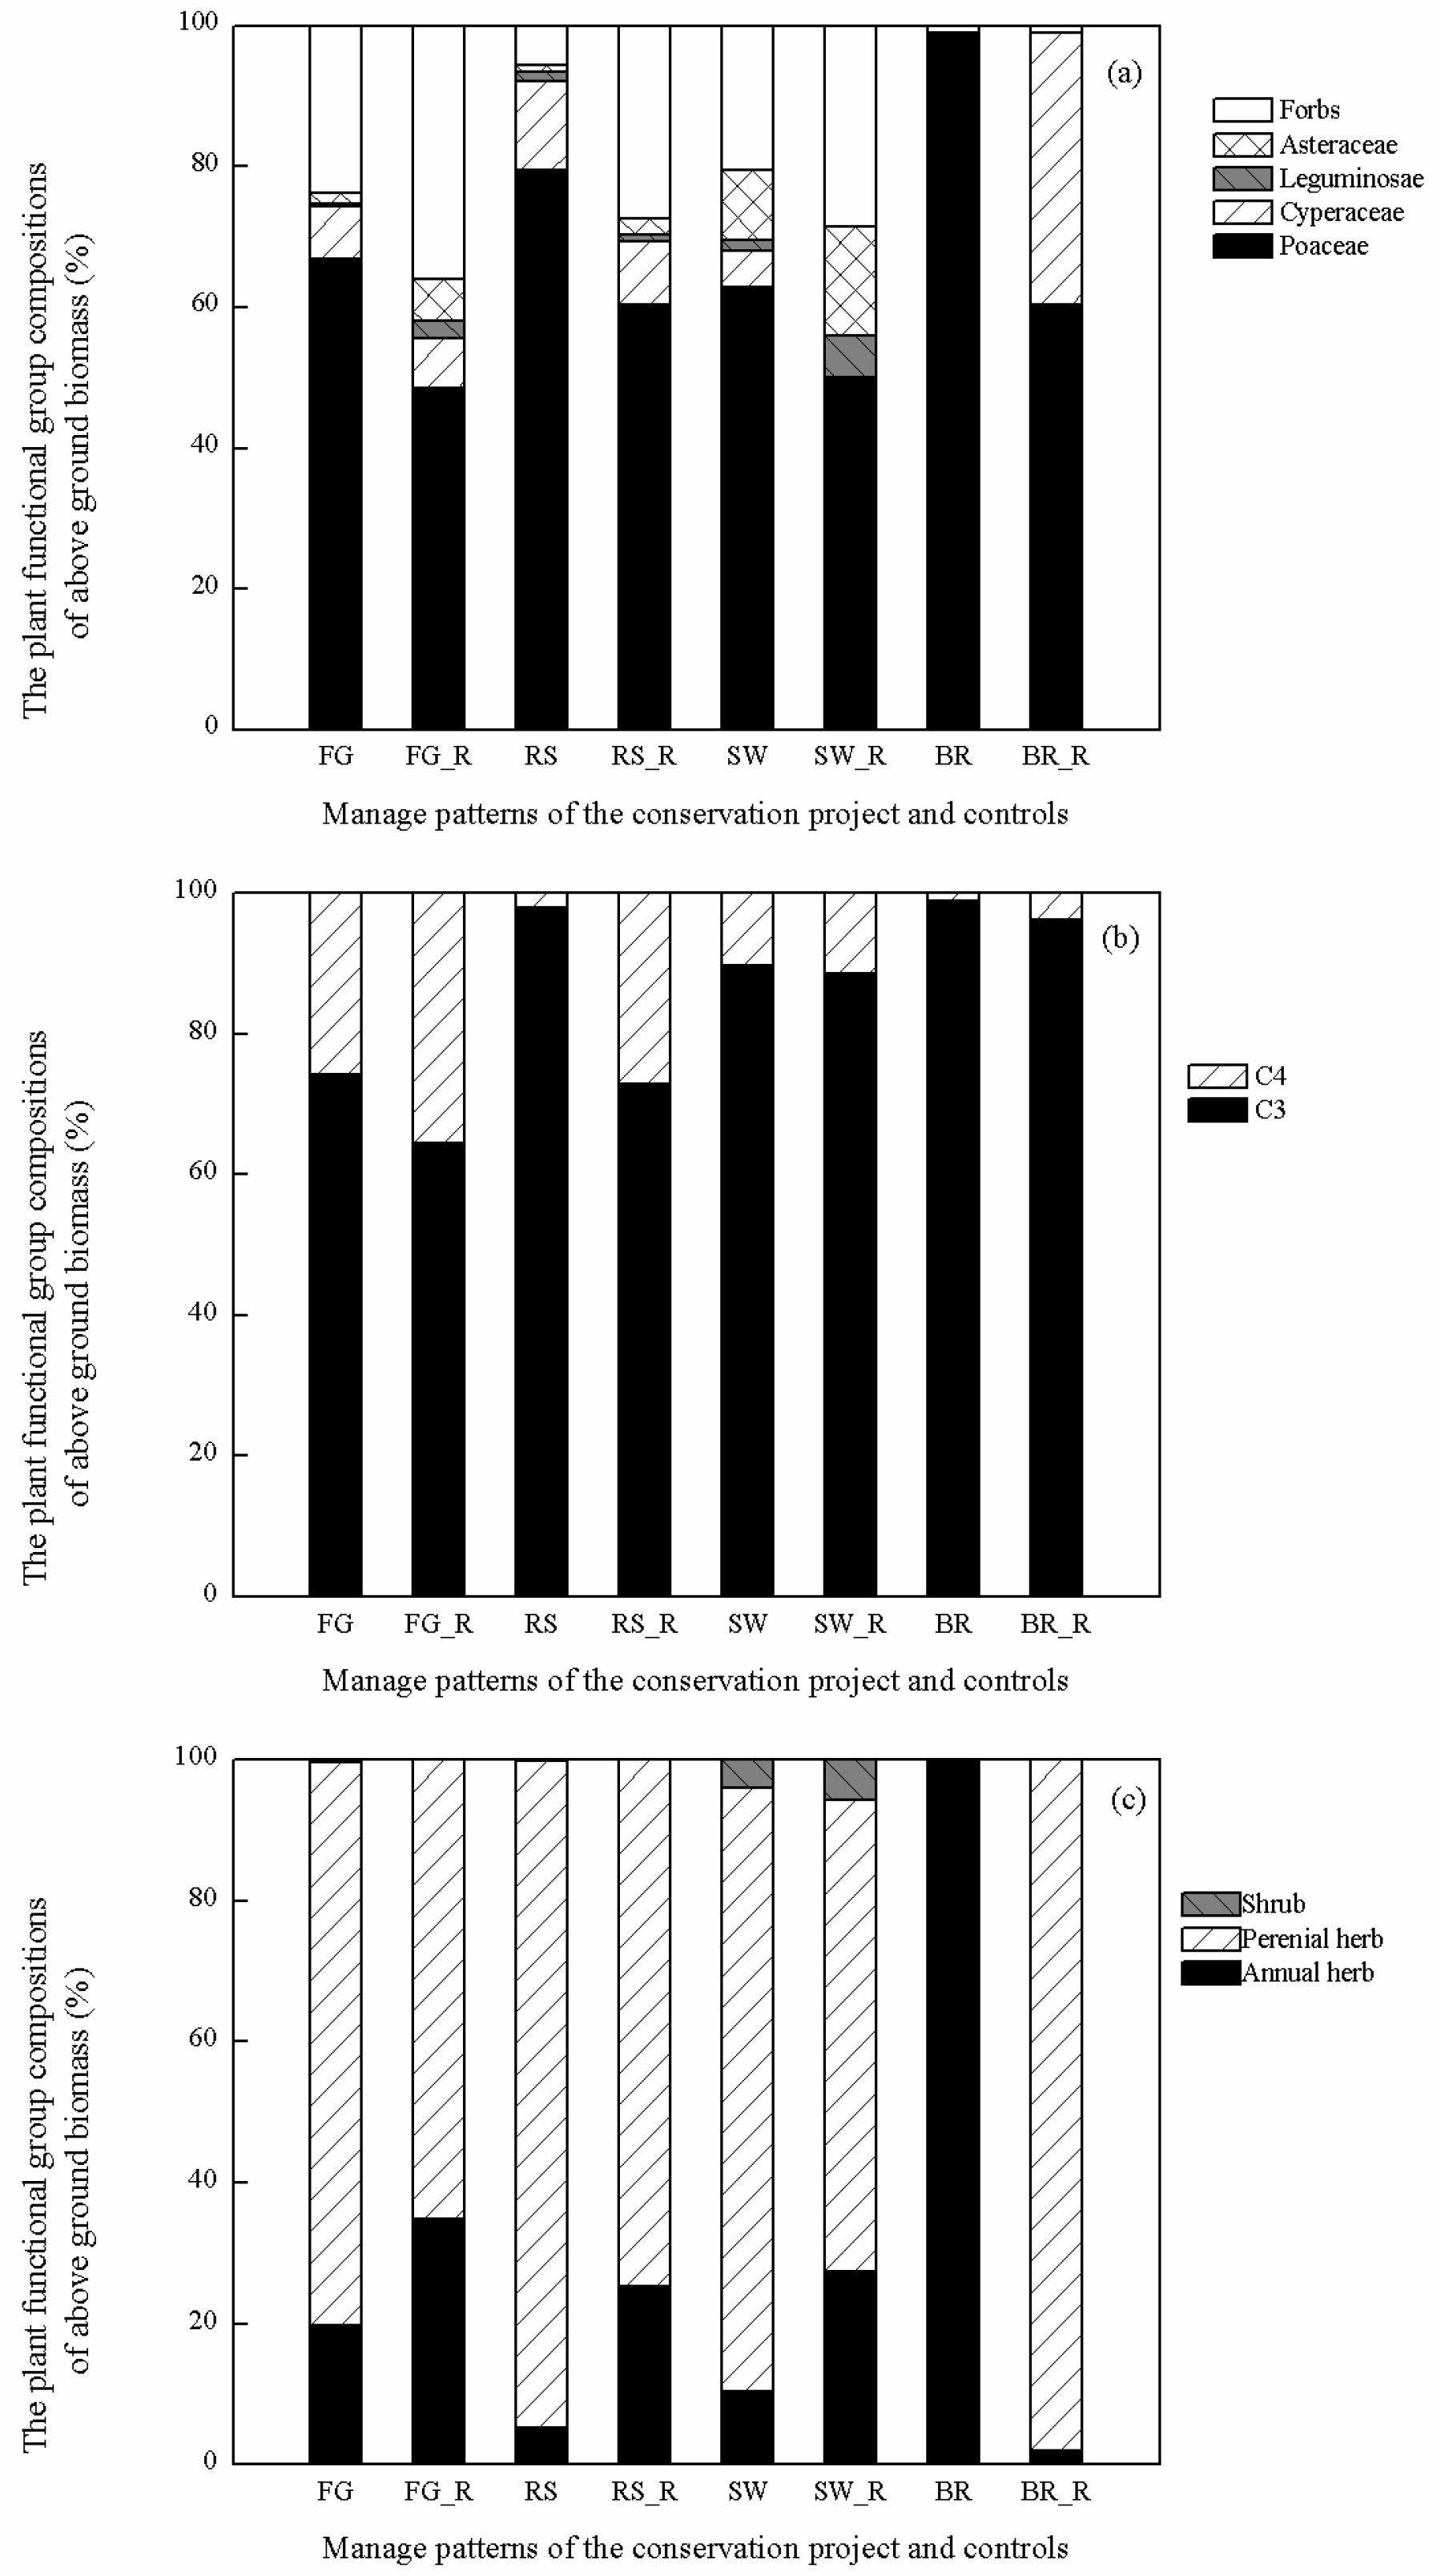
3.1. Influence of Restoration Practices on Community Structural Characteristics and Species Composition

The 28 sites surveyed in this study were grouped into eight communities, including four restoration practices and four corresponding reference ecosystem groups. All four restoration practices tended to increase community coverage levels compared with their respective reference ecosystems. The coverage increase in FG sites was significant (Table 1, p < 0.05), reaching —50%. All four restoration practices also tended to increase the community height. The height increases in FG, RS, and BR sites were significant, and the most obvious increase was found in the BR area where the community height increased by an average of 3.1 times. The constructive species and dominant species (top three species with the greatest IV in the community) at each site are presented in Table 1. Species found repeatedly in different sites of the same group were merged.

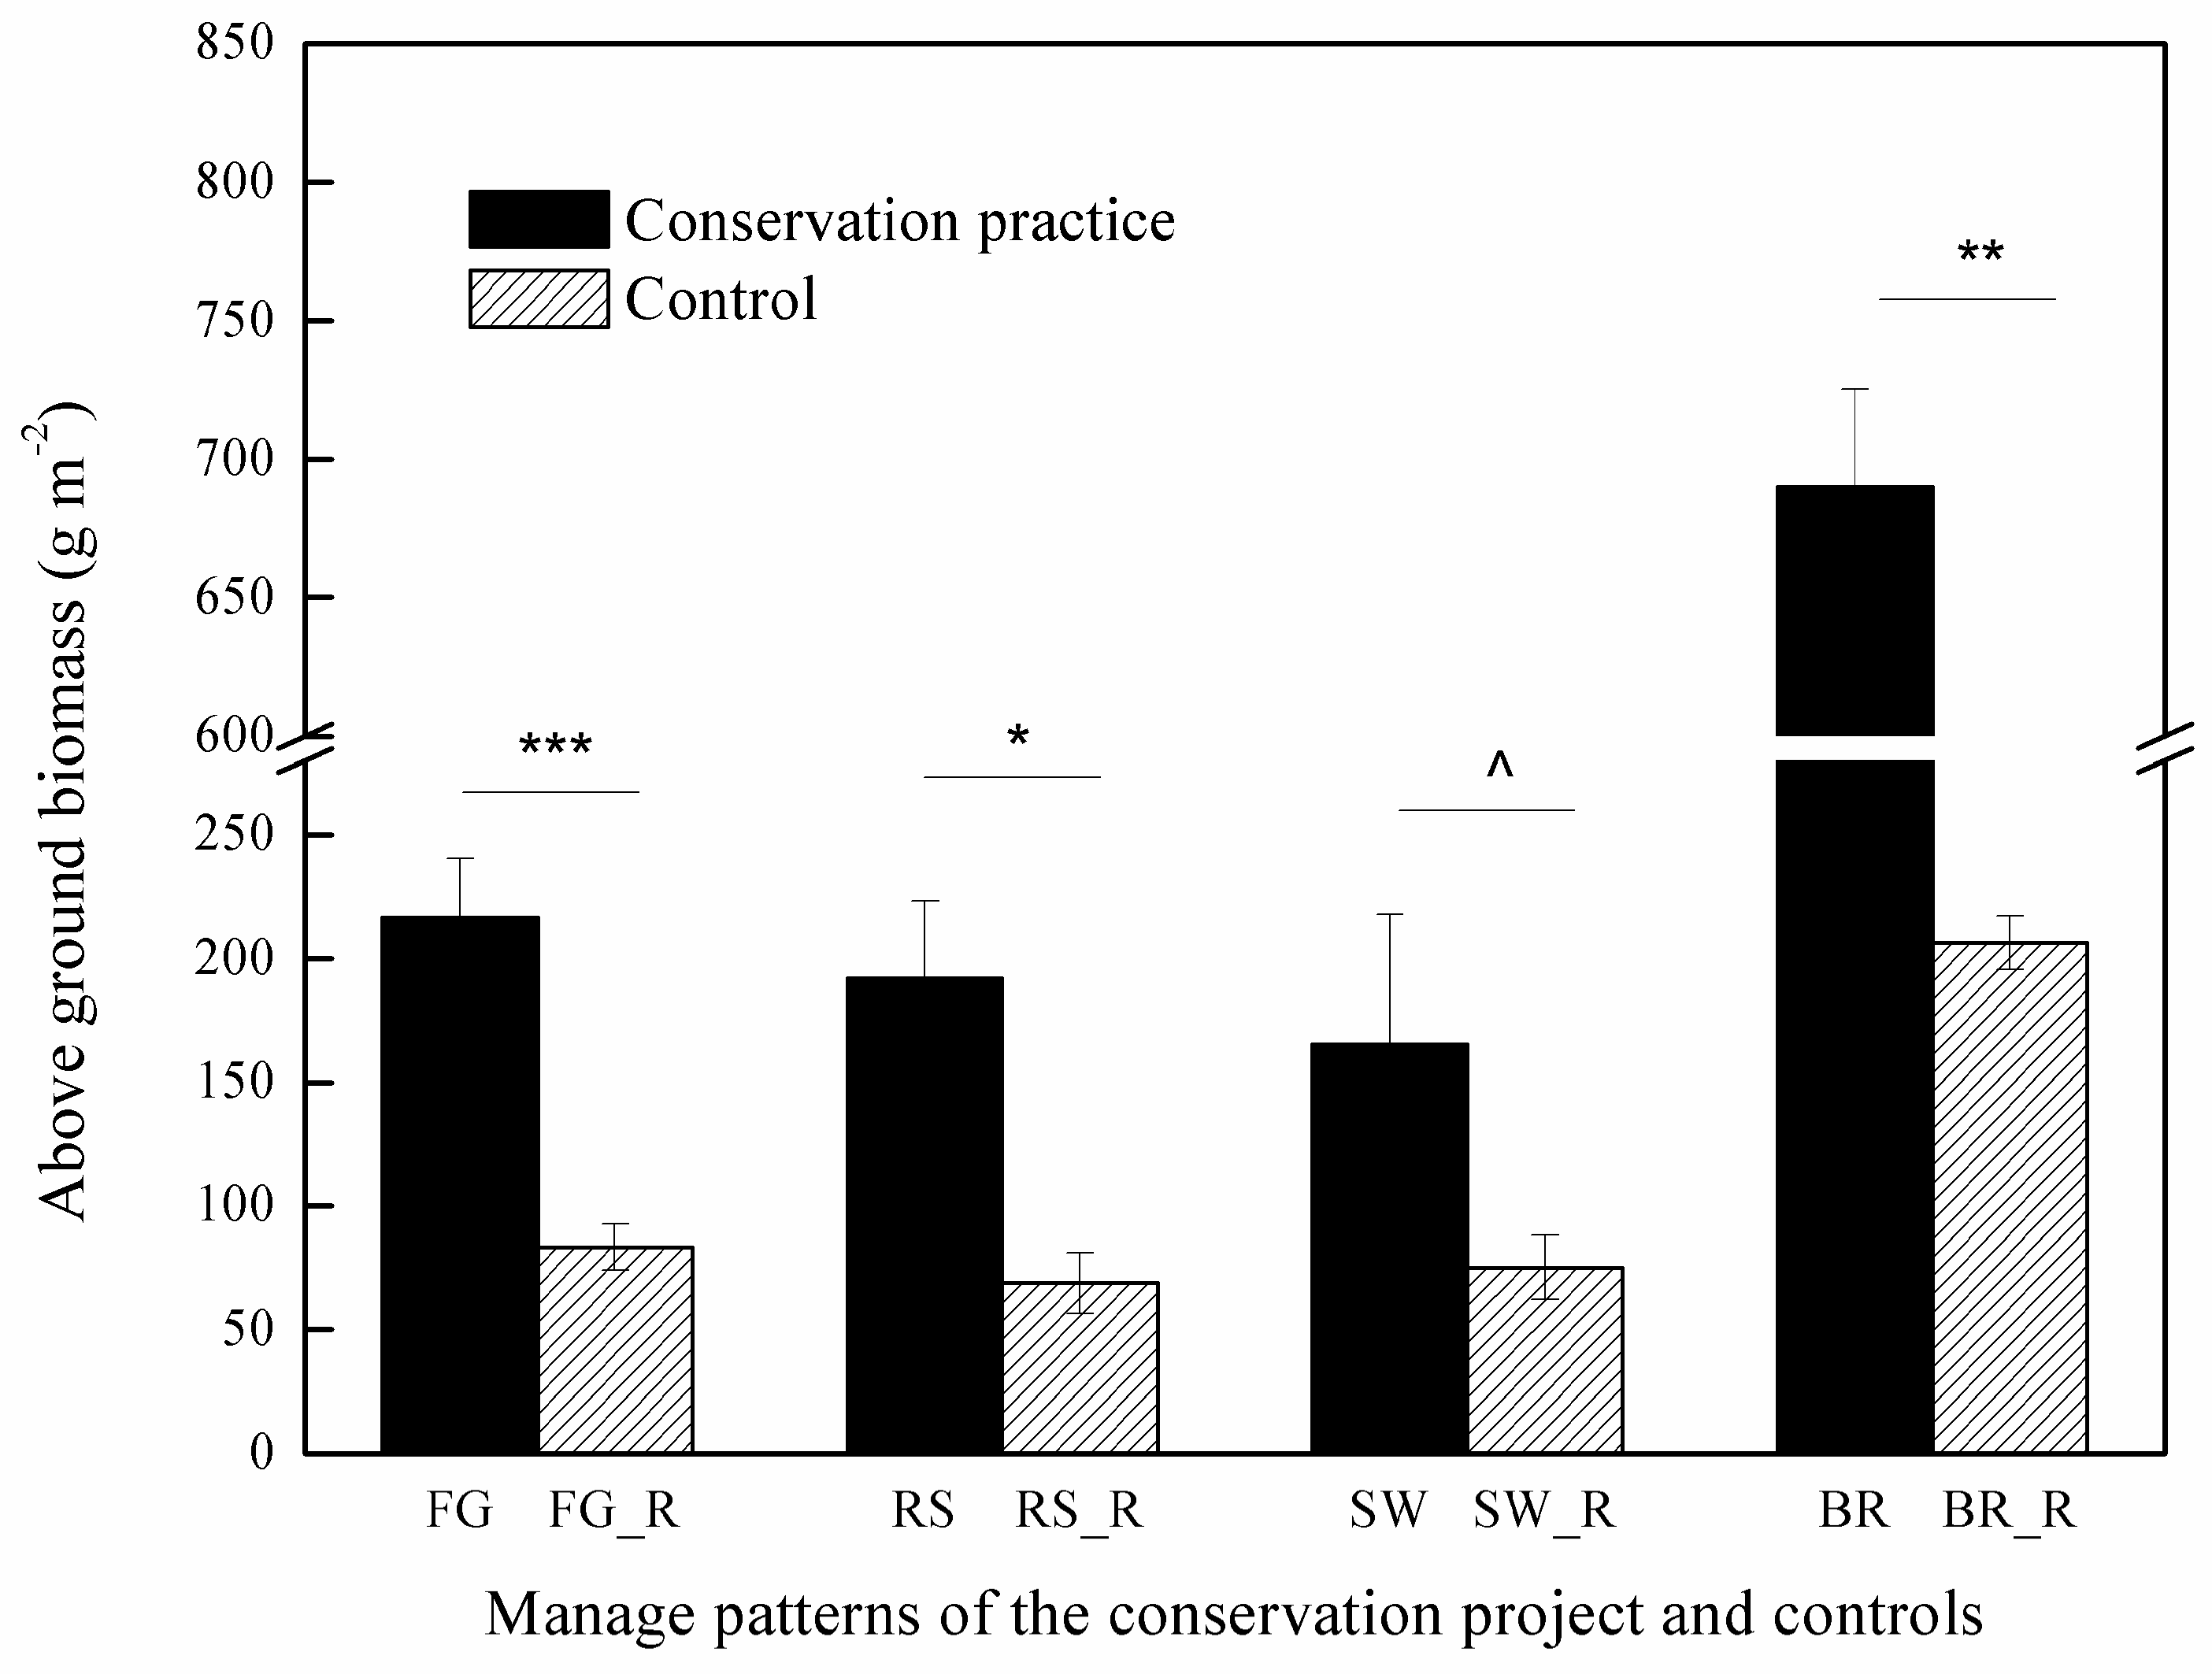
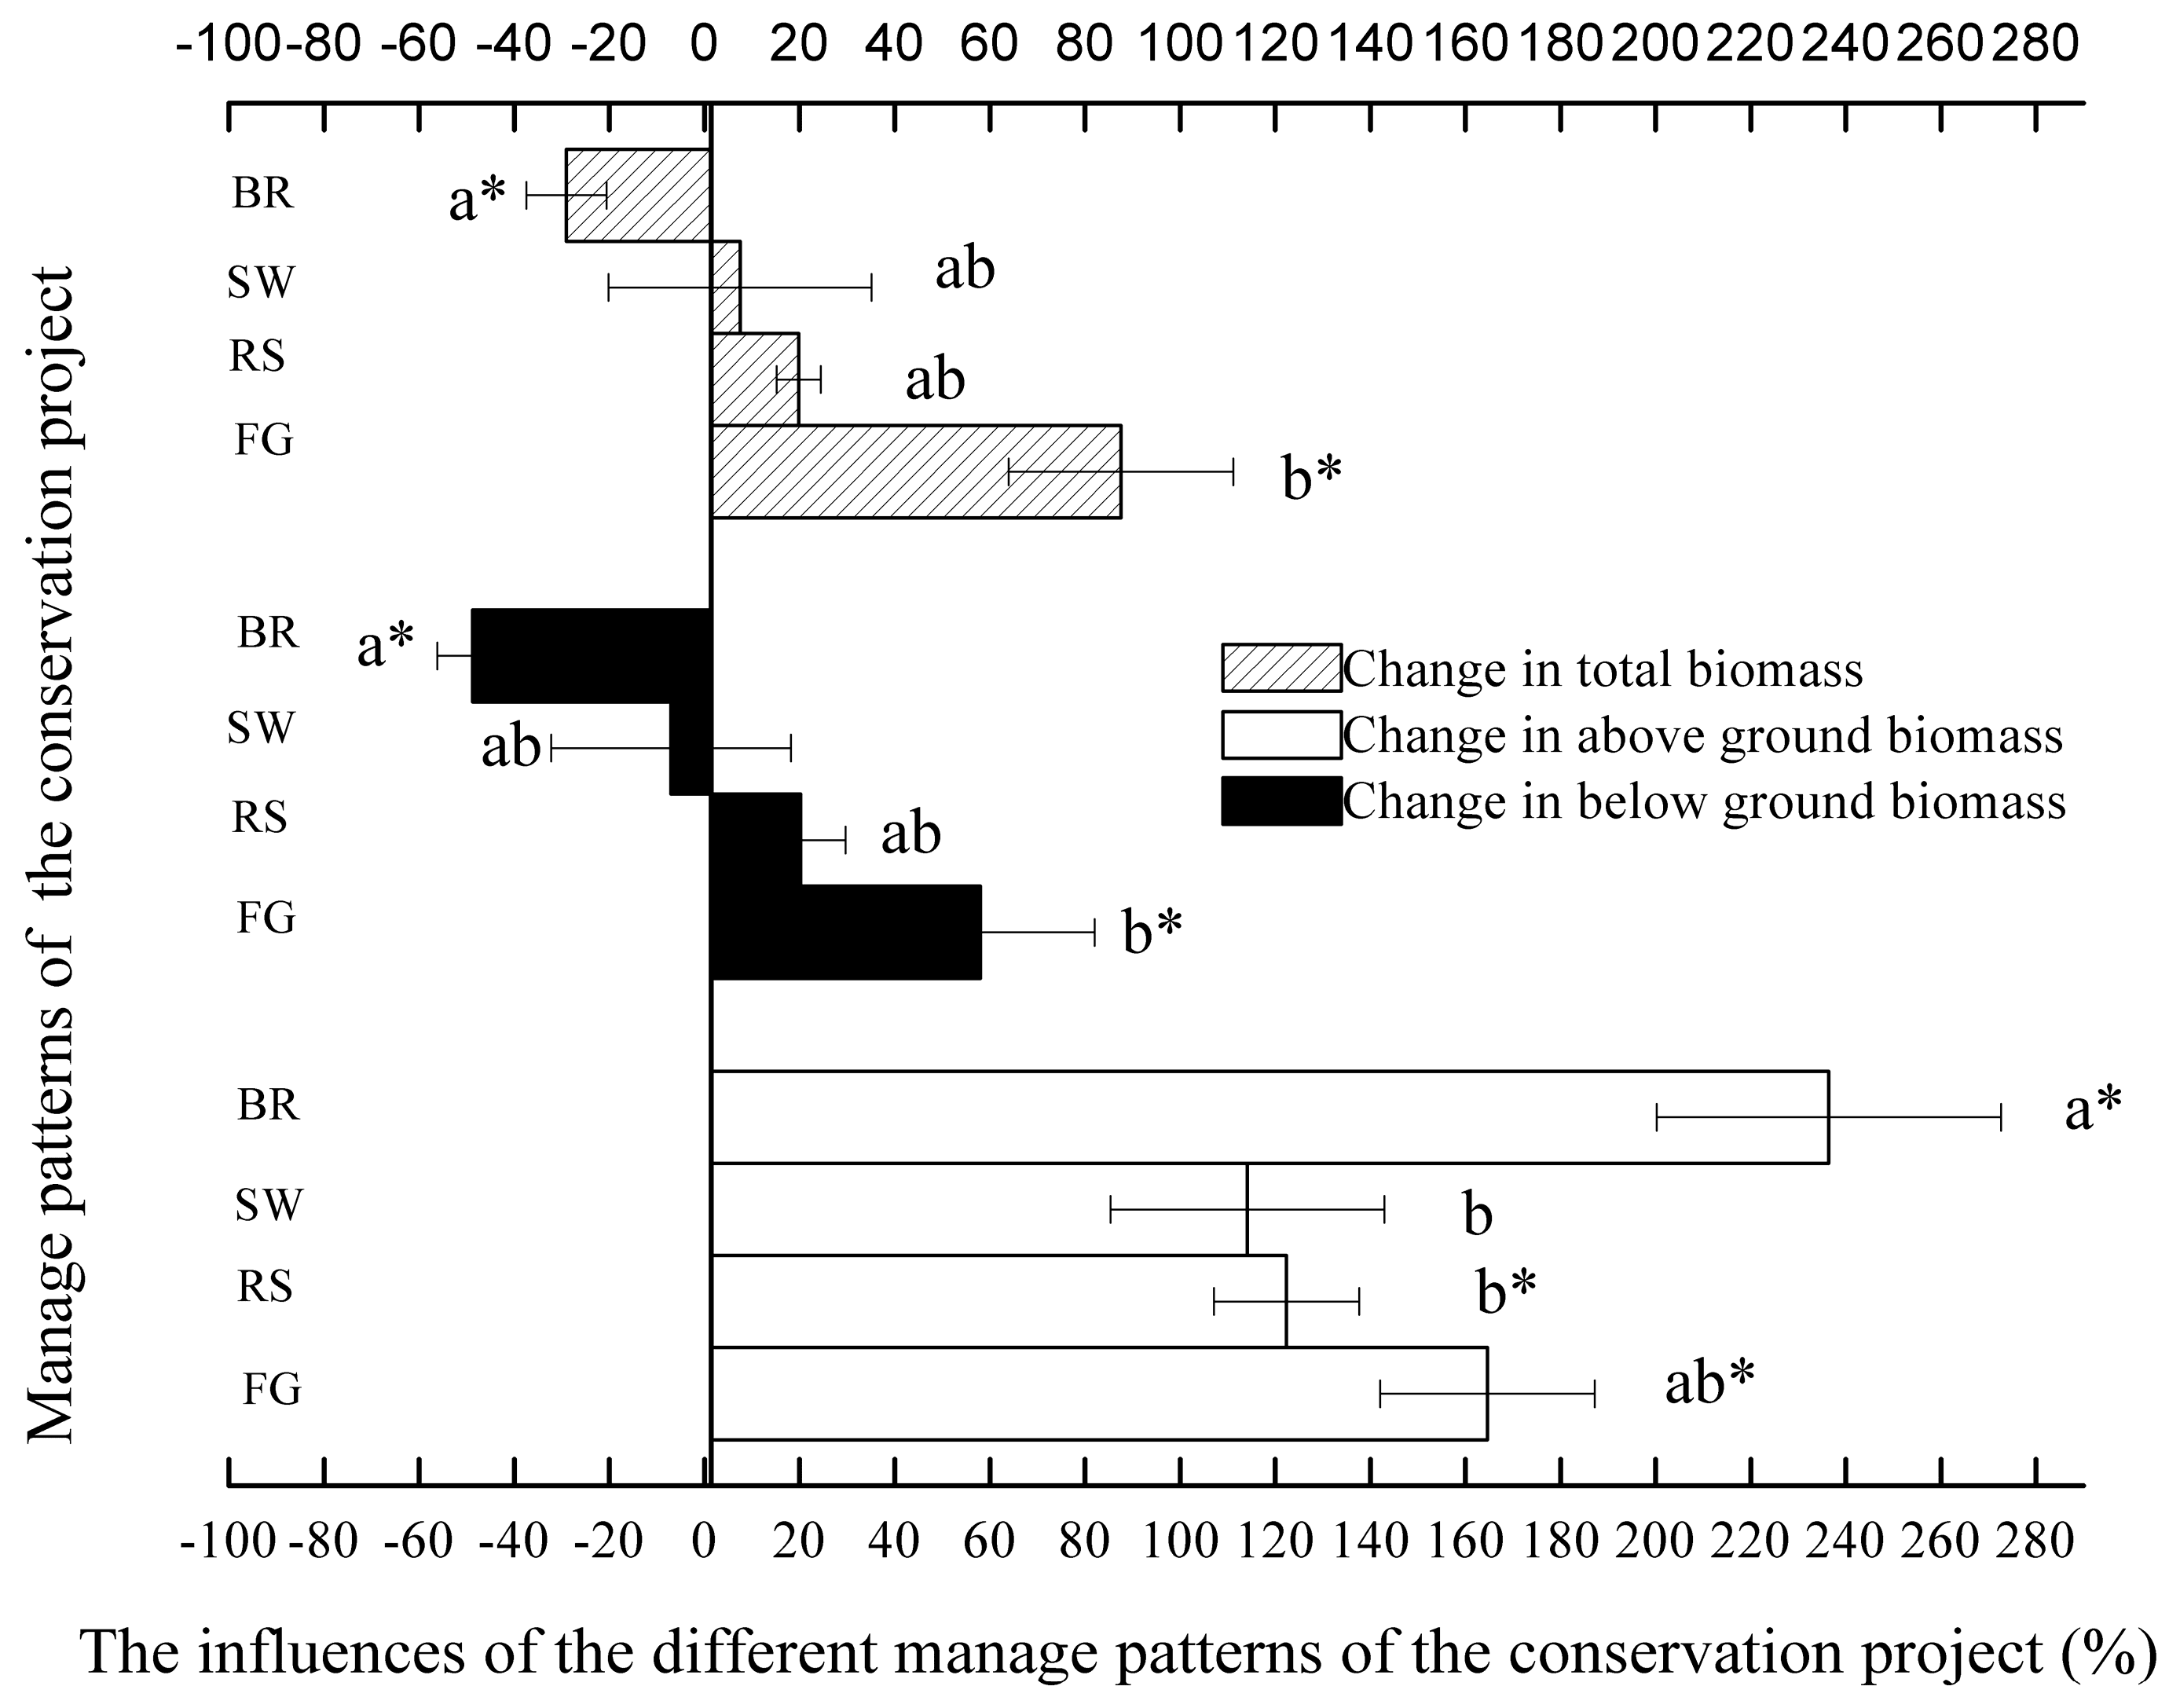
3.2. Influence of Restoration Practices on Above-Ground Biomass

All restoration practices tended to increase the above-ground biomass of the communities compared with their respective reference ecosystems (Figure 2). The increases were significant for FG, RS, and BR (p < 0.05). Among the four different restoration practices, BR obtained the highest above-ground biomass with an average of 690.0 g/m2. Compared with its reference ecosystems, BR increased the biomass by 235%.
With regard to plant functional groups, different restoration practices all tended to increase the proportion of Poaceae while decreasing the proportion of forbs in the communities (Figure 3a). The proportion of forbs decreased by 82% in the RS area compared with its reference ecosystems. Compared with the reference communities, different restoration practices also tended to increase the proportion of C3 plants in the communities (Figure 3b). There were larger increases in the proportion of C3 plants for FG and RS.
Apart from BR, all the remaining three restoration practices (FG, RS, and SW) tended to increase the proportion of perennial herbs while significantly decreasing the proportion of annual herbs in the communities (Figure 3c). When comparing RS with its reference areas, we found that the proportion of annual herbs decreased by 79% and the proportion of perennial herbs increased by 27%, representing the most obvious changes.

3.3. Influence of Restoration Practices on Below-Ground Biomass

The below-ground biomass of all communities was considerably higher than their above-ground biomass. The below-ground biomass in the BR area was relatively low, averaging —1500 g/m2. The highest below-ground biomass of the communities reached an average of —3200 g/m2 in the RS restoration area. Different restoration practices and specific management measures showed very different influences on the below-ground biomass. FG significantly increased the below-ground biomass of the communities (Figure 4, p < 0.05), while BR significantly decreased it (p < 0.05).

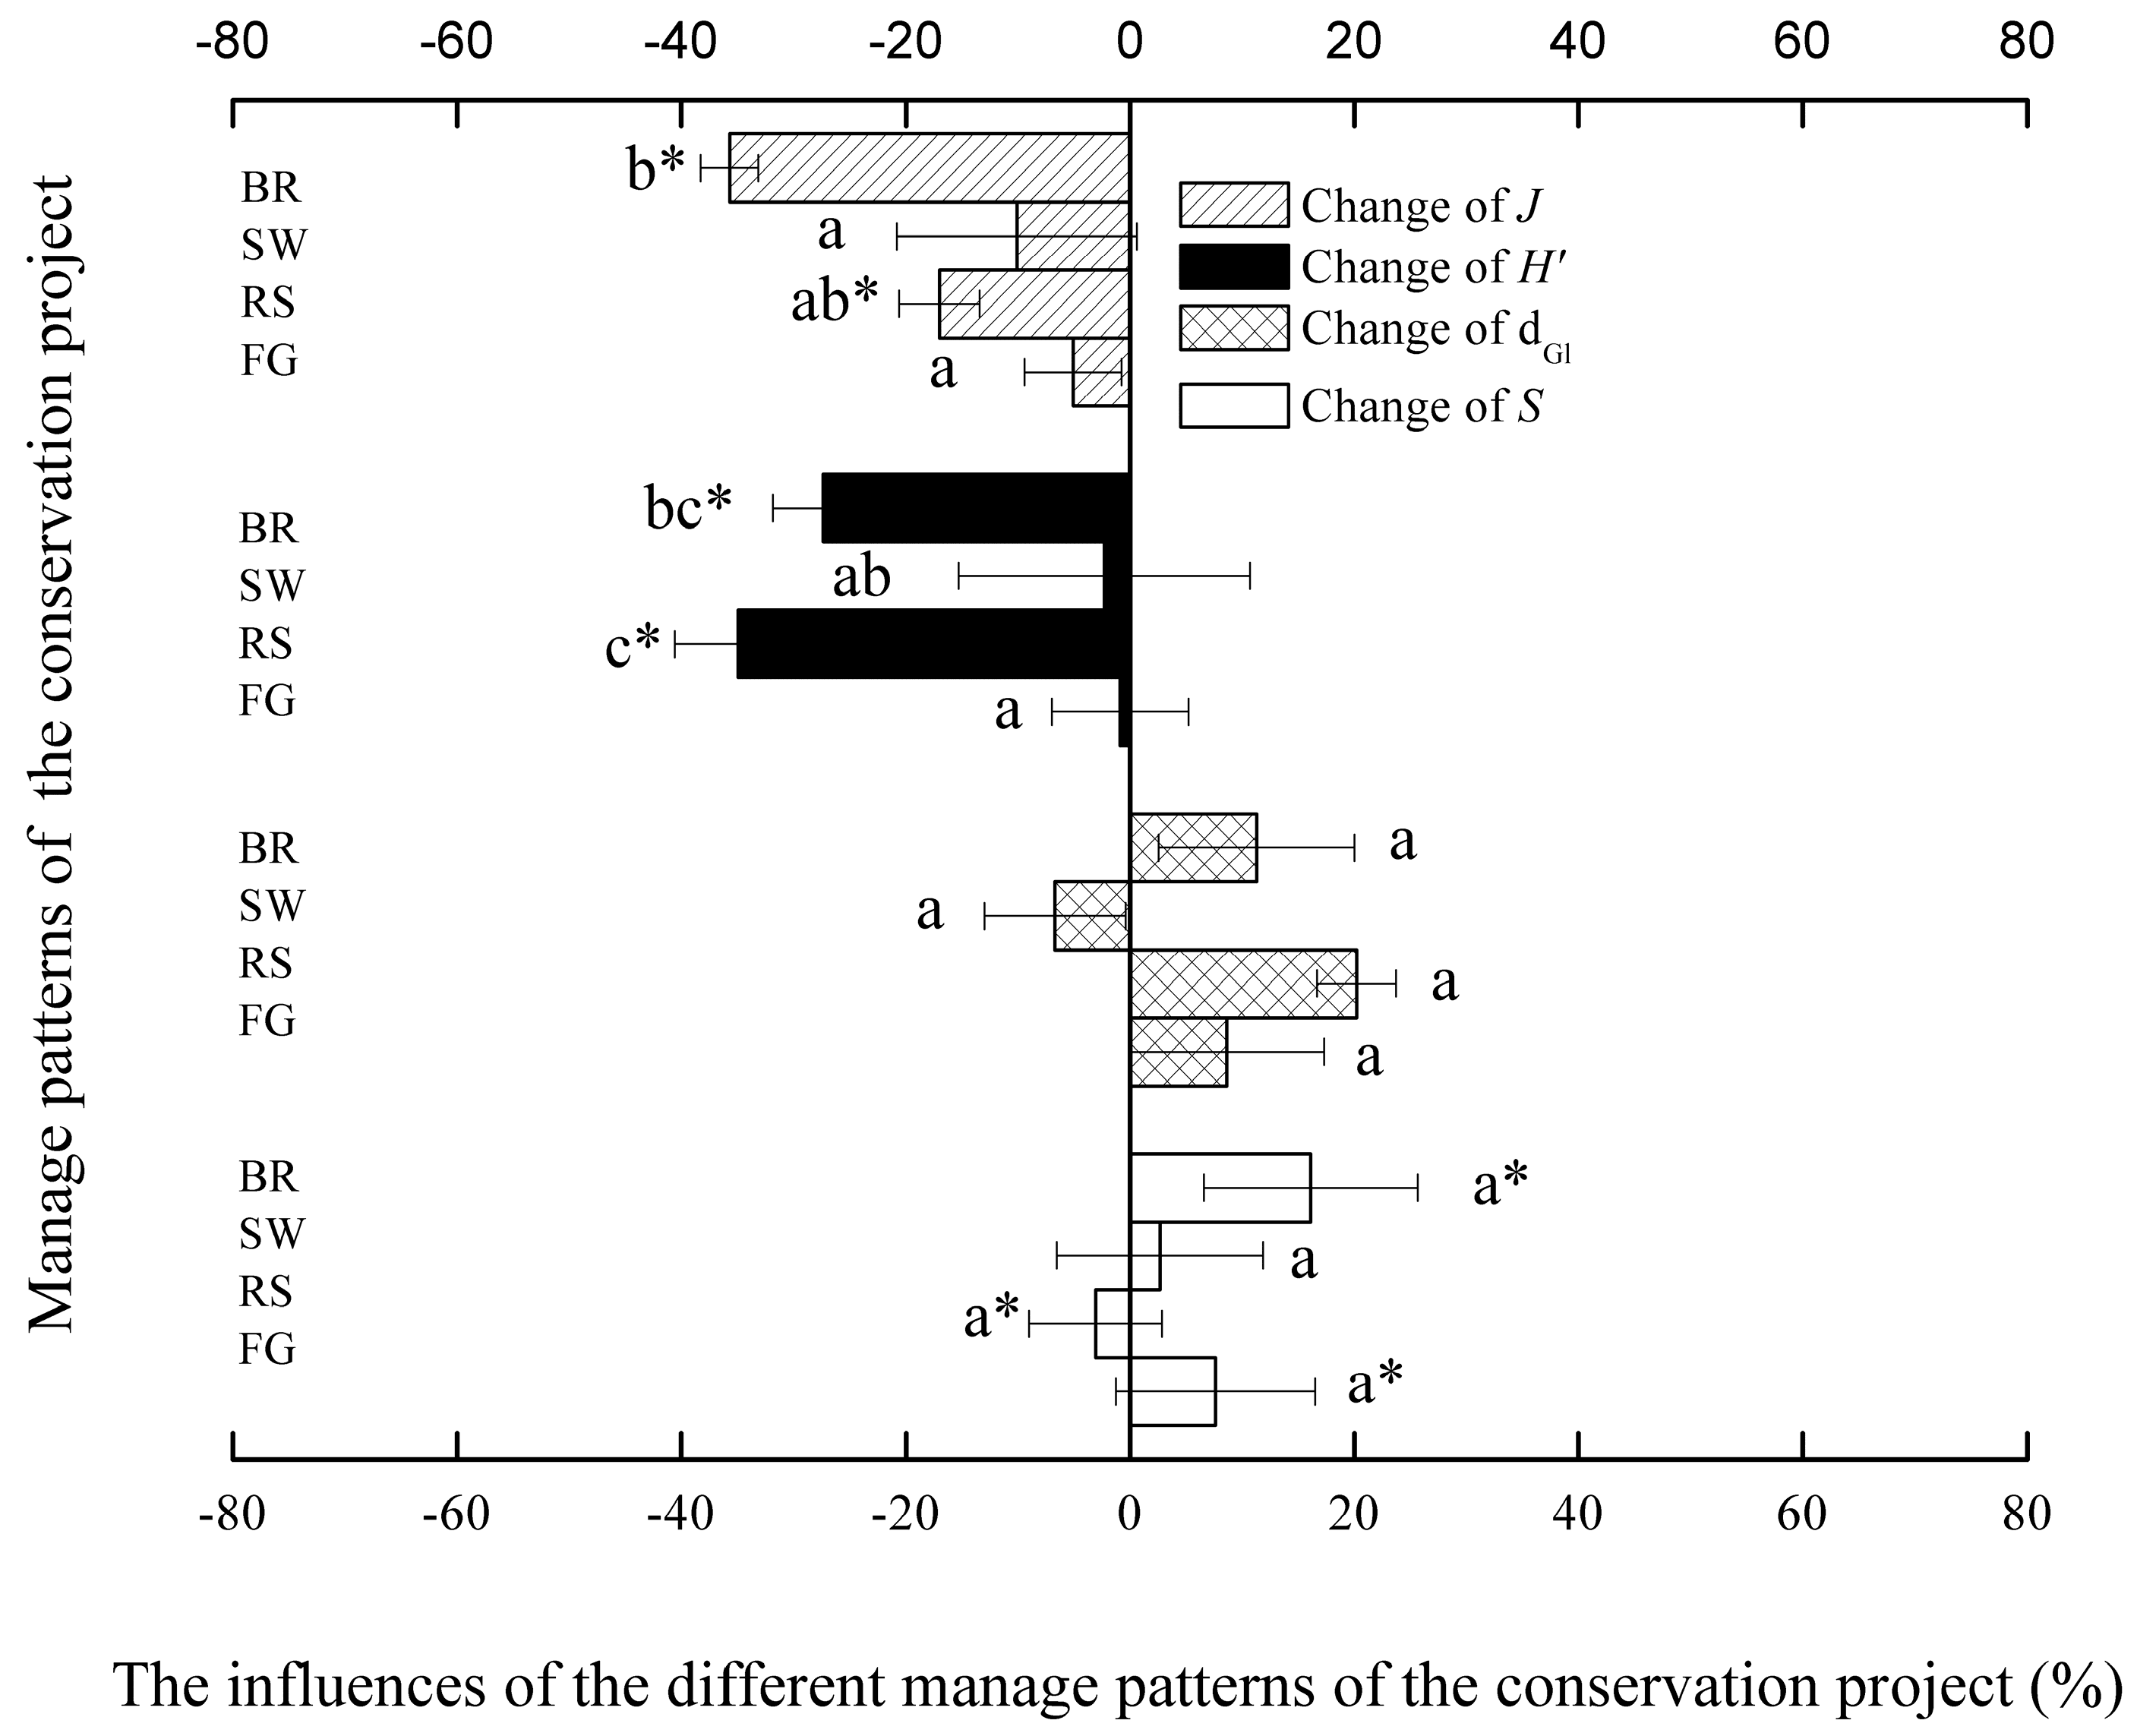
3.4. Influence of Restoration Practices on Species Diversity

In different groups of the sample plots, the highest species richness was found for FG and the lowest for the reference ecosystem of BR. When comparing the different restoration practices with their respective reference ecosystems, we found that FG, RS, and BR showed significant effect on species richness of the communities. The increase in species richness was significant in the FG area (Table 2, p < 0.05), and the decrease was significant in the RS area (Table 2, p < 0.01).
The dGl showed similar changes in the communities among different groups as did species richness, but the changes were not significant (p > 0.05). As shown by the H’, the application of different restoration practices tended to decrease the species diversity of the communities, and significant decreases were found in the RS and BR areas (Table 2, p < 0.05). When comparing different restoration practices with their respective reference ecosystem groups, we found that community evenness (Pielou index, J) tended to decrease, and the most obvious decrease appeared in the RS and BR areas (p < 0.05). FG had the smallest influence on community evenness (p > 0.05).

3.5. Comparison of Different Effects of the Restoration Practices

All restoration practices contributed to the restoration of the above-ground community biomass. In particular, BR and FG resulted in significantly greater increases in the above-ground biomass of the communities compared with the remaining two restoration practices (Figure 5, p < 0.05). There were significant differences in the influence of various restoration practices on the below-ground biomass of the communities. Both FG and RS tended to increase the below-ground biomass of the communities, and the increase was significant for FG (58%, p < 0.05). By contrast, SW and BR tended to decrease the below-ground biomass of the communities, and the decrease was significant for BR (49%, p < 0.05). FG significantly increased the total biomass of the communities (87%, p < 0.05), whereas BR significantly decreased it (29%, p < 0.05). RS and SW increased the total biomass of the communities, but the increase was not significant (p > 0.05).
BR significantly increased the species richness of the communities, whereas RS significantly decreased it (Table 2), but there was no significant difference between different restoration practices (Figure 6, p > 0.05). The restoration practices had no significant influence on the dGl of the communities, and the influence of various restoration practices did not significantly differ (p > 0.05). Different restoration practices had similar influences on the H’ and the J index of the communities, which both tended to decrease. In particular, RS had the greatest influence on the H’ of the communities with an average decrease of 35%, and this influence was significantly greater than those of SW and FG. BR had the greatest influence on the J with an average decrease of 37%, and there was a significant difference compared with the influence by SW and FG (p < 0.05).

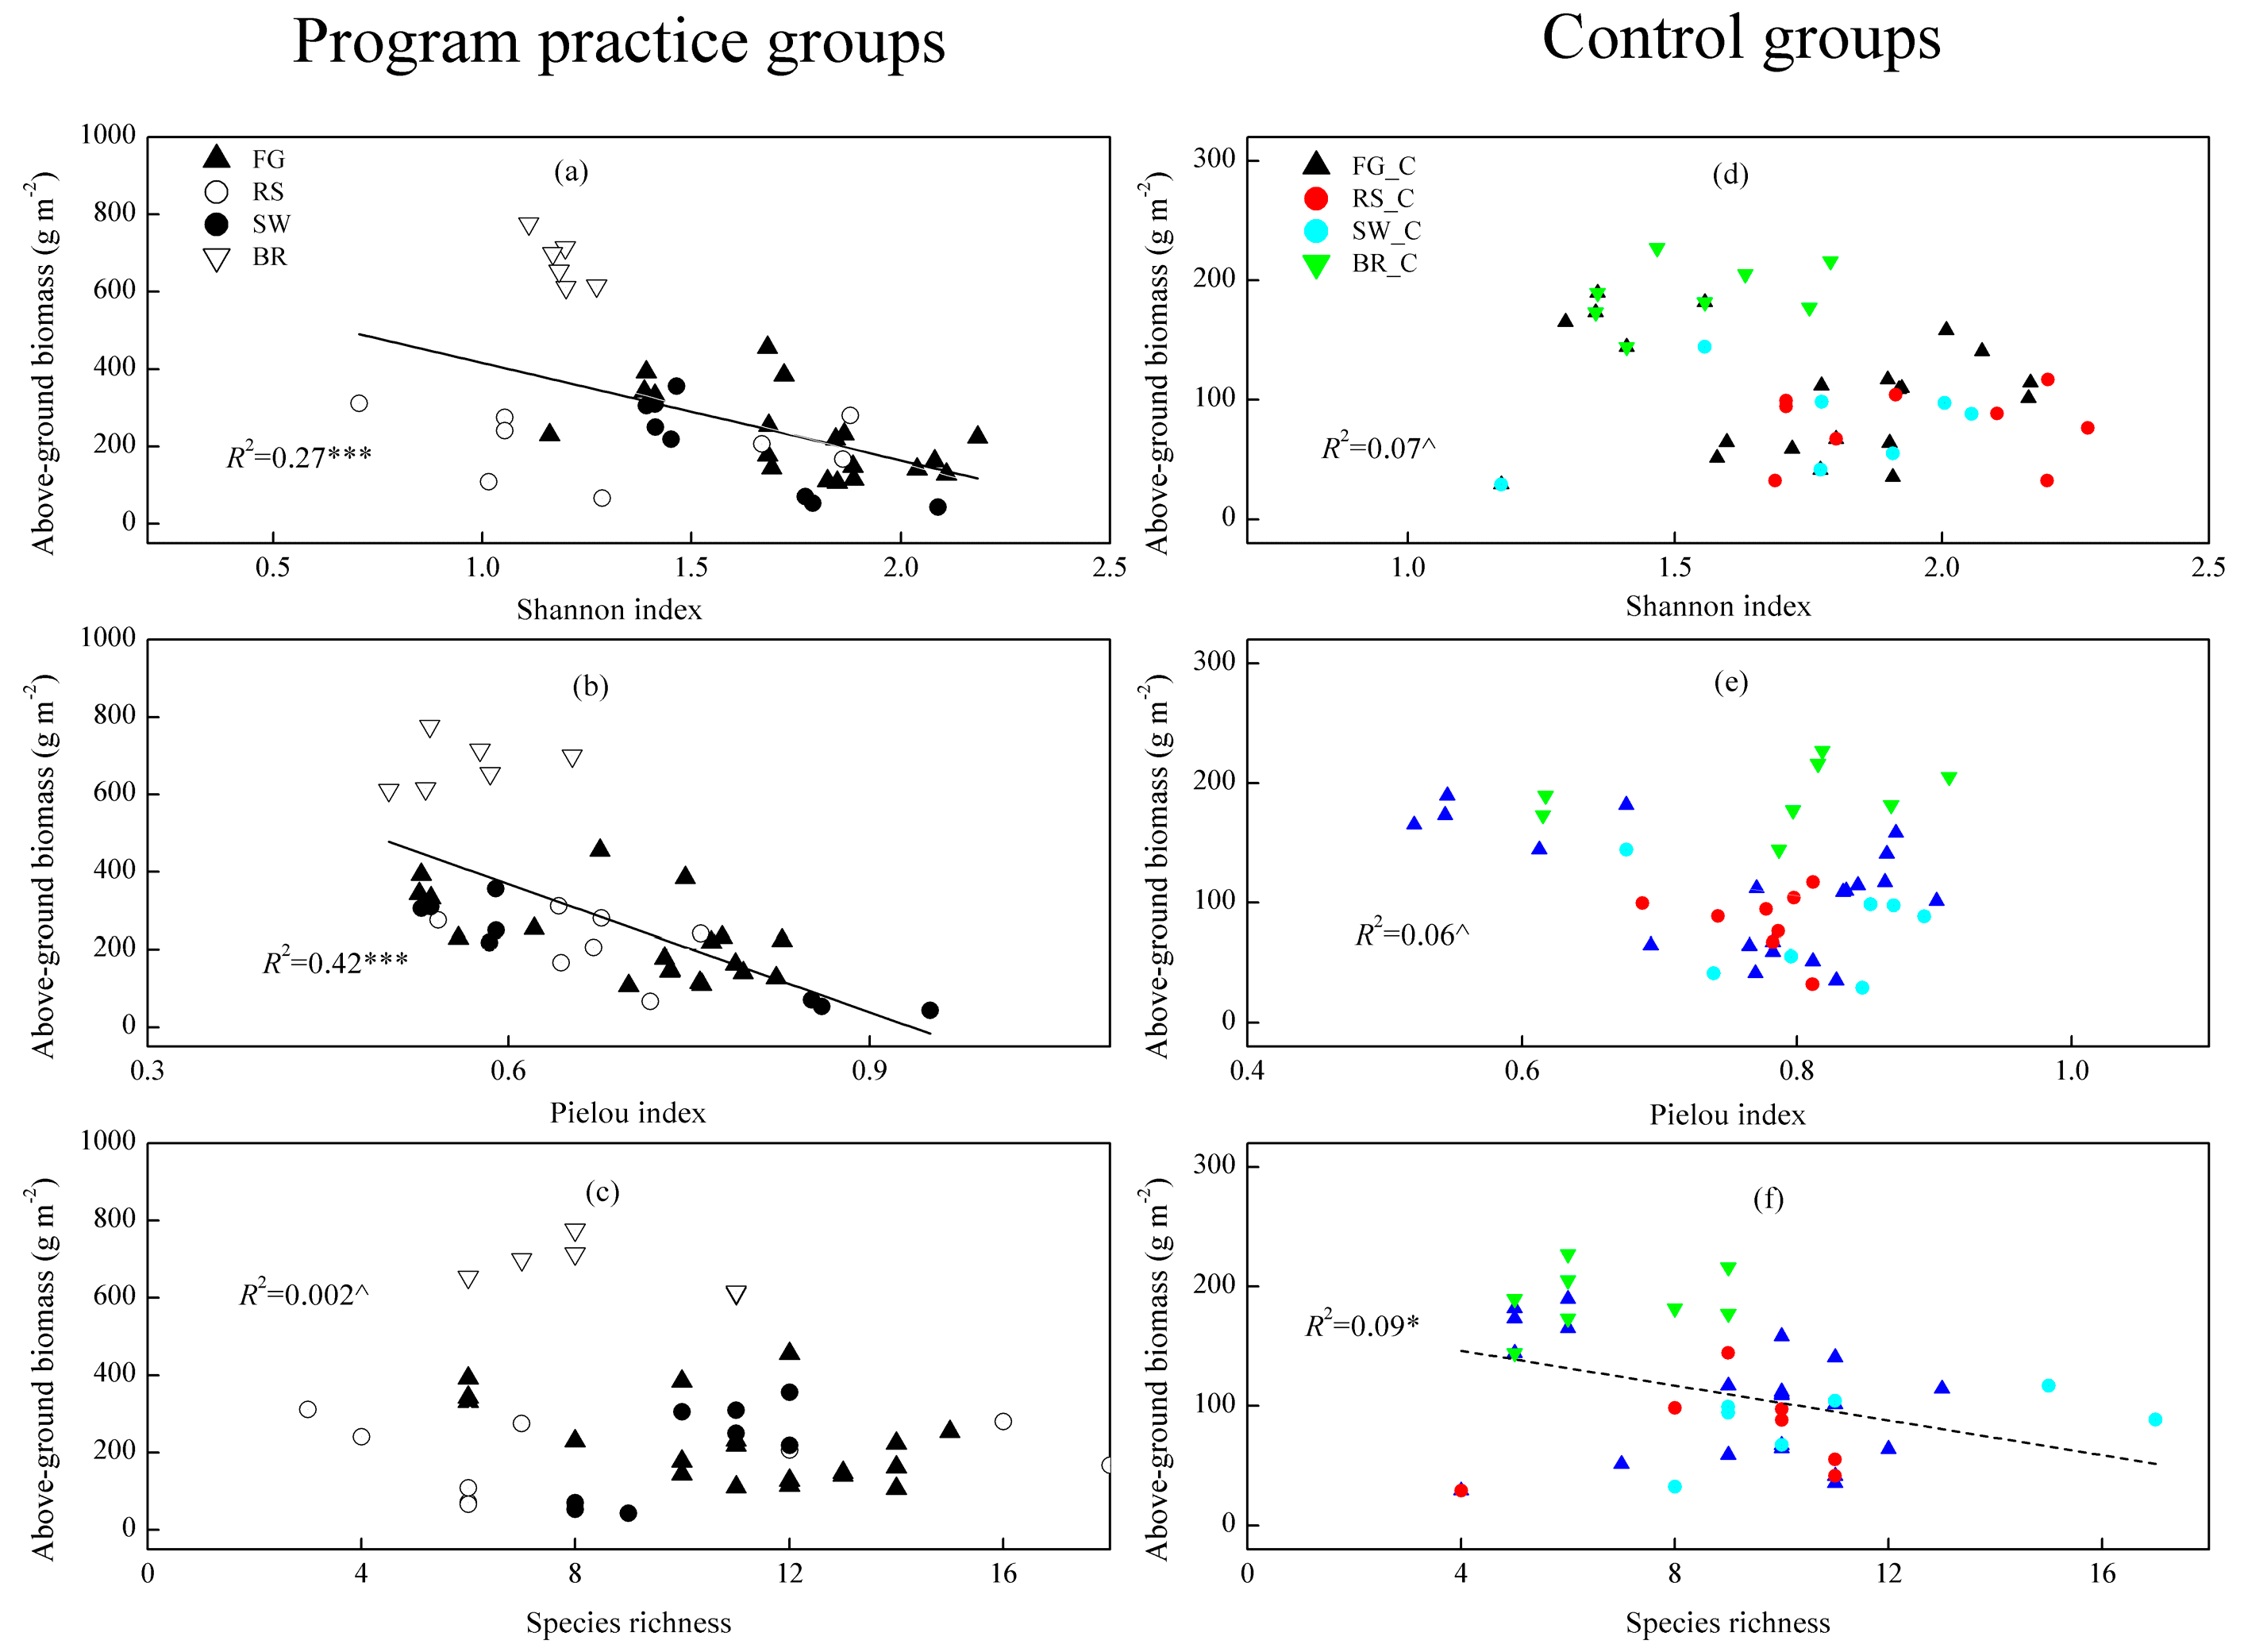
3.6. Relationship between Grassland Biomass and Diversity Inside and Outside the Implementation Areas of the Restoration Practices

The results of the correlation analysis showed that in the project implementation areas, the Shannon–Wiener diversity index had a significant negative correlation with the above-ground biomass of grassland communities after restoration (Figure 7a, p < 0.001). However, these two variables had no significant correlation in the free-grazing reference areas (Figure 7d). Additionally, in the project implementation areas, the Pielou evenness index had a significant negative correlation with the above-ground biomass (Figure 7b, p < 0.001). The Pielou index could explain 42% of variation in the above-ground biomass, which was higher than the 27% explained by the Shannon–Wiener diversity index. No significant correlation was found between the change of species richness and the above-ground biomass within these areas (Figure 7c). In the reference areas, neither the Shannon–Wiener index, nor the Pielou index was significantly correlated with above-ground biomass (Figure 7e). There was a weak but significant negative correlation between species richness and above-ground biomass in the reference areas (Figure 7f, p < 0.05).

4. Discussion

4.1. Influence of Restoration Practices on Plant Community Characteristics and Species Composition

Changes in land use and management practices directly influence the vegetation cover and community composition [23]. The restoration practices of ecological projects focus on a series of land management practices aimed at restoration [24,25]. The resulting changes in vegetation are often observed as alterations in plant communities, including succession in species composition and community structure, biodiversity, and productivity changes. In the present study, all four different restoration practices increased the coverage of grassland vegetation (30–52%). The most visible increase occurred in FG, 52% (Table 1). These trends were consistent with the increasing trend observed by Wu et al. [1] using remote sensing methods, although the increase observed in our study was larger than the 11.8% reported in their study. This difference can be attributed to the fact that the practices-applied areas and non-practices-applied area in the whole project area were hard to accurately identify and, therefore, separate in the remote sensing study, while the restoration of the practices-applied area was the major contributor to the increase in vegetation cover over the whole area. Previous research has attributed 80% of the vegetation productivity increase in the restoration area to human activities [26], especially the effects of large-scale ecological restoration projects. This conclusion was verified in our results, where we observed that different restoration practices markedly increased the community height of vegetation (Table 1). The accumulation of biomass was mainly attributed to the decrease in livestock pressure, which was directly reflected by the increase in the average height and cover of vegetation. These changes would consequently help maintain the surface soil against potential wind and water erosion in these fragile regional ecosystems. Moreover, these changes may facilitate the establishment and restoration of regional vegetation carbon stocks, which will help mitigate climate change through their influence on the carbon cycle.
When comparing the restoration practices of FG, RS, and SW with their respective reference areas (Table 1), the constructive species in the communities shifted from short plants to tall and large perennial herbs. This phenomenon might be driven by two factors. L. chinensis had higher palatability and nutritive value than forbs with pungent odors, such as P. chinensis [27]. The grazing intensity was higher in the reference areas than in the restored areas, so the decrease in grazing pressure promoted rapid restoration of these better forage species. Additionally, as the vegetation height and coverage were restored by these measures, the tall plants showed a competitive advantage for light over shorter species [15]. Their high-intensity shadowing effect could suppress and limit the growth of short species [13,15]. The reestablishment of the prevailing climax constructive species in the communities, which were all tall perennials of Poaceae which would maintain strong and deeper roots, would reduce soil erodibility in this area [28].

4.2. Different Influence of the Typical Restoration Practices on Productivity

Previous studies have suggested that the implementation of restoration projects in China has increased regional productivity [26,28] and biomass [1,29]. These conclusions are similar to studies assessing the effects of ecological projects implemented in the United States [10] and tropical areas [30]. However, most of these studies have only measured the obvious restoration in the above-ground parts of the restored area. It should be noted that the increase in above-ground biomass cannot accurately reflect the changes in biomass composition and quality caused by the changes in community species composition, nor does it reflect the changes in the below-ground biomass of steppe that commonly accounts for 90% of the total biomass of arid or semi-arid ecosystems [23].
Our results showed that, for the composition of plant families and genera, the most consistent and noticeable change was that all restoration practices improved the proportion of Poaceae biomass in the communities. The proportion of Cyperaceae plants tended to increase slightly, while the proportion of Leguminosae, Asteraceae, and forb biomass showed a decreasing trend (Figure 3a). Restoration practices can improve the importance of prevailing constructive species in the community and tend to reestablish typical climax in restored communities. This change led to an increase in the proportion of edible and excellent forage grass in the community, which largely contributed to the recovery of degraded grassland in forage grass production performance. Additionally, both FG and RS tended to increase the proportion of C3 plant biomass in the communities (Figure 3b) while decreasing the proportion of C4 plants, which are generally considered to be species with higher water use efficiency and greater drought tolerance in grasslands [18]. Hence, implementation of the restoration practices may prompt the communities to evolve from xeric vegetation to a mesophytic one. In succession theory, the climax vegetation commonly is the most mesophytic community that can achieve under local environmental conditions [31]. Therefore, the occurrence of this change in restoration areas may reflect the restorative succession of community composition toward a more stabilized prevailing climax.
For the below ground biomass part, although all restoration practices markedly increased the above-ground biomass of the communities, their influence on the below-ground biomass was quite different. Both RS and FG tended to increase the below-ground biomass. However, in BR areas below-ground biomass significantly decreased (Figure 4 and Figure 5). Although previous studies focused more on the above-ground biomass, we found that the changes in the below-ground biomass, which were largely influenced by different restoration practices, were more important factors affecting the changes in the total community biomass. Our results showed that when below-ground biomass was taken into account, FG, RS, and SW still tended to increase the total biomass of the communities, and the increase was significant for FG only (Figure 5). By contrast, artificial grass-planting in the BR area significantly decreased the total community biomass (p < 0.05). This is mainly because the artificially planted forage grasses were mostly annuals, which led to great loss of the below-ground roots which in perennials accumulate for a long time in natural steppe ecosystems. Although it achieved the largest increase in the above-ground biomass among the four restoration practices (>2 times, Figure 2) and optimized the forage supply function of the grassland, BR might have a negative environmental impact with a reduction in the grassland’s carbon stocks and soil fixation function due to roots loss.

4.3. Influence of Implementing Restoration Practices on Plant Species Diversity

Species diversity and evenness levels reflect the stability and developmental stage of the communities to some extent [32]. Previous studies have suggested that short-term grazing prohibition not only increased the grass yield but also promoted the community species diversity [23], especially in degraded grasslands [33]. However, in the present study, although the above-ground biomass of the communities generally increased (Figure 2), the changes in diversity were more complex (Table 2, Figure 6). Despite inconsistent and non-significant changes in the Gleason index of the communities under different restoration practices, the Shannon-Wiener diversity index tended to decrease consistently with different restoration practices, and significant decreases were found in BR and RS (p < 0.05). Although the ecological project successfully restored the vegetation cover and above-ground productivity (Table 1, Figure 5) and helped restore the ecosystem’s important ecological functions such as fixing sand sources [28], supplying forage grass [1], and regulating carbon sinks [3], its influence on plant species diversity in the communities might not conform to the expectations of restoration.
There are several explanations for the phenomenon that the different practices commonly tended to decrease the species diversity index H’. These include the light competition hypothesis [15,34] and litter accumulation hypothesis [35] which have been widely discussed and used to explain diversity decline in nitrogen addition experiments. The restoration practices which reduce the pressure of grazing and trampling by livestock [29] result in those high and palatable forage grasses recovering rapidly in restored areas. These species, which have advantages in their height and coverage, shade other slow or low-growing species that are more tolerant to trampling and grazing (Table 1) by increasing the light competition in the community, thereby meeting the conditions of the light competition hypothesis. According to the theory, low-growing species will be severe inhibited in the light competition condition. With strong and persistent light competition, in high cover area even some of these species might disappear, thereby influencing the plant diversity of the community [36]. In addition, there was a rapid accumulation of litter in the communities, which might prevent the germination of some seeds and seedling growth. This effect was not conducive to annual herbs but favored perennial herbs, and partly explained the observed changes in the composition of plant functional groups (Figure 3c). Consequently, under the restoration practices of the BTSSC project, changes in the community regeneration process and species composition pattern would affect the relationship between the species diversity and community productivity.
The relatively high species diversity in the grazing areas also conformed to the intermediate disturbance hypothesis [37]. In the grazing areas, the litter accumulation was low, and the light capture opportunity were regulated by grazing and trampling. This condition is not only better for seed germination [38] but also helps light reach the understory of the community [39], alleviating light competition among species, and creating survival opportunities for low-growing species and new introductions, thus improving the species diversity of the communities.

4.4. Implementation of Restoration Practices Alters the Relationship between Above-Ground Biomass and Species Diversity in Grasslands

On a global scale, species diversity is considered to have a positive correlation with productivity [40], which supports the opinion that biodiversity helps maintain and enhance ecosystem services [17,28]. However, some more complicated but meaningful relationships were reported, significant unimodal relationships are found between richness and herbaceous cover in Mediterranean grasslands [36]. In addition, some regional research reported no obvious correlation between diversity and productivity [41], similar to our results (Figure 7d). These studies were mostly regional, and thus are criticized for not being representative of other areas. There were even negative correlations between species diversity and productivity reported in a series of nitrogen addition experiments [15,42] or in closely managed rangeland [41,43]. This situation is similar to our observed results in the restoration project area (Figure 7a, p < 0.001). The relationship between diversity and productivity showed contradictions and inconsistency among studies. We suggest that this might be influenced by two factors. First, the research scale. Larger scale (e.g., global) studies are more likely to find a positive correlation between biomass and diversity. By contrast, negative and non-correlated results are more frequently reported in studies on small spatial scales, especially where the study area does not cross ecosystems and is mostly conducted within similar vegetation type. This implies that the positive correlation between biodiversity and biomass or productivity is likely to result from the inherent property differences among various ecosystems at a large spatial scale. In other words, this positive trend may merely reflect that ecosystems with a higher productivity (such as rainforests) inherently maintain a higher diversity than a desert steppe or tundra of much lower productivity. We hypothesize that a different relationship pattern may exist between diversity and productivity on a smaller scale that only includes one ecosystem or vegetation type. Second, the magnitude of human disturbance that is involved is a factor. The addition of nitrogen fertilizers, the close maintenance and management of rangelands, or the implementation of restoration projects are all processes by which human intervention exerts an influence on grassland productivity. Human efforts to increase grassland productivity are often associated with loss of diversity, consequently resulting in the observation of a strong negative correlation between diversity and productivity.
We also found that the restorative attempt of the BTSSC project altered the relationship between biomass and diversity and grazing status: Before the practices applied, there was no correlation between them (Figure 7d), while after the practices, we found a significant negative correlation (Figure 7a). Based on previous research results and our survey data, we considered possible drivers. Since the application of the restoration practices, light competition has gradually strengthened in the restored communities [39], and the Matthew effect has appeared among species in the restoration area. Tall species with more biomass will capture more light resources and their community advantages will be increasingly strengthened, while low-growing species will be suppressed. In some high cover situations, the shadow effect may even decrease the species richness referred to in a previous case study [36]. Thus, the competitive balance of the communities will change, making the community evenness decline. Our results showed that the Pielou evenness index decreased by nearly 40% under specific measures (Figure 6, p < 0.05). In addition, the results showed that initially there was no significant correlation between the community evenness and biomass in the grazing areas (Figure 7e). However, with the application of restoration practices, the community biomass became significantly negatively correlated with evenness (Figure 7b). This result indicated that the better the community biomass was restored, the lower the community evenness was in restored areas. The Shannon–Wiener species diversity index is an index that combines species richness with species evenness [23,44]. Therefore, we believe that the substantial decrease in the evenness of community species caused by vegetation restoration in the restored areas was the primary reason for the significant negative correlation between H’ and biomass presented in the BTSSC implementation area.
Several limitations and weaknesses should be acknowledged when interpreting findings from this study. First, as this is a regional study and only temperate steppe biome is involved, the findings may not be generalizable to other biomes or across different biomes. Second, compared with manually controlled experiments, the measures applied in this project were roughly replicated among different sites, and the beginning of the measured application may have differed by months. All these flaws might have affected our findings. Finally, the insignificant correlations in this research may be attributed to our relatively small sample size, which also limits the generalization of our results.

5. Conclusions

The effect of four typical short-term applied practices of the BTSSC project were evaluated and compared. We found that all four different restoration practices tended to increase the vegetation coverage and height. Except SW, the increase of above-ground biomass among practices was significant, which would largely enhance the forage supply of the BTSSC region. However, with the below-ground biomass taken into consideration, only FG significantly increased the total biomass, while BR significantly decreased it. All four different restoration practices tended to decrease the evenness and Shannon–Wiener diversity index of communities. The decrease was significant with BR and RS practices. We also found that the restorative attempt of the BTSSC project altered the relationship between biomass and diversity and grazing status: Before the practices applied, there was no correlation between them, while after the practices, we found a significant negative correlation. With the positive effects of biomass and relatively slighter negative effects on species diversity, grazing exclusion would be a high priority practice for successful restoration in the BTSSC project.

Author Contributions

Y.L. analyzed data and wrote the article; H.Y. conducted the measurements; J.F. and Y.L. designed the study.

Acknowledgments

We thank Liangxia Zhang and Guoli Gong for their participation on partly of the survey work and Yi Chen and Yaxian Zhang for their help in figure revision. This research was jointly funded by State Key Technologies R&D Program (grant no. 2017YFC0506500) and the Natural Sciences Foundation of China (41601615). The authors are grateful to the anonymous reviewers and editor for their insightful and helpful comments to improve the manuscript.

Conflicts of Interest

The authors declare that there is no conflict of interests regarding the publication of this paper.

Abbreviations

Practices
FGfenced and grazing exclusion
RSseed replenishment
SWintegrated control of small watersheds
BRbasic ranch construction
Reference ecosystems
FG_Rreference ecosystems of fenced and grazing exclusion
RS_Rreference ecosystems of seed replenishment
SW_Rreference ecosystems of integrated control of small watersheds
BR_Rreference ecosystems of basic ranch construction
Species diversity indices
Sspecies richness
dGlGleason index
HShannon–Wiener index
JPielou evenness index
IVspecies importance value
Others
BTSSCBeijing–Tianjin Sand Source Control

Appendix A

Figure A1. A schematic of experimental design. FG, fenced and grazing exclusion; RS, seed replenishment; SW, integrated control of small watersheds; BR, basic ranch construction.
Sustainability 11 01941 g0a1

References

  1. Wu, Z.; Wu, J.; He, B.; Liu, J.; Wang, Q.; Zhang, H.; Liu, Y. Drought offset ecological restoration program-induced increase in vegetation activity in the Beijing-Tianjin Sand Source Region, China. Environ. Sci. Technol. 2014, 48, 12108–12117. [Google Scholar] [CrossRef] [PubMed]
  2. Török, P.; Ambarlı, D.; Kamp, J.; Wesche, K.; Dengler, J. Step (pe) up! Raising the profile of the Palaearctic natural grasslands. Biodivers. Conserv. 2016, 25, 2187–2195. [Google Scholar] [CrossRef]
  3. Zhang, L.; Cao, W.; Fan, J. Soil organic carbon dynamics in Xilingol grassland of northern China induced by the Beijing-Tianjin Sand Source Control Program. Front. Earth Sci. 2017, 11, 407–415. [Google Scholar] [CrossRef]
  4. Szewrański, S.; Świąder, M.; Kazak, J.K.; Katarzyna, T.D.; & Joost, V.H. Socio-environmental vulnerability mapping for environmental and flood resilience assessment: The case of ageing and poverty in the city of Wrocław, poland. Integr. Environ. Assess. Manag. 2018, 14, 592–597. [Google Scholar] [CrossRef] [PubMed]
  5. Ouyang, Z.Y.; Wang, Q.; Zhen, H. National Remote Sensing Survey and Assessment of Ecological and Environmental Change (2000–2010); Science press: Beijing, China, 2014. [Google Scholar]
  6. Bryan, B.A.; Gao, L.; Ye, Y.; Sun, X.; Connor, J.D.; Crossman, N.D.; Stafford-Smith, M.; Wu, J.; He, C.; Yu, D.; et al. China’s response to a national land-system sustainability emergency. Nature 2018, 559, 193–204. [Google Scholar] [CrossRef] [PubMed]
  7. Mausbach, M.J.; Dedrick, A.R. The length we go. J. Soil Water Conserv. 2004, 59, 96. [Google Scholar]
  8. Rodgers, R.D.; Hoffman, R.W. Prairie grouse population response to Conservation Reserve Program grasslands: An overview. In Proceedings of the Conservation Reserve Program National Conference, Planting for the Future, Fort Collins, CO, USA, 6–9 June 2004; pp. 120–128. [Google Scholar]
  9. Schroeder, M.A.; Vander Haegen, W.M. Response of greater sage-grouse to the Conservation Reserve Program in Washington State. Stud. Avian Biol. 2011, 38, 517–529. [Google Scholar]
  10. Brinson, M.M.; Eckles, S.D. US Department of Agriculture conservation program and practice effects on wetland ecosystem services: A synthesis. Ecol. Appl. 2011, 21, 116–127. [Google Scholar] [CrossRef]
  11. Fennessy, S.; Craft, C. Agricultural conservation practices increase wetland ecosystem services in the Glaciated Interior Plains. Ecol. Appl. 2011, 21, 46–64. [Google Scholar] [CrossRef]
  12. Zheng, H.; Robinson, B.E.; Liang, Y.-C.; Polasky, S.; Ma, D.-C.; Wang, F.-C.; Ruckelshaus, M.; Ouyang, Z.-Y.; Daily, G.C. Benefits, costs, and livelihood implications of a regional payment for ecosystem service program. Proc. Natl. Acad. Sci. USA 2013, 110, 16681–16686. [Google Scholar] [CrossRef] [Green Version]
  13. Li, Y.; Fan, J.; Hu, Z.; Shao, Q.; Harris, W. Comparison of evapotranspiration components and water-use efficiency among different land use patterns of temperate steppe in the Northern China pastoral-farming ecotone. Int. J. Biometeorol. 2016, 60, 827–841. [Google Scholar] [CrossRef] [PubMed]
  14. Li, Y.; Fan, J.; Hu, Z. Comparison of Carbon-Use Efficiency Among Different Land-Use Patterns of the Temperate Steppe in the Northern China Pastoral Farming Ecotone. Sustainability 2018, 10, 487. [Google Scholar] [CrossRef]
  15. Zhao, J.; Li, W.; Jin, G.H. Responces of species diversity and aboveground biomass to nitrogen addition in fenced and grazed grassland on the Loess Plateau. Acta Prataculturae Sin. 2017, 26, 54–64. [Google Scholar]
  16. Liu, J.; Li, S.; Ouyang, Z.; Tam, C.; Chen, X. Ecological and socioeconomic effects of China’s policies for ecosystem services. Proc. Natl. Acad. Sci. USA 2008, 105, 9477–9482. [Google Scholar] [CrossRef]
  17. Ouyang, Z.; Zheng, H.; Xiao, Y.; Polasky, S.; Liu, J.; Xu, W.; Wang, Q.; Zhang, L.; Xiao, Y.; Rao, E. Improvements in ecosystem services from investments in natural capital. Science 2016, 352, 1455–1459. [Google Scholar] [CrossRef] [PubMed]
  18. Li, Y.; Fan, J.; Hu, Z.; Shao, Q.; Zhang, L.; Yu, H. Influence of land use patterns on evapotranspiration and its components in a temperate grassland ecosystem. Adv. Meteorol. 2015, 2015, 1–12. [Google Scholar] [CrossRef]
  19. Zhao, W.; Hu, Z.; Li, S.; Guo, Q.; Liu, Z.; Zhang, L. Comparison of surface energy budgets and feedbacks to microclimate among different land use types in an agro-pastoral ecotone of northern China. Sci. Total Environ. 2017, 599–600, 891–898. [Google Scholar] [CrossRef] [PubMed]
  20. Zhang, Q.Y.; Wu, S.H.; Zhao, D.S. Temporal-spatial Changes in Inner Mongolian Grassland Degradation during Past Three Decades. Agric. Sci. Technol. 2013, 4, 676–683. [Google Scholar]
  21. Pan, X.; Xu, L.; Yang, Z.; Yu, B. Payments for Ecosystem Services in China: Policy, practice, and progress. Ecosyst. Serv. 2017, 21, 109–119. [Google Scholar] [CrossRef]
  22. Shi, S.; Zou, X.Y.; Zhang, C.L. Investigation of vegetation restoration in the area of Beijing and Tianjin sand storm source control project. Sci. Soil Water Conserv. 2009, 7, 86–92. [Google Scholar]
  23. Li, Y.Z.; Fan, J.W.; Zhang, L.X. The impact of different land use and management on community composition, species diversity and productivity in a typical temperate grassland. Acta Prataculturae Sin. 2013, 22, 1–10. [Google Scholar]
  24. Deng, X.; Zhao, C.; Yan, H. Systematic Modeling of Impacts of Land Use and Land Cover Changes on Regional Climate: A Review. Adv. Meteorol. 2013, 2013, 1375–1383. [Google Scholar] [CrossRef]
  25. Li, X. A review of the international researches on land use/land cover change. Acta Geogr. Sin. 1996, 6, 553–558. [Google Scholar]
  26. Mu, S.; Zhou, S.; Chen, Y.; Li, J.; Ju, W.; Odeh, I. Assessing the impact of restoration-induced land conversion and management alternatives on net primary productivity in Inner Mongolian grassland, China. Glob. Planet. Chang. 2013, 108, 29–41. [Google Scholar] [CrossRef]
  27. Chen, S.; Chen, J.; Lin, G.; Zhang, W.; Miao, H.; Wei, L.; Huang, J.; Han, X. Energy balance and partition in Inner Mongolia steppe ecosystems with different land use types. Agric. For. Meteorol. 2009, 149, 1800–1809. [Google Scholar] [CrossRef]
  28. Zhang, H.; Fan, J.; Cao, W.; Zhong, H.; Harris, W.; Gong, G.; Zhang, Y. Changes in multiple ecosystem services between 2000 and 2013 and their driving factors in the Grazing Withdrawal Program, China. Ecol. Eng. 2018, 116, 67–79. [Google Scholar] [CrossRef]
  29. Zhang, L.; Fan, J.; Zhou, D.; Zhang, H. Ecological Protection and Restoration Program Reduced Grazing Pressure in the Three-River Headwaters Region, China. Rangel. Ecol. Manag. 2017, 70, 540–548. [Google Scholar] [CrossRef]
  30. Börner, J.; Baylis, K.; Corbera, E.; Ezzine-de-Blas, D.; Ferraro, P.J.; Honey-Rosés, J.; Lapeyre, R.; Persson, U.M.; Wunder, S. Emerging Evidence on the Effectiveness of Tropical Forest Conservation. Available online: https://journals.plos.org/plosone/article?id=10.1371/journal.pone.0159152 (accessed on 1 April 2019).
  31. Zeng, Q.; An, S.; Liu, Y. Soil bacterial community response to vegetation succession after fencing in the grassland of China. Sci. Total Environ. 2017, 609, 2–10. [Google Scholar] [CrossRef] [PubMed]
  32. Wang, S.P.; Li, Y.H. Influence of different stocking rates on plant diversity of Artemisia frigida community in Inner Mongolia steppe. Acta Bot. Sin. 2001, 43, 89–96. [Google Scholar]
  33. Wiesmair, M.; Otte, A.; Waldhardt, R. Relationships between plant diversity, vegetation cover, and site conditions: Implications for grassland conservation in the Greater Caucasus. Biodivers. Conserv. 2016, 26, 1–19. [Google Scholar] [CrossRef]
  34. Demalach, N.; Kadmon, R. Light competition explains diversity decline better than niche dimensionality. Funct. Ecol. 2017, 31, 1834–1838. [Google Scholar] [CrossRef]
  35. Mariotte, P.; Spotswood, E.N.; Farrer, E.C.; Suding, K.N. Positive litter feedbacks of an introduced species reduce native diversity and promote invasion in Californian grasslands. Appl. Veg. Sci. 2017, 20, 28–39. [Google Scholar] [CrossRef]
  36. Casado, M.A.; Castro, I.; Ramírez-Sanz, L.; Costa-Tenorio, M.; De Miguel, J.M.; Pineda, F.D. Herbaceous plant richness and vegetation cover in Mediterranean grasslands and shrublands. Plant. Ecol. 2004, 170, 83–91. [Google Scholar] [CrossRef]
  37. Pausas, J.G.; Ribeiro, E. Fire and plant diversity at the global scale. Glob. Ecol. Biogeogr. 2017, 26, 889–897. [Google Scholar] [CrossRef]
  38. Valkó, O.; Kelemen, A.; Miglécz, T.; Török, P.; Deák, B.; Tóth, K.; Tóth, J.P.; Tóthmérész, B. Litter removal does not compensate detrimental fire effects on biodiversity in regularly burned semi-natural grasslands. Sci. Total Environ. 2018, 622–623, 783–789. [Google Scholar]
  39. Zhang, L.; Hu, Z.; Fan, J.; Zhou, D.; Tang, F. A meta-analysis of the canopy light extinction coefficient in terrestrial ecosystems. Front. Earth Sci. 2014, 8, 599–609. [Google Scholar] [CrossRef]
  40. Duffy, J.E.; Godwin, C.M.; Cardinale, B.J. Biodiversity effects in the wild are common and as strong as key drivers of productivity. Nature 2017, 549, 261. [Google Scholar] [CrossRef]
  41. Kemp, D.; King, W.M.; Gilmour, A.; Lodge, G.; Murphy, S.; Quigley, P.; Sanford, P.; Andrew, M. SGS Biodiversity Theme: Impact of plant biodiversity on the productivity and stability of grazing systems across southern Australia. Aust. J. Exp. Agric. 2003, 43, 961–975. [Google Scholar] [CrossRef]
  42. Humbert, J.Y.; Dwyer, J.M.; Andrey, A.; Arlettaz, R. Impacts of nitrogen addition on plant biodiversity in mountain grasslands depend on dose, application duration and climate: A systematic review. Glob. Chang. Biol. 2016, 22, 110–120. [Google Scholar] [CrossRef]
  43. Kemp, D.R.; Guodong, H.; Xiangyang, H.; Michalk, D.L.; Fujiang, H.; Jianping, W.; Yingjun, Z. Innovative grassland management systems for environmental and livelihood benefits. Proc. Natl. Acad. Sci. USA 2013, 110, 8369–8374. [Google Scholar] [CrossRef] [PubMed] [Green Version]
  44. Demalach, N.; Zaady, E.; Kadmon, R. Light asymmetry explains the effect of nutrient enrichment on grassland diversity. Ecol. Lett. 2017, 20, 60–69. [Google Scholar] [CrossRef] [PubMed]
Figure 1. Study area and distribution of survey sites. FG, fenced and grazing exclusion; FG_R, the reference ecosystems of FG; RS, seed replenishment; RS_R, the reference ecosystems of RS; SW, integrated control of small watersheds; SW_R, the reference ecosystems of SW; BR, basic ranch construction; BR_R, the reference ecosystems of BR.
Sustainability 11 01941 g001
Figure 2. Above-ground biomass in different restoration practices and their reference ecosystems. The values represent the mean values (mean ± 1SE) of each practices or their reference groups. The results of Paired T-test was presented as ^ p ≥ 0.05; * p < 0.05; ** p < 0.01; *** p < 0.001. FG, fenced and grazing exclusion; RS, seed replenishment; SW, integrated control of small watersheds; and BR, basic ranch construction. The same below.
Sustainability 11 01941 g002
Figure 3. Plant functional group compositions of above-ground biomass in different restoration practices and their reference ecosystems. (a) Composition of plant families, (b) composition of C3 and C4 plants, (c) plant life forms.
Sustainability 11 01941 g003
Figure 4. Below-ground biomass in different restoration practices and their reference ecosystems (a), and the composition of below-ground biomass at three depth layers (b). The values represent the mean values of below-ground biomass (a, mean ± 1SE) of each practices or their reference groups. The results of Paired T-test is presented as ^ p ≥ 0.05; * p < 0.05; ** p < 0.01; *** p < 0.001.
Sustainability 11 01941 g004
Figure 5. The effect of different restoration practices on total, above-ground and below-ground biomass. Mean ± 1 SE. The results of Paired T-test (Practices and its reference group) was presented as * p < 0.05. The results of LMEM were also presented, different letters in same group indicate statistical difference at p < 0.05 level. The same below.
Sustainability 11 01941 g005
Figure 6. Effect of different restoration practices on plant community species diversity.
Sustainability 11 01941 g006
Figure 7. Relationship between biodiversity index and above-ground biomass among restoration practices and their reference ecosystems. (a) Shannon index in program practice groups, (b) pielou index in program practice groups, (c) species richness in program practice groups, (d) shannon index in control groups, (e) pielou index in control groups, (f) species richness in control groups. * p < 0.05; ** p < 0.01; *** p < 0.001; ^ p > 0.05.
Sustainability 11 01941 g007
Table 1. Community characteristics and dominant species in different grassland restoration types.
Land Manage TypeSites/PlotsCover (%)Height (cm)Species Composition (Constructive Species and Dominant Species)
FG6/1873.1 ± 5.5 abc32.3 ± 3.2 bLeymus chinensis *, Stipa grandis *, S. sareptana var. krylovii *, C. squarrosa, Kochia prostrata, Allium tenuissimum, Salsola collina
FG_R6/1848.2 ± 2.3 d12.9 ± 1.2 cS. sareptana var. krylovii *, Agropyron cristatum *, Artemisia frigida *, C. squarrosa *, L. chinensis, S. grandis, Salsola collina
RS3/983.3 ± 7.7 ab32.8 ± 3.9 bL. chinensis *, Achnatherum sibiricum *, S. sareptana var. krylovii, A. cristatum, Carex sp.
RS_R3/958.9 ± 7.7 bcd11.6 ± 1.5 cS. sareptana var. krylovii *, C. squarrosa *, Thymus mongolicus *, L. chinensis, Carex sp.
SW3/676.7 ± 7.5 abc22.1 ± 3.6 bcL. chinensis *, Allium polyrhizum *, Neopallasia pectinata, Astragalus laxmannii, Potentilla bifurca, Salsola sp., Carex sp., Al. tenuissimum
SW_R3/651.7 ± 3.8 cd7.0 ± 1.6 cS. sareptana var. krylovii *, P. bifurca *, N. pectinata, Astragalus scaberrimus, L. chinensis, Ar. frigida
BR2/698.6 ± 1.3 a82.5 ± 1.44 a Avena sativa *, Setaria sp., Panicum miliaceum, P. bifurca *
BR_R2/675.0 ± 3.5 abc19.8 ± 0.63 bcL. chinensis *, Carex sp., S. sareptana var. krylovii, A. cristatum
The dominant species in sites were marked with *. The first three species of IV in each community were presented; cover and average height: Mean ± 1SE. The results of LMEM were presented, different letters in the same column indicate statistical difference at p < 0.05 level. FG, fenced and grazing exclusion; FG_R, the reference ecosystems of FG; RS, seed replenishment; RS_R, the reference ecosystems of RS; SW, integrated control of small watersheds; SW_R, the reference ecosystems of SW; BR, basic ranch construction; BR_R, the reference ecosystems of BR. The same below.
Table 2. Community species diversity in different restoration practices and their reference ecosystems.
Land Use TypeFGFG_RRSRS_RSWSW_RBRBR_R
Species richness S11.6 ± 0.4 *10.0 ± 0.58.6 ± 1.7 **10.7 ± 1.210.0 ± 0.8 ^9.0 ± 1.9.5 ± 0.8 *7.5 ± 0.8
Gleason index dGl7.7 ± 0.7 ^7.2 ± 0.611.4 ± 3.4 ^13.1 ± 4.713.7 ± 2.4 ^8.9 ± 1.56.8 ± 0.7 ^6.2 ± 1.3
Shannon-Wiener index H1.82 ± 0.06 ^1.84 ± 0.061.28 ± 0.14 ***1.95 ± 0.081.66 ± 0.11 ^1.78 ± 0.131.19± 0.03 *1.66 ± 0.07
Pielou index J0.74 ± 0.02 ^0.79 ± 0.020.64 ± 0.02bc **0.78 ± 0.040.74 ± 0.07 ^0.83 ± 0.020.53 ± 0.02 **0.84 ± 0.03
Mean ± 1SE. The results of Paired T-test (Practices and its reference group) was presented as ^ p ≥ 0.05; * p < 0.05; ** p < 0.01; *** p < 0.001.

