Article

Cropland Use Transitions and Their Driving Factors in Poverty-Stricken Counties of Western Hubei Province, China

1
School of Public Administration, China University of Geosciences, Wuhan 430074, China
2
School of Geography and Information Engineering, China University of Geosciences, Wuhan 430074, China
*
Author to whom correspondence should be addressed.
Sustainability 2019, 11(7), 1997; https://doi.org/10.3390/su11071997
Submission received: 25 February 2019 / Revised: 19 March 2019 / Accepted: 29 March 2019 / Published: 4 April 2019

Abstract

:
Agriculture is important for economic development in most poverty-stricken areas in China, but cropland use is facing challenges due to rapid industrialization and urbanization, causing serious issues for poverty alleviation and sustainable socioeconomic development. Cropland Use Transition (CUT) is one way to alleviate poverty and develop the economy in poverty-stricken areas. This paper chose 16 typical poverty-stricken counties in Western Hubei province as the case area. A morphology index system was established to evaluate CUT, and geographic information system software was used to analyze the temporal-spatial variations in CUT. Using the Radial Basis Function Neural Network (RBFNN) model, contributions of driving factors of population, economy, and industrial structure to CUT were analyzed. The results show that: (1) cropland use morphology can be divided into functional morphology and spatial morphology; (2) the spatial distribution of CUT was high in the north and low in the south, the temporal variation of CUT from 1995 to 2013 showed fluctuations, and the coefficient of CUT changed from 0.460 to 0.649 with a growth rate of 41%; (3) for the driving factors, population factors most significantly contributed to CUT, followed by industrial structure and economic factors. The results obtained in this study are in line with the findings of previous studies. The RBFNN model is suitable for evaluating the contributions of driving factors, which can solve the deficiency in previous studies caused by ignoring the internal relationship and target orientation of driving factors. This study suggests that poverty-stricken counties should narrow the urban–rural divide, encourage balanced labor and investment flow into cropland by formulating relevant economic policies, motivate farmers’ agricultural engagement, and use science and technology to promote CUT and the growth of the agricultural economy, poverty alleviation, and to coordinate urban–rural development.

1. Introduction

The social-economic level in poverty-stricken areas of China has significantly improved with the rapid development of industrialization, urbanization, and socioeconomic transition. However, a series of problems have arisen in poverty-stricken areas, such as large areas of cropland being abandoned, occupied by non-agricultural construction, and degraded due to the emigration of a large number of young laborers to modern cities [1,2]. Due to sterile soil and complex topographic and geographic conditions, the use of cropland is relevant for poverty alleviation and sustainable socioeconomic development [3], which promote the rapid transition of cropland use.
Extant related research of cropland use has focused on changes in quantity [4], quality [5], and productivity [6]. In terms of research scale, most studies have concentrated on the macro [7] and middle scale [8]. Previously, 3S (geographic information system (GIS), global positioning system (GPS), remote sensing (RS)) technology, mathematical models [9], multivariate statistical index [10], and other related methods [11] have been used to study these changes. The driving factors of cropland use change mainly include resident population [12], environmental factors [13], regional biodiversity [14], and technological [15] and socioeconomic [16] factors. The methods of regression analysis [17], neural network [18], and panel data [19] have been used to calculate the impact of driving factors on cropland use change. For the spatial-temporal evolution of cropland, three-dimensional (3D) kernel density [20], spatial auto correlation [21], and land use dynamic degree [22] have been used to analyze the temporal evolution and regional spatial distribution of cultivated land use. Scholars have conducted considerable research on the change of cropland use, providing many results, with various research methods, content, and scale, contributing to the sustainable and effective use of cropland. Cropland use change is also related to food security [23], farmland productivity [24], socioeconomic development [25,26], urbanization [27], and ecosystem services [28]. Due to the practical connection with poverty alleviation and sustainable socioeconomic development, the study of Cropland Use Transition (CUT) is receiving more attention, being widely practiced to meet the demands of the social economy.
CUT has been inspired by the forest transition hypothesis and land use transition theory, mainly focusing on pathways of development [29], transition mechanisms [30], driving forces [31], spatial characteristics and influencing factors [32], spatial and temporal coupling characteristics [33], and functional transition [34]. At the core of CUT research, its definition has received extensive attention and been discussed. CUT has been defined as the change in cropland use morphology over the years [35], or the process of the changing trend in cropland use morphology [29], or the change of cropland use from morphology to another [36]. Regardless of the connotation of CUT, cropland use morphology is the key concept. The change in cropland morphology is directly related with the production, living, and ecological functions of cropland affecting economic and social stability.
No consensus, however, has been reached on the meaning of cropland use morphology in poverty-stricken areas, where it is difficult to measure the transition and sustainable use of cropland. Research on cropland use in poverty-stricken areas has mainly focused on cropland abandonment [37], which is an important factor that affects cropland use morphology change. Many studies have examined the relationship between marginalization and abandonment [38], drivers of cropland abandonment [39], the spatial distribution of abandoned land [40], influencing factors [41], and related policy designs [42]. The existing studies mainly focused on developed areas, such as the United States [43], Japan [44], Latin America [45], and especially Europe [40], where cropland abandonment is widespread. The causes of cropland abandonment have been revealed from the plot level [46] and farmer level [47]; cropland marginalization is thought to be the root cause [48], rising labor costs and transfer of agricultural labor are the main causes [47], and urbanization and industrialization are the main driving forces [49] of CUT. These studies provided valuable references for the research of cropland morphology and CUT in poverty-stricken areas from the perspectives of mechanism, causes, and policy.
China is a developing country, but cropland use is facing similar problems as developed countries have faced in recent years, especially in poverty-stricken areas and mountainous areas, presenting a huge obstacle to the Chinese strategy of rural vitalization and building a moderately prosperous society. Combined with the analysis above, the contents of cropland use morphology, temporal-spatial variations, and the contributions of driving factors that affect CUT need to be analyzed to clearly define the specific content of cropland use morphology in poverty-stricken areas, and scientifically measure the contributions of driving factors. These studies would not only provide scientific reference for cropland use, but also provide a partial solution for poverty alleviation, which is a major global social problem affecting the economic prosperity in China and around the world, and social harmony and stability.
This paper chose the poverty-stricken counties in Western Hubei province as a case study, as it is a typical poverty-stricken and underdeveloped area in China, which is experiencing problems with cropland use, including poor endowment of land resources, lack of application of technology, and a significant wasteland, which seriously threaten poverty alleviation and impede the sustainability of agriculture. Thus, there is an urgent need to resolve the challenges in cropland use while facilitating economic development and poverty alleviation. The aims of our study were to (1) identify the morphology of cropland in poverty-stricken counties and analyze the temporal-spatial characteristics of CUT of Western Hubei province and (2) identify the driving factors of CUT and analyze the contributions of each factor. The results of this research were used to provide suggestions for cropland and agricultural sustainability in poverty-stricken counties, serving as a scientific reference point for poverty alleviation.

2. Materials and Methods
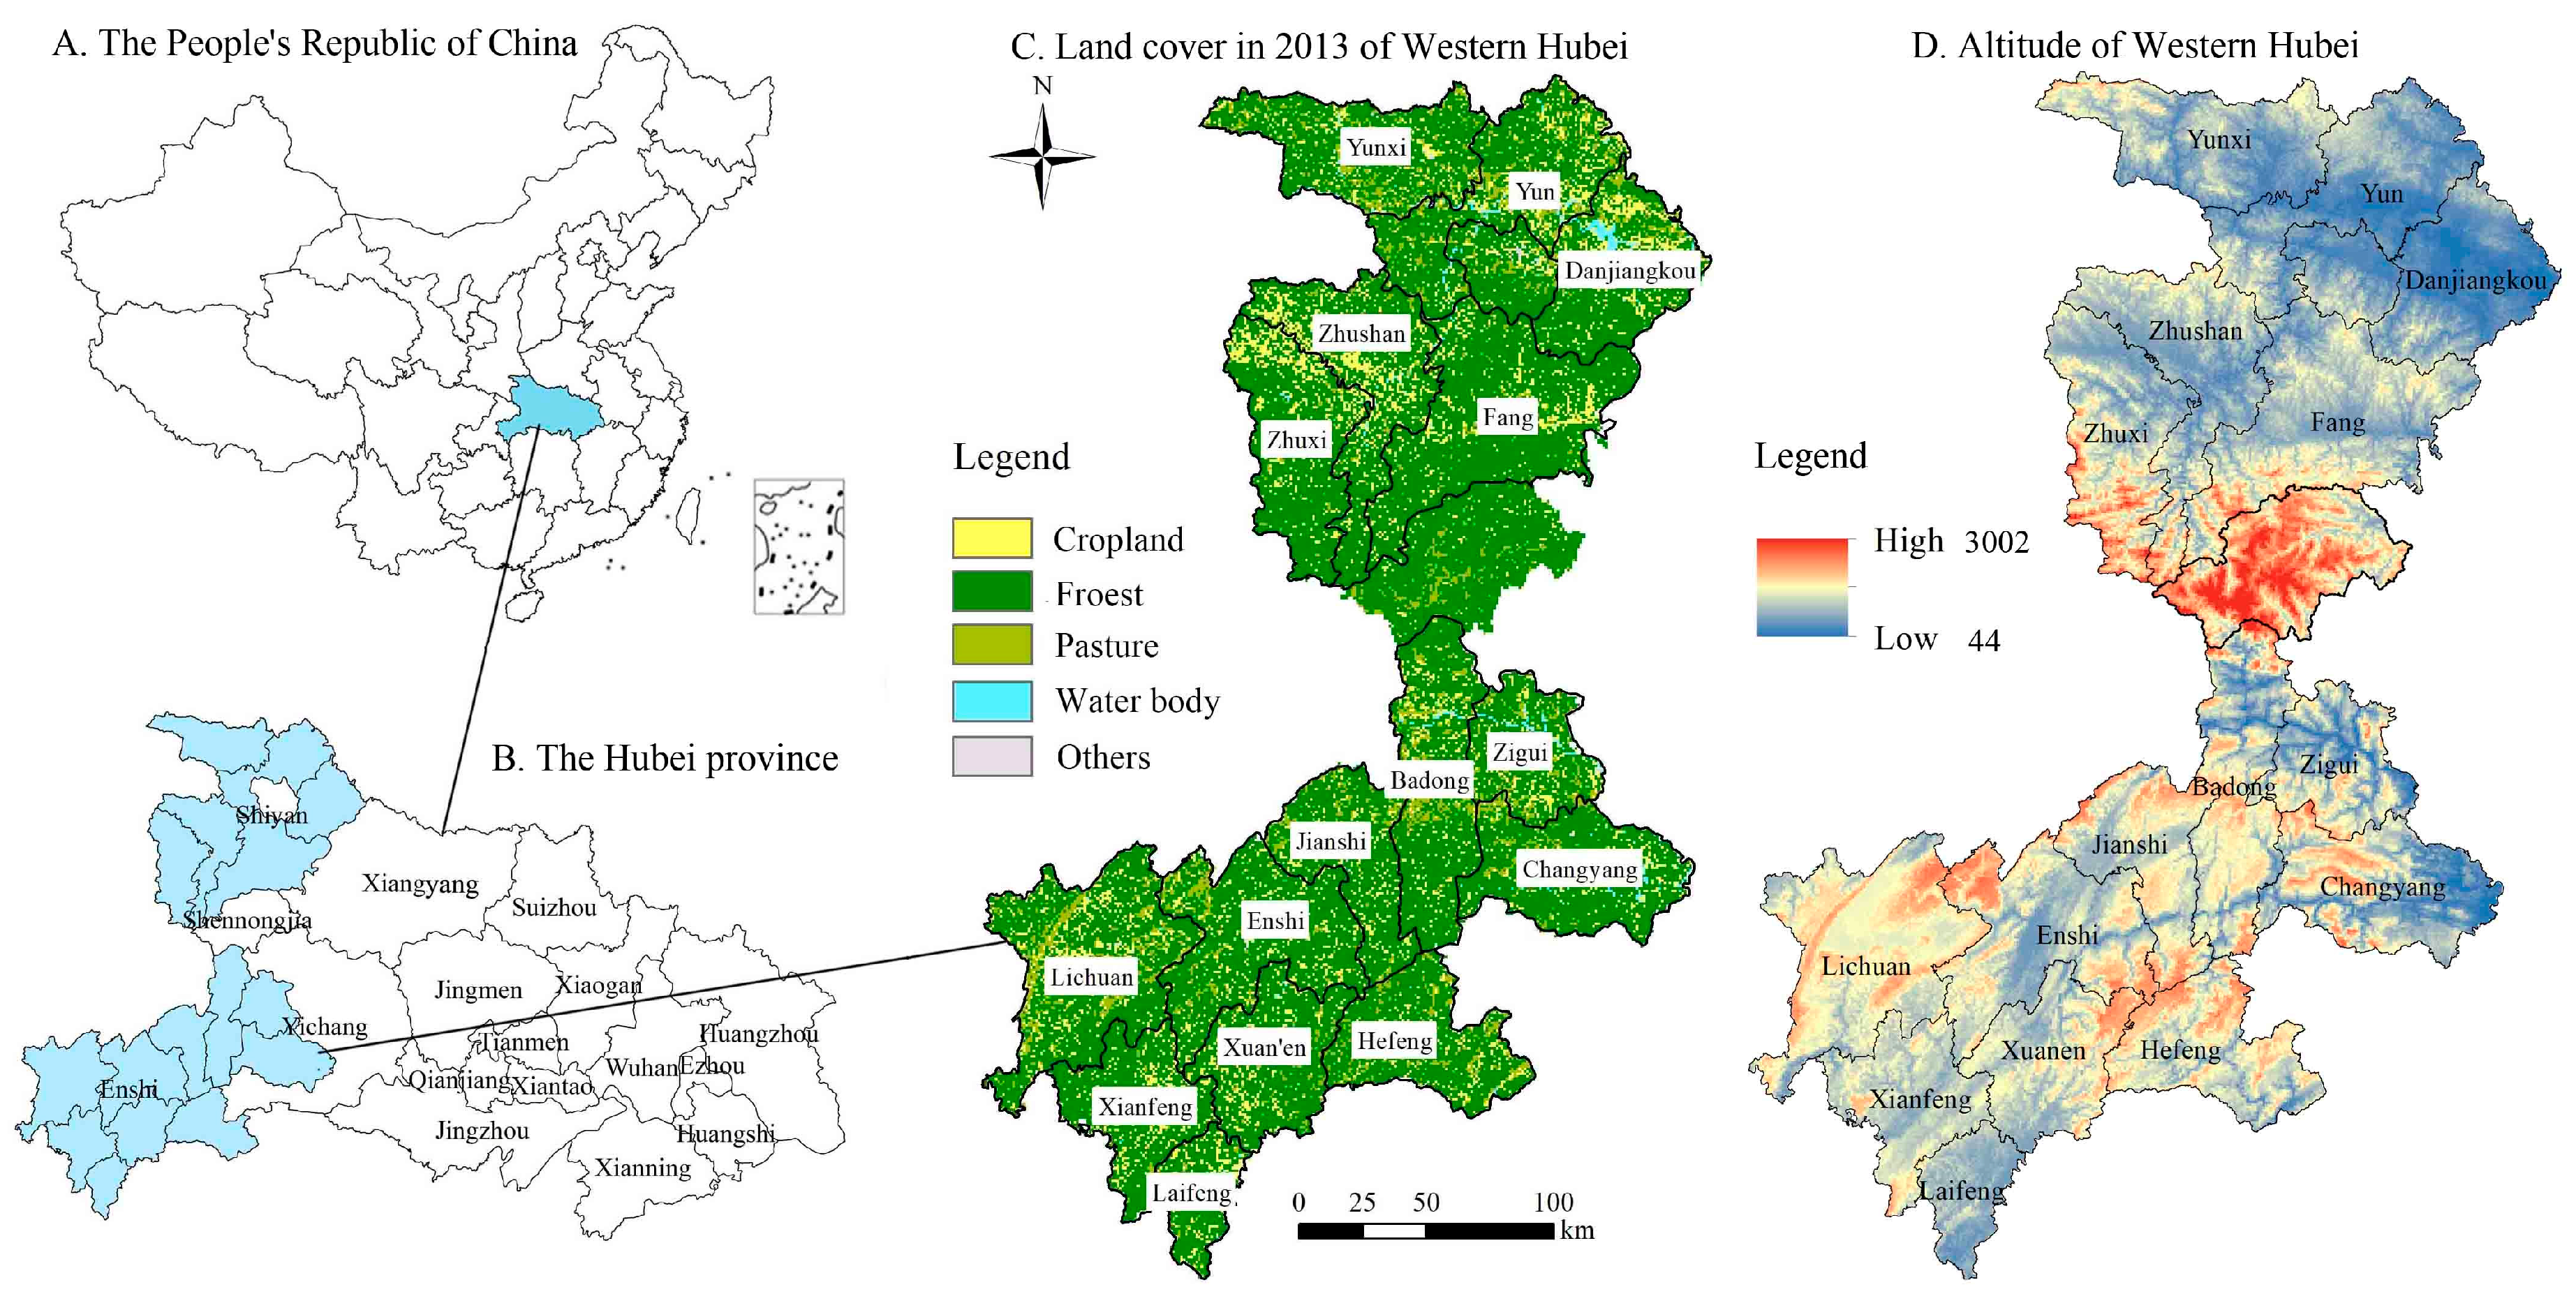
2.1. Study Area

The study area in this paper includes 16 poverty-stricken counties in Western Hubei province of China (108°21′–111°21′ E, 29°06′–33°16′ N) (Figure 1), accounting for 68% of the poverty-stricken counties in Hubei province, with a total land area of 52,453 km2. In 2017, the average gross regional product of the 16 poverty-stricken counties was 10.79 billion RMB, accounting for only 38.8% of the average gross regional product in Hubei province [50], and 37.2% in China [51]. The economy in the areas is underdeveloped. The region is bordered by Shanxi province and Chongqing city to the west, Henan province to the north, Hunan province to the south, and Yichang city, Xiangyang city, and Hubei province to the east. The study area is a typical poverty-stricken area; its land cover situation in 2013 and digital elevation model are shown in Figure 1. The area is characterized by two land types: forest and cropland. The forest is widely distributed, while the cropland is concentrated in the northwest, including Danjiangkou, Yun, Fang, and Zhuxi counties. Water bodies are mainly located in Danjiangkou, which hosts the important headwater region of China’s south-to-north water diversion project. The other land types, such as residential and pasture land, are relatively scattered. For the digital elevation model, the higher altitude areas are situated in the central and southern regions, and lower altitude areas are concentrated in the north.

2.2. Data Source and Processing

This paper compared data from five time stamps: 1995, 2000, 2005, 2010, and 2013. Statistical and vector data were considered. The statistical data were collected from Hubei Statistical Yearbook [50], China County Statistical Yearbook [51], and Hubei Rural Statistical Yearbook [52]. The vector data for 1995, 2000, 2005, and 2010 included the fragmentation index of cropland patches, aggregation index of cropland patches, and distribution density of sloping land. The digital elevation model data were collected from the Resources and Environmental Data Cloud Platform of Chinese Academy of Sciences [53]. The 2013 data were derived from 2010 grid data, combined with land change data for 2010–2013 collected from the Department of Land and Resources of Hubei Province [54], and using ArcGIS for data processing. In calculating the ecological service value, the ecological value equivalent factor and price were revised from the Xie et al. [55].

2.3. Methods

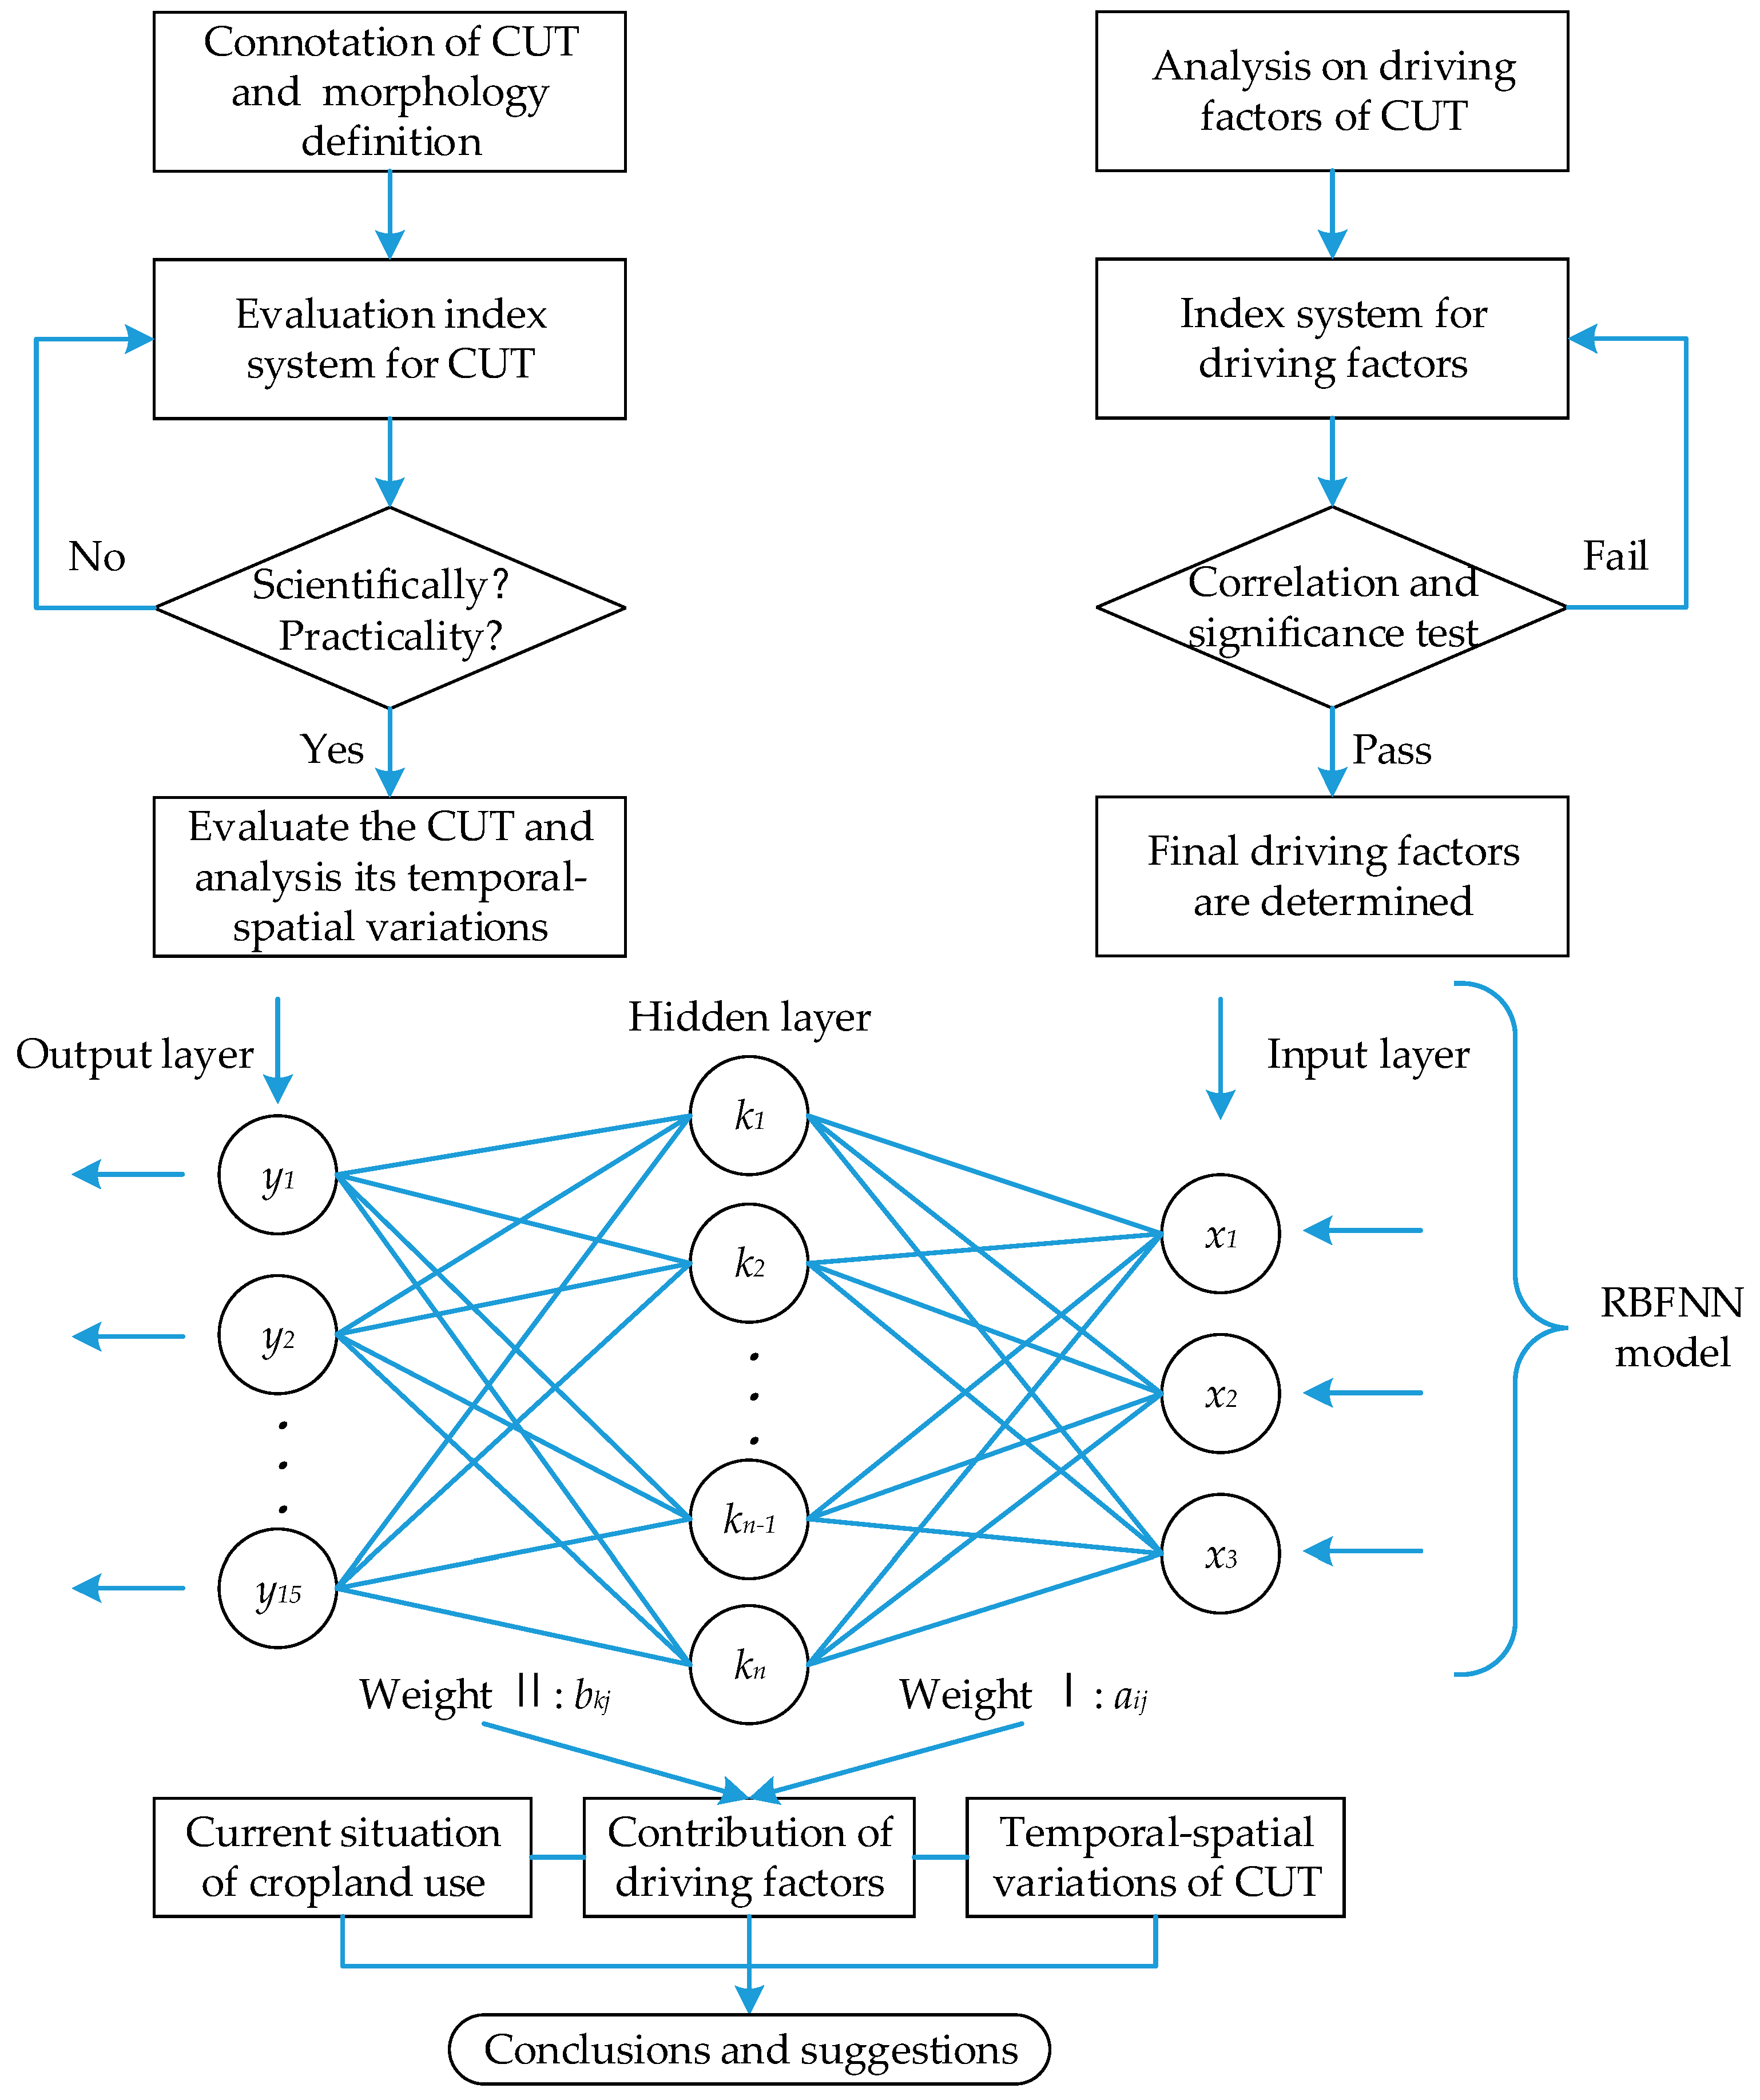
2.3.1. Research Framework

This paper developed a framework for this study, as shown in Figure 2. First, by comparing the definition of CUT, the morphology of cropland was confirmed; based on this, a CUT morphology evaluation index system was constructed. After testing the scientific practicality of the index system, the CUT situation was evaluated. Second, this paper analyzed the driving factors of CUT from the aspects of economy, population, society, and ecology. Through examining the practicality, scientific analysis, and correlation testing, the final driving factors can be determined. Third, this paper took the driving factors as the input layer, and the index of cropland morphology as the output layer, then calculated the contributions of various factors to CUT using the Radial Basis Function Neural Networks (RBFNN) model. Finally, based on the analysis above, this paper formulated several suggestions for the sustainable use of cultivated land and the sustainable development of the economy. The details of these steps are outlined next.

2.3.2. CUT Evaluation Index System

Morphology Analysis of Cropland Use

CUT can be interpreted as the temporal variation in cropland use morphology [34,36]. The morphology comprises two main viewpoints: (1) dominant and recessive morphology [36], and (2) functional and spatial morphology [32]. For the former, dominant morphology mainly refers to land use structure, such as quantitative structure and spatial structure, whereas recessive morphology mainly refers to morphology that is attached to the dominant morphology and is difficult to identify (such as quality, property rights, mode of operation, inherent input, and output capacity), and thus needs to be understood via analysis, testing, and investigation. For the latter, spatial morphology mainly includes quantity and structural aspects, whereas functional morphology mainly comprises empirical or supply aspects, and norm or demand aspects [36]. Both dominant morphology and spatial morphology emphasize the spatial and temporal changes in cropland quantity. In contrast, the focus of recessive morphology and functional morphology are not identical. The former emphasizes property rights transition and management modes, which may cause obvious changes in land type. For cropland, although property rights can be transferred, the operation mode is generally difficult to change given perennial farming patterns and limitations to resource provisions in poverty-stricken areas. Therefore, for CUT, recessive morphology emphasizes quality or output capacity—the productivity of cropland—which reflects the functional morphology. Thus, it is appropriate to define the morphology of cropland use from the perspective of function, which can be expanded to ecological function, life function, and other multidimensional directions. Consequently, CUT can be studied from the dual perspective of functional morphology and spatial morphology.
On the one hand, during land use and agriculture development, the function of cropland is expanded from basic food production to aspects including employment security, ecological services, and landscaping. In terms of human needs and social development, the range of functions for cropland is expanding. First, cropland must meet people’s basic food needs and ensure food security, which are related to the function of crop production. Second, the use of cropland requires a certain number of farmers, which provides basic employment opportunities and qualifies them for subsistence allowances provided to poverty-stricken areas, reflecting the living security function. Third, as living conditions are improving, people are beginning to seek spiritual satisfaction, and functions related to landscaping and ecological protection are required. In summary, three functions pertain to morphology in poverty-stricken areas in China: crop production, living security, and ecological protection.
On the other hand, after analyzing the influence of social and economic development on the use of cropland, the spatial variation in cropland can be divided into quantity change and pattern change. Firstly, a reasonable quantity of cropland is required to facilitate agricultural production, and the quantity of land directly impacts crop yield, which can be measured by the index of cropland change rate and per capita cropland area in rural regions. Secondly, cropland pattern can be divided into quantity management and landscape patterns—the latter mainly reflects changes in cropland areas, density, spatial aggregation degree, and spatial fragmentation degree, which affects the use of arable land and the convenience of cultivation; the former reflects the concentration degree of the cropland and human factors, making it more suitable for analyzing pattern changes from a demand perspective. Therefore, this paper aimed to measure spatial morphology using two aspects: spatial landscape and quantitative.

Establishment of an Evaluation Index System

According to the analysis above, after repeated selection and verification, 15 indicators were identified from five dimensions [56]: crop production, living security, ecological protection, landscape patterns, and quantitative changes (Table 1). To measure the change in cropland use morphology, this paper first evaluated the morphological characteristics of cropland use, and then compared the morphological changes of adjacent periods. Subsequently, the degree of morphology change, which is the coefficient of CUT, was calculated.

2.3.3. Driving Factors Analysis

Exploring the driving factors of spatial differentiation of CUT is important. Considering the significance and correlation with the CUT evaluation index, this paper analyzed the driving factors from three aspects [32]: population, economy, and industrial structure (Table 2).
First, the conflict between human need and cropland use has always been a serious problem due to the large population and lack of arable land in China. As one of the most important land types, cropland can be used to alleviate the conflict between this human demand and land shortage. People directly impact changes to the functional and spatial morphology of cropland, and people are the direct service object of cropland, so population is an important factor affecting cropland use. This paper used population density to measure the impact of population on the differentiation of CUT.
Second, as an important part of land use transition in rural areas, CUT always corresponds to the regional socioeconomic development stage. Changes in the economic form or industrial structure of socioeconomic development promotes CUT, and CUT affects the socioeconomic development in turn by changing the cropland quality, quantity, and spatial pattern, which have a strong mutual influence. Therefore, economic factors are also important in the spatial differentiation of CUT. To avoid correlation with evaluation indicators of cropland use morphology, this paper choses urbanization rate indicator to represent the economic factor.
Third, for the poverty-stricken counties in Western Hubei, agricultural production accounts for a considerable proportion of the gross domestic product (GDP), remaining at about 50% [32]. In recent years, along with the development of industrialization, urbanization, and effective construction of ecological-cultural tourism in Western Hubei, the economic and industrial structures have gradually changed, and the proportions of secondary and tertiary industries have increased cropland use efficiency. Therefore, the industrial structure is also an important factor affecting the spatial differentiation of CUT. This paper chose the primary industry proportion to represent this factor.

2.3.4. CUT Analysis Methods

For the calculation of the weight of the indexes, this paper first used the entropy method [57] to calculate the objective weight, the AHP (Analytic Hierarchy Process) [58] method to calculate the subjective weight, and then took the arithmetic mean of both as the final weight. As such, the subjective and objective weights were considered comprehensively. Using the linear weighting method [59] to calculate the final morphology of cropland use, and comparing the morphological changes in adjacent periods, the corresponding degree of CUT was analyzed. The method is summarized in the following equation [59]:
S = p = 1 n W p R p
where S is the comprehensive score of cropland use morphology, W is the index weight (both of which are assigned a value of 0.5 in this paper), R is the standardized value of the index, n denotes the index number, and p is the index itself.

2.3.5. Analysis of Driving Factor Contribution

This paper used the Radial Basis Function Neural Networks (RBFNN) [60,61] model, which has three structural layers, including the input layer, hidden layer, and output layer, to measure the contributions of the driving factors to CUT (Figure 2). The input layer node passes the input signal to the hidden layer first, and then to the output layer, which entails a distinct process and target [62,63]. According to the principles, this paper used the driving factors as the input layer and indices of CUT, cropland functional transition and cropland spatial transition as the output layer, and calculated the contributions of various factors to CUT. The detailed calculation steps of the RBFNN model can be found in the literature [32,62,63]. The effects of the input layer on the output layer, which is the contributions of various factors to CUT, were calculated according to the following steps [32]:
First, calculate the normalized value of the input layer to the hidden layer aij:
a i j = W i j / i = 1 n W i j
Second, calculate the normalized value of the hidden layer to the output layer bkj:
b k j = P k j / j = 1 m P k j
Third, calculate the normalized value of the input layer to the output layer vik:
v i k = a i j × b k j
where i and j refer to the input layer node and hidden layer node, respectively; n is the total number of input layer nodes; k is the output layers node; and m is the total number of hidden layer nodes.

3. Results

3.1. Temporal and Spatial Variation in CUT

3.1.1. Temporal Variation of CUT

The temporal variation in CUT from 1995 to 2013 is shown in Figure 3. Either the functional transition, spatial transition, or CUT was characterized by fluctuation, but the specific fluctuating characteristics are different. The coefficient of CUT showed an increasing trend year by year, increasing from 0.460 to 0.649 with a growth rate of 41%. The functional transition increased first and then decreased, with a trend of growth overall. The maximum value in 2005–2010 was 0.359, and the minimum value in 1995–2000 was 0.178. The spatial transition fluctuated obviously in different periods, especially with a marked downward trend from 0.480 to 0.393 in 2000–2010.
In contrast, for the special period of 2005–2010, cropland spatial transition showed an opposite development of functional and cropland use transition. By comparative analysis of the factors (Figure 4), the possible reason for this finding was that the quantity of cropland in 2005–2010 markedly decreased, the change in landscape pattern had a slight downward trend, and the joint action of the two caused the reduction in cropland spatial transition.
By comparing the transition and morphology change with time, there was a strong correlation between quantitative change and spatial transition was observed, indicating that the change in cropland quantity is the main factor affecting the spatial transition of the cropland. The function of living security had a strong correlation with functional transition, indicating that living security function is the main factor affecting functional transition.
Notably, a significant change in landscape pattern occurred from 1995 to 2005 with a variation coefficient of 0.408. The main reason may be that in this period, Chinese rural land policy focused on adhering to the household contract management system and standardizing the circulation of land use rights. A series of government documents were issued to promote and standardize the management of the circulation of land contractual management rights, promote the rational flow and optimal allocation of agricultural production factors, improve the efficiency and function of cultivated land use, and promote the degree of CUT.

3.1.2. Spatial Variation in CUT

Using the spatial analysis function in ArcGIS, a spatial distribution diagram (Figure 5) was drawn to analyze the spatial variation in CUT during 1995–2013 in Western Hubei province. Spatial variation of functional transition, spatial transition, and CUT all showed an unbalanced distribution between north and south over time, indicating that different areas had different development statuses, and the main reasons for this could be the differentiation in economy, policy, population mobility, and topography in each county.
Specifically, the functional transition experienced development from south low-north high to north-south balanced, and then back to south low-north high. The Zhuxi county had the most obvious transition coefficient, followed by Zhushan county, Yun county, Zigui county, and Changyang county, which are mainly distributed in the middle of the study area. Lichuan county, Badong county, and Xuanen county had the least significant transition coefficients, being mainly distributed over the south of the study area.
For spatial transition, the coefficient developed from south high-north low to north high-south low. Changyang county, Zigui county, and Zhuxi county had the most obvious transition coefficients, being mainly distributed in the central and northern part of the study area. Danjiangkou county, Yunxi county, and Zhushan county had the least significant transition coefficient, being mainly distributed in the north of the study area.
The overall spatial differentiation of CUT changed from the balanced development of north and south to the pattern of south low-north high. Zhuxi county had the highest transition coefficient, followed by Changyang and Zigui counties, which are mainly distributed in the central and northern parts of the study area. Enshi, Hefeng, and Xuanen counties had the least significant transition coefficient, and are mainly distributed in the south of the study area.
To clarify the specific causes of this situation, this paper further analyzed the contributions of driving factors to CUT.

3.2. Analysis of Contribution of Driving Factors

3.2.1. Contribution of Driving Factors to CUT

Using the RBFNN model explained above, this paper found that the population factor contributed the most to CUT in general, followed by industrial structure, while the economic factor was relatively weaker (Figure 6). For this reason, on the one hand, with the recent rapid development of industrialization and urbanization in China, young laborers in the poverty-stricken counties of Western Hubei province are gradually migrating to cities, which has led to a massive loss of labor and large areas of abandoned cropland. This indicates an urgent need to transition cropland to sustainable agricultural development. Therefore, population is the most important factor affecting CUT. On the other hand, the change in industrial structure reflects the transfer of the economic development center. Although the economy is underdeveloped in poverty-stricken counties of Western Hubei, these counties have excellent ecological endowment because of positive landscape conditions that facilitate the development of tourism and ecological services to promote the social economy. Moreover, economic development is beneficial for the effective use of the cropland, which provides adequate financial support and introduces more science and technology to increase land cultivation. Thus, economic factors are relatively less important to CUT.

3.2.2. Contribution of Driving Factors to CUT in Each County

This paper graphically divided the counties of Yun, Yunxi, Zhushan, Zhuxi, Fang, and Danjiangkou into the northern region, and the counties of Zigui, Changyang, Enshi, Badong, Jianshi, Hefeng, Xuanen, Lichuan, Xianfeng, and Laifeng into the southern region to analyze the difference in geographical regionalization.
The contribution of factors driving the CUT in each county is shown in Figure 7. For the contribution of each specific county to CUT, the population density index was the highest in Fang and Yunxi counties, and lowest in Zhushan and Danjiangkou counties. In general, the coefficient ranged from 0.091 to 0.705, and the average coefficient in the northern region was 0.331, whereas in the southern region it was 0.366, indicating that population density in the southern region contributed more to CUT than in the northern region. For urbanization rate, Hefeng and Zhushan had the strongest contribution with coefficients of 0.371 and 0.297, whereas Lichuan and Enshi had the weakest contribution with coefficients of 0.003 and 0.002, respectively. The average coefficients of the northern and southern regions were 0.132 and 0.071, respectively, indicating that urbanization rate in the northern region had a greater contribution to CUT than in the southern region. The primary industry proportion had the strongest contribution to CUT in Jianshi and Enshi, and the lowest in Changyang and Lichuan. The coefficient of contribution ranged from 0.023 to 0.391, and the average coefficient for the northern region was 0.191, and that in the southern region was 0.237, which had a similar geographical distribution to population density.
The contribution of driving factors to functional transition of cropland is shown in Figure 8. For functional transition, the population density index had the greatest contribution to CUT in Yunxi and Zigui counties with coefficients of 0.514 and 0.510, and the lowest in Danjiangkou and Zhushan counties with coefficients of 0.050 and 0.008, respectively. The average coefficients in the north and south regions were 0.298 and 0.325, respectively, showing the index has a slightly stronger contribution to functional transition of cropland in the north region. The contribution of the urbanization rate was the highest in Fangxian and Danjiangkou, and lowest in Hefeng and Lichuan. The maximum and minimum values were 0.368 and 0.005, respectively. Regarding the primary industry proportion, Zhushan and Enshi counties had the maximum contribution to cropland functional transition with coefficients of 0.504 and 0.377, whereas Fangxian and Lichuan had the lowest coefficients of 0.022 and 0.003, respectively.
The contribution of driving factors to spatial transition of cropland is shown in Figure 9. Population density had the greatest contribution to spatial transition of cropland in Fangxian and Zigui counties, and the lowest in Yunxi and Danjiangkou, with the coefficients ranging from 0.121 to 0.567. The urbanization rate was the highest in Zhushan and Hefeng with coefficients of 0.277 and 0.198, and the lowest in Zigui and Xuanen with coefficients of 0.028 and 0.034, respectively. For industrial structure, the contribution of primary industry proportion to CUT was the strongest in Badong and Jianshi, and the weakest in Changyang and Danjiankou; the maximum and minimum coefficients were 0.366 and 0.060, respectively. In terms of geographical location, the indexes of population density and urbanization rate showed a stronger contribution in the north, whereas the contribution of the primary industry proportion showed the opposite.
Regarding the reason, compared with the original status of the driving factors, this paper found that, although the counties have similar landforms and cropland resources, differences exist in population flow, industrial structure, and economic policies in each county, which affect the transition and sustainable development of cropland. For example, as an important source of the south-to-north water diversion project in China, Danjiangkou received relatively stronger economic development support; the tourism industry in Changyang County, headed by the Qingjiang Gallery in recent years, has gradually changed its economic structure; Zigui is the immigration county in the Three Gorges Area, receiving considerable state support; and Enshi, the capital of Enshi prefecture, possesses better tourism and services.

4. Discussion

4.1. Comparison with Previous Studies

Viewpoints on the composition of cropland use morphology have been reported in previous studies [32,36]. On the basis of previous studies, this paper analyzed the cropland use morphology from functional and spatial aspects, which can directly reflect the internal quality characteristics and external morphological development characteristics of cropland, and provide a more effective reference for policy creation for the protection and sustainable use of cropland. The result is consistent with the findings of Song et al. [32], providing a scientific reference for the sustainable use of cropland.
For the contribution of driving factors to CUT, this paper found that population factors contributed the most to CUT, followed by industrial structure and economic factors. Li et al. [37] and other scholars have shown that marginalization or abandonment of cropland directly influences CUT, mainly caused by the rising labor cost and the transfer of agricultural labor [47]. Urbanization and industrialization are important driving forces [49], indicating that the population factor has a greater impact on CUT, which is consistent with the findings of this paper.

4.2. Suitability of RBFNN Model

Previous studies explored a variety of methods to evaluate the contribution of driving factors to cropland use. For example, Guo et al. evaluated the effects of land consolidation on the multifunctionality of the cropland production system in China using the SPA (Set Pair Analysis)-fuzzy assessment model [64]. Zhang et al. used a partial least squares regression (PLSR) model to determine the main socioeconomic indicators of cropland change [65]. Handavu et al. [66] and Paudel et al. [67] used a binary logistic regression model to examine the driving factors of land use and land cover change. Kundu et al. [68] evaluated the land use change impact on sub-watershed prioritization using the analytical hierarchy process (AHP) method.
Although both subjective and objective methods have been applied, the underlying relationships between original driving factors and evaluation targets have been ignored, which undermines the analysis of the contributions of driving factors to CUT under different contexts. In comparison, the utility of the driving factors calculated by the RBFNN model not only considers the original efficiency of the index factors, but also the internal relationship and target orientation of CUT [61,62], which ensures that our analysis and results are comprehensive and reliable. Each factor’s contribution differs under different goals, which reflects the various driving forces of cropland spatial and functional transition. In the CUT process, the size of the coefficient is positively related to the degree of transition. The greater the effect of the various factors, the greater the regulation of the transition target, and vice versa. The RBFNN model could be effectively used to measure the contributions of driving factors and provide a scientific reference for the sustainable development of cropland in the poverty-stricken counties of Western Hubei province. Different strategies should be adopted to achieve optimal control of CUT in the future. Therefore, RBFNN is a suitable model to evaluate the contributions of driving factors that can solve the deficiency in previous studies of ignoring the internal relationship and target orientation of driving factors.

4.3. Applications and Suggestions

According to the analysis above, population contributed the most to CUT in the poverty-stricken counties in Western Hubei province, followed by industrial structure and economic factors. In the future, the sustainability of cropland use and agriculture in Western Hubei province should be promoted via the following initiatives. Firstly, encourage coordinated development between urban and rural areas, formulate related policies and measures, and encourage a balanced flow of labor in urban versus rural areas to avoid the waste of cropland caused by a shortage of labor in poverty-stricken areas. Secondly, on the basis of objective laws pertaining to economic development, promote CUT by reducing the rent on cropland, increasing cropland use subsidies, providing bank credit, stimulating investment in cropland, and improving the agricultural production and use efficiency, as well as the functional benefits, of cropland. Thirdly, motivate farmers in poverty-stricken areas to engage in agricultural production, and improve the use efficiency and functional benefits of cropland. Finally, science and technology are the important driving force for economic development, which is much more significant in poverty-stricken areas. Therefore, Western Hubei province should fully utilize science and technology. Because of the special nature of resource endowments in poverty-stricken areas, cropland use faces many problems, such as scattered distribution and large areas of sloping land. Advanced science and technology can be applicable to land renovation, land reclamation and restoration, and other engineering techniques to improve the quality and output efficiency of cropland to improve the cropland spatial transition and promote the sustainable development of cropland use.

4.4. Limitations

This paper has several shortcomings. First, with the development of society and economy, more functions will be derived; thus, further efforts should be applied to explore how CUT develops in light of other functions not considered here. Second, this paper mainly focused on the driving factors of population, industrial structure, and economic factors; however, other driving factors should not be ignored, particularly the policy factor, which is difficult to quantitatively analyze. Further efforts are needed to promote cropland use and socioeconomic sustainability. Third, the RBFNN model was only applied to poverty-stricken counties in Western Hubei province, and further studies are needed to reveal whether it is suitable for other areas, and to provide more universal suggestions for poverty alleviation in China.

5. Conclusions

This paper considered 16 poverty-stricken counties in Western Hubei province in China as the study area and analyzed CUT from the perspectives of functional morphology and spatial morphology, along with driving factors, including population, economy, and industrial structure. This paper applied the RBFNN model to measure the contributions of each factor, and provided several suggestions for CUT. Several conclusions were derived.
First, cropland use morphology can be divided into two aspects: functional morphology and spatial morphology. The former includes three aspects—crop production, living security, and ecological protection—whereas the latter includes landscape pattern and quantitative change.
Second, in the study period, regarding spatial distribution, the CUT was high in the north and low in the south. The most significant area of transition was mainly concentrated on the north, with only two counties—Zigui and Changyang—distributed in the south. The temporal variation in CUT from 1995 to 2013 was characterized by fluctuation.
Third, in general, population factors contributed the most to CUT, followed by industrial structure and economic factors. This is aligns with the current situation of rapid development of industrialization and urbanization in China in terms of factors such as labor outflow and the increasing popularity of the tourism and service industry in poverty-stricken areas. For the counties in the study area, various driving factors contributed differently to CUT, related to differences in the population, economy, industrial structure, and the social factors in each county. Related policies and measures should be introduced and implemented to promote the sustainable use of the cropland and the sustainable development of the economy.
In the future, several improvements should be undertaken in this field. First, the accuracy of cropland use data needs to be improved, and the time stamp should be extended beyond 2013. Second, studies on cropland use morphology should be enriched, which may be published over time. Third, studies on the impact of land use policy on CUT in poverty-stricken areas should be completed to provide richer scientific references for poverty alleviation.

Author Contributions

Conceptualization, J.X., X.S., and J.L.; formal analysis, J.X.; funding acquisition, J.X. and J.L.; methodology, J.X., X.S., and J.L.; resources, J.X. and J.L.; supervision, X.S. and J.L.; visualization, J.X. and X.S.; writing—original draft, J.X. and X.S.; writing—review and editing, J.X. and J.L.

Funding

This research was funded by the National Natural Science Foundation of China (Grant No. 71804168; No. 41401191; No. 41701228), the Humanities and Social Sciences of Ministry of Education Planning Fund (Grant No. 18YJAZH078), the Project of Hunan Province Science and Technology Plan (Grant No. 2017TP1029), and the Open Fund of Hunan Key Laboratory of Land Resources Evaluation and Utilization (Grant No. SYS-MT-201801).

Acknowledgments

We wish to acknowledge the support provided by Weina Zhang (Hunan Key Laboratory of Land Resources Evaluation and Utilization), who made a great contribution to grammar revision, and contributed good ideas to modify the manuscript. We are grateful to Shicheng Li and Cheng Liu (China University of Geosciences) for their valuable comments and suggestions to improve this study.

Conflicts of Interest

The authors declare no conflict of interest.

References

  1. Zhou, L.; Xiong, L.Y. Natural topographic controls on the spatial distribution of poverty-stricken counties in China. Appl. Geogr. 2018, 90, 282–292. [Google Scholar]
  2. Chen, Y.; Ge, Y. Spatial point pattern analysis on the villages in China’s poverty-stricken areas. Procedia Environ. Sci. 2015, 27, 98–105. [Google Scholar]
  3. Zhou, Y.; Guo, L.Y.; Liu, Y.S. Land consolidation boosting poverty alleviation in China: Theory and practice. Land Use Policy 2019, 82, 339–348. [Google Scholar]
  4. Niu, H.P.; Fang, G.Y.; Gao, H.Q.; Song, J.R. Cropland quantity niche regulation and its environmental effect. Trans. Nonferr. Met. Soc. 2011, 21, s699–s705. [Google Scholar]
  5. Lin, L.; Ye, Z.; Gan, M.; Shahtahmassebi, A.R.; Weston, M.; Deng, J.; Lu, S.; Wang, K. Quality perspective on the dynamic balance of cropland in Wenzhou, China. Sustainability 2017, 9, 95. [Google Scholar]
  6. Yu, Q.Y.; Xiang, M.T.; Wu, W.B.; Tang, H.J. Changes in global cropland area and cereal production: An inter-country comparison. Agric. Ecosyst. Environ. 2019, 269, 140–147. [Google Scholar]
  7. Phalke, A.R.; Özdoğan, M. Large area cropland extent mapping with Landsat data and a generalized classifier. Remote Sens. Environ. 2018, 219, 180–195. [Google Scholar]
  8. Huy, H.T.; Nguyen, T.T. Cropland rental market and farm technical efficiency in rural Vietnam. Land Use Policy 2019, 81, 408–423. [Google Scholar]
  9. Jin, G.; Chen, K.L.; Wang, P.; Guo, B.S.; Dong, Y.; Yang, J. Trade-offs in land-use competition and sustainable land development in the North China Plain. Technol. Forecast. Soc. Chang. 2019, 141, 36–46. [Google Scholar]
  10. Giorgio, G.A.; Ragosta, M.; Telesca, V. Application of a multivariate statistical index on series of weather measurements at local scale. Measurement 2017, 112, 61–66. [Google Scholar]
  11. Munroe, D.K.; Müller, D. Issues in spatially explicit statistical land-use/cover change (LUCC) models: Examples from western Honduras and the central highlands of Vietnam. Land Use Policy 2007, 24, 521–530. [Google Scholar]
  12. Meneses, B.; Reis, E.; Pereira, S.; Vale, M.; Reis, R. Understanding driving forces and implications associated with the land use and land cover changes in Portugal. Sustainability 2017, 9, 351. [Google Scholar]
  13. Wang, Y.; Zhou, L.; Ping, X.Y.; Jia, Q.Y.; Li, R.P. Ten-year variability and environmental controls of ecosystem water use efficiency in a rainfed maize cropland in Northeast China. Field Crop. Res. 2018, 226, 48–55. [Google Scholar] [CrossRef]
  14. Torres, R.; Gasparri, N.I.; Blendinger, P.G.; Grau, H.R. Land-use and land-cover effects on regional biodiversity distribution in a subtropical dry forest: A hierarchical integrative multi-taxa study. Reg. Environ. Chang. 2014, 14, 1549–1561. [Google Scholar]
  15. Hasselmann, F.; Csaplovics, E.; Falconer, I.; Bürgi, M.; Hersperger, A.M. Technological driving forces of LUCC: Conceptualization, quantification, and the example of urban power distribution networks. Land Use Policy 2010, 27, 628–637. [Google Scholar]
  16. Bucała-Hrabia, A. Long-term impact of socio-economic changes on agricultural land use in the Polish Carpathians. Land Use Policy 2017, 64, 391–404. [Google Scholar]
  17. Guo, Y.; Su, J.G.; Dong, Y.; Wolch, J. Application of land use regression techniques for urban greening: An analysis of Tianjin, China. Urban For. Urban Green. 2019, 38, 11–21. [Google Scholar]
  18. Ebrahimi, M.; Sarikhani, M.R.; Sinegani, A.A.S.; Ahmadi, A.; Keesstra, S. Estimating the soil respiration under different land uses using artificial neural network and linear regression models. Catena 2019, 174, 371–382. [Google Scholar]
  19. Alcock, I.; White, M.P.; Lovell, R.; Higgins, S.L.; Osborne, N.J.; Husk, K.; Wheeler, B.W. What accounts for ‘England’s green and pleasant land’? A panel data analysis of mental health and land cover types in rural England. Landsc. Urban Plan. 2015, 142, 38–46. [Google Scholar]
  20. Li, H.; Wu, Y.Z.; Huang, X.J.; Sloan, M.; Skitmore, M. Spatial-temporal evolution and classification of marginalization of cropland in the process of urbanization. Habitat Int. 2017, 61, 1–8. [Google Scholar]
  21. Jin, G.; Deng, X.Z.; Zhao, X.D.; Guo, B.S.; Yang, J. Spatiotemporal patterns in urbanization efficiency within the Yangtze River Economic Belt between 2005 and 2014. J. Geogr. Sci. 2018, 28, 1113–1126. [Google Scholar] [CrossRef]
  22. Li, S.C.; Bing, Z.L.; Jin, G. Spatially explicit mapping of soil conservation service in monetary units due to land use/cover change for the Three Gorges Reservoir Area, China. Remote Sen. 2019, 11, 468. [Google Scholar] [CrossRef]
  23. Santangelo, G.D. The impact of FDI in land in agriculture in developing countries on host country food security. J. World. Bus. 2018, 53, 75–84. [Google Scholar] [CrossRef]
  24. Baudron, F.; Mamo, A.; Tirfessa, D.; Argaw, M. Impact of farmland exclosure on the productivity and sustainability of a mixed crop-livestock system in the Central Rift Valley of Ethiopia. Agric. Ecosyst. Environ. 2015, 207, 109–118. [Google Scholar] [CrossRef]
  25. Najmuddin, O.; Deng, X.Z.; Jia, S.Q. Scenario analysis of land use change in Kabul River Basin–A river basin with rapid socioeconomic changes in Afghanistan. Phys. Chem. Earth. Parts A/B/C 2017, 101, 121–136. [Google Scholar] [CrossRef]
  26. Deng, X.Z.; Huang, J.K.; Rozelle, S.; Li, Z.H. Impact of urbanization on cropland changes in China. Land Use Policy 2015, 45, 1–7. [Google Scholar] [CrossRef]
  27. Fu, P.; Weng, Q. A time series analysis of urbanization induced land use and land cover change and its impact on land surface temperature with landsat imagery. Remote Sens. Environ. 2016, 175, 205–214. [Google Scholar] [CrossRef]
  28. Zhang, Y.; Zhao, L.; Liu, J.; Liu, Y.; Li, C. The impact of land cover change on ecosystem service values in urban agglomerations along the coast of the Bohai Rim, China. Sustainability 2015, 7, 10365–10387. [Google Scholar] [CrossRef]
  29. Song, X.Q.; Wu, Z.F.; Ou, Y.Z. Route of cropland transition research. Geogr. Res. 2014, 33, 403–413. (In Chinese) [Google Scholar]
  30. Chen, J.L.; Gao, J.L.; Chen, W. Urban land expansion and the transitional mechanisms in Nanjing, China. Habitat Int. 2016, 53, 274–283. [Google Scholar] [CrossRef]
  31. Qin, W.S.; Zhang, Y.F.; Li, G.D. Driving mechanism of cropland transition in Yantai Proper, Shandong Province, China. Chin. Geogr. Sci. 2015, 25, 337–349. [Google Scholar] [CrossRef]
  32. Xiang, J.W.; Li, J.F.; Zeng, J. Spatial difference and its influence factors of cropland transition of poverty counties in West of Hubei. Trans. Chin. Soc. Agric. Eng. 2016, 32, 272–279. (In Chinese) [Google Scholar]
  33. Long, H.L.; Li, T.T. The coupling characteristics and mechanism of farmland and rural housing land transition in China. J. Geogr. Sci. 2012, 22, 548–562. [Google Scholar] [CrossRef] [Green Version]
  34. Song, X.Q.; Huang, Y.; Wu, Z.F.; Ou, Y.Z. Does cropland function transition occur in China? J. Geogr. Sci. 2015, 25, 817–835. [Google Scholar] [CrossRef]
  35. Lambin, E.F.; Meyfroidt, P. Land use transitions: Socio-ecological feedback versus socioeconomic change. Land Use Policy 2010, 27, 108–118. [Google Scholar] [CrossRef]
  36. Long, H.L.; Qu, Y. Land use transitions and land management: A mutual feedback perspective. Land Use Policy 2018, 74, 111–120. [Google Scholar] [CrossRef]
  37. Li, S.F.; Li, X.B. Global understanding of farmland abandonment: A review and prospects. J. Geogr. Sci. 2017, 27, 1123–1150. [Google Scholar] [CrossRef]
  38. Shao, J.A.; Zhang, S.C.; Li, X.B. Farmland marginalization in the mountainous areas: Characteristics, influencing factors and policy implications. J. Geogr. Sci. 2015, 25, 701–722. [Google Scholar] [CrossRef]
  39. Lasanta, T.; Arnáez, J.; Pascual, N.; Ruiz-Flaño, P.; Errea, M.P.; Lana-Renault, N. Space–time process and drivers of land abandonment in Europe. Catena 2017, 149, 810–823. [Google Scholar] [CrossRef]
  40. Levers, C.; Schneider, M.; Prishchepov, A.V.; Estel, S.; Kuemmerle, T. Spatial variation in determinants of agricultural land abandonment in Europe. Sci. Total Environ. 2018, 644, 95–111. [Google Scholar] [CrossRef] [PubMed]
  41. Meyfroidt, P.; Schierhorn, F.; Prishchepov, A.V.; Müller, D.; Kuemmerle, T. Drivers, constraints and trade-offs associated with recultivating abandoned cropland in Russia, Ukraine and Kazakhstan. Glob. Environ. Chang. 2016, 37, 1–15. [Google Scholar] [CrossRef] [Green Version]
  42. Ricci, J.M.P.; Conrad, E. Exploring the feasibility of setting up community allotments on abandoned agricultural land: A place, people, policy approach. Land Use Policy 2018, 79, 102–115. [Google Scholar] [CrossRef]
  43. Ramankutty, N.; Heller, E.; Rhemtulla, J. Prevailing myths about agricultural abandonment and forest regrowth in the United States. Ann. Am. Assoc. Geogr. 2010, 100, 502–512. [Google Scholar] [CrossRef]
  44. Kamada, M.; Nakagoshi, N. Influence of cultural factors on landscapes of mountainous farm villages in western Japan. Landsc. Urban Plan. 1997, 37, 85–90. [Google Scholar] [CrossRef]
  45. Aide, T.M.; Grau, H.R. Globalization, migration, and Latin American ecosystems. Science 2004, 305, 1915–1916. [Google Scholar] [CrossRef]
  46. Gellrich, M.; Baur, P.; Koch, B.; Zimmermann, N.E. Agricultural land abandonment and natural forest re-growth in the Swiss mountains: A spatially explicit economic analysis. Agric. Ecosyst. Environ. 2007, 118, 93–108. [Google Scholar] [CrossRef]
  47. Yan, J.Z.; Yang, Z.Y.; Li, Z.H.; Li, X.B.; Xin, L.J.; Sun, L.X. Drivers of cropland abandonment in mountainous areas: A household decision model on farming scale in Southwest China. Land Use Policy 2016, 57, 459–469. [Google Scholar] [CrossRef] [Green Version]
  48. Zhang, Y.; Li, X.B.; Song, W. Determinants of cropland abandonment at the parcel, household and village levels in mountain areas of China: A multi-level analysis. Land Use Policy 2014, 41, 186–192. [Google Scholar] [CrossRef]
  49. Kozak, J. Forest cover change in the Western Carpathians in the past 180 years: A case study in the Orawa Region in Poland. Mt. Res. Dev. 2003, 23, 369–375. [Google Scholar] [CrossRef]
  50. Statistics Bureau of Hubei, Hubei Investigation Team of National Bureau of Statistics. Hubei Statistical Yearbook 1995–2018; China Statistics Press: Beijing, China, 2019. (In Chinese)
  51. Department of Rural Social and Economic Investigation of the National Bureau of Statistics. China County Statistical Yearbook 1995–2018; China Statistics Press: Beijing, China, 2019. (In Chinese)
  52. The Editorial Board of Hubei Rural Statistical Yearbook. Hubei Rural Statistical Yearbook 1995–2018; China Statistics Press: Beijing, China, 2019. (In Chinese)
  53. Resources and Environmental Data Cloud Platform, Chinese Academy of Sciences (RESDC), Beijing, China. Available online: http://www.resdc.cn (accessed on 12 January 2019).
  54. Department of Land and Resources of Hubei Province. The Data of Land Use and Land Cover Change from 2010–2013; Department of Land and Resources of Hubei Province: Wuhan, Hubei, 2016. (In Chinese)
  55. Xie, G.D.; Zhang, C.X.; Zhen, L.; Zhang, L.M. Dynamic changes in the value of China’s ecosystem services. Ecosyst. Serv. 2017, 26, 146–154. [Google Scholar] [CrossRef]
  56. Xiang, J.W.; Li, J.F. Influence of cultivated land use transition on quality of agricultural economic growth in poor mountainous areas. China Popul. Resour. Environ. 2018, 28, 71–81. (In Chinese) [Google Scholar]
  57. Xu, D.; Hou, G.L. The Spatiotemporal coupling characteristics of regional urbanization and its influencing factors: Taking the Yangtze River Delta as an example. Sustainability 2019, 11, 822. [Google Scholar] [CrossRef]
  58. Wu, G.D.; Duan, K.F.; Zuo, J.; Zhao, X.B.; Tang, D.Z. Integrated sustainability assessment of public rental housing community based on a hybrid method of AHP–entropy weight and cloud model. Sustainability 2017, 9, 603. [Google Scholar]
  59. Li, J.Y.; Luo, C. The simplified weighted sum function and its average sensitivity. Inf. Process. Lett. 2016, 116, 331–336. [Google Scholar] [CrossRef] [Green Version]
  60. Roh, S.B.; Oh, S.K.; Pedrycz, W.; Seo, K.; Fu, Z. Design Methodology for Radial Basis Function Neural Networks Classifier Based on Locally Linear Reconstruction and Conditional Fuzzy C-Means Clustering. Int. J. Approx. Reason. 2019, 106, 228–243. [Google Scholar] [CrossRef]
  61. Tian, J.; Li, M.; Chen, F. Dual-population based co-evolutionary algorithm for designing RBFNN with feature selection. Expert Syst. Appl. 2010, 37, 6904–6918. [Google Scholar] [CrossRef]
  62. Soni, B.P.; Saxena, A.; Gupta, V.; Surana, S.L. Identification of generator criticality and transient instability by supervising real-time rotor angle trajectories employing RBFNN. ISA Trans. 2018, 83, 66–88. [Google Scholar] [CrossRef] [PubMed]
  63. Zeng, X.; Zhen, Z.; He, J.; Han, L. A feature selection approach based on sensitivity of RBFNNs. Neurocomputing 2018, 275, 2200–2208. [Google Scholar] [CrossRef]
  64. Guo, B.B.; Jin, X.B.; Yang, X.B.; Guan, X.; Lin, Y.N.; Zhou, Y.K. Determining the effects of land consolidation on the multifunctionlity of the cropland production system in China using a SPA-fuzzy assessment model. Eur. J. Agron. 2015, 63, 12–26. [Google Scholar] [CrossRef]
  65. Zhang, Y.; Li, C.G.; Wang, T.W.; Cai, C.F.; Bao, Y.Z. County-level patterns of cropland and their relationships with socioeconomic factors in northwestern China. Agric. Ecosyst. Environ. 2015, 203, 11–18. [Google Scholar] [CrossRef]
  66. Handavu, F.; Chirwa, P.W.C.; Syampungani, S. Socioeconomic factors influencing land-use and land-cover changes in the miombo woodlands of the Copperbelt province in Zambia. For. Policy Econ. 2019, 100, 75–94. [Google Scholar] [CrossRef]
  67. Paudel, B.; Gao, J.G.; Zhang, Y.L.; Wu, X.; Li, S.C.; Yan, J.Z. Changes in cropland status and their driving factors in the Koshi River basin of the Central Himalayas, Nepal. Sustainability 2016, 8, 933. [Google Scholar] [CrossRef]
  68. Kundu, S.; Khare, D.; Mondal, A. Land use change impact on sub-watersheds prioritization by analytical hierarchy process (AHP). Ecol. Inform. 2017, 42, 100–113. [Google Scholar] [CrossRef]
Figure 1. Location map and land cover of the study area.
Sustainability 11 01997 g001
Figure 2. Research framework of this study.
Sustainability 11 01997 g002
Figure 3. The change in cropland use transition with time.
Sustainability 11 01997 g003
Figure 4. The change in cropland morphology with time.
Sustainability 11 01997 g004
Figure 5. The spatial distribution of CUT from 1995 to 2013. The values are dimensionless, which were calculated based on Equation (1).
Sustainability 11 01997 g005
Figure 6. Contribution of driving factors to CUT.
Sustainability 11 01997 g006
Figure 7. The contribution of driving factors to CUT in western Hubei.
Sustainability 11 01997 g007
Figure 8. The contribution of driving factors to functional transition of cropland.
Sustainability 11 01997 g008
Figure 9. The contribution of driving factors to spatial transition of cropland.
Sustainability 11 01997 g009
Table 1. Evaluation index system of cropland use morphology.
Criterion LayerFactor LayerIndex LayerIndex CalculationIndex ConnotationSymbol
Functional morphologyCrop productionMain crop yields per croplandThe yield of major crops/quantity of croplandCrop production capacity of croplandy1
Added value of agricultureAdded value of agricultural production and related activitiesStatus of agricultural production and operationy2
Multiple cropping indexQuantity of planting area of crops/quantity of croplandInvestment and use of croplandy3
Living securityPer capita agriculture income of rural householdsAgricultural output/number of rural residentsEconomic function and basic allowances of croplandy4
Ratio of planting industry populationThe number of crop practitioners/number of rural workersEmployment guarantee from croplandy5
Per capita grain guarantee rateGrain yield/(resident population × 400 kg)Grain security from croplandy6
Ecological protectionNitrogen and phosphorus index of croplandAgricultural fertilizer use/quantity of croplandDamage to the ecological environment y7
Ratio of chemical controlled areaChemically controlled area/quantity of croplandDamage to the ecological environment y8
Ecological service value index of croplandRevised from the work by Xie et al. [55]Ecological service value of cropland y9
Spatial morphologyLandscape patternFragmentation index of cropland patchCropland patches/total landscape areaLandscape fragmentation of croplandy10
Aggregation index of cropland patchNumber of adjacent patches/total number of cropland patchesReflection of landscape polymerization of croplandy11
Distribution density of sloping croplandAmount of sloping cropland/quantity of croplandDistribution of sloped croplandy12
Quantitative changeNewly increased croplandQuantity of newly increased cropland for the yearNewly croplandy13
Per capita croplandQuantity of cropland/number of resident populationPer capita quantity of cropland y14
The ratio of cropland in plains areas versus mountainous areasAmount of cropland in plains areas/amount of cropland in mountainous areasInternal structure of croplandy15
Table 2. Index of driving factors to CUT.
Driving FactorIndexIndex CalculationSymbol
PopulationPopulation densityTotal population/total quantity of landx1
EconomyUrbanization rate indicatorNumber of urban population/number of total populationx2
Industrial structurePrimary industry proportionOutput value of primary industry/gross domestic productx3

