Article

The Performance of Supply-Push Versus Demand-Pull Technology Transfer and the Role of Technology Marketing Strategies: The Case of a Korean Public Research Institute

Department of IT Convergence and Management, Korea University of Technology and Education, Cheonan 31253, Korea
*
Author to whom correspondence should be addressed.
Sustainability 2019, 11(7), 2005; https://doi.org/10.3390/su11072005
Submission received: 21 February 2019 / Revised: 18 March 2019 / Accepted: 27 March 2019 / Published: 4 April 2019
(This article belongs to the Section Economic and Business Aspects of Sustainability)

Abstract

:
Technology transfer is one of important strategies in sustainable economic growth. There are supply-push and demand-pull directions of technology transfer, and recently Korean research institutes have paid increasing attention to demand-pull technology transfer in an attempt to improve public research institutes’ technology transfer performance (TTP). However, our view is that simply adopting a demand-pull or a supply-push model does not always guarantee improved TTP. We argue that technology marketing strategies, such as mass marketing and target marketing, should also be considered. This study aims to investigate the relationship between technology transfer directions and TTP, and the role of technology marketing strategies. We collected a Korean research institute’s technology transfer data from 2014 to 2015, and then employed a two-way ANOVA to analyze the data. The result of the analysis shows that TTPs differ by technology transfer directions and technology marketing strategies. More importantly, we found that the demand-pull model yields higher TTP, especially when the model is associated with target marketing strategies rather than mass-marketing strategies. This result implies that marketing strategies, such as market segmentation and customer targeting, are needed if an organization wants to improve TTP by implementing the demand-pull technology transfer model.

1. Introduction

Technological innovation is believed to be one of important sources of sustainable economic growth. Some of the scholars in the 1970s argued that there might be limits to growth [1] in the 21st century due to the exhaustion of resources, pollution, the shortage of food, etc., and this argument drew much criticism. Critics argued that limits to growth underestimated the roles of technical and social change, and that the world economy might sustain growth, even in the 21st century [2]. Though the debate is still ongoing, it is widely believed—especially among scholars in the neo-Schumpeterian vein—that technological innovation can open a new era of economic growth in the future [3,4].
Technology transfer is the application of technology to a new use or user [5] or a movement of technology from one knowledge domain to another [6]. It might include, be part of, or overlap with technological innovation [7]. Though the types are different, they commonly imply that technology transfer is a closely linked concept with technological innovation. In this respect, technology transfer is an important vehicle for innovation, and hence for sustainable economic growth [8]. Therefore, it is necessary to address the issue of technology transfer in the discussion of sustainability.
Firms, organizations, and national governments of the world have increasingly invested in Research and Development (R&D) for the last half-century. Korean firms, research organizations, universities, and the government are no exception. According to a Korean government report, the total R&D investment of the country reached 62.08 billion USD in 2016 [9], which is roughly triple the amount in 2000 (21.3 billion USD). The country ranked fifth among the member countries of the Organization for Economic Co-operation and Development (OECD) [9]. With their ever-increasing R&D investment, Korean firms and other research organizations have rapidly improved their technological capabilities and the stock of knowledge has dramatically increased. The number of international patent applications at the Patent Cooperation Treaty (PCT) has increased from 5545 in 2000 to 34,932 in 2016.
However, the commercialization of technology has been unsatisfactory, despite the dramatic increase of R&D investment and the stock of knowledge. There has been severe criticism that the knowledge-producing organizations in Korea accumulate huge numbers of patents, but only a handful of them are commercialized. The proportion of sleeping patents (those that are not in use or are only held for defensive purpose) at universities and public research institutes amounts to approximately 70% [10,11]. For this reason, the researchers and practitioners in the field of technology management have explored how to improve the performance of technology transfer.
This study addresses the same issue, focusing attention on public research institutes. There are several types of actors of technology transfer, including universities and (public) research institutes, technology startups, and established companies [12]. While all of them can act as technology suppliers and users [12,13], universities and public research institutes are traditionally seen as major technology suppliers [13] (p. 10). Among universities and public research institutes, previous research paid greater attention to universities than to public research institutes. While most of the literature has focused on university technology transfer, studies regarding public research institutes were in the minority.
Among the studies about public research institutes’ technology transfer, some have suggested a demand-pull model for public institutes’ technology transfer. Piper & Naghshpour [14] pointed out that the supply-push strategy has been dominant in the government’s (and hence, public research institutes’) technology transfer. They argued that a demand-pull strategy might help improve commercial adoptions of government technologies. A recent study in Korea also argued that many Korean research institutes simply rely on the supply-push model of technology transfer, when the demand-pull model might be a good alternative [15].
In addition to the studies above, Carr [16] examined why technology transfer performances of public research institutes were inferior to those of some prominent research universities in the US. He argued that the gap between the research universities and public research institutes stems from technology transfer strategies. While universities take aggressive approaches to technology transfer in utilizing marketing techniques, public research institutes’ technology transfer has continued to employ legal or administrative approaches. This implies that public research institutes should adopt marketing strategies in their technology transfer practice.
Therefore, is there any difference in TTPs by technology transfer directions (such as supply-push versus demand-pull models) and technology marketing strategies? We address this issue by examining technology transfer data at a Korean research institute (“K Institute”). Our conceptual background is presented in the next section, and our research method is discussed in Section 3. Subsequently, we present the result of our analysis and draw a conclusion in Section 4 and Section 5.

2. Conceptual Background

2.1. Technology Transfer

Technology transfer has been defined in a variety of ways. First, technology transfer can be defined to imply the movement of technology (or knowledge) in the vertical process of technology commercialization. Feulner [17] defines technology transfer as a process for converting research into economic development. Foster [18] states that it is the process of employing a technology for a purpose different from the one for which it was first developed. His statement does not specifically mean vertical movement, but he implies it, noting, “while normal R&D tends to emphasize creative laboratory work, technology transfer focuses on the utilization of previous research” [18].
Second, there is an approach that emphasizes changing applications. Lane [5] defines technology transfer as a process for applying known technologies to new and novel applications, and Reisman [19] defines it as a process for conceiving a new application for an existing technology. According to these definitions, technology does not need to be moved vertically, but it can move to different application areas.
Third, some scholars emphasize the inter-organizational movement of technology. Autio and Laamanen [20] define technology transfer as “intentional and goal-oriented interaction between two or more social entities, during which the pool of technological knowledge remains stable or increases through the transfer of one or more components of technology”. According to Bozeman [21], it can more specifically be defined as “movement of know-how, skills, technical knowledge or technology from one organizational setting to another”.
Bauer’s definition (citing Lane) aptly summarizes the above views: technology transfer is “a movement of technology from one domain of application to another—from a federal lab or university in the public sector to a manufacturer in the private sector; from a manufacturer in one industry segment to a manufacturer in another industry segment; from an inventor to a manufacturer” [6].
In many cases, previous literature in international journals has shown interest in university technology transfer. For instance, Li et al. [22] analyzed university technology transfer that focuses on inventors’ technology service, and Santoro and Bierly [23] investigated university technology transfer through collaboration between university and industry. In contrast, Korean literature pays more attention to public research institutes. This is because the role of public institutes was larger than that of universities during the industrialization period of the 20th century. [24].
Scholars have explored factors that influence TTP from a variety of perspectives. Battistella et al. [25] categorized the factors into supplier characteristics, user characteristics, technological characteristics, the user-supplier relationship, transfer channels and mechanisms, and context. Other than these, strategic factors may also be important. Many previous studies, especially Korean literature [26,27,28,29,30], have focused on the actors’ characteristics, as well as the environmental and institutional factors.

2.2. Directions of Technology Transfer: Supply-Push and Demand-Pull Models

Lane [5] states that there are two directions of technology transfer: supply-push and demand-pull. According to him, a supply-push model means that a technology holder or a supplier initiates the technology transfer and then pushes technology toward the market. A demand-pull model means that a technology transfer process is initiated by whatever entity is seeking a solution to satisfy demand. In the case of supply-push technology transfer, the direction of the technology transfer is from left to right in Figure 1. In the case of demand-pull technology transfer, a technology user (or a seeker) initiates technology transfer from right to left, and it goes back to the right in the figure.
The initiation of technology transfer does not only imply the beginning of an administrative process of technology transfer. Rather, the initiation of technology means the attempt to generate market demand by determining the attributes that are important to the purchase decision [14]. With the demand-pull model, the buyer or user of technology defines the attributes of technology to create demand. Conversely, the supplier in the supply-push model predetermines the attributes.
Supply-push and demand-pull technology transfer models have more than 20 years of history, but the notions have only recently gained popularity among scholars. Lane [31,32,33], Bauer [6], and Bauer and Flagg [34] utilized the models of the assistive technology field. They mainly performed case-based research, and provided lessons for accomplishing technology transfer. Hine et al. [35], while using an Australian case, analyzed the benefits of demand-pull versus supply-push technology transfer models. Hwhang and Chung [15] analyzed some technology transfer cases of a Korean research institute and found that needs-based technology planning positively influences successful technology transfer. Jun and Ji [36] analyzed the factors that influence the performance of demand-pull technology transfer. They found that the quality of “needs-articulation” is positively associated with demand-pull technology transfer, and then argued that users’ technological capabilities and absorptive capacity are important for demand-pull technology transfer.

2.3. Need for a Marketing Perspective

According to Carr [16], the nature of technology transfer programs has evolved from the legal model to the administrative or marketing models. Legal staff of an organization generally ran the legal model before the legislation of technology transfer occurred in the 1980s. The model mainly dealt with patenting inventions, without much emphasis on the commercialization of technology. For this reason, organizations that used this model showed low TTP.
Technology transfer under the administrative model has usually been run in administrative or support departments/organizations. Since the legislation of technology transfer in the 1980s, many organizations moved toward this model. Administrators staffed technology transfer offices, and they started to pay attention to the commercialization of technologies. For this purpose, they performed technology evaluation and emphasized exclusive license agreements. They also invested in some marketing efforts, such as advertising in publications.
Under the marketing model, technology transfer offices apply marketing techniques in technology transfer. They actively market their technologies and encourage scientists and technology developers to disclose their inventions through rewards or incentives. They have entrepreneurial staff with experience in marketing to perform the tasks. They utilize their marketing knowledge regarding a specific industry segment to identify the potential licensees.
The evolution of technology transfer programs shows that the importance of marketing perspectives is increasing. While there were no marketing perspectives in the legal model, marketing concepts are significantly used in the administrative and marketing models. Reflecting this trend, some scholars (especially in Korea) use the term “technology marketing” [37,38], defining it as the marketing activities that are performed by technology licensing offices to transfer the R&D outcomes to technology users. Our current study is not isolated from this trend. We also introduce marketing perspectives in this study, defining technology marketing as “activities of technology licensing offices to accelerate technology transfer”.

3. Research Framework and Method

3.1. Research Framework

Kotler & Armstrong [39] suggest basic steps for a marketing strategy. Though their suggestions are for consumer markets rather than technology markets, Kotler [40] argues that his concept of marketing can be applied to all organizations that have customer groups. For instance, the basic processes of marketing planning were applied to education [41], nonprofits [42], and technology markets [43]. Kotler also suggests areas where marketing concepts can be used [40].
According to Kotler & Armstrong [39], there are four major steps in designing a marketing strategy: segmentation, targeting, differentiation, and positioning. These steps can be summarized into two large activities. The former two—segmenting and targeting—are selecting customers to serve, while the latter two—differentiation and positioning—are decisions based on a value proposition. In other words, defining a market and defining a product are the main elements in designing a marketing strategy.
In technology transfer, the supply-push and demand-pull models that are discussed in the previous section can be related to the latter step—defining a product or defining value proposition activities. As we reviewed in the previous section, being supply-push or demand-pull is about who defines the attributes of technology that are important to the purchase decision [14], and when that definition is made. The users of the technology define the attributes in the demand-pull model and suppliers determine those in the supply-push model.
Regarding the market side, there can be several approaches in selecting and targeting market segments. According to Kotler & Armstrong [39], there can be four levels of marketing strategies: mass marketing, differentiated marketing, concentrated marketing, and micromarketing. While mass marketing ignores market segment differences and targets whole markets with a single offer, the latter three consider the differences between customers and target-specific groups or individual customers. In our study, we summarize them into mass-marketing and target marketing strategies. These segmentations can be applied to technology transfer.
The previous section shows that the administrative or the marketing models replaced the traditional legal model. The latter two models actively use marketing methods, but there are some differences. While the marketing methods in the administrative model tend to be limited to mass advertisement, the marketing model does not usually use advertising in an effort to limit curious inquiries and conserve staff time and energy, and it relies more on market segmentation to identify the potential users of technologies [16]. It means that there may be different marketing strategies for technology transfer practices.
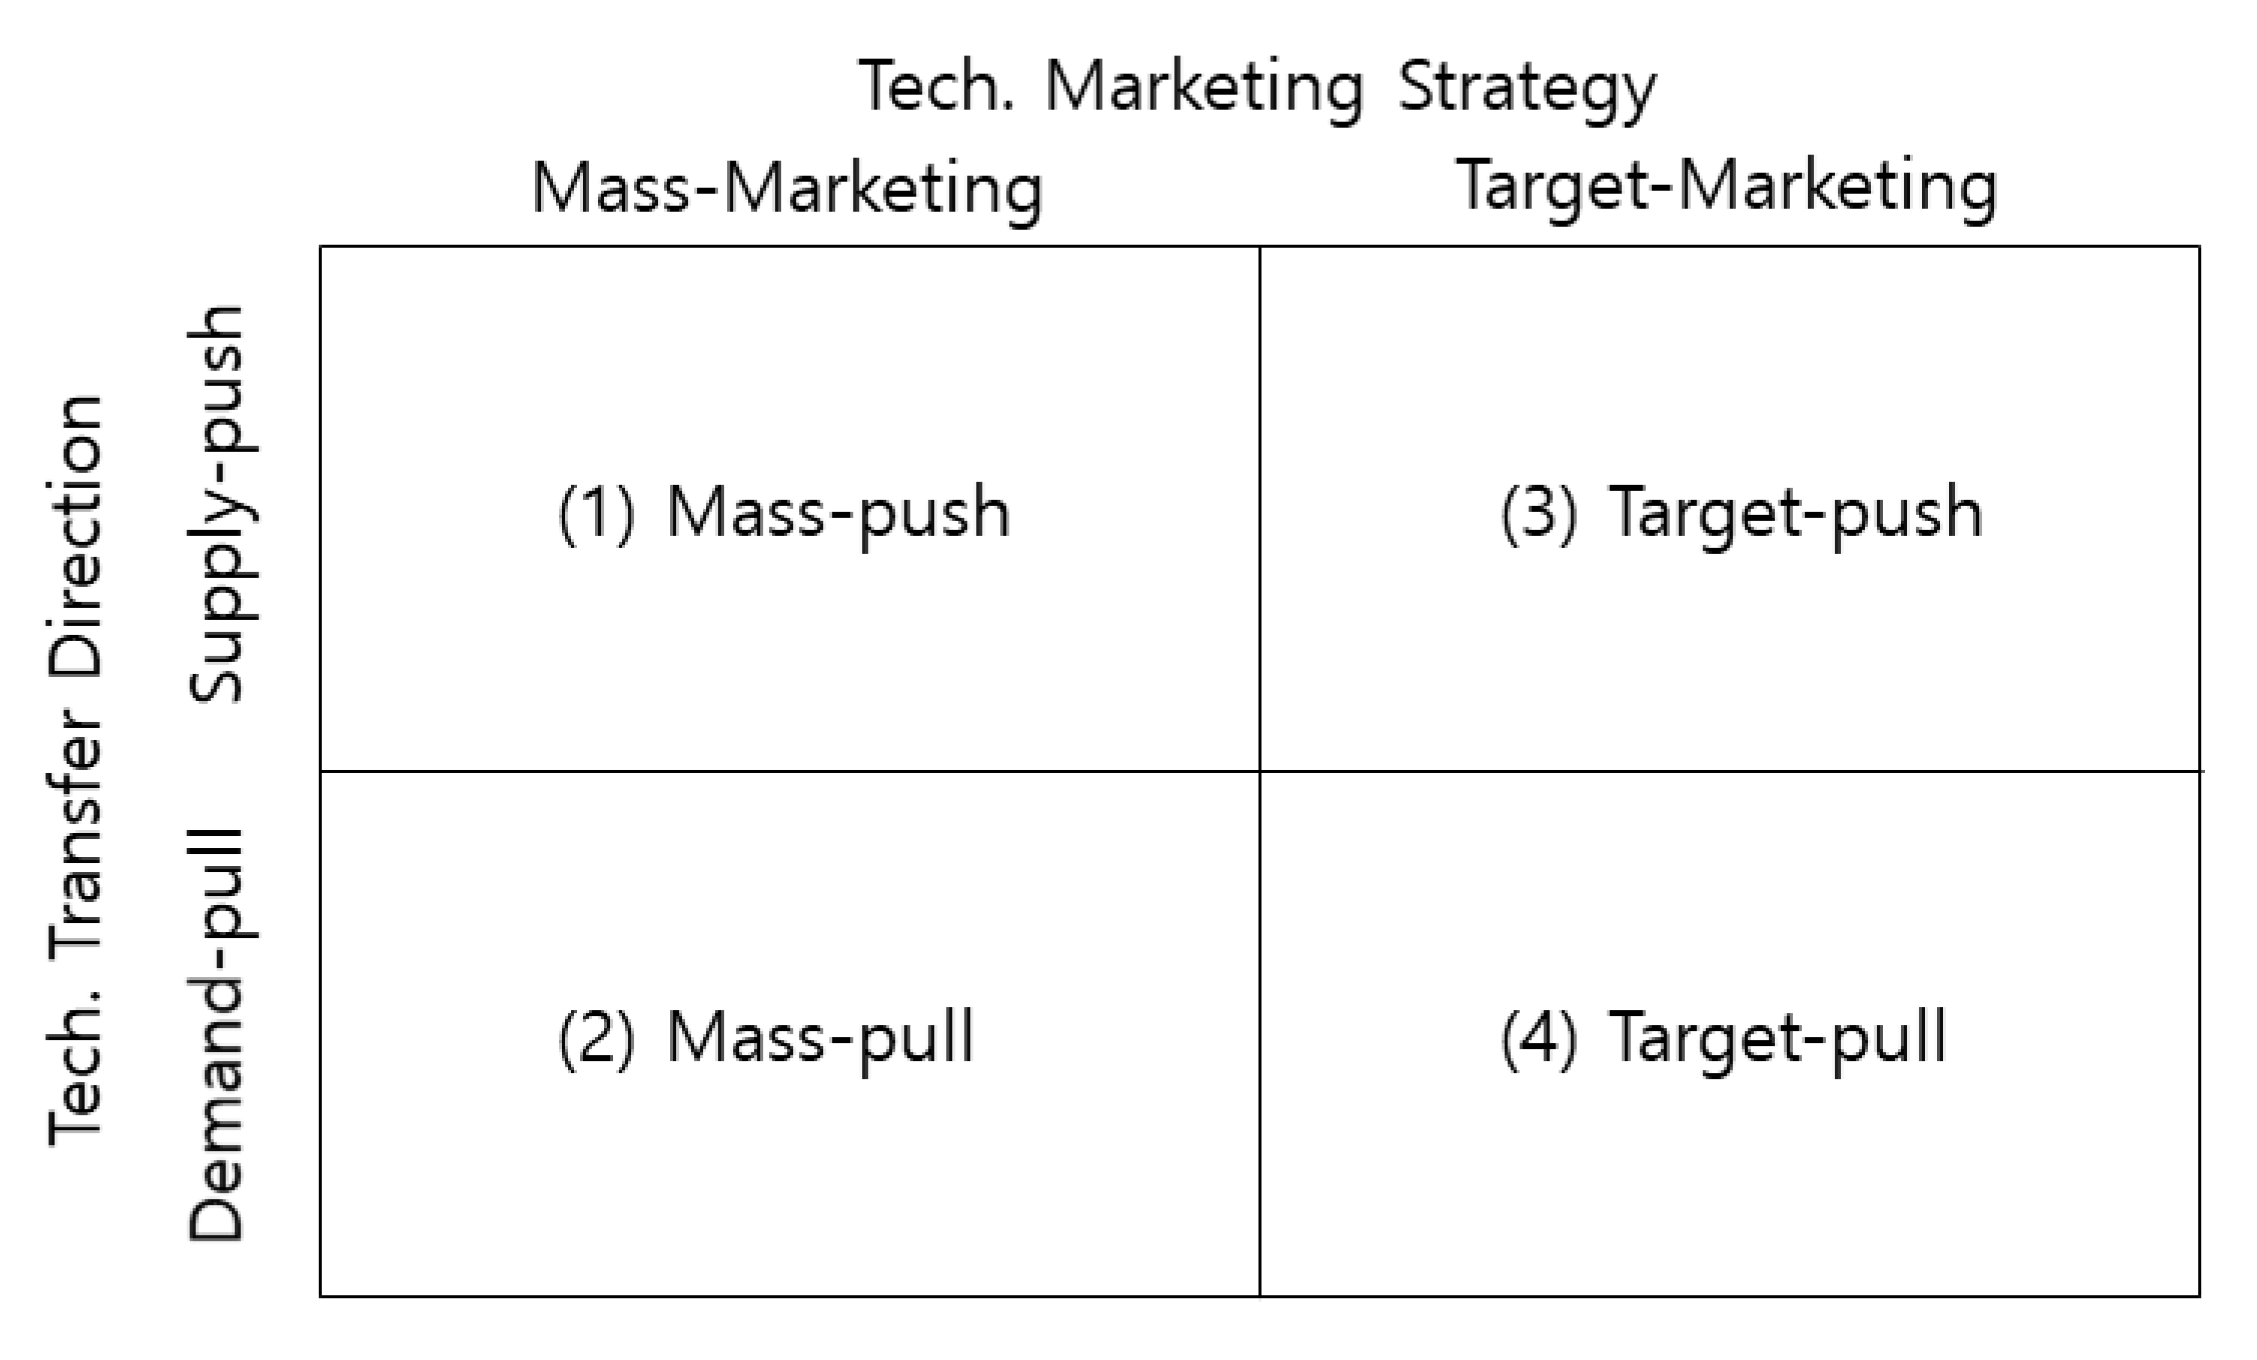
Summing up the discussion above, we can establish a research framework that combines the dimensions of technology transfer direction and technology marketing strategy, as illustrated in Figure 2. Two technology directions (supply-push and demand-pull) and two marketing strategies (mass-marketing and target marketing) yield four different types of technology transfer: (1) mass- push, (2) mass-pull, (3) target-push, and (4) target-pull.

3.2. Hypotheses

We hypothesize that TTPs are different, depending on the technology transfer directions and technology marketing strategies. First, we propose that the supply-push and the demand-pull models produce different TTPs. The core difference between supply-push versus demand-pull models is who defines the attributes of technology and technology transfer [14]. Suppliers define the attributes of supply-push technology transfer (who are far from the market), and users define those of demand-pull (who are closer to the market). In the case of supply-push technology transfer, there can be a higher level of risk and uncertainty from the users’ perspective, and users can be reluctant to adopt the technology. Conversely, as the users of technologies generally have more market knowledge, a demand-pull technology transfer, whereby users define the attributes, may carry less risk and uncertainty in commercialization, and users may eager for the transfer of the technology. These factors may have an influence on the bargaining power of suppliers and users, and therefore TTP may be different according to the direction of the technology transfer.
Some recent studies regarding this topic also reveal that TTPs that consider demand are better for performance. Yang and Kim [44] examine the problems that are suffered by R&D organizations and show that difficulties in evaluating the market value of technology are one source of the difficulties. Their study implies that market demand is important for technology transfer. Reflecting this implication, Hwhang and Chung [15] analyzed some technology transfer cases at a Korean research institute and argue that TTP may be better when the technology transfer processes are based on the needs of potential users.
Hypothesis 1.
TTPs differ by technology transfer direction.
Mass-marketing and target marketing strategies may also produce different TTPs. In a general marketing setting, mass marketing and target marketing have advantages and disadvantages [39]. Using a mass marketing strategy, the firm may enjoy a large number of customers at relatively low cost, but they may suffer from the disadvantage that the firm’s product or brand can experience difficulties in meeting customer needs, which causes customers to turn to other products. On the other hand, the firm using a target marketing strategy may have a stronger position in the market, as they are the right supplier for a specific group of customers, but target marketing incurs costs and increases risk if the firm only relies on one segment of the market. According to Kotler & Armstrong [39], most modern marketers believe that a more differentiated marketing (or target marketing) plan entails better performance.
Similarly, there can be advantages and disadvantages of mass marketing and target marketing in technology transfer [14]. By taking a mass-marketing approach, technology suppliers can present their offerings to a larger and wider range of potential technology users, but there may be difficulties in finding the right match in such a large number of users. The target marketing approach may reduce the risk of technology adoption by offering the right technologies to the right users, but target marketing requires extensive market analysis, which incurs costs.
There are some empirical studies regarding user targeting for technology transfer. Seok et al. [45] show that identifying potential users of technology is important for technology transfer. They first selected a technology that was developed by a Korean research institute that had not been transferred for several years, despite the institute’s efforts to license it out. They conducted a patent citation network analysis to find the user firms with the highest potential, on the basis of path dependence in technological progress. Later, their approach proved to be correct, as the technology was successfully licensed out. Park et al. [46] conducted a similar approach with Seok et al. They found that identifying and targeting specific groups of customers (using patent citation analysis) were useful for specific types of technologies.
Hypothesis 2.
TTPs differ by technology marketing strategy.
In the demand-pull model, the attributes of technology transfer are defined and/or requested by users. If the supplier of technology has capabilities for the attributes and is ready to respond to the request, then the technology can be ready for transfer. If the supplier has approached the potential user firms by market segmentation and targeting, they might be better prepared for the needs of user firms. It is then possible that the demand-pull model produces better performance when used together with target marketing.
In the supply-push model, suppliers define the attributes of technology transfer. Suppliers define attributes and initiate technology transfer because industry players either lack market knowledge, and hence awareness, of the existence of appropriate technological developments, or else their technological capabilities are insufficient to create demand [35]. Subsequently, it may be needed for a supplier of technology to explore a wider range of opportunities. For this reason, it is possible that the supply-push model can be more effective when used with mass marketing.
Therefore, we also suggest that technology transfer direction and technology marketing strategy jointly influence TTP. We offer the next hypotheses, as below.
Hypothesis 3.
TTPs are influenced by the interaction between technology transfer direction and technology marketing strategy.
Hypothesis 3-1.
For the supply-push direction, TTPs differ by technology marketing strategy.
Hypothesis 3-2.
For the demand-pull direction, TTPs differ by technology marketing strategy.

3.3. Research Method

For this study, we collected technology transfer data from a research institute in Korea (“K Institute”). The K Institute was founded in 1989 as an affiliated institute of the Ministry of Commerce and Industry. The institute aims to strengthen the capabilities of small- to medium-sized enterprises (SMEs) to support sustainable growth in the country’s manufacturing industry. The functions of the institute include developing technologies that are commonly needed by SMEs; investing in demand-oriented R&D for manufacturing technologies; assisting SMEs in utilizing technology, human resources, and infrastructure; and, technology transfer and diffusion. As the K Institute aims to support SMEs, it has about 12 sites that are distributed around the country.
The characteristics of K Institute can be summarized as a focus on SMEs and manufacturing (especially process) technology, and geographically dispersed locations. Due to these characteristics, this study does not need to consider other factors that influence technology transfer, such as user characteristics [25], technological characteristics [47], geographical proximity [48], etc. The institute specifically works with SMEs, especially in the manufacturing (especially process) technology area, so the user characteristics and technological characteristics are not very diverse. As it has about 12 sites in major industrial complexes in the country, geographic distance to user firms is not a significant issue.
The K Institute offers technology transfer in the forms of licensing, disposal (sales), investment in technology, mergers and acquisitions (M&A), etc. Among these forms, we only collected licensing cases. A majority of the institute’s technology transfer agreements are licensing (according to the technology marketing team of the institute); WIPO (the World Intellectual Property Organization) also notes that technology transfer is “generally effected by means of IP licensing agreements” [49].
The collected data covers K Institute’s technology licensing agreements during 2014–15, and each sample contains a title for the transfer project, a licensing fee, and a title of R&D program or project (by which the technology was developed). Initially, there were 704 samples. We excluded six samples that had missing information and analyzed a total of 698 cases of technology licensing.
The 698 samples were categorized into the four types of technology transfer in Figure 2: (1) mass-push, (2) mass-pull, (3) target-push, and (4) target-pull. For this task, we set some criteria, as shown below, and consulted the K Institute’s technology marketing team.
(1)
Mass-push: Cases in which technologies (usually developed from top-down R&D programs) were transferred off the shelf via mass-marketing channels, such as mass announcements, catalogues, exhibitions, etc. For example, there were cases of transferring technologies that were developed under government-planned R&D, which can be broadly used in many industry sectors, or they were developed without clear marketing perspectives and stayed on the shelf.
(2)
Mass-pull: Cases in which opportunities for technology transfer were announced via mass-marketing channels and firms accessed those opportunities. In many cases, the technologies were modified, customized, or further developed to fulfill the specific needs of technology users. For example, the K Institute announced an SME-supporting program via mass-marketing channels (without specific targets or segmentation), and some SMEs approached the program. The K Institute identified the technical problems of the firms, developed new technologies or modified existing ones, and transferred the technologies to the firms.
(3)
Target-push: Cases in which the K Institute developed technologies for a specific industry segment, designed specific offers for each segment, and licensed them in an off-the-shelf manner. For example, cases from K Institute’s Platform R&D Program fall into this category.
(4)
Target-pull: Cases in which K Institute segmented a market and targeted a specific segment. The institute surveyed or examined the needs of a specific segment and developed technologies or prepared technology transfer for the segment according to the needs or requests of the firms in the segment. In many cases, technologies were modified, customized, or further developed to fulfill the specific needs of technology users. For example, K Institutes’ order-based technology transfer programs fall into this category.
For TTP, we attempted to use two measures: technology license fees in South Korean local currency (KRW) and R&D productivity. The technology license fees were drawn from individual technology transfer cases. The R&D productivity measure was calculated by dividing the technology license fee by the direct costs. However, as it is difficult to measure direct R&D costs for each individual technology transfer case, we summed up the license fees of technologies in the same R&D project and divided the total license fees by the direct cost of the R&D project.
We employed a two-way ANOVA to analyze the data and test the hypotheses. As we compared the TTPs (measured by license fees and R&D productivity) by the groups of technology transfer cases that are shown in Figure 2, we used two-way ANOVA instead of other methods.
Our analysis was undertaken in two stages. In the first stage, we used the full data set (698 samples). In the second stage, we excluded some samples from the full data set. Among the samples in the full data set, there are some cases in which the technology license fees are notably higher than others. These cases fall into one of the four types of technology transfer in our framework. As these may cause some problems in analysis, we performed another analysis after excluding them.

4. Findings

4.1. Result from the Full Data Set

4.1.1. Descriptive Statistics

Table 1 and Table 2 show the descriptive statistics. The sample size was 698 for technology license fees in Table 1. There were 294 mass-push, 119 mass-pull, 208 target-push, and 77 target-pull types. In terms of the average technology license fee, the target-pull type was the highest (82,368,932) and the mass-pull was the lowest (10,492,276). The average technology fee of target-pull was far higher than the others.
When we used R&D productivity instead of technology license fees, the sample size was reduced to 420 (in Table 2). This is because we added all of the license fees in the same R&D project and divided the sum by the direct cost of the project (as explained in the previous section). In terms of average R&D productivity, the target-pull type was again the highest (0.989) and the other types were between 0.214 and 0.265.

4.1.2. Dependent Variable: Technology License Fee

We conducted a two-way ANOVA while using the technology license fee as a dependent variable, and the result is shown in Table 3. As shown in the table, significant main effects were obtained for both marketing (F = 17.047, p = 0.000) and direction (F = 11.853, p = 0.001). More importantly, there is a significant interaction between marketing and direction (F = 36.188, p = 0.000). Figure 3 depicts the different level of technology licensing fee by different directions and different marketing strategies.
Additionally, we conducted a nested ANOVA to examine whether marketing strategies within a technology transfer direction differentiates technology license fees. Table 4 presents the result. First, we found that there is no significant difference between marketing strategies within the push direction, F = 3.21, p = 0.074. It means that there is no significant difference between mass-marketing strategy and target marketing strategy when the technologies are transferred in the supply-push manner. By contrast, there is a significant difference between marketing strategies within the pull direction (F = 35.60, p = 0.000).

4.1.3. Dependent Variable: R&D Productivity

We conducted another two-way ANOVA using a different dependent variable—R&D productivity. Table 5 presents the result of the analysis. All of the main effects and interaction effects were significant. For marketing, the F value is 17.842 and the p value is 0.000, and for direction, the F value is 16.728 and p = 0.000. The interaction between marketing and direction is also significant (F = 21.615, p = 0.000). Figure 4 illustrates the different levels of R&D productivity by different directions and different marketing strategies.
A nested ANOVA was conducted to examine whether the R&D productivities are differentiated by marketing strategies within a technology transfer direction. As shown in Table 6, there is no significant difference between marketing strategies within the push direction (F = 0.12, p = 0.734), while there is a significant difference between marketing strategies that are within the pull direction (F = 32.29, p = 0.000). This result indicates that there is no significant difference between the marketing strategies for supply-push technology transfer, but there is a significant difference between marketing strategies for demand-pull technology transfer.

4.2. Result Excluding Order-Based Programs

4.2.1. Descriptive Statistics

We analyzed all 698 samples in the previous section. Among the samples, there are 36 cases from the K Institute’s Order-Based Program, which all fall into the category of target-pull type. The Order-Based Program produces the highest TTP among K Institute’s technology transfer programs. The licensing fees of technology transfer cases from the program are much higher than with other cases. While the mean technology licensing fee of all samples is about 27.6 million KRW, the mean of the Order-Based Program amounts to 128.8 million KRW (in Table 7). In the previous section, all of the samples from the Order-Based Program were categorized as target-pull type. Though the cases from the Order-Based Programs are typical examples of both demand-pull and target marketing technology transfer, we performed an additional analysis that excluded these 36 samples simply to see whether TTPs are still different after excluding them.
Table 8 and Table 9 summarizes the descriptive statistics. Excluding cases from the Order-Based Program, there are 662 samples for technology licensing fee and 385 for R&D productivity. The mean technology licensing fee of target-pull (29.6 million KRW) is still larger than others, but the gap has been dramatically reduced. The R&D productivity of target-pull is still three times larger.

4.2.2. Dependent Variable: Technology License Fee

Table 10 shows the results of a two-way ANOVA using the technology license fee as a dependent variable (excluding the Order-Based Program). There is no significant main effect for all of the independent variables (F = 0.237, p = 0.626 for marketing; F = 0.121, p = 0.728 for direction). However, there are significant interaction effects between the independent variables, suggesting that marketing strategy and technology transfer direction interdependently influence the technology license fee. Figure 5 depicts the technology license fee by technology transfer type.

4.2.3. Dependent Variable: R&D Productivity

In this section, R&D productivity was used as a dependent variable (excluding Order-Based Programs). Table 11 shows the results of two-way ANOVA. All of the main effects are significant. Marketing is significant at F = 15.066, p = 0.000 and direction is at F = 15.383, p = 0.000. The interaction effect between marketing and direction is also significant (F = 20.078, p = 0.000). Figure 6 illustrates the different levels of R&D productivity in this case.
Finally, we conducted a nested ANOVA to see the differences of marketing within a direction, and Table 12 summarizes the result. There is no significant difference between the marketing strategies within the push direction (F = 0.30, p = 0.584), but there is a significant difference between the marketing strategies within the pull direction (F = 24.93, p = 0.000). This result means that there is no significant difference between marketing strategies for supply-push technology transfer, but there is a significant difference between marketing strategies for demand-pull technology transfer.

4.3. Summary and Discussion

Based on the results of this study, we present the results of our hypothesis test in Table 13. First, the ANOVA results in this study reveal that the TTPs are different by direction and, on average, the TTP of demand-pull is higher than that of supply-push. Therefore, Hypothesis 1 is accepted. This result supports the argument of Hwhang and Chung [15] that the user-centric and needs-based technology transfers yield better performance. To improve TTP, it may be useful for public research institutes to employ the demand-pull model in their technology transfer practices.
Second, the result of our analysis shows that TTPs differ by marketing strategy. The ANOVA results show that there are significant differences between marketing strategies. Therefore, we partially accept the hypothesis for technology license fees and accept for R&D productivity.
Third, all of the ANOVA results show significant interaction effects between marketing and direction. Nested ANOVA results show that there are significant differences between marketing strategies within the pull direction. However, there was no significant difference between the marketing strategies within the push direction. Therefore, we accept Hypotheses 3 and 3-2, and reject Hypothesis 3-1.
These results imply that appropriate technology transfer directions and technology marketing strategies are needed if an organization wants to improve TTP. First, we agree with some studies that emphasize demand-pull technology transfer [6,14,15]. While public research institutes (especially in Korea) have relied on supply-push technology transfer and have suffered from low TTP, demand-pull technology transfer can be a useful alternative. However, demand-pull technology transfer may not always produce better performance when used alone. We argue that demand-pull should be used with appropriate technology marketing strategies, and we suggest that target marketing strategies (such as market segmentation and customer targeting) can be effectively used.

5. Conclusions

The purpose of this paper was to examine TTPs in public research institutes by technology transfer directions and marketing strategies. In doing so, we introduced the notions of technology marketing strategies, such as mass marketing and target marketing, and examined the role of those technology marketing strategies for TTPs. We collected the K Institute’s technology transfer data from 2014 to 2015 and conducted a two-way ANOVA to analyze the data set.
The results show that TTPs differ by technology transfer directions and technology marketing strategies. Moreover, we find that the demand-pull model yields higher TTP, especially when the model is associated with target marketing rather than mass marketing. This result implies that marketing strategies, such as market segmentation and customer targeting, are needed if a research institute wants to improve TTP by implementing the demand-pull technology transfer model.
Our study is meaningful in several ways. First, it is one of the few studies regarding the supply-push and demand-pull technology transfer models. The literature on this topic has more than 20 years of history, but it has only recently begun to gain popularity among scholars. While many extant studies argue that one type of technology transfer is better than the other (in a specific environment), the result of our analysis indicates that technology transfer can be improved when the directions of technology transfer (supply-push or demand-pull) are jointly considered with technology marketing strategies. Moreover, this is an empirical study that uses quantitative technology transfer data, while other studies rely on case studies. Second, we attempted to adopt a marketing perspective in the study of technology transfer. We contributed to the field of so-called technology marketing. Third, our study is one of few studies addressing public research institutes’ technology transfer. To our knowledge, most of the literature addresses university technology transfer. As public research institutes are also important knowledge-creating organizations (especially in some countries, such as Korea), the result of our study may provide practical implications for them.
However, there are some weaknesses in our study. We only analyzed one organization’s case and the data set from that organization is old and narrow in terms of timeframe. Therefore, generalizability is one of the limitations. To overcome this limitation, some statistical approaches can be used, such as random sampling of patents and examining the performance of the patents, though it requires enormous time and cost. Otherwise, further studies utilizing other cases can be attempted. In addition, we suffered difficulties in categorizing samples into our research framework. The conceptual types of technology transfer (e.g., mass-push, mass-pull, target-push, and target-pull) are understandable, but it was not easy to apply those types to real cases. Although we attempted to overcome the problem by consulting the technology marketing team at K Institute, we suggest that the conceptual framework and methods should be further refined.

Author Contributions

Conceptualization, W.J.C. and I.J.; methodology, W.J.C. and I.J.; data preparation, W.J.C.; formal analysis, W.J.C.; investigation, I.J.; supervision, I.J.; writing—original draft preparation, W.J.C.; writing—review and translation, I.J.; Project Administration, I.J. Funding acquisition, I.J.

Funding

This research was funded by Ministry of Science and ICT, 2017K000455.

Acknowledgments

Byung Hui Jo, director of Technology Marketing Team at KITECH, and his team members provided data and advice for this research.

Conflicts of Interest

The authors declare no conflict of interest.

References

  1. Meadows, D.H.; Meadows, D.L.; Randers, J.; Behrens, W.W., III. Limits to Growth; Universe Books: New York, NY, USA, 1972. [Google Scholar]
  2. Cole, H.S.D.; Freeman, C.; Jahoda, M.; Pavitt, K. (Eds.) Thinking about the Future: A Critique of the Limits to Growth; Chatto and Windus: London, UK, 1973. [Google Scholar]
  3. Freeman, C. The Greening of Technology and Models of Innovation. Technol. Forecast. Soc. Chang. 1996, 53, 27–39. [Google Scholar] [CrossRef]
  4. Perez, C. Technological Revolutions and Financial Capital: The Dynamics of Bubbles and Golden Ages; Edward Elgar: Cheltenham, UK, 2002. [Google Scholar]
  5. Lane, J.P. Understanding Technology Transfer. Assist. Technol. 1999, 11, 5–19. [Google Scholar] [CrossRef]
  6. Bauer, S.M. Demand Pull Technology Transfer Applied to the Field of Assistive Technology. J. Technol. Transf. 2003, 28, 285–303. [Google Scholar] [CrossRef]
  7. Dubickis, M.; Gaile-Sarkane, E. Perspectives on Innovation and Technology Transfer. Procedia Soc. Behav. Sci. 2015, 213, 965–970. [Google Scholar] [CrossRef] [Green Version]
  8. Lee, J.; Kang, J.-H.; Jun, S.; Lim, H.; Jang, D.; Park, S. Ensemble Modeling for Sustainable Technology Transfer. Sustainability 2018, 10, 2278. [Google Scholar] [CrossRef]
  9. MSIT. The Result of 2016 R&D Activity Survey; Ministry of Science and ICT: Seoul, Korea, 2017.
  10. NSTC. The Fifth National Technology Transfer and Commercialization Plan; National Science and Technology Council: Seoul, Korea, 2014. [Google Scholar]
  11. Yoo, H. A Study on Status Analysis and Enhancing the Utilization of the Unused Patents in Universities and Public Research Institutes; KISTEP: Seoul, Korea, 2015. [Google Scholar]
  12. Kirchberger, M.A.; Pohl, L. Technology Commercialization: A Literature Review of Success Factors and Antecedents across Different Context. J. Technol. Transf. 2016, 41, 1077–1112. [Google Scholar] [CrossRef]
  13. Miller, K.; McAdam, R.; McAdam, M. A Systemic Literature Review of University Technology Transfer from a Quadruple Helix Perspective: Toward a Research Agenda. R&D Manag. 2018, 48, 1077–1112. [Google Scholar]
  14. Piper, W.S.; Naghshpour, S. Government Technology Transfer: The Effective Use of Both Push and Pull Marketing Strategies. Int. J. Technol. Manag. 1996, 12, 85–94. [Google Scholar]
  15. Hwhang, H.-D.; Chung, S.-Y. A Measure on Technology Transfer Activation of Government-Sponsored Research Institutes Focusing on Companies in Demand: Focusing on the Cases in the K Research Institute. J. Korea Technol. Innov. Soc. 2015, 18, 318–337. [Google Scholar]
  16. Carr, R.K. Doing Technology Transfer in Federal Laboratories (Part 1). J. Technol. Transfer 1992, 17, 8–23. [Google Scholar] [CrossRef]
  17. Fuelner, E. Technology Transfer and Information Science: Vanguards of the 21st Century. T’squared 1992, 17, 1. [Google Scholar]
  18. Foster, R.N. Organize for Technology Transfer. Harvard Business Review 1971, 49, 110–120. [Google Scholar]
  19. Reisman, A. Technology Transfer: A Taxonomic View. J. Technol. Transf. 1989, 15, 31–36. [Google Scholar] [CrossRef]
  20. Autio, E.; Laamanen, T. Measurement and Evaluation of Technology Transfer: Review of Technology Transfer Mechanisms and Indicators. Technol. Manag. 1995, 10, 643–664. [Google Scholar]
  21. Bozeman, B. Technology Transfer and Public Policy: A Review of Research and Theory. Res. Policy 2000, 29, 627–655. [Google Scholar] [CrossRef]
  22. Li, F.; Zhang, S.; Jin, Y. Sustainability of University Technology Transfer: Mediating Effect of Inventor’s Technology Service. Sustainability 2018, 10, 2085. [Google Scholar] [CrossRef]
  23. Santoro, M.D.; Bierly, P.E., III. Facilitators of Knowledge Transfer in University-Industry Collaborations: A Knowledge-Based Perspective. IEEE Trans. Eng. Manage. 2006, 53, 495–507. [Google Scholar] [CrossRef]
  24. Kim, L. Imitation to Innovation: The Dynamics of Korea’s Technological Learning; Harvard Business School Press: Boston, MA, USA, 1997. [Google Scholar]
  25. Battistella, C.; De Toni, A.F.; Pillon, R. Inter-organisational Technology/Knowledge Transfer: A Framework from Critical Literature Review. J. Technol. Transf. 2016, 41, 1195–1234. [Google Scholar] [CrossRef]
  26. Kim, B.-K.; Cho, H.-J.; Og, J.-Y. A Study on the Technology Commercialization Process and Performance of Public Research Institutes in Korea using the Structural Equation Model. J. Korea Technol. Innov. Soc. 2011, 14, 552–577. [Google Scholar]
  27. Yoon, C. A Study on the Management System of Special Organization for University Technology Transfer and Commercialization. J. Korea Technol. Innov. Soc. 2013, 16, 1055–1089. [Google Scholar]
  28. Lee, Y.-J. Strategies for the Successful Technology Transfer from Public Research Institutes in Korea. J. Technol. Innov. 2008, 16, 141–163. [Google Scholar]
  29. Chung, D.B. The Effects of Performance Management & Application Capabilities and Activities on Technology Transfer from Public Research Institutes in Korea. J. Technol. Innov. 2013, 21, 199–223. [Google Scholar]
  30. Chung, H.; Lee, H.-B. The Impact of Organizational Resources on the Technology Commercialization Capabilities: Focus on the Mediating Effects of Absorption Capacity and Innovative Capabilities and Moderating Effects of Complementary Assets. J. Ind. Econ. Bus. 2018, 28, 2277–2301. [Google Scholar]
  31. Lane, J.P. The State of the Science in Technology Transfer: Implications for the Field of Assistive Technology. J. Technol. Transf. 2003, 28, 333–354. [Google Scholar] [CrossRef]
  32. Lane, J.P.; Leahy, J.A.; Bauer, S.M. Accomplishing Technology Transfer: Case-Based Lessons of What Works and What Does Not. Assist. Technol. 2003, 15, 69–88. [Google Scholar] [CrossRef] [PubMed]
  33. Lane, J.P. Delivering on the D in R&D: Recommendations for Increasing Transfer Outcomes from Development Projects. Assist. Technol. Outcomes Benefits 2008, 2008 Fall Special Issue, 1–60. [Google Scholar]
  34. Bauer, S.M.; Flagg, J.L. Technology Transfer and Technology Transfer Intermediaries. Assist. Technol. Outcomes Benefits 2010, 6, 129–150. [Google Scholar]
  35. Hine, D.C.; Parker, R.; Ireland, D. The Knowledge Exchange Intermediary as Service Provider: A Discussion and an Australian Case. Serv. Ind. J. 2010, 30, 713–729. [Google Scholar] [CrossRef]
  36. Jun, Y.; Ji, I. Demand-pull Technology Transfer and Needs-Articulation of Users: A Preliminary Study. Procedia Comput. Sci. 2016, 91, 287–295. [Google Scholar] [CrossRef]
  37. Lim, I.-J.; Lee, J. Study on Technology Marketing in Public Research Institutes: Focusing on Marketing Mix. Asia-Pac. J. Multimed. Serv. Converg. Art Hum. Sociol. 2018, 8, 333–342. [Google Scholar]
  38. Sung, T.K. Technology Marketing as a Tool of Commercialization: Definition, Strategy, and Process. J. Intellect. Prop. 2012, 7, 101–129. [Google Scholar]
  39. Kotler, P.; Armstrong, G. Principles of Marketing, 12th ed.; Pearson Education: Upper Saddle River, NJ, USA, 2008. [Google Scholar]
  40. Kotler, P. A Generic Concept of Marketing. J. Mark. 1972, 36, 46–54. [Google Scholar] [CrossRef]
  41. Lewison, D.M.; Haws, J.M. Student Target Marketing Strategies for Universities. J. Coll. Adm. 2007, 196, 14–19. [Google Scholar]
  42. Kotler, P. Strategies for Introducing Marketing into Nonprofit Organizations. J. Mark. 1979, 43, 37–44. [Google Scholar] [CrossRef]
  43. Vincent, L.H. Marketing Strategy Considerations in the Commercialization of New Technologies: An Overview and Framework for Strategy Development. In Technological Innovation: Generating Economic Results; Emerald Group Publishing Limited: Bingley, UK, 2015; pp. 173–200. [Google Scholar] [CrossRef]
  44. Yang, D.-W.; Kim, S.-J. The Study on Tech Transfer Problems of R&D Institutions. Korean J. Bus. Adm. 2008, 21, 205–227. [Google Scholar]
  45. Seok, M.S.; Jo, B.; Ji, I. An Application of Patent Citation Network Analysis for Technology Marketing: A Case of a Public Research Institute. J. Korea Acad.-Ind. Coop. Soc. 2015, 16, 3210–3219. [Google Scholar] [CrossRef] [Green Version]
  46. Park, T.-Y.; Lim, H.; Ji, I. Identifying Potential Users of Technology for Technology Transfer Using Patent Citation Analaysis: A Case Analysis of a Korean Research Institute. Scientometrics 2018, 116, 1541–1558. [Google Scholar] [CrossRef]
  47. Ardito, L. Markets for University Inventions: The Role of Patents’ Underlying Knowledge in University-to-Industry Technology Commercialization. Int. J. Technol. Manag. 2018, 78, 9–27. [Google Scholar] [CrossRef]
  48. Ardito, L.; Natalicchio, A.; Petruzzelli, A.M.; Garavelli, A.C. Organizaing for Continuous Technology Acquisition: The Role of R&D Geographic Dispersion. R&D Manag. 2017, 48, 165–176. [Google Scholar]
  49. WIPO Magazine: Technology Transfer and Development. Available online: https://www.wipo.int/wipo_magazine/en/2006/05/article_0005.html (accessed on 19 February 2019).
Figure 1. Supply-push vs. Demand-pull Technology Transfer (Source: [5]).
Sustainability 11 02005 g001
Figure 2. Research Framework: Types of Technology Transfer.
Sustainability 11 02005 g002
Figure 3. Difference in Technology License Fees by Technology Transfer Types.
Sustainability 11 02005 g003
Figure 4. Different R&D Productivity by Technology Transfer Types.
Sustainability 11 02005 g004
Figure 5. Different Technology License Fee by Technology Transfer Types, Excl. OBP.
Sustainability 11 02005 g005
Figure 6. Different Levels of R&D Productivity by Technology Transfer Types, Excl. OBP.
Sustainability 11 02005 g006
Table 1. Descriptive Statistics—Technology License Fee (KRW).
Marketing.DirectionMeanStd. Dev.N
MassPush28,721,493 8.66 × 107294
Pull10,492,276 2.88 × 107119
Sub-total23,469,007 7.51 × 107413
TargetPush15,352,748 1.47 × 107208
Pull82,368,932 1.77 × 10777
Sub-total33,458,875 9.68 × 107285
TotalPush23,182,252 6.73 × 107502
Pull38,729,534 1.18 × 107196
Total27,547,964 8.47 × 107698
Table 2. Descriptive Statistics—R&D Productivity (KRW).
MarketingDirectionMeanStd. Dev.N
MassPush0.2650.792163
Pull0.2140.324102
Sub-total0.2460.652265
TargetPush0.2280.27494
Pull0.9891.71361
Sub-total0.5281.153155
TotalPush0.2520.651257
Pull0.5041.138163
Total0.3500.880420
Table 3. Test of Between-Subjects Effects (Dependent Variable: Technology License Fee).
Sum of SquaresdfMean SquareFSig.
Marketing1.157 × 101711.157 × 101717.0470.000
Direction8.041 × 101618.041 × 101611.8530.001
Marketing × Direction2.455 × 101712.455 × 101736.1880.000
Error4.708 × 10186946.784 × 1015--
Table 4. Nested ANOVA (Dependent Variable: Technology License Fee).
Sum of SquaresdfMean SquareFSig.
Direction8.041 × 101618.041 × 101611.8530.001
Marketing within Push Direction2.18 × 101612.18 × 10163.210.074
Marketing within Pull Direction2.42 × 101712.42 × 101735.600.000
Model2.97 × 101719.91 × 101514.610.000
Total5.01 × 10186977.18 × 1018--
Table 5. Test of Between-Subjects Effects (Dependent Variable: R&D Productivity).
Sum of SquaresdfMean SquareFSig.
Marketing12.672112.67217.8420.000
Direction11.728111.72816.5120.000
Marketing × Direction15.352115.35221.6150.000
Error295.4694160.710--
Table 6. Nested ANOVA (Dependent Variable: R&D Productivity).
Sum of SquaresdfMean SquareFSig.
Direction11.73111.7316.510.000
Marketing within Push Direction0.0810.080.120.734
Marketing within Pull Direction22.93122.9332.290.000
Model29.3739.7913.780.000
Total324.844190.78--
Table 7. Mean Technology Licensing Fee of Order-Based Program (KRW).
NMeanStd. Dev.
Order-Based Program361.288 × 1082.49 × 108
All6982.755 × 1088.47 × 107
Table 8. Descriptive Statistics Excluding the Order-Based Program—Technology License Fee (KRW).
MarketingDirectionMeanStd. Dev.N
MassPush2.872 × 1078.664 × 107294
Pull1.335 × 1072.373 × 107210
Sub-total2.231 × 1076.829 × 107504
TargetPush1.866 × 1072.096 × 107122
Pull2.96 × 1073.197 × 10736
Sub-total2.115 × 1072.424 × 107158
TotalPush2.577 × 1077.382 × 107416
Pull1.573 × 1072.568 × 107246
Total2.204 × 1076.074 × 107662
Table 9. Descriptive Statistics Excluding the Order-Based Program—R&D Productivity.
MarketingDirectionMeanStd. Dev.N
MassPush0.2650.792163
Pull0.2140.324102
Sub-total0.2460.652265
TargetPush0.2110.20888
Pull0.9801.81632
Sub-total0.4161.004120
TotalPush0.2460.650251
Pull0.3970.978134
Total0.2990.782385
Table 10. Test of Between-Subjects Effects Excl. OBP * (Dependent Variable: Technology License Fee).
Sum of SquaresdfMean SquareFSig.
Marketing8.676 × 101418.676 × 10140.2370.626
Direction4.418 × 101414.418 × 10140.1210.728
Marketing × Direction1.569 × 101411.569 × 10144.2900.039
Error2.406 × 10146583.657 × 1014--
* OBP: Order-Based Program.
Table 11. Test of Between-Subjects Effects, Excl. OBP * (Dependent Variable: R&D Productivity).
Sum of SquaresdfMean SquareFSig.
Marketing8.62718.62715.0660.000
Direction8.80818.80815.3830.000
Marketing×Direction11.497111.49720.0780.000
Error218.1583810.573--
Table 12. Nested ANOVA, Excl. OBP (Dependent Variable: R&D Productivity).
Sum of SquaresdfMean SquareFSig.
Direction8.8118.8115.380.000
Marketing within Push Direction0.1710.170.300.584
Marketing within Pull Direction14.28114.2824.930.000
Model16.4435.489.570.000
Total234.603840.61--
* OBP: Order-Based Program.
Table 13. Hypotheses Test.
HypothesisDependent Variable
Tech. License FeeR&D Productivity
Hypothesis 1. TTPs differ by technology transfer direction. AcceptedAccepted
Hypothesis 2. TTPs differ by technology marketing strategy. AcceptedAccepted
Hypothesis 3. TTPs are influenced by the interaction between technology transfer direction and technology marketing strategy.AcceptedAccepted
Hypothesis 3-1. For supply-push direction, TTPs differ by technology marketing strategy. RejectedRejected
Hypothesis 3-2. For demand-pull direction, TTPs differ by technology marketing strategy. AcceptedAccepted

