Moderating Effects of Firm Size and Leverage on the Working Capital Finance–Profitability Relationship: Evidence from China


Abstract
:1. Introduction
2. WCF, Profitability, Size, and Leverage
2.1. WCF and Firm Profitability
2.2. WCF and Profitability Under the Moderating Role of Firm Size
2.3. WCF and Profitability Under the Moderating Role of Leverage
3. Empirical Model and Variables
3.1. Firm Size
3.2. Leverage
3.3. Data and Sample
4. Analysis and Results
4.1. Descriptive Statistics
4.2. Correlation Matrix and Variance Inflation Factor (VIF)
4.3. WCF and Return on Equity
Robustness of the First Hypothesis
4.4. WCF and ROE Under the Moderating Role of Firm Size
4.5. WCF and ROE under the Moderating Role of Leverage
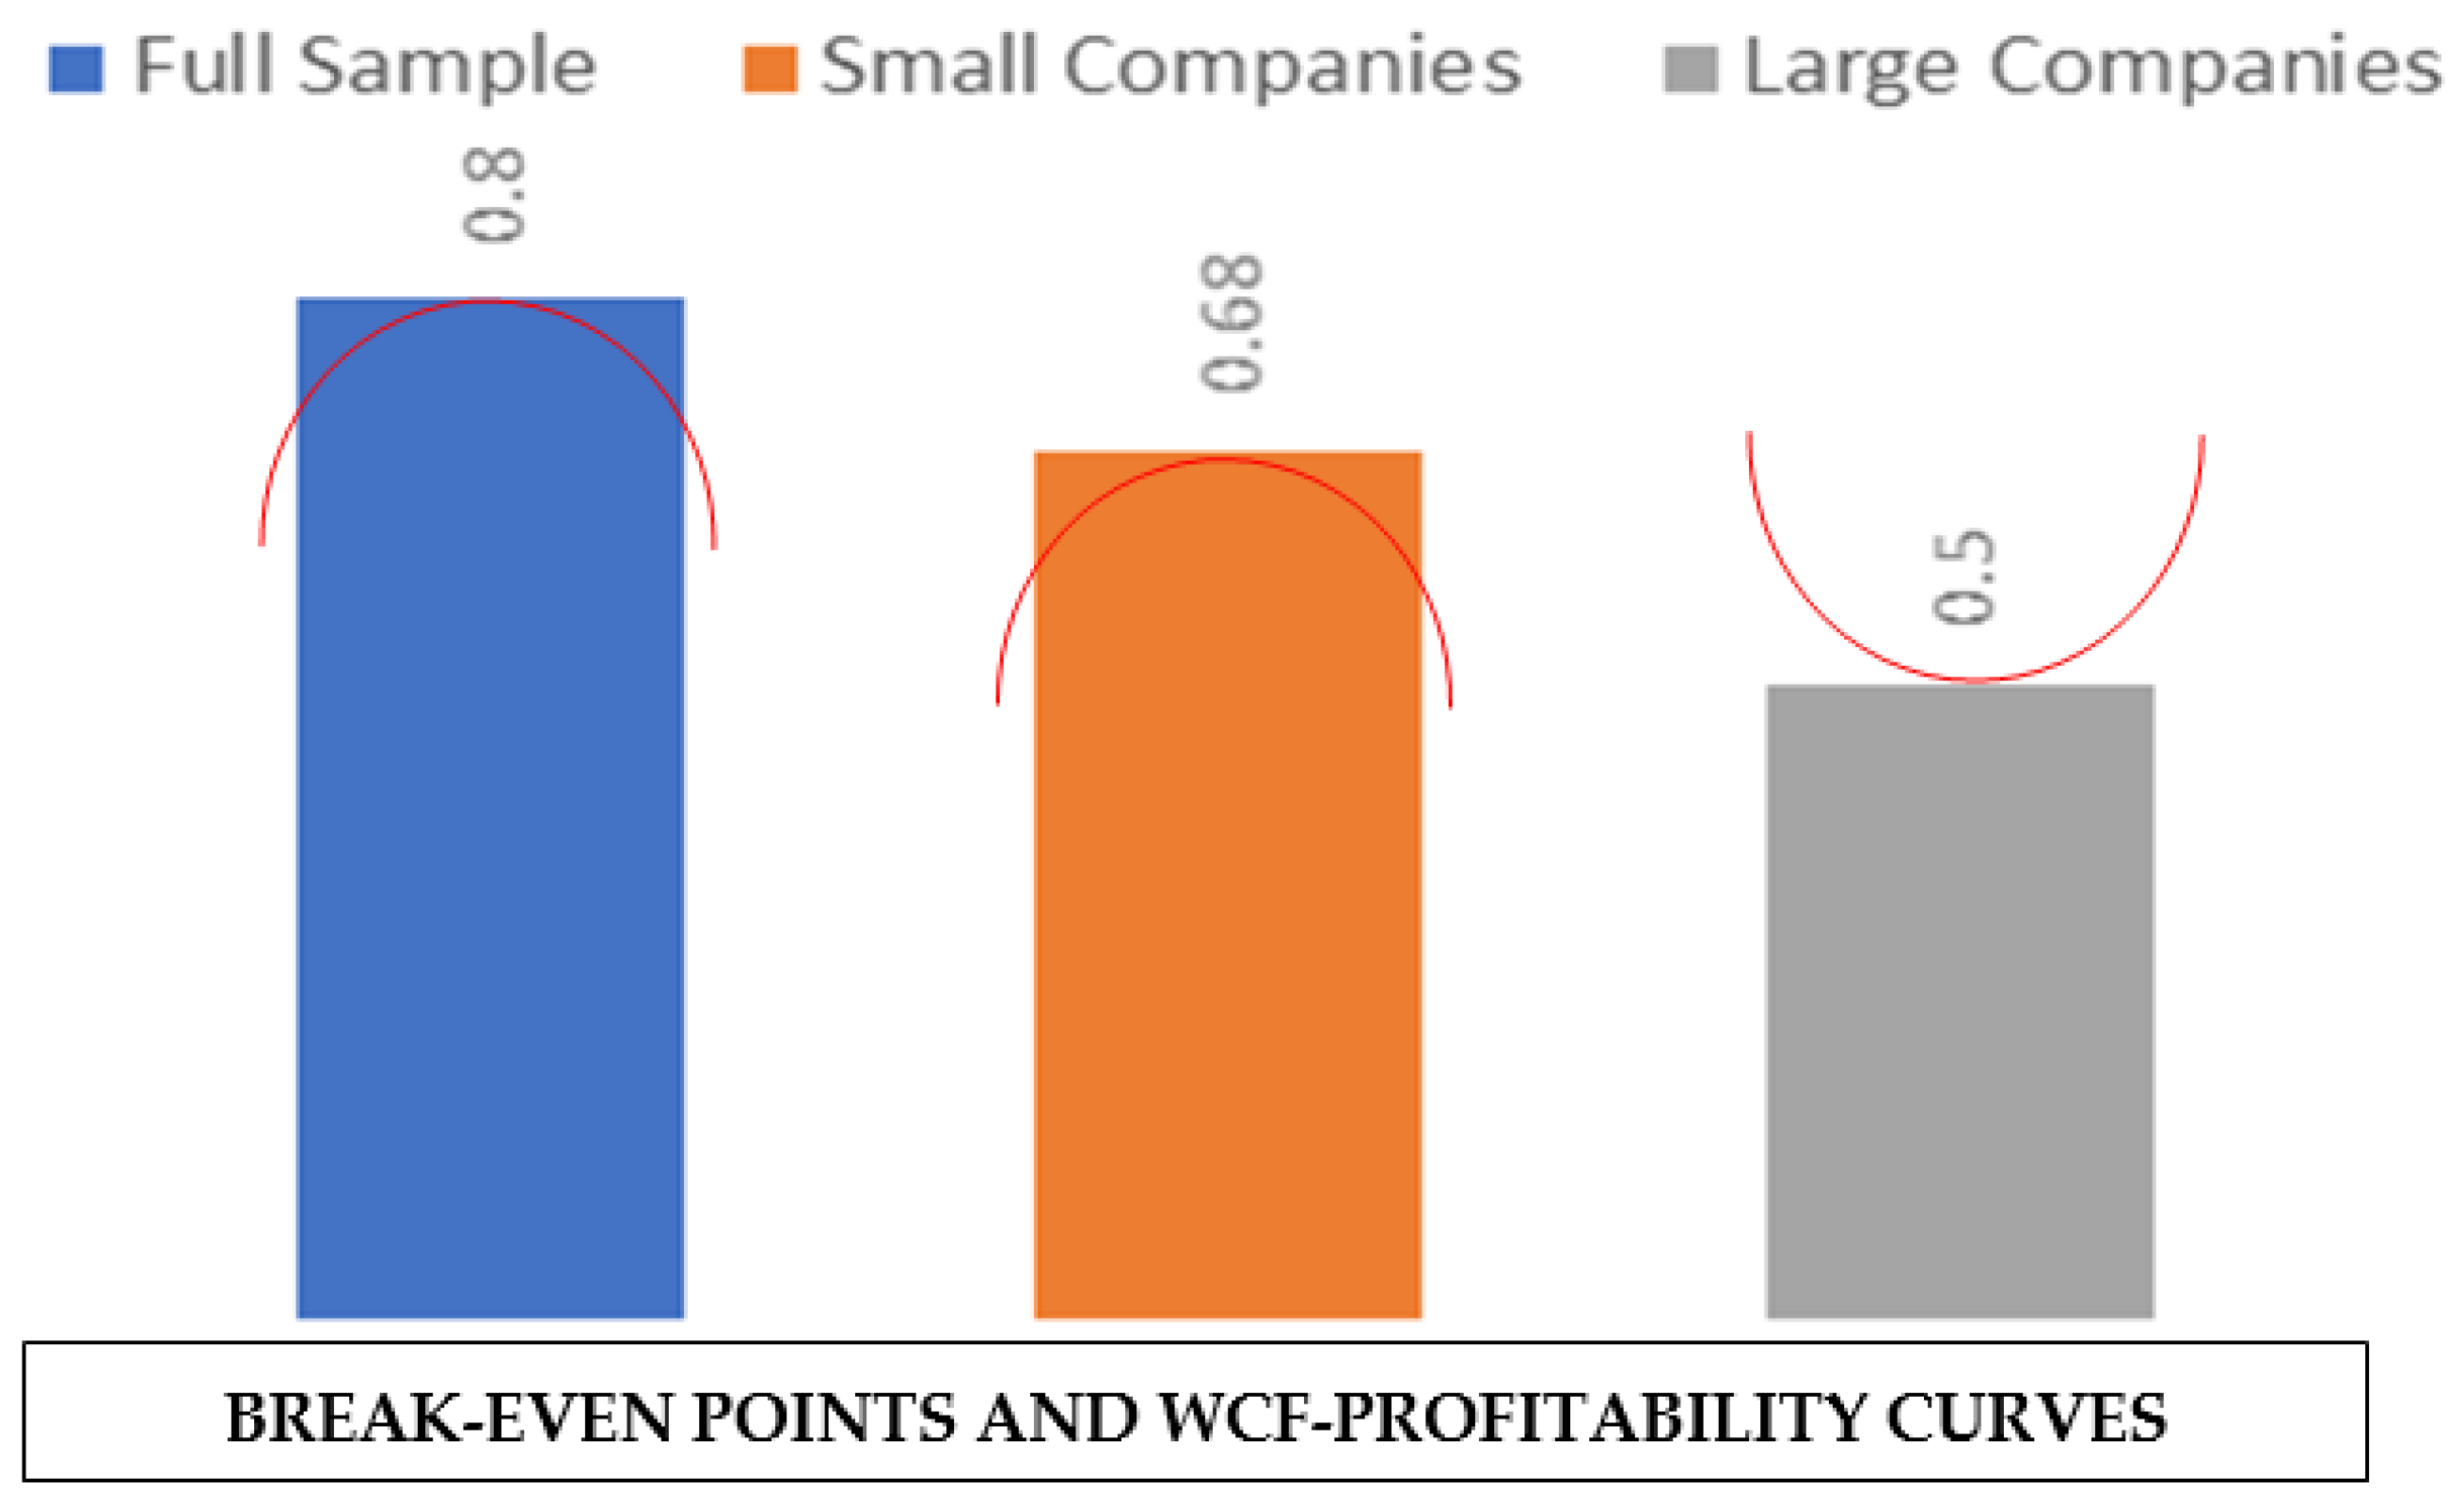
4.6. Changes in WCF–Profitability Break-Even Point under the Moderating Effects of Firm Size and Leverage
5. Conclusions
Author Contributions
Funding
Conflicts of Interest
References
- Jiang, W.; Lu, M.; Shan, Y.; Zhu, T. Evidence of Avoiding Working Capital Deficits in Australia. Aust. Account. Rev. 2016, 26, 107–118. [Google Scholar] [CrossRef]
- Jamalinesari, S.; Soheili, H. The Relationship between the Efficiency of Working Capital Management Companies and Corporate Rule in Tehran Stock Exchange. Procedia Soc. Behav. Sci. 2015, 205, 499–504. [Google Scholar] [CrossRef] [Green Version]
- Tran, H.; Abbott, M.; Jin Yap, C. How does working capital management affect the profitability of Vietnamese small- and medium-sized enterprises? J. Small Bus. Enterp. Dev. 2017, 24, 2–11. [Google Scholar] [CrossRef]
- Chiou, J.-R.; Cheng, L.; Wu, H.-W. The determinants of working capital management. J. Am. Acad. Bus. 2006, 10, 149–155. [Google Scholar]
- Boțoc, C.; Anton, S.G. Is profitability driven by working capital management? evidence for high-growth firms from emerging Europe. J. Bus. Econ. Manag. 2017, 18, 1135–1155. [Google Scholar] [CrossRef]
- Gao, J.; Wang, J. Is Working Capital Information Useful for Financial Analysts? Evidence from China. Emerg. Mark. Financ. Trade 2017, 53, 1135–1151. [Google Scholar] [CrossRef]
- Enqvist, J.; Graham, M.; Nikkinen, J. The impact of working capital management on firm profitability in different business cycles: Evidence from Finland. Res. Int. Bus. Financ. 2014, 32, 36–49. [Google Scholar] [CrossRef]
- Amelia, M.; Paulo, P.; Gama, M. Working capital management and SMEs profitability: Portuguese evidence. Int. J. Manag. Financ. 2015, 11, 183–191. [Google Scholar]
- Tahir, M.; Anuar, M.B.A. The determinants of working capital management and firms performance of textile sector in pakistan. Qual. Quant. 2016, 50, 605–618. [Google Scholar] [CrossRef]
- Vahid, T.K.; Elham, G.; Mohsen, A.K.; Mohammadreza, E. Working Capital Management and Corporate Performance: Evidence from Iranian Companies. Procedia Soc. Behav. Sci. 2012, 62, 1313–1318. [Google Scholar] [CrossRef] [Green Version]
- Abuzayed, B. Working capital management and firms’ performance in emerging markets: The case of Jordan. Int. J. Manag. Financ. 2012, 8, 155–179. [Google Scholar] [CrossRef]
- Mun, S.G.; Jang, S.C.S. Working capital, cash holding, and profitability of restaurant firms. Int. J. Hosp. Manag. 2015, 48, 1–11. [Google Scholar] [CrossRef]
- Knauer, T.; Wöhrmann, A. Working capital management and firm profitability. J. Manag. Control 2013, 24, 77–87. [Google Scholar] [CrossRef]
- Masri, H.; Abdulla, Y. A multiple objective stochastic programming model for working capital management. Technol. Forecast. Soc. Chang. 2018, 131, 141–146. [Google Scholar] [CrossRef]
- Akinlo, O.O. Determinants of working capital requirements in selected quoted companies in Nigeria. J. Afr. Bus. 2012, 13, 40–50. [Google Scholar] [CrossRef]
- Wasiuzzaman, S. Working capital and firm value in an emerging market. Int. J. Manag. Financ. 2015, 11, 60–79. [Google Scholar] [CrossRef]
- Baños-Caballero, S.; García-Teruel, P.J.; Martínez-Solano, P. Working capital management, corporate performance, and financial constraints. J. Bus. Res. 2014, 67, 332–338. [Google Scholar] [CrossRef]
- Ben-Nasr, H. State and foreign ownership and the value of working capital management. J. Corp. Financ. 2016, 41, 217–240. [Google Scholar] [CrossRef]
- Singh, H.P.; Kumar, S. Working capital requirements of manufacturing SMEs: Evidence from emerging economy. Rev. Int. Bus. Strateg. 2017, 27, 369–385. [Google Scholar] [CrossRef]
- Díaz-Díaz, N.L.; García-Teruel, P.J.; Martínez-Solano, P. Debt maturity structure in private firms: Does the family control matter? J. Corp. Financ. 2016, 37, 393–411. [Google Scholar] [CrossRef]
- De Almeida, J.R.; Eid, W. Access to finance, working capital management and company value: Evidences from Brazilian companies listed on BM & FBOVESPA. J. Bus. Res. 2014, 67, 924–934. [Google Scholar]
- Dalci, I.; Ozyapici, H. Working capital management policy in health care: The effect of leverage. Health Policy (N. Y.) 2018, 122, 1266–1272. [Google Scholar] [CrossRef] [PubMed]
- Baños-Caballero, S.; GARCÍA-TERUEL, P.J.; MARTÍNEZ-SOLANO, P. Financing of working capital requirement, financial flexibility and SME performance. J. Bus. Econ. Manag. 2016, 17, 1189–1204. [Google Scholar] [CrossRef]
- Ozkan, A. Determinants of capital structure and adjustment to long run target: Evidence from UK company panel data. J. Bus. Financ. Account. 2001, 28, 175–198. [Google Scholar] [CrossRef]
- Panda, A.K.; Nanda, S. Working capital financing and corporate profitability of Indian manufacturing firms. Manag. Decis. 2018, 56, 441–457. [Google Scholar] [CrossRef]
- Ding, S.; Guariglia, A.; Knight, J. Investment and financing constraints in China: Does working capital management make a difference? J. Bank. Financ. 2013, 37, 1490–1507. [Google Scholar] [CrossRef] [Green Version]
- Modigliani, F.; Miller, M.H. The Cost of Capital, Corporation Finance and THeory of Investment. Am. Econ. Rev. 1958, 48, 261–297. [Google Scholar]
- García-Teruel, P.J.; Martínez-Solano, P. Ownership structure and debt maturity: New evidence from Spain. Rev. Quant. Financ. Account. 2010, 35, 473–491. [Google Scholar] [CrossRef]
- Jun, S.-G.; Jen, F.C. Trade-off model of debt maturity structure. Rev. Quant. Financ. Account. 2003, 20, 5–34. [Google Scholar] [CrossRef]
- Petersen, M.A.; Rajan, R.G. The benefits of lending relationships: Evidence from small business data. J. Financ. 1994, 49, 3–37. [Google Scholar] [CrossRef]
- Barclay, M.J.; Smith, C.W., Jr. The Maturity Structure of Corporate Debt. J. Financ. 1995, 50, 609–631. [Google Scholar] [CrossRef]
- Kale, J.R.; Noe, T.H. Risky debt maturity choice in a sequential game equilibrium. J. Financ. Res. 1990, 13, 155–166. [Google Scholar] [CrossRef]
- Fazzari, S.M.; Petersen, B.C. Working capital and fixed investment: new evidence on financing constraints. RAND J. Econ. 1993, 24, 328–342. [Google Scholar] [CrossRef]
- Niskanen, J.; Niskanen, M. The determinants of corporate trade credit policies in a bank-dominated financial environment: The case of Finnish small firms. Eur. Financ. Manag. 2006, 12, 81–102. [Google Scholar] [CrossRef]
- Jordan, J.; Lowe, J.; Taylor, P. Strategy and financial policy in UK small firms. J. Bus. Financ. Account. 1998, 25, 1–27. [Google Scholar] [CrossRef]
- Caballero, B.-S.; Martínez, S.P.; García, T.P. Working capital management in SMEs. Account. Financ. 2010, 50, 511–527. [Google Scholar] [CrossRef]
- Nyeadi, J.D.; Sare, Y.A.; Aawaar, G. Determinants of working capital requirement in listed firms: Empirical evidence using a dynamic system GMM. Cogent Econ. Financ. 2018, 6, 1–14. [Google Scholar] [CrossRef]
- Aregbeyen, O. The effects of working capital management on the profitability of Nigerian manufacturing firms. J. Bus. Econ. Manag. 2013, 14, 520–534. [Google Scholar] [CrossRef]
- Dang, C.; Li, Z.F.; Yang, C. Measuring Firm Size in Empirical Corporate Finance. J. Bank. Financ. 2017, 86, 159–176. [Google Scholar] [CrossRef]
- Wintoki, M.B.; Linck, J.S.; Netter, J.M. Endogeneity and the Dynamics of Corporate Governance. J. Financ. Econ. 2012, 105, 581–606. [Google Scholar] [CrossRef]
- Li, F. Endogeneity in CEO power: A survey and experiment. Invest. Anal. J. 2016, 45, 149–162. [Google Scholar] [CrossRef]
- Arellano, M.; Bond, S. Some tests of specification foSome Tests of Specification for Panel Data: Monte Carlo Evidence and an Application to Employment Equations. Rev. Econ. Stud. 1991, 58, 277–297. [Google Scholar] [CrossRef]
- Ullah, S.; Akhtar, P.; Zaefarian, G. Dealing with endogeneity bias: The generalized method of moments (GMM) for panel data. Ind. Mark. Manag. 2018, 71, 69–78. [Google Scholar] [CrossRef]
- CSMAR. The CSMAR Economic and Financial Research Database. Available online: http://www.csmar.com/ (accessed on 29 March 2019).
- Studenmund, A.H.; Cassidy, H.J. Using Econometrics: A Practical Guide; Addison-Wesley Educational Publishers: Boston, MA, USA, 1992. [Google Scholar]
- Ghosh, A.; Moon, D. Corporate debt financing and earnings quality. J. Bus. Financ. Account. 2010, 37, 538–559. [Google Scholar] [CrossRef]


| Variable | N | Sum | Mean | Median | SD | Min | Max |
|---|---|---|---|---|---|---|---|
| ROE | 12,609 | 3842 | 0.305 | 0.305 | 0.475 | −2.816 | 3.041 |
| WCF | 12,609 | 4631 | 0.367 | 0.367 | 0.252 | 0.00432 | 1.000 |
| WCF2 | 12,609 | 2505 | 0.199 | 0.199 | 0.232 | 1.87 × 10⁻⁵ | 0.999 |
| Size | 12,609 | 119,224 | 9.455 | 9.455 | 0.512 | 7.580 | 11.54 |
| Growth | 12,609 | 28,303 | 2.245 | 2.245 | 3.552 | −0.937 | 55.39 |
| Leverage | 12,609 | 5684 | 0.451 | 0.451 | 0.205 | 0.0188 | 7.872 |
| ROE | WCF | WCF2 | Size | Growth | Leverage | |
|---|---|---|---|---|---|---|
| ROE | 1 | |||||
| WCF | −0.174 *** | 1 | ||||
| WCF2 | −0.150 *** | 0.957 *** | 1 | |||
| Size | 0.215 *** | −0.0489 *** | −0.0453 *** | 1 | ||
| Growth | 0.225 *** | 0.0135 | 0.0346 *** | 0.103 *** | 1 | |
| Leverage | −0.207 *** | 0.393 *** | 0.350 *** | 0.261 *** | −0.0372 *** | 1 |
| Variable | VIF | 1/VIF |
|---|---|---|
| WCF | 1.22 | 0.818654 |
| Size | 1.12 | 0.890622 |
| Growth | 1.02 | 0.982236 |
| Leverage | 1.31 | 0.076497 |
| Variables | Equation (1) | Equation (4) |
|---|---|---|
| WCF | 0.829 *** | |
| (0.160) | ||
| WCF2 | −0.514 *** | |
| (0.120) | ||
| WCF(0, 0.80) | 0.422 *** | |
| (0.079) | ||
| WCF(0.80, max) | −0.547 *** | |
| (0.233) | ||
| Size | 1.197 *** | 1.208 *** |
| (0.087) | (0.087) | |
| Growth | 0.022 *** | 0.022 *** |
| (0.004) | (0.004) | |
| Leverage | −2.540 *** | −2.536 *** |
| (0.231) | (0.230) | |
| Constant | −10.506 *** | −10.562 *** |
| (0.833) | (0.831) | |
| Observations | 12,609 | 12,609 |
| Wald Test | 538.44 | 540.52 |
| Sargan Test | 232.83 | 235.31 |
| AR (1) | −7.29 | −7.28 |
| AR (2) | −2.06 | −2.10 |
| Variables | Equation (2) |
|---|---|
| WCF | −1.002 *** |
| (0.310) | |
| WCF2 | 1.013 *** |
| (0.239) | |
| WCF × Size dummy | 2.748 *** |
| (0.348) | |
| WCF2 × Size dummy | −2.305 *** |
| (0.325) | |
| Size | 1.592 *** |
| (0.143) | |
| Growth | 0.022 *** |
| (0.004) | |
| Leverage | −1.902 *** |
| (0.390) | |
| Constant | −14.422 *** |
| (1.338) | |
| Observations | 12,609 |
| Wald test | 383.83 |
| Sargan test | 219.50 |
| AR (1) | −7.95 |
| AR (2) | −2.68 |
| Variables | Equation (3) |
|---|---|
| WCF | −3.984 *** |
| (1.227) | |
| WCF2 | 7.578 *** |
| (2.314) | |
| WCF × Lev dummy | 5.428 *** |
| (1.653) | |
| WCF2 × Lev dummy | −10.053 *** |
| (2.774) | |
| Size | −0.898 ** |
| (0.385) | |
| Growth | −0.002 |
| (0.008) | |
| Leverage | −1.893 * |
| (0.990) | |
| Constant | −3.984 *** |
| (1.227) | |
| Observations | 12,609 |
| Wald Test | 141.02 |
| Sargan Test | 37.03 |
| AR (1) | −5.00 |
| AR (2) | −2.48 |
© 2019 by the authors. Licensee MDPI, Basel, Switzerland. This article is an open access article distributed under the terms and conditions of the Creative Commons Attribution (CC BY) license (http://creativecommons.org/licenses/by/4.0/).
Share and Cite
Mahmood, F.; Han, D.; Ali, N.; Mubeen, R.; Shahzad, U. Moderating Effects of Firm Size and Leverage on the Working Capital Finance–Profitability Relationship: Evidence from China. Sustainability 2019, 11, 2029. https://doi.org/10.3390/su11072029
Mahmood F, Han D, Ali N, Mubeen R, Shahzad U. Moderating Effects of Firm Size and Leverage on the Working Capital Finance–Profitability Relationship: Evidence from China. Sustainability. 2019; 11(7):2029. https://doi.org/10.3390/su11072029
Chicago/Turabian StyleMahmood, Faisal, Dongping Han, Nazakat Ali, Riaqa Mubeen, and Umeair Shahzad. 2019. "Moderating Effects of Firm Size and Leverage on the Working Capital Finance–Profitability Relationship: Evidence from China" Sustainability 11, no. 7: 2029. https://doi.org/10.3390/su11072029
APA StyleMahmood, F., Han, D., Ali, N., Mubeen, R., & Shahzad, U. (2019). Moderating Effects of Firm Size and Leverage on the Working Capital Finance–Profitability Relationship: Evidence from China. Sustainability, 11(7), 2029. https://doi.org/10.3390/su11072029