1. Introduction
“The New Town” usually refers to a group of tectonic plates that can realize urban function and spatial expansion in a certain distance from the central city during the process of continuous spatial expansion of space in a large city, relying on certain resource conditions [
1]. In order to maintain the sustainable competitiveness of the new town, it is essential to make intensive use of urban land [
2], strengthen the coordinated development of land use and urban transportation, and effectively construct the urban public transportation system that will lead residents to choose low-carbon travel. The tram system, as a transportation system with the traffic volume level between subways and buses, can effectively improve the accessibility of the previous “metro+bus”-based transportation models in many large cities, and promote the construction of a multilevel low-carbon public transportation system [
3]. Trams will become an important mode of public transport in developing countries. In China, the total mileage of trams has reached 10378 km. It is necessary and of theoretical and practical value to study trams. Condon P believed that the urban public transit system such as trams should be regarded as a kind of developing mode of urban space and the overall planning of transportation, and the principles of interconnecting transportation network and diversified land use should be combined with this mode to promote the sustainable development of the city [
4]. By analyzing the case of trams in Sweden, Svensson T argued that it needed to stimulate the potential of trams and to with the help of strong support and promotion from more favorable urban planning policies [
5]. In some large cities with dense population and more developed subway system, the capacity of trams makes it definite that they are suitable for accessing the surrounding satellite cities with the main urban areas [
6]. For example, three tram lines in the south of central London serve the satellite city of Croydon. The tram line distributed in the suburbs of Paris intersects with many subways and RER, and a multilevel transportation network system is thus constructed. Suzhou Tram Line 1 serves as an extended tram, which effectively strengthens the traffic connection between the high-tech zone and the old town. These cases all show that trams play an important role in the public transportation system of the new town.
As large cities expand rapidly, the increasingly prominent issues of transportation and environmental problems have made the research on low-carbon transportation more and more concerned. The development of urban traffic system and land use patterns interact with each other [
7]. Based on the relationship between them, Martínez put forward that the accessibility of urban space, which is related to urban spatial form, urban traffic and land use, plays a significant role in determining the scale of urban land use, the intensity of development and land use layout [
8]. For example, Abigail L, Bristow A L and others proposed that the land use which encourages high-density and non-motorized travel is one of the measures to realize low-carbon travel [
9]. After the research, Cervero [
10], Levinson and Kumar [
11], Schwanen et al. [
12] pointed out that the compact development, which is characterized by high density, high volume ratio, and high balanced degree of jobs-housing balance distance and compact urban space form, would increase the accessibility of residents to all kinds of travel modes, reducing the residents’ travel distance and the use of private cars. Jiang Y.H and others proposed that the smoothness of the trip road, the accessibility of the destination, the perfection of the transportation facilities and the fairness of travel mode are the important indicators to describe the travel behaviors [
13]. Shen [
14] defined accessibility as an indicator of the depth and breadth of urban space, which is also proved by the research of scholars such as Pan et al. [
15].
The construction of rail transit has promoted the accessibility of transportation and location advantage of the areas along the line, which have great impact on the value of land use. Cervero R confirmed that transit ridership can strongly influence the increase of land value around the stations through multiple regression analysis [
16]. Mohammad et al. pointed out that many factors of the rail like the type of land use, the type of rail service can increase the impact of rail on land value changes through the meta-analysis [
17]. Połom et al. studied the accessibility of the space along the railway through GIS, direct measurements of passenger flow and public opinion, arguing that there is a need to connect railway lines to urban transport systems and to plan more residential projects around them in order to attract more potential passengers [
18]. Sutcliffe E analyzed eight cases of rail transit and concluded that mature rail transit had high passenger source, good corridor effect and strong impact on land use, which was supported by relatively scientific related policies and relatively consistent surrounding transportation system [
19].
In order to change the negative effect of urban sprawl development, more and more scholars put forward the development modes like community development oriented by public transport and new urbanism. The study of urban built environment and traffic travel behaviors provides empirical basis for the implementation of these models [
20]. travel behaviors are the foundation of urban traffic flow, and low-carbon travel is a manifestation of low-carbon behavior. By using travel diary data and land-use records in the San Francisco Bay Area, Cervero R and Kockelman K analyzed the impact of 3Ds (density, diversity, and design) of the built environment on trip rates and mode choice of residents [
21]. Zhang L and Levinson D M found that different travel purposes have various determinants, and travel time has a more significant impact on commuting, the degree of commercialization is the decisive factor for consumers, and roadside esthetics landscape is more important to travelling for recreational trips [
22]. In order to explore which kind of built environment factors plays a decisive role in travel behaviors, Cervero R and Ewing R H summarize the relevant research in the 20th century and draw a conclusion: Trip lengths mostly depend on the built environment, and trip mode choices depend on both the built environment and socioeconomics [
23]. They also found that walking is most strongly related to measures of land use diversity, intersection density, and the number of destinations within walking distance. Bus and train use are equally related to proximity to transit and street network design variables, with land use diversity a secondary factor [
24].
It can be seen that the urban spatial environment will lead to the choice of travel mode, and the travel behaviors mode will also have an impact on urban spatial form, which are interrelated and developed dynamically. In the above studies, from the perspective of urban space and travel behaviors, the domestic and foreign scholars studied the methods to lead and promote low-carbon travel to reduce the negative impact of urban traffic through a variety of ways, especially through the use of models and empirical researches. Therefore, based on the measure of accessibility, the author believes that analyzing and evaluating the coupling between land use (the mixed degree, land use layout, and development intensity) and residents’ travel behaviors along the tram line and studying the land use development mode along the line which can meet the travel demands of residents can provide reference for leading citizens to choose low-carbon travel transportation mode, which has positive significance for the sustainable development of the city.
At present, the research results on urban space and public transit at home and abroad are mostly concentrated on the areas along the rail transit lines such as subways and light rails, and the research on the land use along the tram line is relatively less.Based on the existing theory and research review, this paper analyzes the relationship between land use and the behavior of tram-takers along the line of Nanjing Chilin Tram Line 1, and explores the coupling development of land use and travel behaviors along the tram line from the perspective of the users.
Compared with the existing research, the main contributions of this paper include three aspects:
Object of study: Compared with mass transit and low-capacity conventional public transit, this paper studies the coupling relationship between land use and residents’ travel behaviors from the tram with traffic volume between them.
The influence scope of tram stations: In general, the research on the area of influence of trams mainly refers to subway stations whose influence is mainly discussed at the theoretical level by analyzing the empirical value and the practical investigation, or by adopting the theoretical modeling. The tram, as the rail transit with medium and low volume, cannot be compared with the conventional subway station. Therefore, the Kishi’s Logit PSM (Price Sensitivity Measurement) model is used in this paper to determine the effective range of influence by calculating the psychological threshold of the pedestrians access to tram stations along the tram line.
Nanjing Chilin Tram Line 1 is located in Nanjing Chilin New Town, which is a typical extended tram accessing the new town and the main urban area of a large city. In this research, the evaluation of coupling degrees between residents’ travel behaviors and land use along the tram line have definite typicality, whose research method can be used for reference for the trams of the same type to develop the areas along the tram line.
2. Research Methods
In this research, Nanjing Chilin Tram Line 1 and the areas along the line are taken as research samples, and its surrounding built-up environment and the passengers are studied through field observation, questionnaires and interviews to obtain the data of the residents’ travel behaviors and social attributes, and the present situation of built-up environment along the tram. Through statistical calculation and analysis of the data, this paper evaluates the coupling between different types of stations and the residents’ travel demand, and between the land use around all types of stations and the psychological threshold of residents’ travel demand respectively.
The research is divided into three steps:
Firstly, through the questionnaire survey, the social attributes, travel purposes and paths, the time consumption of each travel and the travel mode of the passengers living along the tram line, and the psychological distance threshold for pedestrians access to the tram stations are obtained. Through the information of urban planning with relevant control, constructive detailed planning and design provided by the urban planning commission, which is combined with the field research of built environment, the data such as the built environment, land use property and the plot ratio of the areas along Chilin Tram Line 1 are determined.
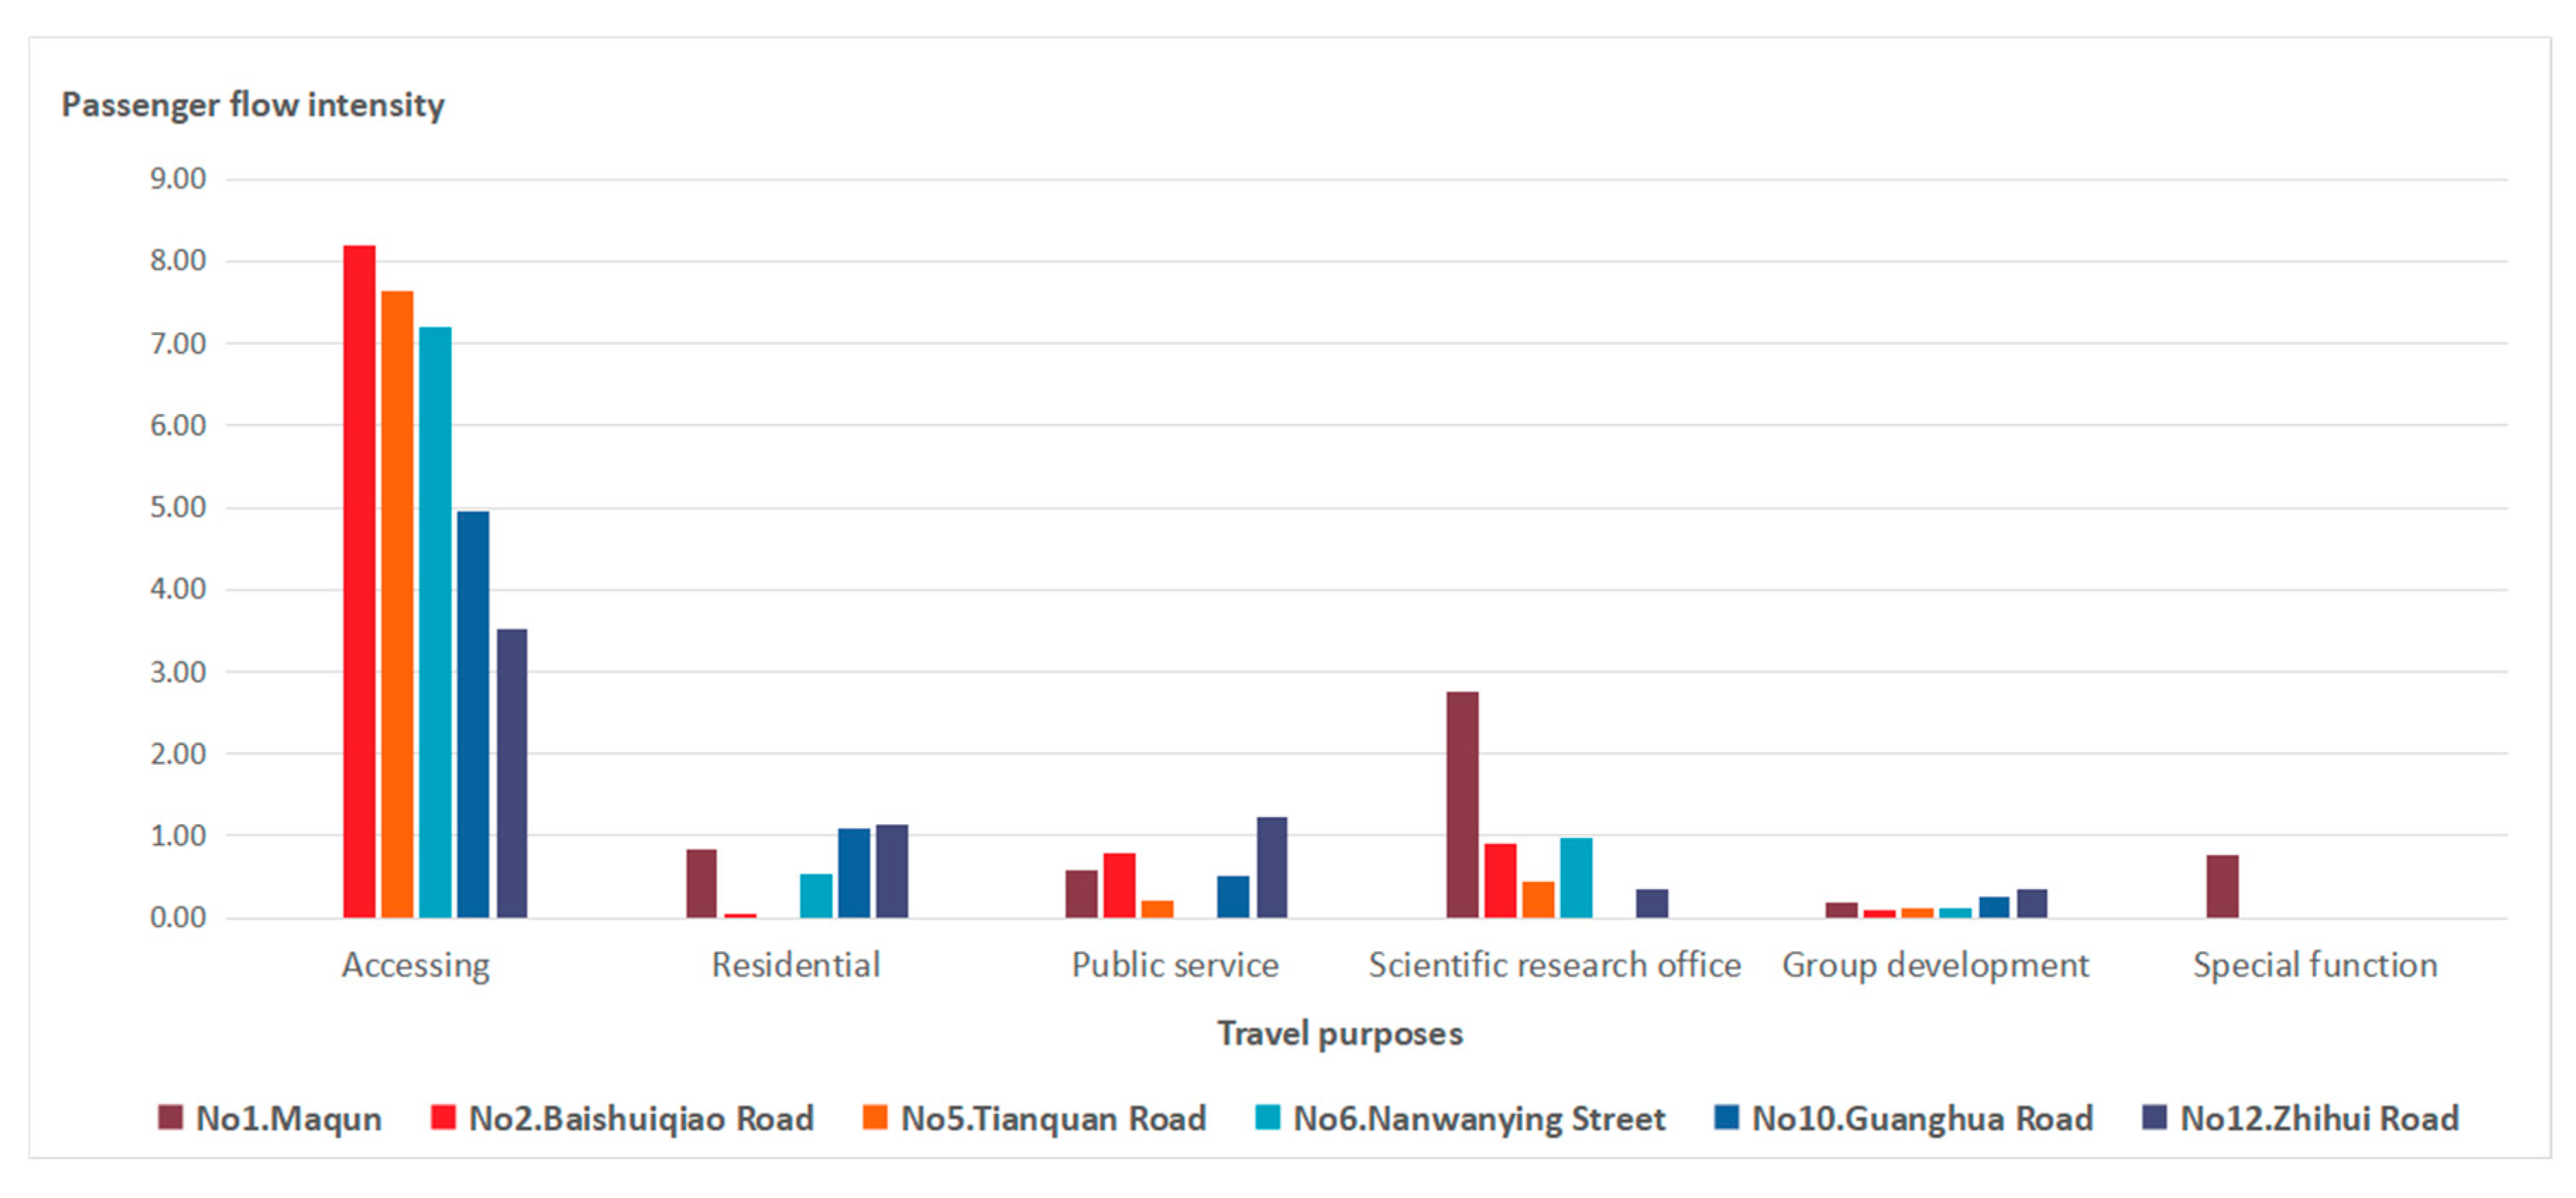
After that, the coupling between passengers’ travel behaviors and land use along the tram line is analyzed from two aspects. On the one hand, by investigating the OD trajectory of passengers with different travel purposes, the passenger flow intensity is calculated, and the correlation between the passengers’ travel demand and the type of stations is analyzed. On the other hand, based on the psychological distance threshold for pedestrians’ access to the tram stations through questionnaires, the Kishi’s Logit PSM (KLP) model is used to delineate the radiation range of the actual influence of each station that was studied, and to evaluate and analyze the coupling between the land use index & the rules for change within the influencing circle and the psychological threshold of residents’ travel demand. Among them, the land use index includes the degree of mixed land use, dominance index of land use and the diversity index of land use. Besides, since Chilin New Town stands for the development area of the new town that is still under construction, there are quite some similarities among the width of the road, the width of the sidewalk, and the form of the road cross-section around the stations (
Figure 1). Through measurement and research, these areas around stations have the same standard for scale, cross-section and green design on the same level of road. Therefore these indexes are thus not considered as the main influencing factors in this research, with only the accessibility, the density of road network and the attractiveness of land use property taken in consideration.
Finally, based on the previous analysis, this research evaluates the coupling degree between land use and residents’ travel behaviors along Chilin Tram Line 1 from the perspectives of the coupling between the station types and the passengers’ travel demand, and the coupling between the land use situation around the stations and the psychological threshold of residents’ travel demand.
5. The Characteristics of Land Use Around the Stations within the Range of the Psychological Threshold of Pedestrians’ Access to the Tram Stations
From the above analysis, it can be seen that passengers with various travel purposes will go to different original and destination stations, whose travel purposes are strongly affected by the type of destination stations. The type of station is mainly determined by the type of land use around the stations.
Therefore, based on the the psychological threshold of pedestrians’ access to the tram stations, this paper will define the effective influence range of the stations through calculation, classify the arrival and departure psychological time threshold of passengers arriving at each type of stations according to their travel purposes. According to the weighted average time threshold, the land use around the stations is divided into different time circles, and the related land use indexes are evaluated. On this basis, the coupling degree between the actual situation of land use within each circle and the psychological threshold of residents’ travel demand is analyzed.
5.1. Calculation of Stations’ Influence Range
As a medium volume rail transit, the tram has lower traffic volume and speed than conventional mass transit and light rail transit, whose empiric value of the influence on surrounding areas and the attraction region of conventional rail transit cannot be generalized. In this paper, Kishi’s Logit PSM (Price Sensitivity Measurement) is used to calculate the reasonable time and space threshold of pedestrians access to the tram along the line as the actual attraction range of the tram line 1 to the surrounding areas.
5.1.1. Calculation of Psychological Distance Threshold for Pedestrians Access to the Tram
(1) Kishi’s Logit PSM (KLP)
KLP comes from Price Sensitivity Measurement (PSM). The basic principle of PSM is to reasonably determine the commodity price based on consumers’ subjective perception of the commodity price. Respondents answered four questions that they thought: “cheap”, “expensive”, “too expensive to buy” and “too cheap to buy”. Calculate the frequency and the cumulative percentage of the frequency at different price points and establish the relevant cumulative frequency curve. The intersection point of the curves is the relevant price threshold point. The psychological price curve in the PSM model regressed by the disaggregate model is the KLP model (
Figure 10) [
26,
27], as shown in Equations (1) and (2):
Among them, Ti is the relevant cumulative frequency, i = 1, 2, 3, 4; Fi(x) is the price function: x is the price; a and b are parameters. T1, F1(x) represent “should be cheaper (no more expensive)”; T2, F2(x) represent “should be more expensive”; T3, F3(x) represent “too expensive to buy”; T4, F4(x) represent “too cheap to buy”.
Yan H et al. used the KLP model to calculate the psychological threshold of pedestrians’ and cyclists’ access to rail transit service [
28]. He J et al. used the KLP model to quantify and evaluate the reasonable transfer distance in rail transit stations [
29]. Qin H.M et al. used the KLP model to analyze the maximum transfer threshold that the passengers can accept to go to the park and ride facilities [
30].
(2) Calculation of Passengers’ Psychological Distance Threshold for Taking the Tram
Based on the relevant researches of some scholars, this paper believes that the distance range that travelers can bear when access to the tram on foot is similar to consumers’ feelings on commodity prices. Therefore, the KLP model is used to quantitatively analyze the psychological threshold of pedestrians’ accessing distance.The author makes two distance-related cumulative frequency curves based on the actual pedestrians’ accessing distance (T1) of the respondents and the maximum pedestrians’ accessing distance (T2) psychologically acceptable to the respondents, and take the intersection of the two cumulative frequency curves as the upper limit of pedestrians’ accessing distance, so as to reflect the effective influence range of the stations under investigation. The questionnaire is valid when the actual pedestrians’ accessing distance is less than the maximum pedestrians’ accessing distance acceptable to the respondents psychologically.
Using Matlab7.0 and ordinary least square (OLS) method to calibrate the parameters of the equation, we can obtain
,
,
,
, thus we can get two images of linear equations with one variable (
Figure 11):
The intersection point of the two cumulative frequency curves is 686 m, which means that the psychological distance threshold of pedestrians access to Chilin Tram Line 1 is 686 m (
Figure 12). If the distance exceeds 686 m, the number of pedestrians will be significantly reduced or the accessing mode will be changed.
5.1.2. Calculation of the Actual Influence Range of Each Station
(1) Pedestrian Route Directness around Each Station
As shown in
Figure 13, the author takes the tram station as the center and 800 m as the radius of the circular area to calculate the pedestrian route directness (PRD) of the road network around the station. In this paper, PRD is mainly calculated through Hess’s calculation method [
31].
The PRD value of the lower section of the tram is 1.331, slightly higher than 1.24. Except the PRD value of Shuijiefang Station (No. 11) is 1.622, the PRD value of the other 12 stations is concentrated in the range of 1.2~1.4 without much fluctuation (
Table 3).
(2) Calculation of the Time Threshold of the Influence Range for Each Station
According to the average adult walking speed of 75 m/min, the accessing time threshold=actual pedestrians’ accessing distance threshold/PRD÷75 m/min is calculated, which is the actual radiation scope of each tram station on the surrounding areas (
Table 4).
5.2. Land Use Indexes Around Different Stations
According to the research method in this paper, the author selects the diversity index of land use, dominance index of land use and the degree of mixed land use as indexes to evaluate the situation of land use. The higher the value of the degree of mixed land use, the more balanced the distribution of various land functions and the higher the degree of mixed land use [
32]. However, the concept of dominance index of land use [
33] is opposite to the degree of mixed land use. The higher the value of dominance index of land use, the simpler the land use allocation of the street and the lower the degree of mixed land use (
Table 5). The land use diversity can be expressed by Simpson’s diversity index [
34].
5.2.1. The Land Use around the Stations in the Influence Range Based on the Time Threshold
(1) The Accessing Station: No. 1 Maqun Station
The index of land use diversity around the station is 0.69, the dominance index of land use is 0.69, and the degree of mixed land use is 0.68. The type of land use is acceptable with slightly uneven distribution, and the degree of mixed land use is relatively general compared with the stations along the line. The commerce & office mixed and commercial land which can meet the needs of commuting and shopping is mainly distributed in the 0–3.36 min circle, with a relatively high plot ratio which is more than 3. The plot ratio of 3.36–5.28 min circle attenuates to 2 and above, mainly for residential and commercial use, and the proportion of commerce & office mixed land use decreases sharply. The plot ratio of 5.28–7.32 min circle continues to decline to 1, mainly for residence and public service. The plot ratio shows obvious gradient field effect (
Table 6).
(2) Residence-oriented Stations
I. Typical station: No. 2 Baishuiqiao Road Station
The diversity index of land use around the station is 0.64, the dominance index of land use is 0.6, and the degree of mixed land use is 0.69. The degree of mixed land use is rather ordinary compared with other stations along the line. The proportion of residential land use is the highest, mainly distributed in the circle of 0–5.03 min, and the proportion decreases beyond the circle of 5.03 min. Compared with the passengers travelling for commuting and consuming whose off-site threshold is 6.13 min, the commercial land is only distributed in the 0–4.5 min circle, which is within the passengers’ psychological threshold. The proportion of commerce & residence mixed land increases with the expansion of the circle, having the highest proportion within the 6.13–7.01 min circle. The plot ratio of each circle remained relatively stable between 1 and 1.3 (
Table 7).
II. Typical Station: No. 5 Tianquan Road Station
The diversity index of land use around the station is 0.67, the dominance index of land use is 0.64, and the degree of mixed land use is 0.67. The degree of mixed land use is rather ordinary compared with other stations along the line. Among them, the total residential land areas account for the largest, reaching 41.87%, followed by the proportion of the land used for public service which is 15.29%, showing some advantages. The proportion of residential land increases steeply in the 5.5–7.54 min circle, stablizing at more than 45%. Commercial and commerce & office mixed lands are mainly distributed in the 0–4.4 min circle, basically accord with the psychological threshold of passengers who have the needs of leisure and recreation. The plot ratio of each circle is kept steady between 1.8 and 2.5, and the development intensity is relatively higher than that of the whole area along the tram (
Table 8).
III. Summary of the Characteristics of Land Use around Residence-oriented Stations
Based on the analysis of land use around Station 2 and Station 5, it can be concluded that residence-oriented stations mainly attract commuters. Within the influence range of the stations, the land use property is rather single, which is dominated by residential land, reaching 40%, followed by the land used for public service. Commerce & office mixed and commerce & residence mixed land account for a relatively small proportion, but both of which are developed in medium or high intensity.
(3) The Public Service-oriented Station: No. 6 Nanwanying Street Station
The diversity index of land use around the station is 0.67, the dominance index of land use is 0.61, and the degree of mixed land use is 0.71. The degree of mixed land use is relatively better than other stations along the line. According to field survey and the reference to the controllable detailed planning, in addition to 32.72% of the residential land, the land mainly planned to be used for building schools, primary community center and the only medical institution along the line around the stations, which can assume the function of community-level public service, presenting certain advantages and attractive to the commuters. The plot ratio of the 0~3.24 min circle reaches 2.8, mainly distributing residential land and greenbelts and water areas. The public service land used for building educational facilities is mainly distributed in the 4.32~6.79 min circle, the proportion of residential land increases to over 30%, which basically accords with the passengers’ psychological threshold. The total plot rate around the stations is stablized at between 2 and 3, with moderate intensity development (
Table 9).
(4) Scientific Research Office-Oriented Stations
I. Typical station: No. 10 Guanghua Road Station
The diversity index of land use around the station is 0.61. The dominance index of land use is 0.42 and the degree of mixed land use is 0.74. The distribution of all types of land use is uniform compared with other stations along the line. The proportion of residential land is 15.92%, which is much smaller than that of the stations in the Chilin residential areas, and the land is distributed in each circle. The proportion of the land used for scientific research and design which provides major job opportunities increases with the expansion of the circle. There is no commercial land distributed around the stations, and the commerce & office mixed land is mainly distributed in the 4.06–6.63 min circle, which can provide spaces for shopping and consuming. The plot ratio of the areas around the stations is basically between 1.5 and 2, and the total plot ratio decreases with the expansion of the circle (
Table 10).
II. Typical station: No. 12 Zhihui Road Station
The diversity index of land use around the station is 0.66, the dominance index of land use is 0.6, and the degree of mixed land use is 0.69. The types of land use are slightly more than that of Guanghua Road Station. The degree of mixed land use is reasonable and the distribution of each type of land use is slightly uneven compared with other stations along the line. The land used for scientific research and design which provides major job opportunities increases as well as the plot ratio. The proportion of the land use increases with the expansion of the circle. There is no obvious distribution of commerce & office mixed land. The proportion of residential land further decreases, and the distribution of which can be found in each circle. The plot ratio around the station is between 1.5 and 2, showing no obvious distribution characteristics along with the circle (
Table 11).
III. Summary of the Characteristics of Land Use around Scientific Research Office-Oriented Stations
The land is mainly used for scientific research and design, residence and commerce & office. The plot ratio is about 1.5–2, which is of low and middle development intensity. Commercial land use and river reach are the influence areas in the center of the stations, and the land-use intensity is thus affected. Going deeper into Chilin Hi-tech Innovation Park from Station 10 to Station 12, the proportion of the land used for scientific research and design gradually increases, while the proportion of residential land gradually decreases. There is no obvious distribution of public service land around the stations, commerce & office mixed and commerce & residence mixed land is mainly distributed beyond the circle of 0–4 min.
5.2.2. Analysis of the Plot Ratio of the Circle in the Stations without Gradient Field Effect
Generally, the gradient field effect of the plot ratio of land use around the station is essentially the potential benefit of land use which attenuates along with distance [
35]. In this research, the plot ratio around some stations does not have an obvious gradient field effect. In this paper, the plot ratio of the main types of land use around these stations is compared with the circle change of total plot ratio. The special details are as follows (
Figure 14).
• Rescidence-oritend Station
The change of the overall plot ratio of the areas around Baishuiqiao Road Station is consistent with that of residential land use.The change of the overall plot ratio of the areas around Tianquan Road Station is consistent with the potential land used for public services.
• Scientific Research Office-oriented Station
The change of the overall plot ratio of the areas around Zhihui Road Station is consistent with the land used for scientific research and design.
To sum up, the change of the plot ratio around the stations without obvious gradient field effect is greatly affected by the dominant and potential types of land use.
7. Conclusions
This paper is aimed at evaluating the land use situation within the influence range along the tram line and analyzing whether it is coupled with passengers’ travel demand. By investigating the data of passengers’ travel behaviors, calculating the passenger flow intensity and analyzing the relationship between station types and passengers’ travel purposes, this research studies the relevance between the land use properties and residents’ travel purposes around the stations. It is found that many stations (No 8, No 9) fail to give full play to their functions and efficiency, and it’s necessary to further improve their attractiveness. It is suggested that a variety of functions should be arranged along the line within 35 min’s running time of the tram. In order to further verify the coupling degree of the above two aspects, the psychological distance threshold of pedestrians’ access to tram stations is taken as the basis for dividing the influence range of the tram. Furthermore, the coupling degree between actual land use and passengers’ travel demand within each circle is evaluated and studied according to the time circle of passengers’ psychological threshold regarding different types of travel demand.
In this paper, according to the calculation, we can obtain that the psychological distance threshold of pedestrians’ access to tram stations is 686 m, and the circle of the effective influence range of the tram on the land use along the line is thus determined to be about 7.5 min. Optimizing the land use layout and development intensity within the range can more effectively lead passengers along the line to take trams.
In the construction of the new town, there are many stations with various types, among which the stations with the accessing function are showing rather obvious gradient field effect and have a high passenger flow intensity, which are the major stations and should be combined with subway stations for the functional development with greater intensity.
The park green stations distributed along the tram line of the new town are more targeted at serving the residents of the new town. It is difficult to attract residents around the stations to travel for daily recreation in terms of time accessibility, so as to better attract and serve for the crowds that travel on the weekends.
In this study, the psychological threshold of residents’ travel accessibility is investigated in different tram stations, which can be used as a reference for exploring the coupling degree between land use development and residents’ needs. This paper takes the psychology time threshold of passengers’ demand as the basis for the land use layout and optimization around each station, presenting the following rules as a whole:
- (a)
The accessing station: working and commuting threshold>homeward journey threshold>consuming threshold>leisure and recreation threshold
- (b)
Residence-oriented stations: working and commuting threshold≈consuming threshold> leisure and recreation threshold
- (c)
The public service-oriented station: leisure and recreation threshold>homeward journey threshold>consuming threshold>working and commuting threshold
- (d)
Scientific research office-oriented stations: homeward journey threshold>working and commuting threshold>consuming threshold decrease in turn.
The results show that there is uneven distribution of passenger flow along the tram and the pressure of passenger flow in some stations is relatively high. According to types of the function of each station, considering the travel purpose of the main crowd attracted by which and satisfying the travel demand of the passengers within the appropriate threshold, the attraction of some stations can be enhanced and the distribution of passenger flow along the line will be balanced.


