Article

The Sustainability of Reclaimed Asphalt as a Resource for Road Pavement Management through a Circular Economic Model

by
Konstantinos Mantalovas
* and
Gaetano Di Mino
Dipartimento di Ingegneria, Università degli Studi di Palermo, Viale delle Scienze, Ed. 8, 90128 Palermo, Italy
*
Author to whom correspondence should be addressed.
Sustainability 2019, 11(8), 2234; https://doi.org/10.3390/su11082234
Submission received: 18 March 2019 / Revised: 5 April 2019 / Accepted: 8 April 2019 / Published: 13 April 2019
(This article belongs to the Section Economic and Business Aspects of Sustainability)

Abstract

:
The transition of the road engineering industry to a circular way of doing business requires more efficient and sustainable resources, energy, and waste management. The rates in which reclaimed asphalt is being recycled or reused in the asphalt mixture production process constitutes a crucial parameter in this transition. This paper aims at establishing a further step towards the combined circularity and sustainability of asphalt pavements, by introducing a framework for quantifying their Material Circularity Index. The framework is based on the methodology proposed by the Ellen MacArthur Foundation and accordingly tailored for the context of asphalt pavements. This study, thus, attempts to provide a thorough analysis of the Reclaimed Asphalt’s recycling rates and trends on a European scale and to identify whether the efficiency of the current recycling practices is adequate or not. Moreover, a case study has been undertaken in order to quantify the Material Circularity index of the asphalt pavements forming Italy’s motorway network, following the proposed framework. For representative and accuracy reasons, the Material Circularity index of wearing, binder, and base courses has been calculated separately, and the results interestingly indicate that the base course exhibits the highest rates of circularity.

1. Introduction

Towards the attempt of the road engineering industry to promote the circular economy (CE) and its principles, while reducing the use of large amounts of energy and materials [1], Reclaimed Asphalt (RA) exhibits a high potential for exploitation. By definition, CE is restorative and regenerative and aims to keep products, components, and materials at their highest utility and value at all times [2], i.e., it supports the “re-circulation” of materials and energy within the same or alternative product systems, and thus the elimination of avoidable wastes [3]. Hence, RA is perceived as an ideal material that can re-enter the cycle of asphalt mixture production [4]. Although the concept of CE is not new, it still has not been widely and formally implemented in transportation infrastructure projects and specifically in asphalt pavements. The concept of CE made its first appearance as a proactive policy goal for numerous businesses and in political agendas in the late 1970s, mainly due to climate change and the acute concern of rising resource prices, raised by R. Carson and K. Boulding [5,6,7,8]. It encompasses the principles of multiple schools of thought, such as industrial ecology and symbiosis, performance economy, biomimicry, cradle to cradle, blue economy, regenerative design, cleaner production, and natural capitalism [2,9]. Although there is not a consensual and definitive definition of CE, one of the most widely accepted definitions is that of the Ellen MacArthur Foundation (EMF): “economy that is restorative and regenerative by design, and which aims to keep products, components, and materials at their highest utility and value at all times, distinguishing between technical and biological cycles” [10]. Two different types of products can be identified; products that after their lifecycle can either return into the technical cycle (durables), or into the biological cycle (consumables) [2]. This definition is based on three principles [11,12]:
  • Design out waste and pollution: This includes the detection and exclusion of the negative externalities of economic activities, which can cause damage to human health and ecosystems, by minimizing the emission of toxic substances, greenhouse gases, and eliminating water, air, and land pollution.
  • Keep products, components, and materials at their highest value and in use: Adapting the design process to support the reuse, the remanufacturing, and the recycling of components and materials, biological or technical, in order to keep them in circulation within the same or another product system. In circular systems, it is possible to maximize the use and the value of various components that have been designed in such a way by cascading them into different applications or product systems [11].
  • Regenerate natural systems: CE is able to support the flow of nutrients or technical materials within the same system, generating ideal conditions for regeneration, and thus, the enhancement of natural capital [11,13].
In addition to these three proposed principles, the framework of CE has as an end target of providing a “marketable set of products and services capable of jointly fulfilling a user’s needs” and not just end products to be solely sold to consumers [14,15]. This means that manufacturers and retailers could retain ownership of their products and become service providers by selling their “use” [13,16]. This is something that would be sensible, and it would be significantly beneficial if implemented to asphalt pavements and their holistic life-cycle management. The manufacturer of the road would also have to manage their asset in addition to just constructing it. A more graphical depiction of the most relevant economic principles that CE entails can be seen in Figure 1.
However, when it comes to transport infrastructures, and more specifically asphalt pavements and RA, it becomes complex to encompass all the principles of CE in their life cycles, and thus no record of studies and approaches relevant to the quantification of their circularity have been recorded. Highways England, London’s Waste and Recycling Board (LWARB), Ellen MacArthur Foundation, and Opportunity Peterborough are some of the institutions and companies that are driving towards introducing CE and its metrics within their agenda, hoping to influence a wider decision-making audience. Highways England, in collaboration with two of the most reputable construction companies worldwide, published an “Approach and Routemap” detailing, how the implementation of CE can be achieved through their incipient strategies [17]. Moreover, LWARB has recently published the London’s CE Route Map, in an attempt to accelerate the growth and development of CE across London, whilst setting out an ambitious plan of action, including the built environment and transportation infrastructure [18]. “Cities in the Circular Economy: An initial exploration” is a report published by the Ellen MacArthur Foundation. It highlights the challenges of the linear economy and promotes the advantages of implementing CE on an urban scale, and within the built environment [11]. Opportunity Peterborough published the “Circular City Roadmap” in 2018. It is a resourceful plan and performance monitoring framework towards 2021, which sheds light upon the next steps to be followed for the realization of circular infrastructure, with the ultimate target being a “circular city” [19]. Some attempts have also been made by companies trying to specifically implement the principles of CE into the production of asphalt mixtures. Tarpaper Recycling, along with Super Asfalt, have proposed the production of REC100. It is a mobile asphalt plant that ensures 100% utilization of the resources in roofing felt and asphalt waste, in order to produce asphalt mixtures incorporating 100% recycled resources. In addition, SYLVAROADTM RP1000 is an additive derived from Crude Tall Oil (CTO), a renewable raw material, characterized as a by-product of the paper industry and developed by KRATON. It is able to increase the levels of RA incorporated into the asphalt mixtures while avoiding significant environmental burdens [20].
Reclaimed Asphalt can be defined as existing asphalt pavement materials that have been removed during the resurfacing, rehabilitation, or reconstruction operations of asphalt pavements and accordingly processed [21]. All of the motorways within the EU member-countries consist of asphalt pavements, which—as anticipated—suffer from various types of distresses [22]. Their maintenance and rehabilitation are significantly impactful processes in an environmental, economic, and social context. In order to minimize the impacts of these processes and move towards a more sustainable and circular approach, recycling of RA is nowadays a widespread practice within the road engineering industry [22,23,24,25,26,27]. The annual average quantity of available RA within Europe reaches approximately 45.5 Megatonnes, while the average annual proportion that is actually being utilized in asphalt production is only 23.2 Megatonnes [28,29,30,31,32,33,34,35,36,37,38,39]. The main techniques with which RA can be utilized are in hot in-plant recycling, hot in-place recycling, full depth reclamation, cold in-plant recycling, and cold in-place recycling [23,40]. The percentage of RA incorporated in road pavements is usually limited between 10% and 30%, despite the advantages that its use might imply. This is mainly occurring due to legislation limitations and technical issues, such as the variability of the RA properties, the lack of certainty about the performance of the mixture, and the lack of complete understanding of the mechanisms taking place during the asphalt mixture production [27,41]. Several studies have attempted to pave the way towards higher utilization of RA in asphalt pavements. The main conclusion of these studies is that higher utilization of RA is possible when attention is paid to the mixture design and the RA’s properties, so that a consensus between the laboratory mix design and the full-scale realization of the asphalt pavement can be achieved [42,43,44,45,46,47,48].

2. Scope and Objectives

As it is possible to incorporate up to 100% of RA in the production of asphalt mixtures, a question that arises is “how can we quantify the circularity of asphalt pavements incorporating RA?” This study attempts to answer this question and provide the missing link between the concept of CE and the utilization of RA under the umbrella of a Circular Economic approach. Hence, a thorough analysis of the current recycling rates and trends of RA exhibited in EU member-countries is imperative. Moreover, the introduction of new parameters (RA Placed rate (ΔU), RA Availability Quantity Factor (QF[a]) and RA Placed Quantity Factor (QF[p]) that help interpret the availability and the actual exploitation of RA is considered essential. Furthermore, a case study for the quantification of the Product Material Circularity Index (MCIMRA) of asphalt pavements could enlighten the potential hotspots within the life cycle of a pavement, as can be seen in Figure 2, and potentially it could help stakeholders and asphalt mixture producers to optimize their production approaches environmentally and economically.
To achieve a sustainable production process, this process must also be based on a circular economic model [16,50,51]. The purpose of this work is, thus, to quantify and evaluate the circularity potential of RA in the Hot and Warm Mix Asphalt (HWMA) production market through an analytical top-down process. Following this approach, three main objectives can be identified. The first objective is to provide a complete and up-to-date overview of the aforementioned market at a European scale; the second is to implement a Circular Economic Model (CEM) for the asphalt mixtures with RA (MRA), in accordance with the methodology proposed by the Ellen MacArthur Foundation [52], a foundation recognized as a preeminent institution for CE matters. Finally, the third objective is to quantify and evaluate the circularity potential of the asphalt mixtures with RA, within a specific scenario referred to hereafter as “Case Study”. To do so, a Material Circularity Index quantifying framework, specifically tailored for asphalt pavements, has been developed. The usefulness of this quantification is inextricably correlated with the understanding of how far along the road engineering industry is in its transition from a linear way of operating to a circular one. The implementation of this methodology to asphalt pavements would lead to increased awareness of stakeholders about the level of their business’ circularity and could potentially detect hotspots relevant to specific processes or products, which when tackled could achieve a holistic system improvement.

3. Methods

3.1. The Current State of Hot and Warm Mix Asphalt Production and Reclaimed Asphalt Exploitation in the European Union

In this study, in order to effectively assess the capacity of RA recycling on a European scale, reputable sources of data were utilized. All of the data needed for the realization of this part of the study was collected from the European Asphalt and Pavement Association (EAPA), through its annual reports, entitled “Asphalt in Figures” [28,29,30,31,32,33,34,35,36,37,38]. The analysis has been performed from 2006 to 2017. However, in order to make the results of the study more cohesive and consistent, Europe was divided into four major regions, increasing the homogeneity and the geographical representation of the data. The division was performed according to Eurovoc, and thus, the European Union’s guidelines, and it can be seen in Figure 3 and is further analyzed in Table 1.
After the distribution of the EU member-countries in the four major regions, all the data relevant for each country was acquired from EAPA and grouped in correspondence with the regions. The data relevant to the total annual HWMA production per EU region is the primary focus. Moreover, data that represents the main applications of HWMA production was collected. Hence, it became possible to classify the average percentage distribution of HWMA uses per pavement layer, namely, wearing, binder, and base courses, and per EU region from 2006 to 2017. Moreover, an indicator characterized as the “RA Placed rate” (ΔU), was quantified, along with the introduction of two new parameters: “RA Availability Quantity Factor” (QF[a]) and “RA Placed Quantity Factor (QF[p]). The Formulae (1)–(3) of the defined parameters can be found below, while the interpretation of the outcomes from their implementation can be found in Section 4.2. These parameters were introduced for the interpretation of the results to be relevant to the magnitude of actual RA utilized in conjunction with the availability of RA. Furthermore, ΔU describes the rate with which RA is being utilized (RA[p]), in relation to the total available RA (RA[a]), or the current balance between RA demand and supply in the road pavement construction market. The values of ΔU can vary between 0 and 1, measuring the current RA ability to be introduced into a circular production process, namely, the RA transition level from being perceived as a waste (ΔU = 0) to being utilized as a resource (ΔU = 1).
Δ U = RA placed RA available
QF[a] and QF[p] represent the incidence of RA[a] compared to the total asphalt production, which is the sum of recycled and virgin asphalt (RA[a] + HWMA), and the incidence of RA[p] compared to the total asphalt production already defined, respectively. Under the assumption of an active road construction market and by considering the values of QF[a] varying from 0 (no RA utilized as material source) to 100 (no demand of virgin materials for asphalt mixture production), the QF[a] measures the potential ability of the RA to meet the demand for asphalt mixture production. The values of QF[p] vary from 0 (no RA utilized as material source) to 100 (total recycling of RA) and represent the actual ability of RA to meet the demand for asphalt mixture production.
QF [ a ] = RA available RA available + HWMA × 100
QF [ p ] = RA placed RA available + HWMA × 100
It is worth mentioning that the values of QF[p] tend to be equal to the values of QF[a] when ΔU tends to 1. This is when a fully restorative flow of RA is achieved.

3.2. Implementing a Circular Economic Model for Asphalt Mixtures with Reclaimed Asphalt

The typical feed materials for asphalt mixture, i.e., bituminous binder and natural aggregates, are obtained by extracting non-renewable resources, and their management requires a CEM, aligned with the goals of sustainable development. Therefore, according to the whole-life product approach [13,52], the CEM developed in this study considers the “technical cycles”, in which the products, asphalt mixtures with RA, are evaluated by considering the re-circulation of the RA into the road construction process through recycling. The material flows, going for recycling, originate from the dismantling of the asphalt pavements at the end of their service life. The CEM is based on just one life-cycle, as depicted in Figure 4, where the conventional linear economic model is also illustrated to highlight the difference between the processes. It is worth stressing that after the dismantling of the pavement, the first step towards the asphalt mixture production is the treatment of the RA, by crushing and sieving the Reclaimed Asphalt Pavement (RAP), at the recycling plant. When RA is about to be introduced in the asphalt mixing process, it is usually treated as an aggregate (black rock) and its overall mass percentage characterizes both the mechanical performance and the durability of the end-product. The final asphalt mixture consists of both virgin and recycled feedstock and it can be assumed that the end-product is in the transition from being “linear” to becoming “circular”.
With the aim of assessing the circularity of the end-product, a tailored and analytical method has been developed, whose steps are illustrated in Figure 5, according to the framework developed by the Ellen MacArthur Foundation [52]. The input data has been acquired by calculating the mass of the end-product [GMRA], which is equal to the mass of the dismantled pavement [G], along with the required virgin feedstock [V] and the mass of the reclaimed asphalt collected after dismantling [GRA]. Further inputs are the fraction of the recycled material expressed as a mass ratio between the end-product and the RA [PRA], the fraction of the product collected for recycling at the end of service-life [FRA], the efficiency of the recycling process at stage 1, the treatment of the RA [ET] and the efficiency of the recycling process at stage 2, and the production of the asphalt mixture [EP]. Finally, the amount of waste produced at the End-of-Life of the pavement [WEoL], along with the amount of waste produced from the treatment of the RA [WT] and the amount of waste originating from the production of the asphalt mixture [WP], are required. The total amount of waste [W] is also taken under consideration for the calculation of the Linear Flow Index (LFI), which measures the potential linearity of the end-product. LFI, along with the Utility [X] of MRA’s, defines both the Product Material Circularity Indicator (MCI*MRA) and the Product Material Circularity Index (MCIMRA).
A critical aspect of the process of acquiring and utilizing the required data is the definition of the Utility factor [X]. It is a function of the actual average lifetime of the end-product (LMRA), the actual average lifetime of an industry average product (Lav), the average number of loading cycles before failure (NMRA) in terms of fatigue or rutting achieved by the end-product (NMRA) during laboratory testing, and the equivalent number of loading cycles of an industry-average product of a similar type (Nav):
X = L MRA L av × N MRA N av
Regarding the second part of Equation (4), [ N MRA N av ] , and according to the results of experimental campaigns that have been conducted by the Illinois Center for Transportation and the University of Tennessee [53,54] about the impact of RA content on the performance of asphalt mixtures, the influence of different levels of RA incorporated into asphalt mixtures was identified [55]. Sheng Zhao et al. [56], Ibrahim Sonmez et al. [57], Taleb Al-Rousan et al. [58], Tabakovic et al. [59], [60], and W. Bankowski [61] have also performed similar studies identifying the influence of the RA percentage on the mechanical behavior of different layers composing asphalt pavements. This was achieved by testing representative specimens for fatigue and rutting resistance. The studies concluded that different levels of RA percentages incorporated into asphalt mixtures could lead to different performance levels. These studies showed that for wearing courses containing RA, the resistance to rutting increases with increased RA content, while the resistance to fatigue for binder and base courses with RA increases with increased RA content after the threshold of 20% and 30%, respectively. Thus, it became possible to establish the average number of loading cycles before failure (NMRA) in terms of rutting (wearing course) and fatigue (binder and base courses) achieved by the end-product (NMRA) during laboratory testing and the equivalent number of loading cycles of an industry-average product of a similar type (Nav). It is worth mentioning that the fraction LMRA/Lav, defined within the EMF’s methodology was assumed to be equal to 1. The underlying reason behind this specific assumption is that it would be unrealistic to assume a value for the actual average lifetime of the end-product (LMRA) and the actual average lifetime of an industry average product (Lav). Hence, as stated in the very same methodology, if it is not possible to provide a good estimate of the aforementioned fraction, it is conservatively suggested for the average lifetime to be deemed equal to LMRA/Lav = 1 [62]. Finally, the MCI*MRA, as a measure of the circular flow of the end-product, is calculated through the following equation:
MCI MRA * = 1 LFI × F [ X ]
where the parameter F[X] is an equilateral hyperbolic function of the Utility factor with constant K equal to 0.9. In order to avoid a negative value of circularity potential of the end-product, the MCIMRA is established by comparing and choosing the highest value between 0 and MCI*MRA. This value is the final measure of the circularity potential of the end-product and it represents the impact of the MRA’s on the road market construction in terms of innovation and sustainability.

3.3. Quantifying the MCIMRA of the Italian Motorway Pavement: A Case Study

Having defined the availability and the recycling rates of RA within the EU, the data concerning Italy was isolated and utilized in order for the case study to be structured and undertaken. However, it is worth mentioning that the applicability of the proposed Circular Economic Model along with the Material Circularity Index quantification method is not restricted in terms of regionality, at least within Europe. The chain of asphalt mixture production is similar or in some cases identical in most countries, and thus the inputs for the MCIMRA quantification are region-independent. The goal of the calculation is to assess the circularity of the mixtures with RA originating from the dismantling of the asphalt pavements, constituting Italy’s motorway network. The final assumed road pavement structure that was considered for this case study is depicted in Figure 6.
First of all, data relevant to the total length of the Italian motorways was collected from the official website of the EU and data concerning the availability and exploitation rates of RA was collected from EAPA, as mentioned before. According to the Italian road design standards [63,64], the average thickness of the pavements was determined, as well as the average number of lanes along with their width. The motorway pavements were sub-divided into three layers, namely, wearing, binder, and base course, due to the fact that different percentages of RA are incorporated in each layer, according to the Italian road design standards [63,64], and different levels of RA utilization were detected in each layer according to the analysis performed on the state of the HWMA production and RA utilization within the EU. For transparency reasons, all the essential data collected and, of course, the assumptions made in order for this case study to be undertaken, have been summarized and presented in Table 2.
Utilizing the data collected and reported in Table 2, the MCIMRA of wearing, binder, and base courses of the Italian motorways was quantified, following the proposed framework. The focus has been given to the “technical circle” of RA re-circulation within the product system. This is because no bio-materials have been used to produce the asphalt mixtures that would have contributed to the restoration of the biosphere during their End-of-Life. In detail, since different layers incorporate different levels of RA, the analysis is carried out by considering three mixtures with different RA content in order to provide results with higher accuracy and actual representativeness, compared to undertaking the study considering the asphalt pavements as complete end-products. The efficiency of the recycling process (RA treatment) is assumed ET = 100%, as usually the entire amount of the milled RA, after appropriate crushing and screening, is utilizable [65]. The efficiency of the recycling process to produce MRA’s is assumed to be EP = 98%. In the majority of the situations, when HWMA production is involved, RA has to be appropriately screened, crushed, and processed, in order for the required gradation and aggregate specifications to be fulfilled [65]. The mass of the virgin and recycled feedstock were calculated by the data acquired from EAPA [28,29,30,31,32,33,34,35,36,37,38] and the mass of the finished products was calculated by using the average layers thicknesses’ for each layer, according to the Italian road design specifications [63,64] and assuming the bulk density of the asphalt mixture constituting the pavement layers, Gmb = 2.35 Mg/m3. The fraction of the mass collected for recycling at the End-of-Life of the pavements was extrapolated based upon the quantities of the available RA and the percentages of hot mix asphalt utilization in different layers. The amount of waste going to landfill or energy recovery and the quantity of waste generated during the two stages of the recycling process were calculated according to the proposed model. The outcomes of the experimental campaigns conducted by the Illinois Center for Transportation and the University of Tennessee [53,54], along with the results of the studies undertaken by Sheng Zhao et al. [56], Ibrahim Sonmez et al. [57], Taleb Al-Rousan et al. [58], and Tabakovic et al. [59,60], were utilized to calculate the resistance to rutting and fatigue of the wearing, the binder, and the base courses with varying percentages of incorporated RA.
Hence, it became possible to calculate the Utility factor [X] required as an input for the completion of the case study and the quantification of the MCIMRA of Italy’s motorway network for wearing, binder, and base courses. In Table 3, the inputs required are presented for transparency and reproducibility reasons.

4. Results and Discussion

4.1. Hot and Warm Asphalt Mix production and Its Utilization Trends per Layer

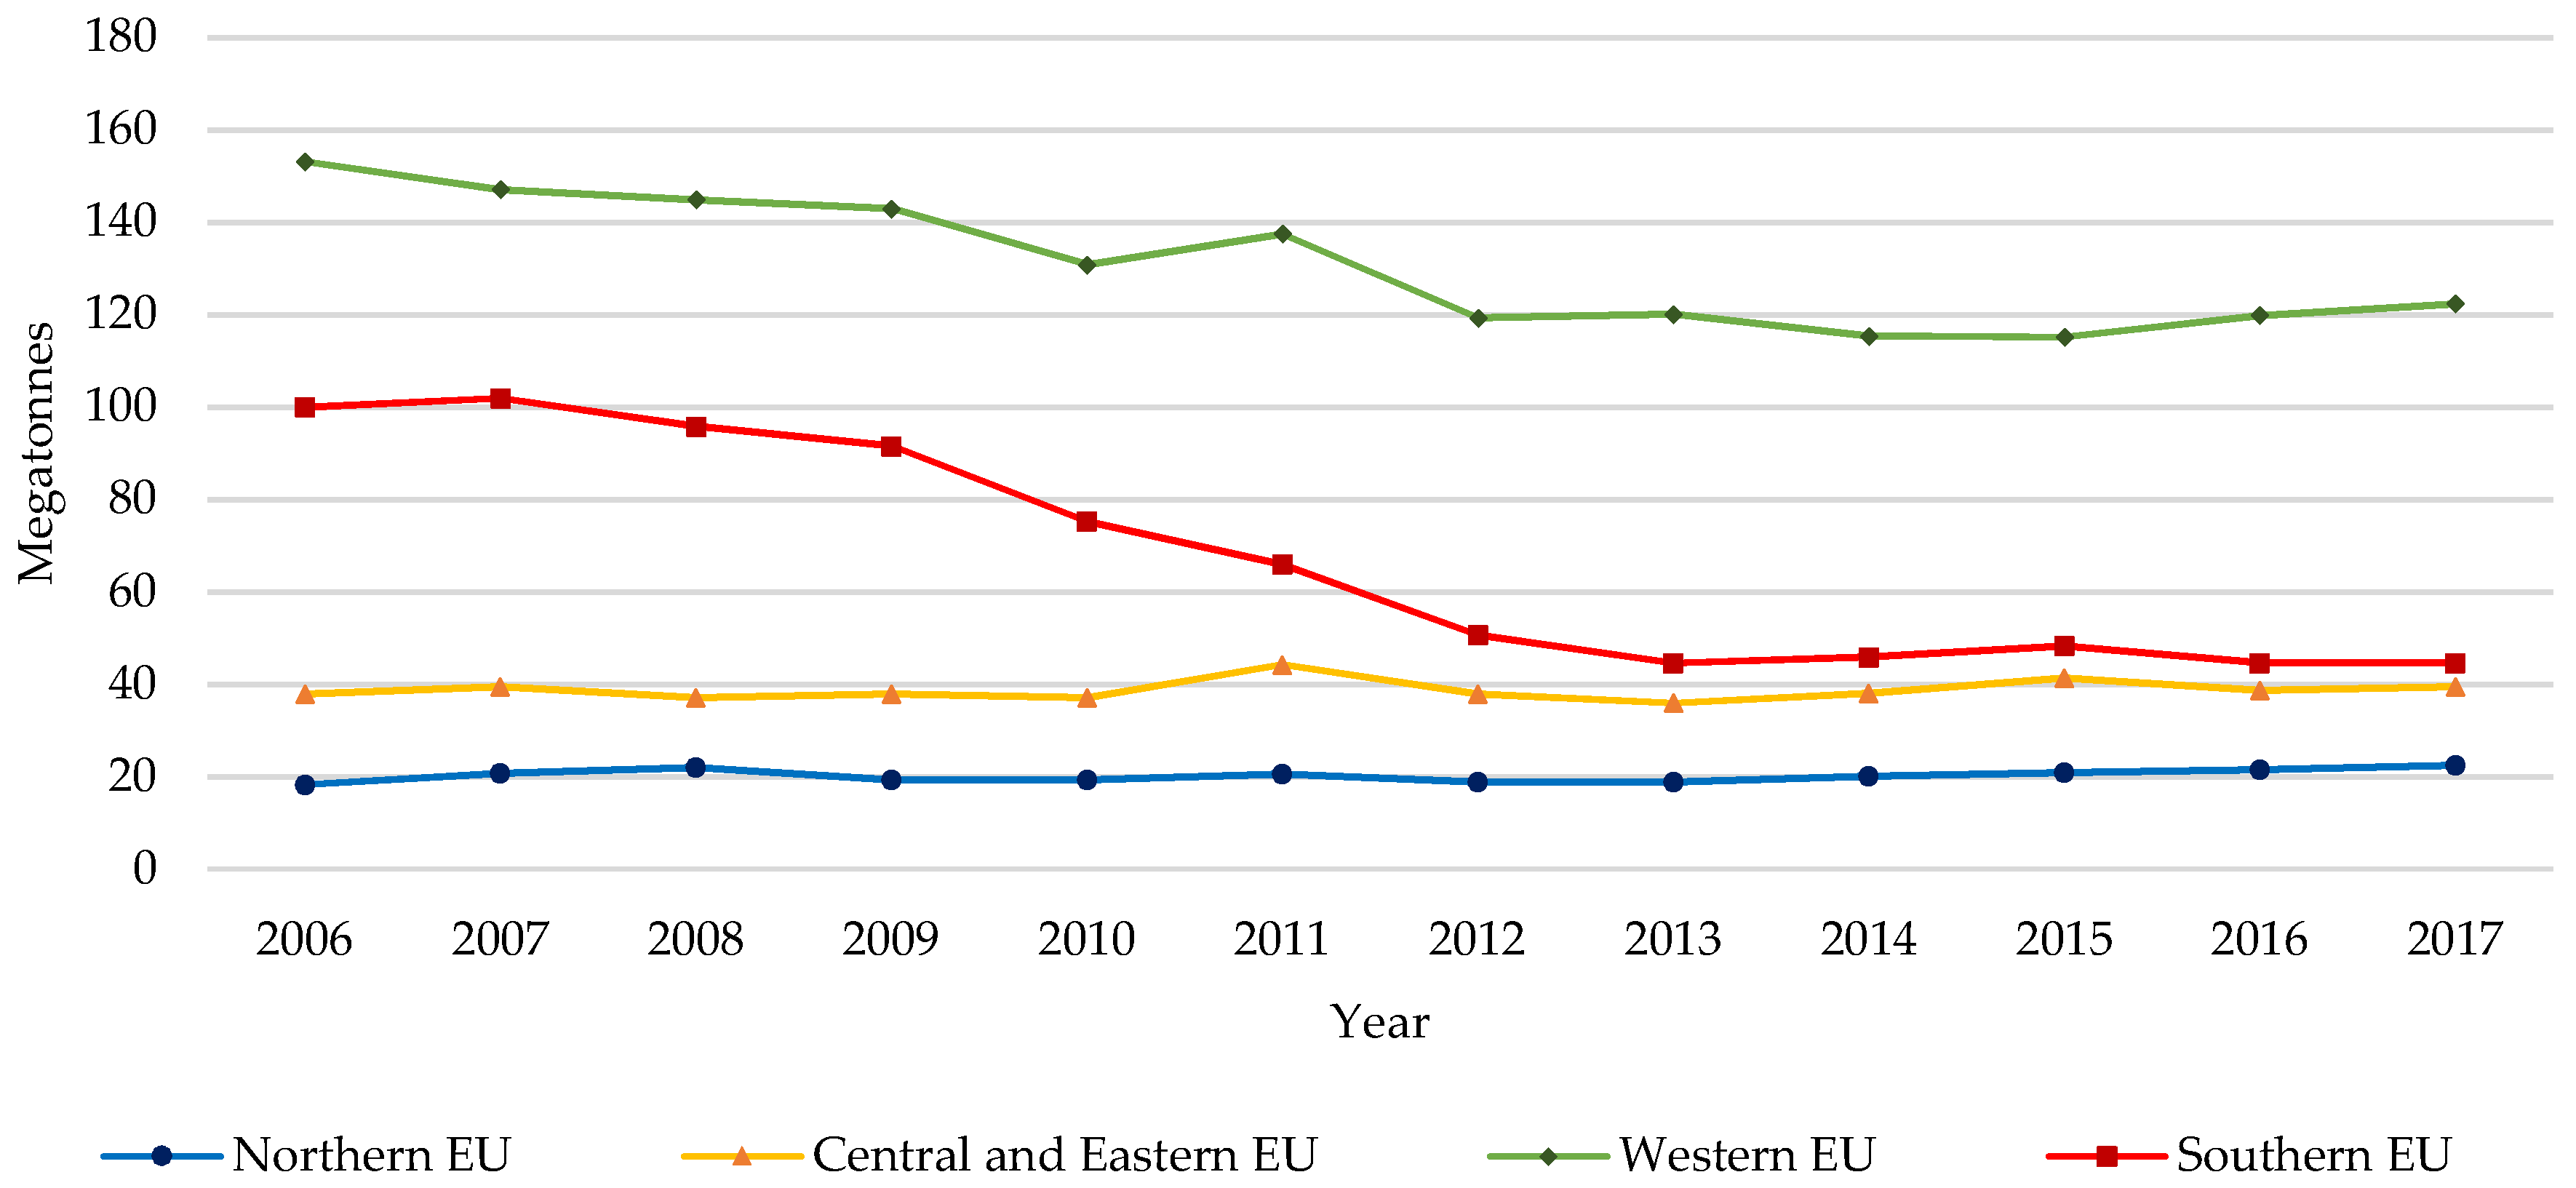
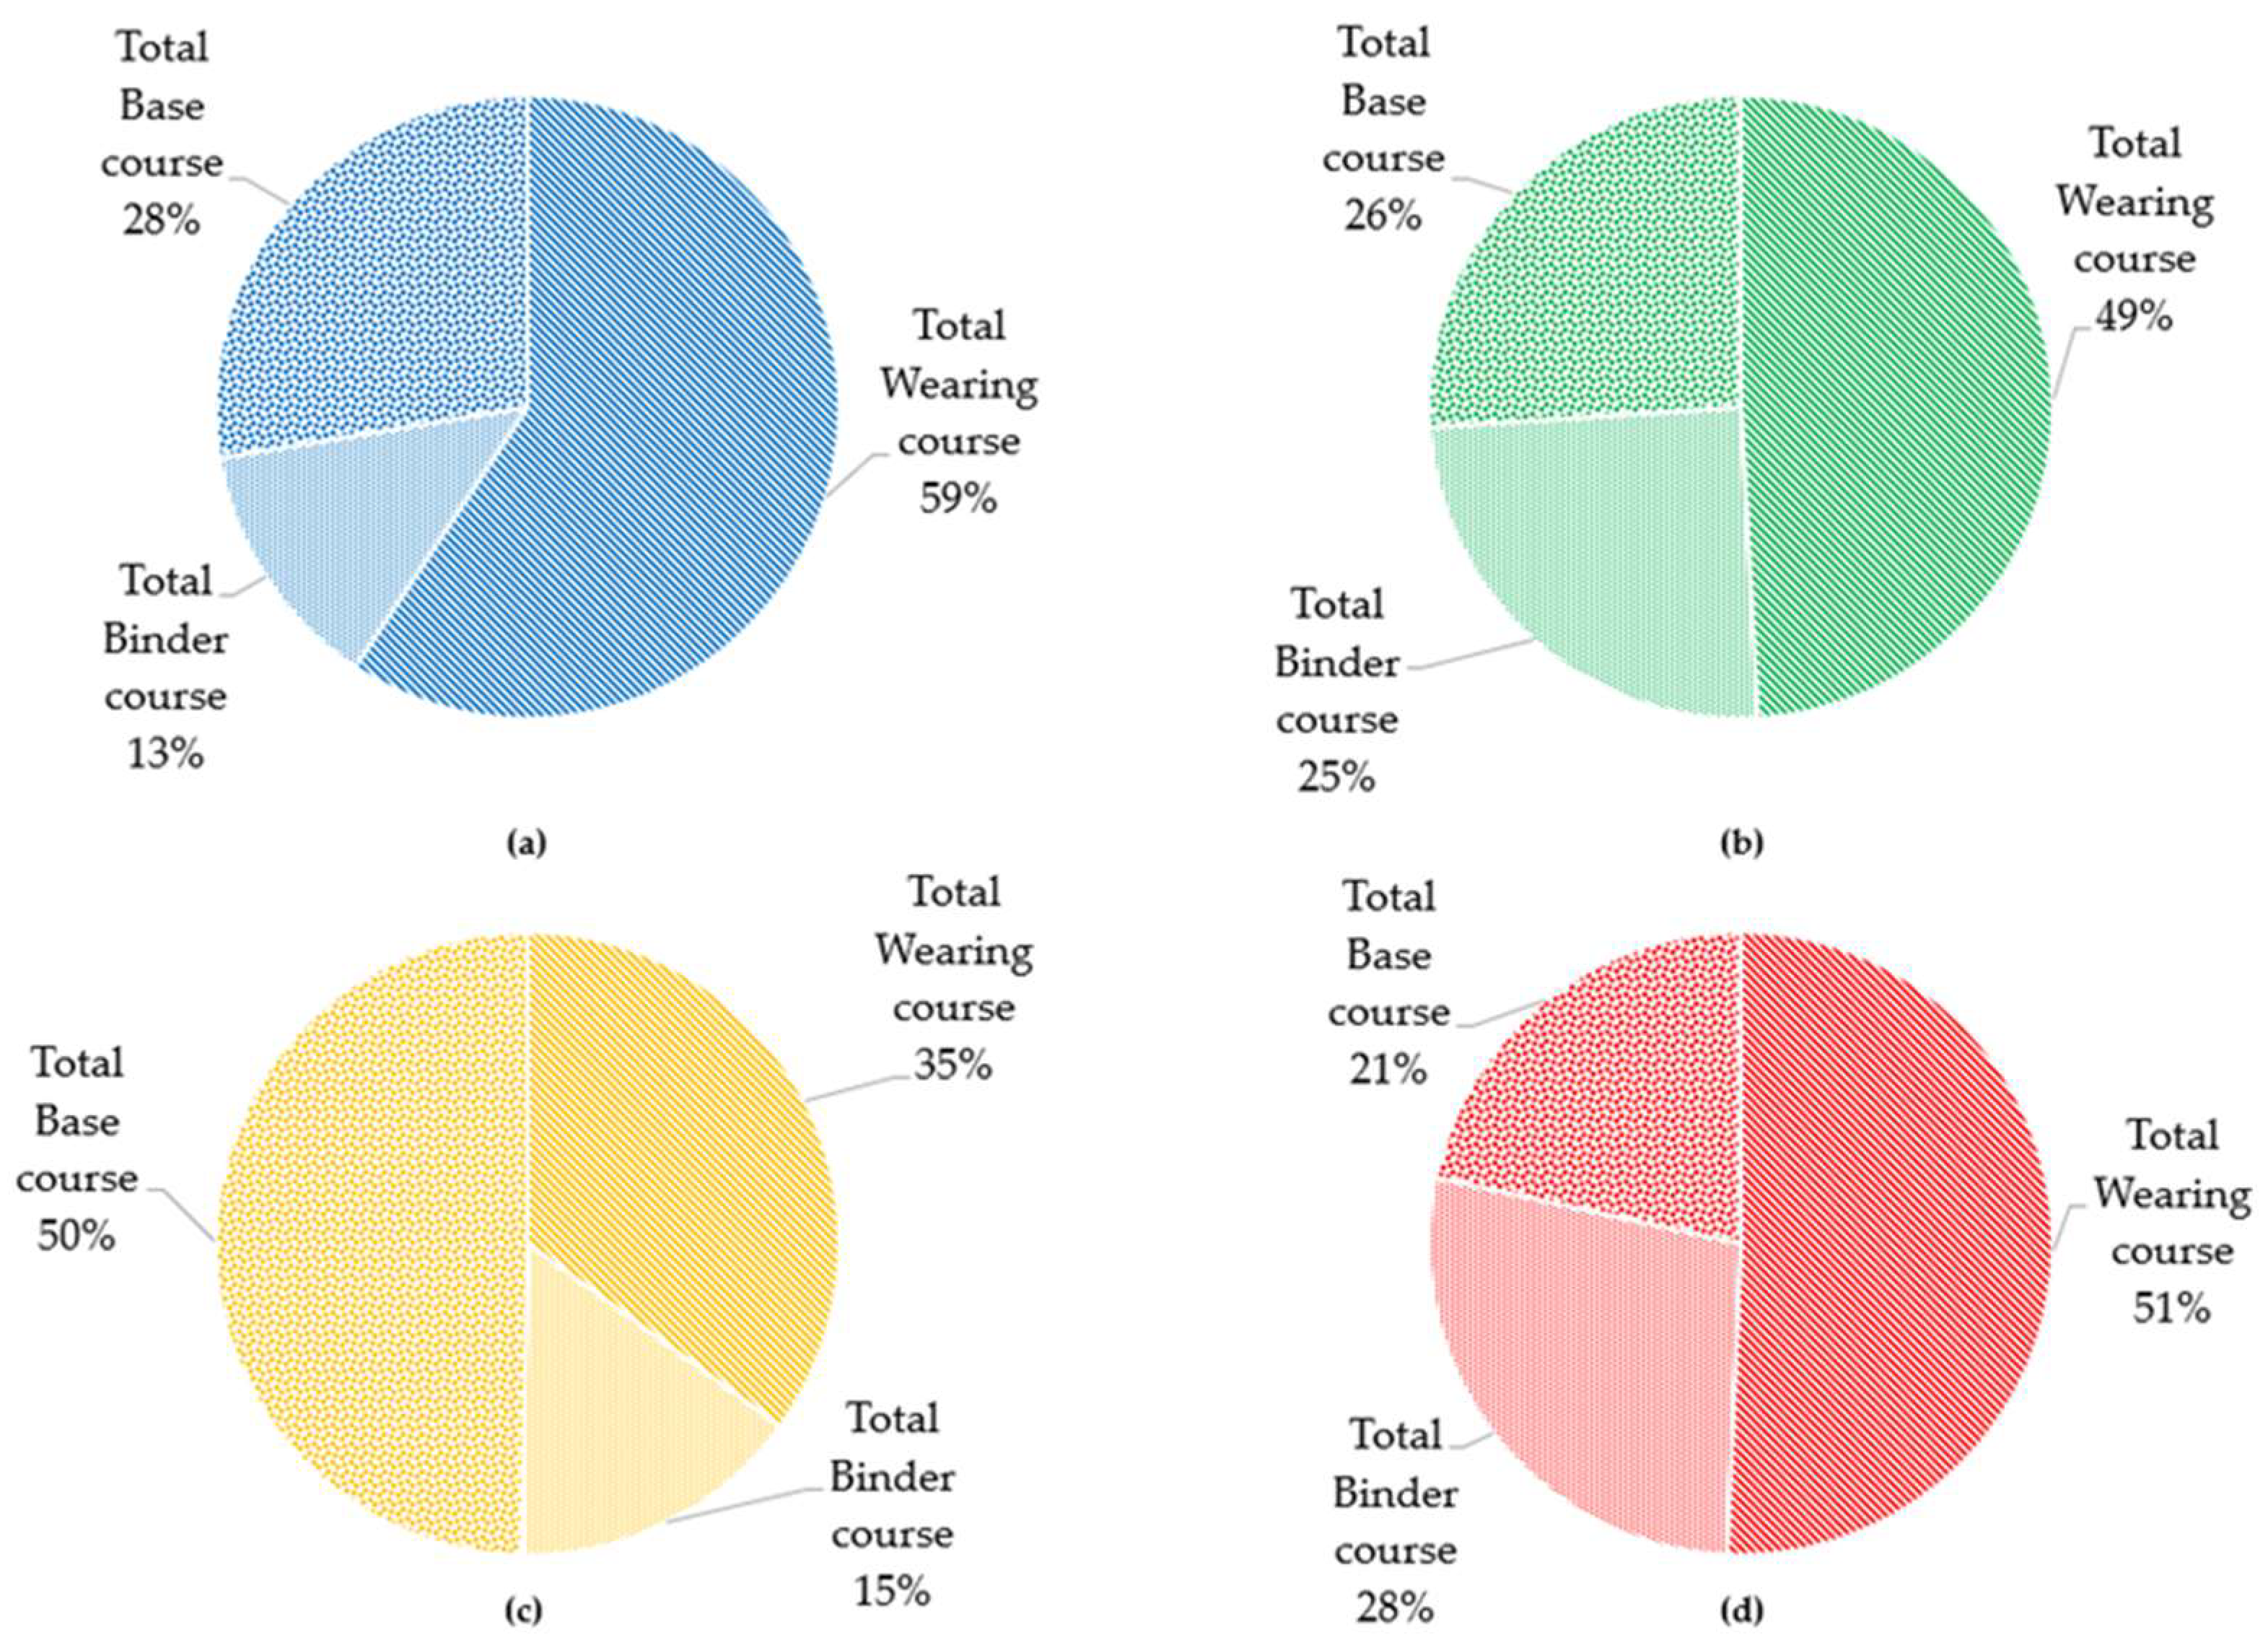
Following the data acquisition described in the previous sections, in Figure 7, Figure 8 and Figure 9, the total annual HWMA production per European region, the total utilization of this production in wearing, binder, and base courses, and its average percentage distribution in these layers are illustrated, respectively.
Hence, it can be safely deduced that the annual HWMA production for the Northern EU has remained almost static from 2006 to 2017, accounting for approximately 20 Megatonnes per year. The situation for Central and Eastern EU is quite similar in terms of its trend over the years, but with a higher average annual production, reaching about 40 Megatonnes. In the Western EU, the HWMA production has decreased over the years, starting from approximately 155 Megatonnes in 2006 and dropping to 120 Megatonnes in 2017, experiencing a decline of 23%. Moreover, in Southern EU the HWMA production in 2006 accounted for almost 100 Megatonnes and experienced a significant decrease of 50% by 2017, when approximately 50 Megatonnes of HWMA mixtures were produced. In terms of the average utilization of these mixtures, from Figure 9, it becomes obvious that the main pavement component in which they are utilized is the wearing course, followed by the base course, and finally the binder course. This fact emphasizes the high demand of asphalt mixture production addressed to wearing courses, indicating that surface layers are the largest “end-users” of asphalt mixtures and that most of the established rehabilitation regimes, including resurfacing or interventions, are focused on the wearing courses. In detail, especially in the Southern EU, where Italy is allocated to, more than 51% of the total HWMA production is intended for use in surface courses, and also according to the Italian regulations [63,64], the wearing course is the layer that experiences the lower allowed margin in terms of RA quantity, accounting for merely 20%.

4.2. Reclaimed Asphalt Recycling Rates, QF[a] and QF[p]

Quantifying now the RA recycling rate, along with the parameters QF[a] and QF[p], defined in Section 3.1, through the aforementioned Formulae (1)–(3), Table 4 illustrates the annual fluctuation of these parameters.
From the results presented in Table 4, it can be seen that there is a significant deviation between the available RA and the RA that is actually utilized in HWMA production, indicating an inadequate process of managing and exploiting the RA produced. This leads to an inefficiently circular approach of asphalt mixture production. The availability and the actual exploitation of RA have slowly and steadily increased in Northern and Western EU sections from 2006 to 2017, while for the Southern and Central and Eastern EU, the actual utilization of RA in HWMA production is almost the same over time. Moreover, in Figure 10, the total HWMA production per year and EU major region are compared to the total RA availability.
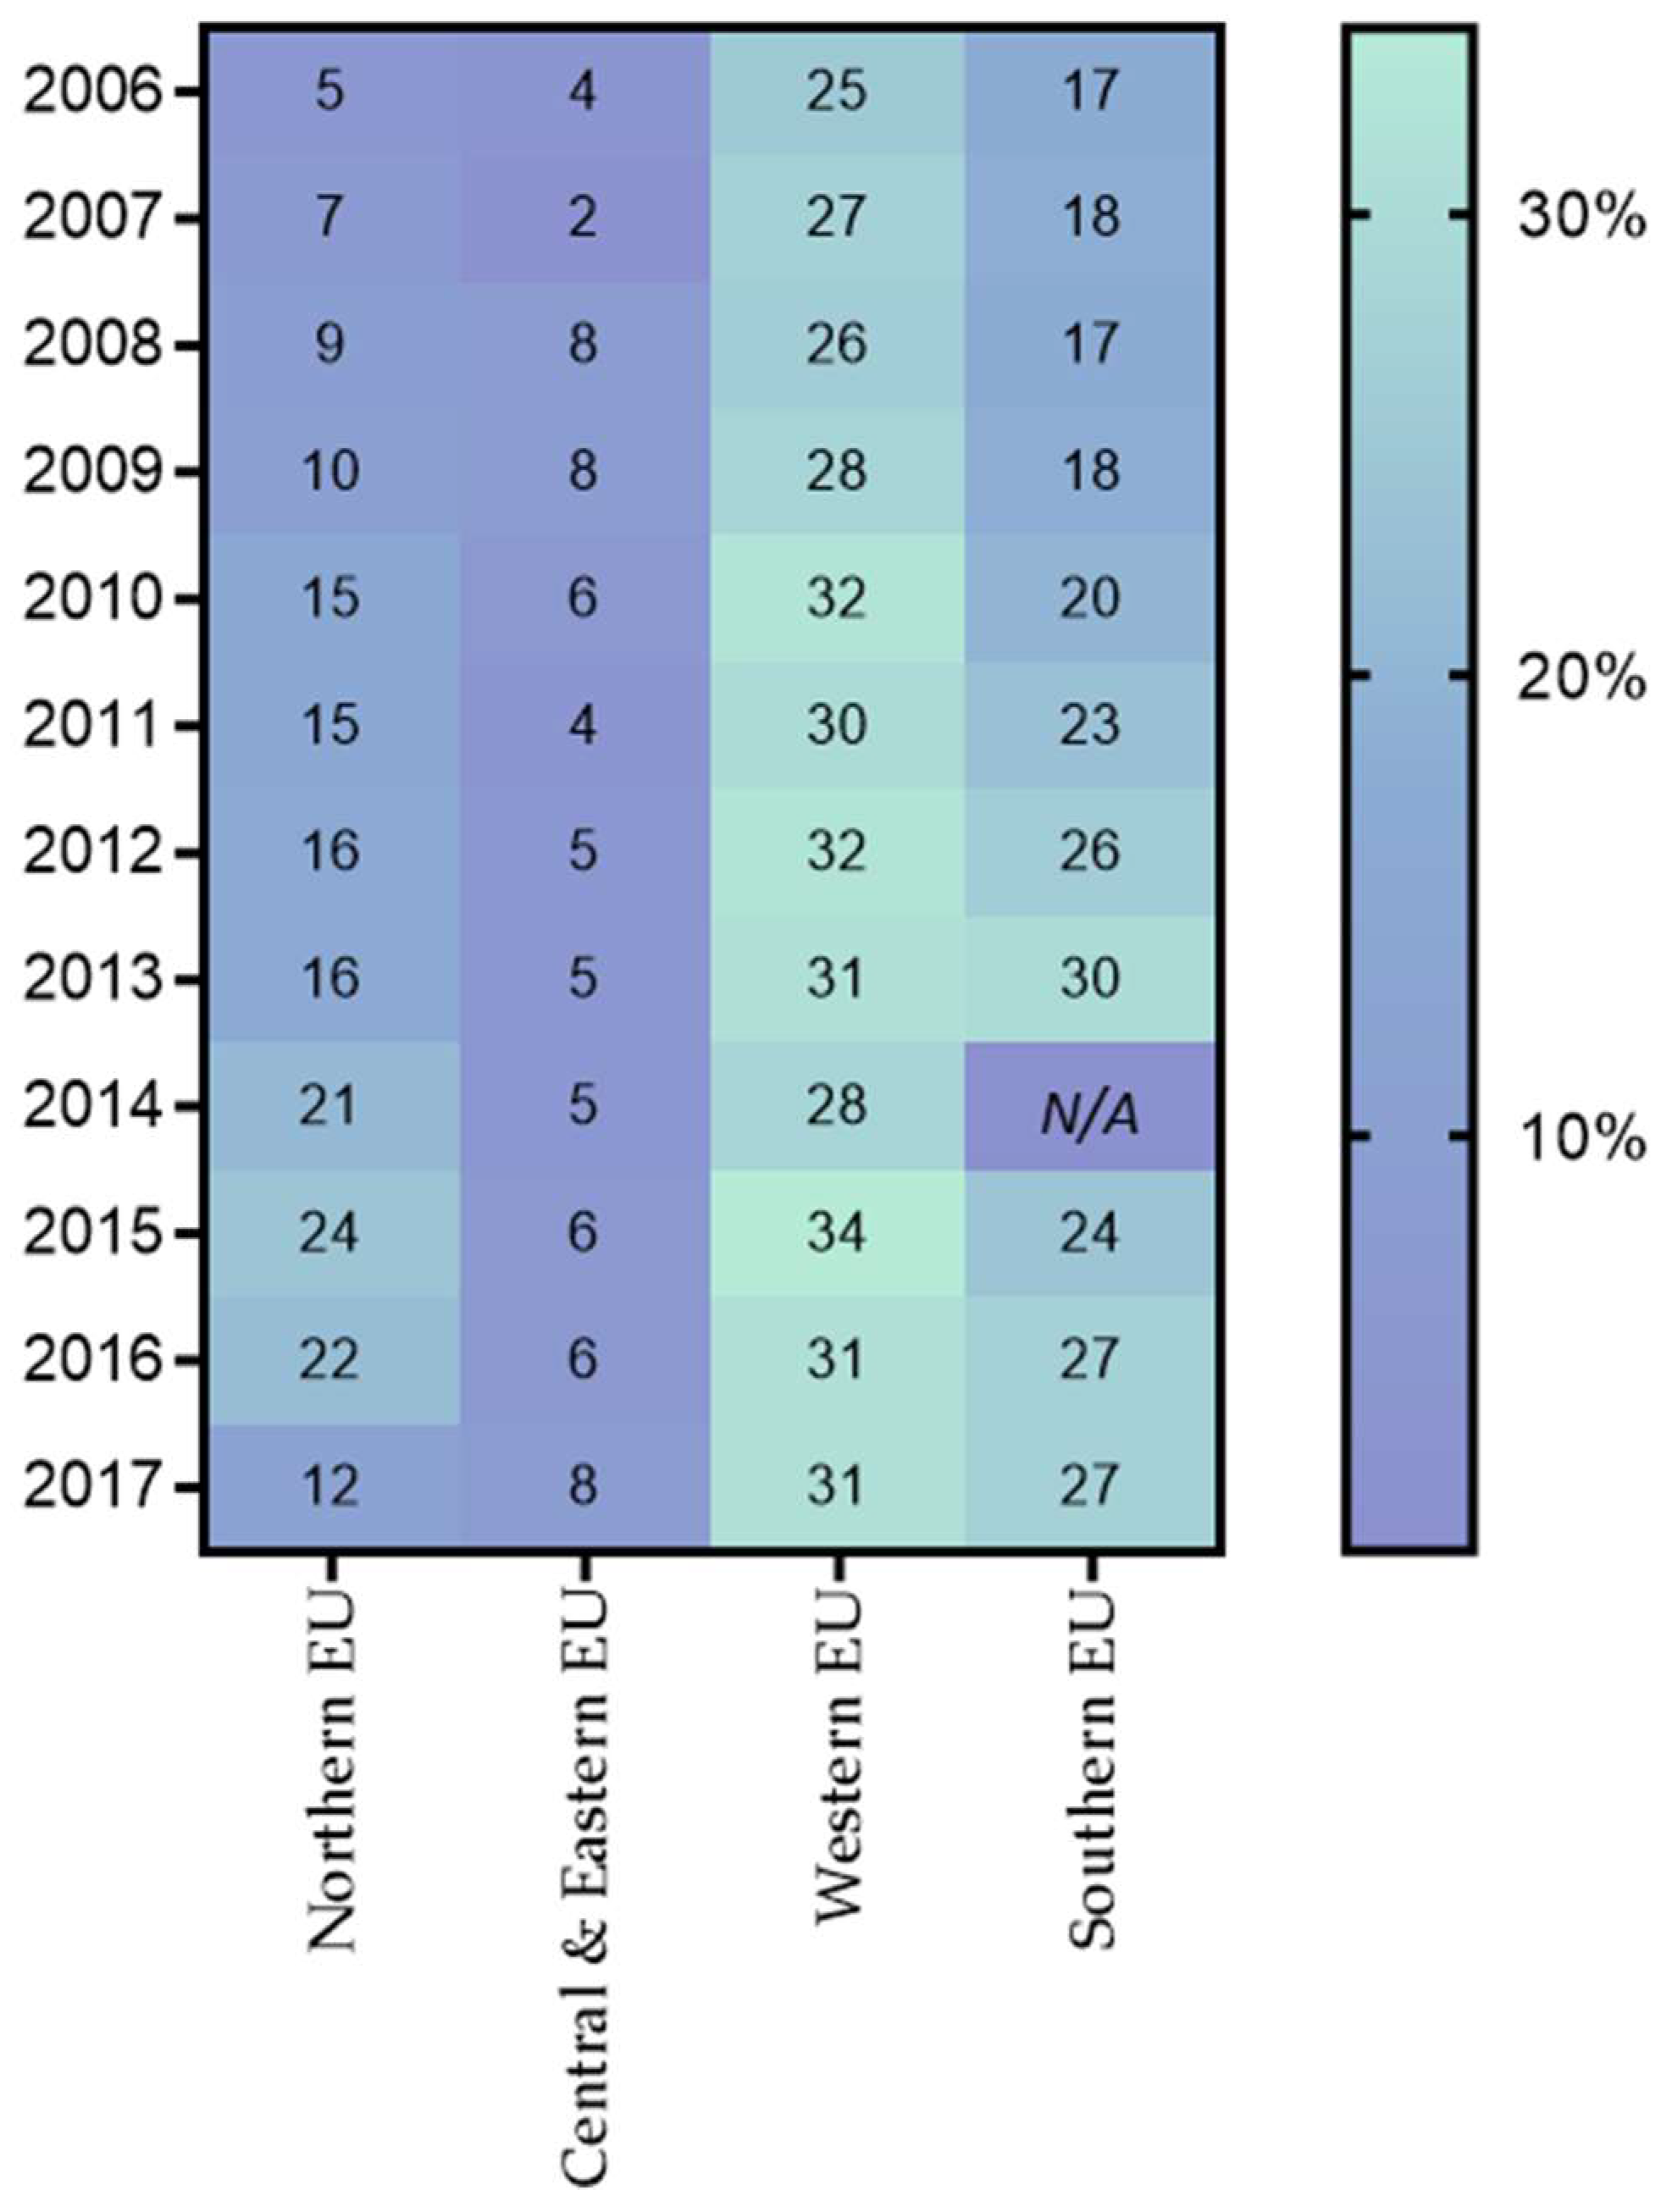
It can be deduced from this analysis that the production of RA is far from satisfying the market’s demand for HWMA production in all the EU sections. It is also worth mentioning that according to the values of QF[a] and QF[p], it seems that the goal of 100% recycling is far from being achieved. In an even broader consideration, it could be said that the sustainability of the whole process of the re-circulation of RA in the product system of asphalt pavements is significantly weak. For comparative reasons, after having calculated the total annual HWMA production, the total available RA and the RA utilized in HWMA production in EU, Table 5 has been created. The annual levels of possible decrease in HWMA production in the EU can be seen, considering the case that all the available RA is being utilized, namely if ΔU accounted for 1.
Finally, a heatmap illustrating the potential percentage reduction on HWMA production per year and EU section, after the implementation of the proposed CEM, was created and is presented in Figure 11.

4.3. Product Material Circularity Index of Italian Motorways per Layer

Having identified the weakness, in terms of circularity and sustainability, of the re-circulation process of RA into new asphalt pavements’ product systems, naturally, the next step that was undertaken was to quantify the levels of circularity of asphalt pavements themselves. To do so, the MCIMRA of the three basic bituminous layers of the asphalt pavements, namely, wearing, binder, and base course, constituting the motorway network of Italy, was quantified. For the quantification of the circularity levels of the pavements, the tailored Material Circularity Index Methodology was utilized, as described in Section 3.2. Finally, in Table 6, the final outputs of the calculation can be found, and are presented in Figure 12.
From the results of the calculation, the layer that exhibits the highest levels of circularity is the base course, which raises a controversy, since only 21% of the total HWMA production is intended for utilization in base courses. However, the percentage of RA incorporation in the base layer is significantly higher compared to the corresponding level in the upper layers, usually restricted to 10–30% in Italy, and the total mass of the mixtures required for the construction of the base courses is significantly increased (higher layer thickness). To improve the levels of circularity of every pavement layer, following a “back-calculating” process of the MCIMRA, the following recommendations could be provided:
  • Optimize the Utility [X] by extending the actual average lifetime of asphalt pavements, and thus the functional units achieved through their life cycle, by introducing more systematic and effective maintenance regimes.
  • Minimize the Linear Index flow (LFI) by reducing the utilization of virgin feedstock and increasing the feedstock originating from recycled sources; or in other words, maximize the potential of RA recycling.
It becomes obvious that in order to increase the circularity and sustainability of asphalt pavements, it is imperative for the technical viability of the layers that contain significantly high proportions of RA to be demonstrated and validated. This will allow the decision-makers and stakeholders to be finally able to alter technical standards and specifications towards the successful transition of the currently linear road engineering industry to a circular way of conducting business.

5. Summary and Conclusions

For a policy focused on effectively achieving the goals of sustainable development, innovative processes and product models must be developed so that economic, technical, and environmental advantages could simultaneously be achieved. An approach supplemented by the principles of the CE seems aligned with this purpose, since it supports the reduction of the exploitation of non-renewable resources and the minimization of polluting emissions on critical resources, such as air, water, and soil. The circular economic models are, therefore, based on production chains built on technical cycles that are systematically able to provide maintenance, reuse, refurbishment, and recycling of products and materials. To obtain meaningful results capable of positively altering the state of problems, such as climate change and the price of non-renewable raw materials, circular economic models must be applicable and generalizable on an extended geographical scale and on industrial processes that intensively involve large amounts of resources. Among these processes lies the construction of asphalt road pavements for new infrastructures, as well as their maintenance and management.
These processes involve intensive consumption of non-renewable raw materials, i.e., aggregates, and secondary materials, such as bitumen, and a resulting environmental impact in terms of air, soil, and water pollution. The end-product is the asphalt mixture, whose market has been analyzed, in an updated historical series on a European scale, disaggregating the data by distinct geographical areas and by type of mixture according to the final layer within the road pavement. Together with this analysis, the production of the reclaimed asphalt has also been investigated by defining three parameters (ΔU, QF[a], QF[p])] to evaluate both the actual and the potential influence of RA exploitation on the asphalt mixture production market. Such an analysis has led to several considerations. The HWMA production market, although still being characterized by a high value of produced quantities—around 230 Megatonnes in 2017—shows a substantially constant or slightly decreasing trend in supply. Consequently, the historical trend reveals a mature market for such a product. The supply of RA shows a similar trend, with a lower rate of production equal to approximately 44 Megatonnes in 2017, even with different demands allocated to the sub-divided major EU regions. The highest values are detected in Northern and Western EU (in average countries which are economically more advanced), and the lowest ones in Southern and Central EU.
On the basis of the market analysis, a CEM for asphalt mixtures with RA as end-products seems to be the optimal way to evaluate their actual rate of circularity to identify both the strengths and weaknesses of the production process and to highlight the sensitive points to be discussed. The developed model, according to the general framework proposed by the Ellen MacArthur Foundation, is based on the philosophy of a closed loop and adopts the whole product approach within the product level methodology. Such a model provides a rigorous quantification of the product’s circularity, expressed as Product Material Circularity Index (MCIMRA). In this index, the Utility function, expressed as the ratio between the mechanical resistance of the end-product and the current or reference product, is the most relevant in order to drive the transition from a linear product to a circular one. In this case, it appeared conceptually sound to measure the Utility function in terms of rutting for the wearing course, while in terms of fatigue for the remaining bituminous layers, since these phenomena are the main drivers of expected design life of the asphalt layers. In addition, it is worth noting that the proposed model refers to a single cycle, but it may be easily extended over more cycles.
The Italian motorway network has been chosen, as a representative scenario, since this country belongs to an EU region where a large part of the demand, up to around 30%, might be met by fully exploiting the available RA. The results in terms of MCIMRA can be considered unsatisfactory. In other words, the end-product is linear for two main reasons: the very low production rate of recycled feedstock and the significantly low allowed limits of incorporating RA into the mixtures that compose the different pavement layers. It is worth considering that the RA production rate depends on the technical specification limits—something that is accurate only to a certain extent. If QF[p] was equal to QF[a], i.e., ΔU = 1, the MCIMRA of the wearing course, for instance, would reach the value of 0.458, which would suggest a 115% improvement. Under the assumption of also increasing the regulatory limits of the allowed RA to be incorporated up to the values tested by different authors, the aforementioned MCIMRA would reach the value of 0.567, which is 166% higher value than the first one. The same trend, but with a higher magnitude, for the binder and base courses can be observed in Figure 13.
Therefore, pursuing an effective policy aimed at implementing the principles of sustainability and CE, strong cooperation between stakeholders should be considered, focused on optimizing:
  • ΔU, by encouraging waste recycling techniques, while at the same time discouraging landfilling through incentives, bonuses, and penalties;
  • PRA, by increasing the allowed limits of RA incorporation in the asphalt mixtures, following the current direction of scientific research;
  • X, by increasing the utility factor through an appropriate and specifically tailored mix design addressed to RA;
  • F[X], by further analyzing and fully defining the parameter of utility function according to an “ad hoc” structure for the end product;
  • Capability and Efficiency, by accordingly adapting and strengthening the asphalt production chain, with particular reference to the structure and equipment of the treatment and mixing plants.

Author Contributions

Conceptualization, K.M. and G.D.M.; Methodology, K.M. and G.D.M.; Validation, K.M. and G.D.M.; Formal Analysis, K.M..; Investigation, K.M. and G.D.M.; Data Curation, K.M..; Writing—Original Draft Preparation, K.M. and G.D.M.; Writing—Review & Editing, K.M. and G.D.M.; Visualization, K.M. and G.D.M.; Supervision, G.D.M.; Project Administration, G.D.M.; Funding Acquisition, G.D.M.

Funding

The SMARTI ETN project has received funding from the European Union’s Horizon 2020 Program under the Marie Curie-Skłodowska actions for research, technological development, and demonstration, under Grant No. 721493. The research presented in this paper was carried out as part of the SMARTI ETN ESR10: “LCSA4TRANSPORT”.

Conflicts of Interest

The authors declare no conflict of interest.

Disclaimer

The contents of this paper reflect the views of the authors, who are responsible for the facts and the accuracy of the data presented. Any inclusion of manufacturer names, trade names, or trademarks is for identification purposes only and is not to be considered an endorsement. Moreover, this paper does not constitute a standard, specification, or regulation.

References

  1. Barrag, A. The Role of Renewable Energy in the Promotion of Circular Urban Metabolism. Sustainability 2017, 9, 2341. [Google Scholar] [Green Version]
  2. BSI. Framework for Implementing the Principles of the Circular Economy in Organizations—Guide; BSI Standards Publication; BSI: London, UK, 2017. [Google Scholar]
  3. Swagemakers, P.; Dolores, M.; Garcia, D.; Wiskerke, J.S.C. Socially-Inclusive Development and Value Creation: How a Composting Project in Galicia (Spain) ‘Hit the Rocks’. Sustainability 2018, 10, 2040. [Google Scholar] [CrossRef]
  4. Huang, Y.; Ning, Y.; Zhang, T.; Wu, J. Measuring Carbon Emissions of Pavement Construction in China. Sustainability 2016, 8, 723. [Google Scholar] [CrossRef]
  5. Gregson, N.; Crang, M.; Fuller, S.; Holmes, H. Interrogating the circular economy: the moral economy of resource recovery in the EU. Econ. Soc. 2015, 44, 218–243. [Google Scholar] [CrossRef] [Green Version]
  6. Vanner, R.; Bicket, M.; Withana, S.; Brink, P. Ten; Razzini, P.; Dijl, E. Van; Watkins, E.; Hestin, M.; Tan, A.; Guilche, S.; et al. Scoping Study to Identify Potential Circular Economy Actions, Priority Sectors, Material Flows and value Chains; Luxembourg Publications Office of the European Union: Luxembourg, 2014; ISBN 9789279401664. [Google Scholar]
  7. Boulding, K.E. Environmental Quality in a Growing Economy; RFF Press: Washington, DC, USA, 2011; pp. 3–14. [Google Scholar]
  8. Dobbs, C.G. Silent spring. Forestry 1962, 36, 195–198. [Google Scholar] [CrossRef]
  9. Clark, G.; Kosoris, J.; Hong, L.N.; Crul, M. Design for Sustainability: Current Trends in Sustainable Product Design and Development. Sustainability 2009, 1, 409–424. [Google Scholar] [CrossRef]
  10. Ellen MacArthur Foundation. Towards a Circular Economy: Business Rationale for an Accelerated Transition. Greener Manag. Int. 2015, 20, 13–34. [Google Scholar]
  11. Ellen MacArthur Foundation. Cities in the Circular Economy: An Initial Exploration; Ellen MacArthur Foundation: Cowes, UK, 2017; 16p. [Google Scholar]
  12. Frodermann, L. Exploratory Study on Circular Economy Approaches, Acpmparative Analysis of Theory and Practice; Springer: Berlin/Heidelberg, Germany, 2018. [Google Scholar]
  13. Ellen MacArthur Foundation. Towards the Circular Economy. Vol. 3: Accelerating the Scale-Up Across Global Supply Chains; Ellen MacArthur Foundation: Cowes, UK, 2014; pp. 1–64. [Google Scholar]
  14. Tran, T.; Park, J.Y. Development of a Novel Co-Creative Framework for Redesigning Product Service Systems. Sustainability 2016, 8, 434. [Google Scholar] [CrossRef]
  15. Goedkoop, M.J.; van Halen, C.J.G.; te Riele, H.R.M.; Rommens, P.J.M. Product Service Systems, Ecological and Economic Basics. Technical Report. Available online: https://teclim.ufba.br/jsf/indicadores/holan%20Product%20Service%20Systems%20main%20report.pdf (accessed on 8 March 2019).
  16. Chen, C. Guidance on the Conceptual Design of Sustainable Product—Service Systems. Sustainability 2018, 10, 2452. [Google Scholar] [CrossRef]
  17. AECOM and Atkins. Circular Economy Approach and Routemap; Highways England: Guildford, UK, 2016; Available online: https://highwaysengland.co.uk/knowledge-compendium/knowledge/publications/circular-economy-approach-and-routemap/index.html (accessed on 8 March 2019).
  18. LWARB. London’S Circular Economy Route Map; London Waste and Recycling Board: London, UK, 2017. Available online: https://www.lwarb.gov.uk/wp-content/uploads/2015/04/LWARB-London%E2%80%99s-CE-route-map_16.6.17a_singlepages_sml.pdf (accessed on 8 March 2019).
  19. Opportunity Peterborough. Circular Peterborough Circular City Roadmap–An Ambitious Plan & Performance Monitoring Framework towards 2021; Future Peterborough: Peterborough, UK, 2018; Available online: http://www.futurepeterborough.com/wp-content/uploads/2018/05/PREVIEW_Peterboroughs-Circular-City-Roadmap.pdf (accessed on 8 March 2019).
  20. Dai, B.; Lu, X. Evaluation of Mechanical Properties of a New Warm-Mix Asphalt using Sylvaroad Additive. Athens J. Technol. Eng. 2013, X, 1–14. [Google Scholar]
  21. Copeland, A. Reclaimed Asphalt Pavement in Asphalt Mixtures: State of the Practice; Rep. No. FHWA-HRT-11-021; Research, Development, and Technology Turner-Fairbank Highway Research Center: McLean, VA, USA, 2011; pp. 1–60. [Google Scholar]
  22. Gao, L.; Li, H.; Xie, J.; Yu, Z.; Charmot, S. Evaluation of pavement performance for reclaimed asphalt materials in different layers. Constr. Build. Mater. 2018, 159, 561–566. [Google Scholar] [CrossRef]
  23. Wang, Y.; Leng, Z.; Li, X.; Hu, C. Cold recycling of reclaimed asphalt pavement towards improved engineering performance. J. Clean. Prod. 2018, 171, 1031–1038. [Google Scholar] [CrossRef]
  24. Huang, Y.; Galatioto, F.; Parry, T.; Ne, T. Road pavement maintenance life cycle assessment—A UK case study. In Proceedings of the International Symposium on Pavement LCA, Davis, CA, USA, 14–16 October 2014; pp. 179–190. [Google Scholar]
  25. Birgisdóttir, H.; Pihl, K.A.; Bhander, G.; Hauschild, M.Z.; Christensen, T.H. Environmental assessment of roads constructed with and without bottom ash from municipal solid waste incineration. Transp. Res. Part D Transp. Environ. 2006, 11, 358–368. [Google Scholar] [CrossRef]
  26. Mroueh, U.M.; Laine-Ylijoki, J.; Eskola, P. Life-cycle impacts of the use of industrial by-products in road and earth construction. Waste Manag. Ser. 2000, 1, 438–448. [Google Scholar]
  27. Lo Presti, D.; Jiménez Del Barco Carrión, A.; Airey, G.; Hajj, E. Towards 100% recycling of reclaimed asphalt in road surface courses: Binder design methodology and case studies. J. Clean. Prod. 2016, 131, 43–51. [Google Scholar] [CrossRef]
  28. European Asphalt Pavement Association. Asphalt in Figures 2006; European Asphalt Pavement Association: Brussels, Belgium, 2006. [Google Scholar]
  29. European Asphalt Pavement Association. Asphalt in Figures 2007; European Asphalt Pavement Association: Brussels, Belgium, 2007. [Google Scholar]
  30. European Asphalt Pavement Association. Asphalt in Figures 2008; European Asphalt Pavement Association: Brussels, Belgium, 2008. [Google Scholar]
  31. European Asphalt Pavement Association. Asphalt in Figures 2009; European Asphalt Pavement Association: Brussels, Belgium, 2009. [Google Scholar]
  32. European Asphalt Pavement Association. Asphalt in Figures 2010; European Asphalt Pavement Association: Brussels, Belgium, 2010. [Google Scholar]
  33. European Asphalt Pavement Association. Asphalt in Figures 2011; European Asphalt Pavement Association: Brussels, Belgium, 2011. [Google Scholar]
  34. European Asphalt Pavement Association. Asphalt in Figures 2012; European Asphalt Pavement Association: Brussels, Belgium, 2012. [Google Scholar]
  35. European Asphalt Pavement Association. Asphalt in Figures 2013; European Asphalt Pavement Association: Brussels, Belgium, 2013. [Google Scholar]
  36. European Asphalt Pavement Association. Asphalt in Figures 2014; European Asphalt Pavement Association: Brussels, Belgium, 2014. [Google Scholar]
  37. European Asphalt Pavement Association. Asphalt In Figures 2015; European Asphalt Pavement Association: Brussels, Belgium, 2015. [Google Scholar]
  38. European Asphalt Pavement Association. Asphalt in Figures 2016; European Asphalt Pavement Association: Brussels, Belgium, 2016. [Google Scholar]
  39. European Asphalt Pavement Association. Asphalt in Figures 2017; European Asphalt Pavement Association: Brussels, Belgium, 2017. [Google Scholar]
  40. Miliutenko, S.; Björklund, A.; Carlsson, A. Opportunities for environmentally improved asphalt recycling: The example of Sweden. J. Clean. Prod. 2013, 43, 156–165. [Google Scholar] [CrossRef]
  41. Blasl, A.; Kraft, J.; Presti, D. Lo; Mino, G. Di; Wellner, F. Performance of asphalt mixes with high recycling rates for wearing layers. In Proceedings of the 6th Eurasphalt Eurobitume Congress, Prague, Czech Republic, 1–3 June 2016. [Google Scholar]
  42. Maupin, G.W.; Diefenderfer, S.D.; Gillespie, J.S. Evaluation of Using Higher Percentages of Recycled Asphalt Pavement in Asphalt Mixes in Virginia; The Virginia Transportation Research Council: Charlottesville, VA, USA, 2008; 29p. [Google Scholar]
  43. Celauro, C.; Bernardo, C.; Gabriele, B. Production of innovative, recycled and high-performance asphalt for road pavements. Resour. Conserv. Recycl. 2010, 54, 337–347. [Google Scholar] [CrossRef]
  44. McDaniel, R.S.; Shah, A. Use of reclaimed asphalt pavement (RAP) under Superpave specifications. Asph. Paving Technol. 2003, 72, 226–252. [Google Scholar]
  45. Silva, H.M.R.D.; Oliveira, J.R.M.; Jesus, C.M.G. Are totally recycled hot mix asphalts a sustainable alternative for road paving? Resour. Conserv. Recycl. 2012, 60, 38–48. [Google Scholar] [CrossRef]
  46. Tran, D.H.; Kim, D.S. Minimum latency and energy efficiency routing with lossy link awareness in wireless sensor networks. In Proceedings of the 2012 9th IEEE International Workshop on Factory Communication Systems, WFCS, Lemgo, Germany, 21–24 May 2012; pp. 75–78. [Google Scholar]
  47. Falla, G.; Blasl, A.; Millow, R.; Lo Presti, D. Mix design considerations for asphalt wearing courses with high reclaimed asphalt content. In Proceedings of the 6th International Conference Bituminous Mixtures and Pavements, Thessaloniki, Greece, 10–12 June 2015; pp. 561–566. [Google Scholar]
  48. Bueche, N.; Dumont, A.; Pittet, M.; Bressi, S. 8th International RILEM Symposium on Testing and Characterization of Sustainable and Innovative Bituminous Materials, SIB 2015. Int. J. Pavement Res. Technol. 2014, 7, IV. [Google Scholar]
  49. EAPA. Guidance Document for preparing Product Category Rules (PCR) and Environmental Product Declarations (EPD) for Asphalt Mixtures by the European Asphalt Pavement Association (EAPA) 2 nd November 2016; EAPA: Arlington County, VA, USA, 2016. [Google Scholar]
  50. Williams, J. Circular Cities: Challenges to Implementing Looping Actions. Sustainability 2019, 11, 423. [Google Scholar] [CrossRef]
  51. Lewandowski, M. Designing the Business Models for Circular Economy—Towards the Conceptual Framework. Sustainability 2016, 8, 43. [Google Scholar] [CrossRef]
  52. Frank, H.J. Circularity Indicator. Circ. Indic. Approach Meas. Circ. Methodol. 2006, 23, 159–161. [Google Scholar]
  53. Huang, B.; Kingery, W.; Zhang, Z.; Zuo, G. Laboratory study of fatigue characteristics of HMA surface mixtures containing RAP. In Proceedings of the 83rd Annual Meeting Transportation Research Board, Washington, DC, USA, 11–15 January 2004. [Google Scholar]
  54. Norouzi, A.; Sabouri, M.; Kim, Y. Evaluation of the fatigue performance of asphalt mixtures with high RAP content. Asph. Pavements 2014, 8, 1069–1077. [Google Scholar]
  55. Al-Qadi, I.L.; Aurangzeb, Q.; Carpenter, S.H.; Pine, W.J.; Trepanier, J. Impact of High RAP Content on Structural and Performance Properties of Asphalt Mixtures; Illinois Center for Transportation: Rantoul, IL, USA, 2012; pp. 7–41. [Google Scholar]
  56. Tang, S.; Williams, R.C.; Professor, M.; Wang, K.; Jahren, C.; Stephenson, W.R.; Olafsson, S. Evaluate the Fracture and Fatigue Resistances of Hot Mix Asphalt Containing High Percentage Reclaimed Asphalt Pavement (RAP) Materials at Low and Intermediate Temperatures. Ph.D. Thesis, Iowa State University, Ames, IA, USA, 2014. [Google Scholar]
  57. Sonmez, I.; Yildirim, S.A.; Temren, Z. Investigation of performance properties of laboratory and plant produced bituminous mixture containing high rates of reclaimed asphalt. In Proceedings of the 6th Eurasphalt & Eurobitume Congress, Prague, Czech Republic, 1–3 June 2016. [Google Scholar]
  58. Al-Rousan, T.; Asi, I.; Al-Hattamleh, O.; Al-Qablan, H. Performance of asphalt mixes containing RAP. Jordan J. Civ. Eng. 2008, 2, 218–227. [Google Scholar]
  59. Tabakovic, A.; Gibney, A.; Gilchrist, M.D.; Mcnally, C. The Influence of Recycled Asphalt Pavement on 20 mm Binder Course Mix Performance. In Proceedings of the 3rd National Symposium on Bridge and Infrastructure Research, Ireland, Dublin, 2016; Available online: https://researchrepository.ucd.ie/handle/10197/2328 (accessed on 15 March 2019).
  60. Tabaković, A.; Gibney, A.; McNally, C.; Gilchrist, M.D. Influence of Recycled Asphalt Pavement on Fatigue Performance of Asphalt Concrete Base Courses. J. Mater. Civ. Eng. 2010, 22, 643–650. [Google Scholar] [CrossRef] [Green Version]
  61. Bańkowski, W. Evaluation of Fatigue Life of Asphalt Concrete Mixtures with Reclaimed Asphalt Pavement. Appl. Sci. 2018, 8, 469. [Google Scholar] [CrossRef]
  62. Linder, M.; Sarasini, S.; van Loon, P. A Metric for Quantifying Product-Level Circularity. J. Ind. Ecol. 2017, 21, 545–558. [Google Scholar] [CrossRef] [Green Version]
  63. CNR—Consiglio Nazionale Delle Ricerche. Bolletino Ufficiale, Parte IV, Norme Techiche, A.XXiX—N.178., Catalogo delle Pavimentazioni Stradali; Commissione di studio per le norme relative ai materiali stradali e costruzione e manutenzione strade, Piazzale Aldo Moro: Roma, Italy, 15 Settembre 1995. [Google Scholar]
  64. Ministero Dei Lavori Pubblici, Apitolato Speciale D’Appalto Tipo Per Lavori Stradali, Articolo 8- Conglomerati bituminosi riciclati a freddo, Formazione di strati in conglomerato bituminoso riciclato a freddo, 1–6. Available online: http://www.mucchilab.it/_img/_pdf/54.pdf (accessed on 15 March 2019).
  65. Don Brock, J.; Richmond, J.L. Milling and Recycling; ASTEC, INC.: Chattanooga, TN, USA, 2007; pp. 3–27. Available online: https://www.astecinc.com/images/file/literature/Astec-T-127-Milling-Recycling-EN.pdf (accessed on 8 April 2019).
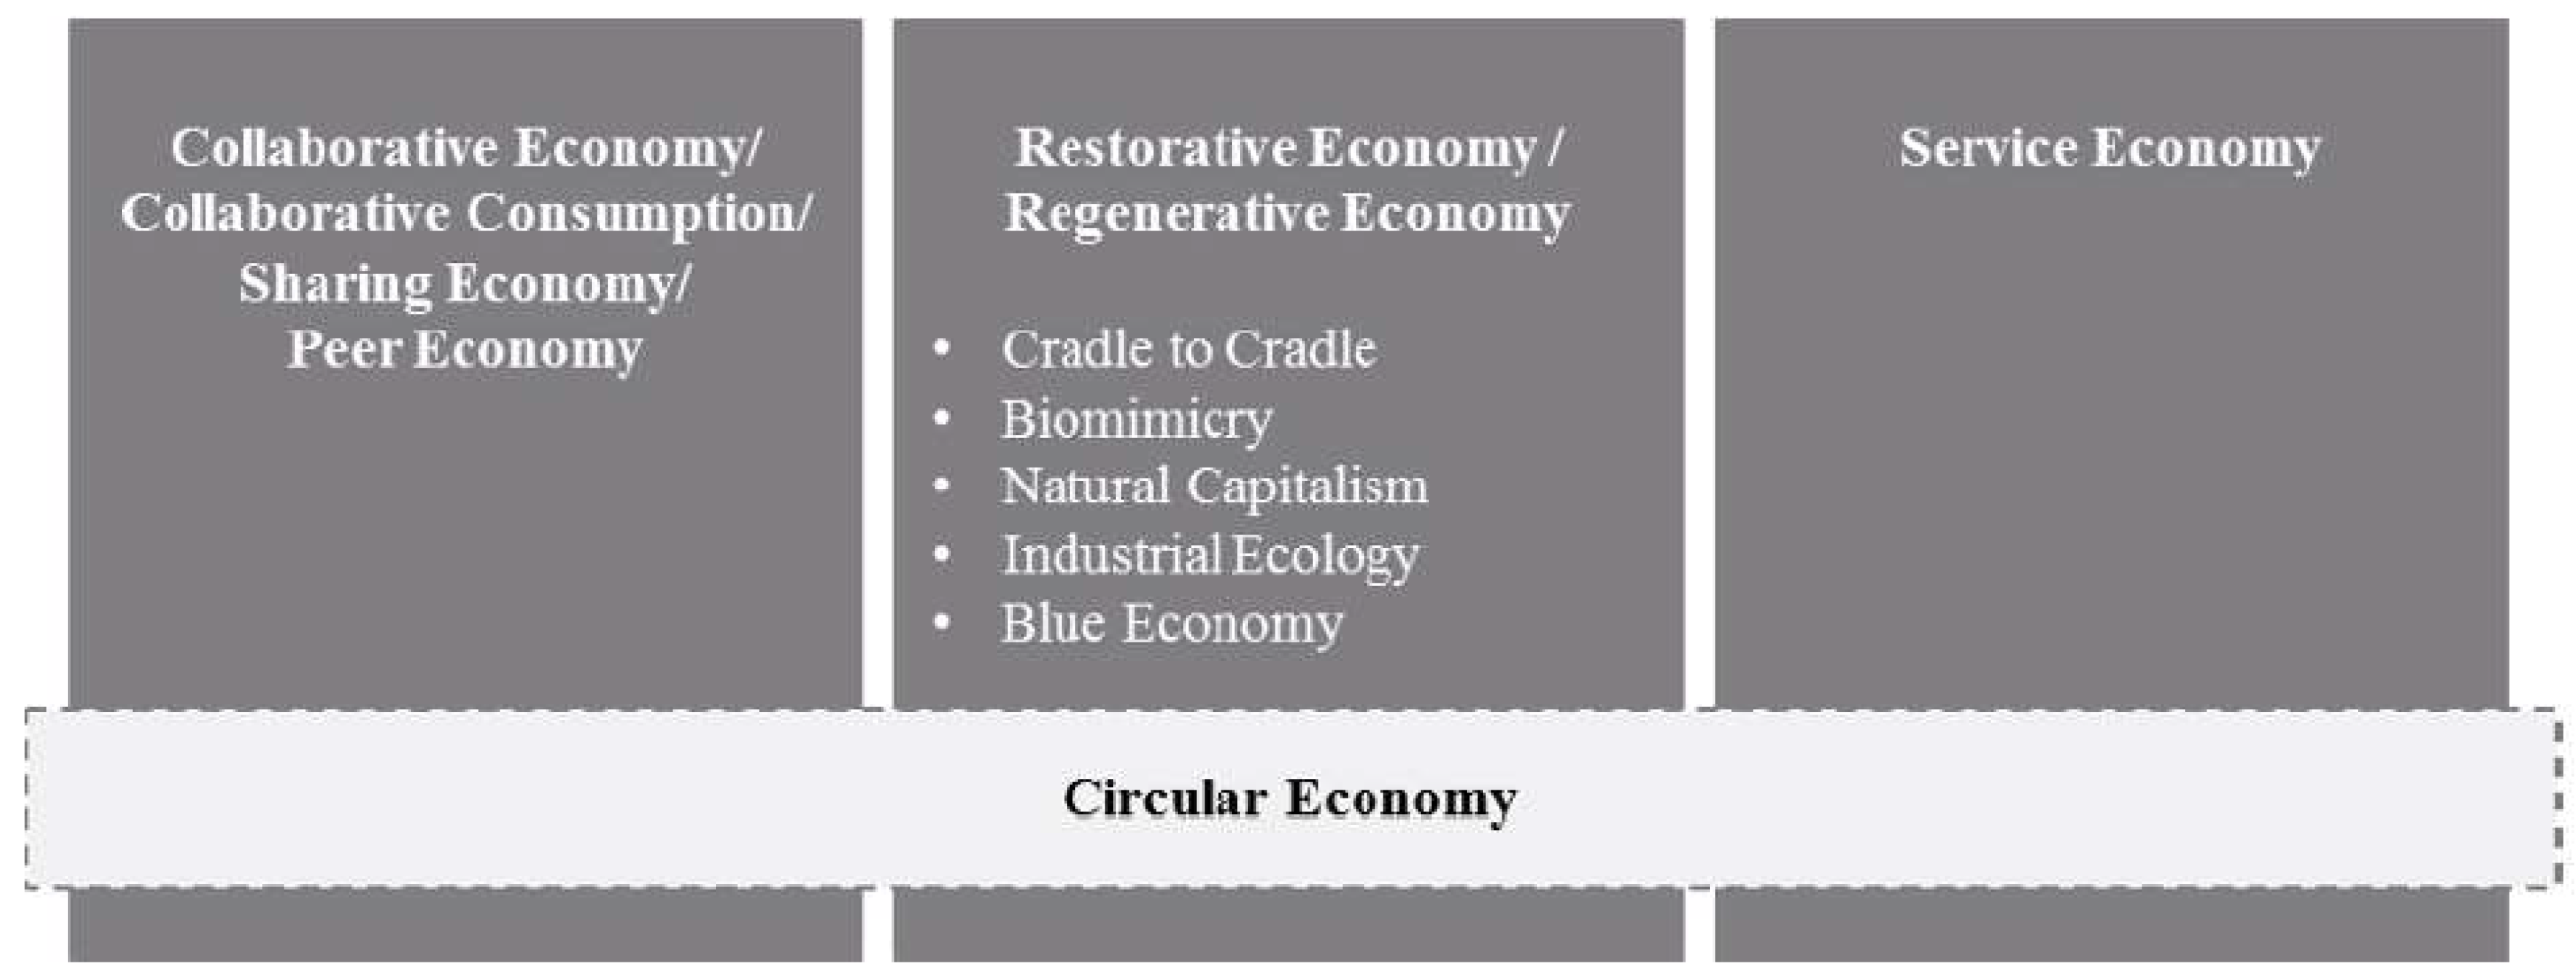
Figure 1. Circular economy and the entailment of sub-included economic approaches (after Laura Frodermann, 2018 [12]).
Sustainability 11 02234 g001
Figure 2. Graphic representation of the life cycle of asphalt pavements according to the European Asphalt Pavement Association and a potential Circular Model [49].
Sustainability 11 02234 g002
Figure 3. Distribution of the EU member-countries into four major regions.
Sustainability 11 02234 g003
Figure 4. Depiction of the defined Circular Economic Model compared with the traditionally linear economic model.
Sustainability 11 02234 g004
Figure 5. Definition of the inputs required for the calculation workflow of the proposed framework.
Sustainability 11 02234 g005
Figure 6. Cross section of the asphalt pavement structure under study.
Sustainability 11 02234 g006
Figure 7. Total Hot and Warm Mix asphalt mixture production per European section per year (2006–2017).
Sustainability 11 02234 g007
Figure 8. Total production of Hot and Warm Mix Asphalt in Megatonnes and its utilization per European area and layer (2006–2017).
Sustainability 11 02234 g008
Figure 9. Average Percentage Distribution of Hot and Warm Mix Asphalt uses per pavement layer in: (a) Northern EU (2006–2017); (b) Western EU (2006–2017); (c) Central and Eastern EU (2006–2017); (d) Southern EU (2006–2017).
Sustainability 11 02234 g009
Figure 10. Comparison between the total annual Hot and Warm Mix Asphalt production and the annually available RA in: (a) Northern EU (2006–2017); (b) Western EU (2006–2017); (c) Central and Eastern EU (2006–2017); (d) Southern EU (2006–2017).
Sustainability 11 02234 g010
Figure 11. Heatmap of the potential reduction on Hot and Warm Mix Asphalt Production per year and EU section, after the implementation of the proposed Circular Economic Model.
Sustainability 11 02234 g011
Figure 12. Product Material Circularity Index per pavement layer for the Italian motorways.
Sustainability 11 02234 g012
Figure 13. Fluctuation of the Material Circularity Index under different scenario analyses, per pavement layer.
Sustainability 11 02234 g013
Table 1. Members-countries included in each major EU region.
Northern EU MembersCentral and Eastern EU MembersWestern EU MembersSouthern EU Members
DenmarkBulgariaAustriaCyprus
EstoniaCroatiaBelgiumGreece
FinlandCzech RepublicFranceItaly
LatviaHungaryGermanyMalta
LithuaniaPolandIrelandPortugal
SwedenRomaniaLuxembourgSpain
SlovakiaNetherlands
SloveniaUnited Kingdom
Table 2. Data collected, and assumptions made for the completion of the study.
Average road dimensionsTotal Length of motorways (km)6.83 × 10³
Number of lanes per direction3
Average width of lanes (m)3.75
Average Layer ThicknessesWearing course (m)0.06
Binder course (m)0.07
Base course (m)0.3
Allowed % of RA incorporation within the pavement layersWearing course20%
Binder course25%
Base course30%
Quantities of Hot and Warm Mix Asphalt Production and Reclaimed AsphaltTotal Available RA (tonnes)1.02 × 10⁷
Total Placed RA (tonnes)1.70 × 10⁶
Total HWMA production (tonnes)2.83 × 10⁷
Total average mass of pavement layers as final productsWearing course (tonnes)2.17 × 10⁷
Binder course (tonnes)2.53 × 10⁷
Base course (tonnes)1.08 × 10⁸
Total average use of the total Hot and Warm Mix Asphalt Production per pavement layerWearing course (tonnes)7.37 × 10⁶
Binder course (tonnes)8.22 × 10⁶
Base course (tonnes)7.37 × 10⁶
Table 3. Inputs required for the quantification of the Material Circularity Index of wearing, binder, and base courses.
MCIMRA of Pavement Layers in Italian Motorways (INPUTS)Wearing CourseBinder CourseBase Course
DEFINITIONSYMBOLVALUEVALUEVALUE
Mass of Virgin Feedstock usedV (tonnes)2.07 × 1072.28 × 1079.15 × 107
Fraction of feedstock derived from recycled sourcesPRA0.0430.0970.156
Mass of the finished productGMRA (tonnes)2.17 × 1072.53 × 1071.08 × 108
Fraction of the mass of the product collected for recycling at the End-of-LifeFRA = ΔU0.21300.21300.2130
Amount of waste going to landfill or energy recoveryWEoL (tonnes)1.71 × 1071.99 × 1078.53 × 107
Quantity of waste generated in the recycling processWT (tonnes)9.23 × 1041.08 × 1054.62 × 105
Quantity of waste generated to produce any recycled content used as feedstockWP (tonnes)000
Efficiency of recycling process as treatmentET 98%
Efficiency of the recycling process as productionEP 100%
Overall amount of unrecoverable wasteW (tonnes)1.71 × 1072.00 × 1078.55 × 107
Linear flow index (LFI)LFI0.870.850.82
UtilityX1.001.001.00
Utility factor built as a function of the utility factor X of a productF[X]0.900.900.90
Table 4. Annual fluctuation of the parameters defined in Section 3.1: RA Placed rate (ΔU), RA Availability Quantity Factor (QF[a]) and RA Placed Quantity Factor (QF[p]) per European section.
Northern EUCentral and Eastern EU
YearHWMA (Mt)RA Available (Mt)RA Placed (Mt)ΔUQF[a]QF[p]HWMA (Mt)RA Available (Mt)RA Placed (Mt)ΔUQF[a]QF[p]
200618.3000.9000.5000.5814.69%2.60%38.0001.6000.2320.1434.04%0.59%
200720.7001.4000.8000.5906.33%3.62%39.5000.7000.3470.5031.74%0.86%
200822.1001.9000.9000.4677.92%3.75%37.1002.7000.4500.1686.78%1.13%
200919.3001.8000.9000.5088.53%4.27%37.9002.6000.3690.1406.42%0.91%
201019.3002.5001.0000.39411.47%4.59%37.2001.9000.2840.1464.86%0.73%
201120.6002.7001.3000.46311.59%5.58%44.3001.7000.2870.1693.70%0.62%
201218.8002.6001.2000.46412.15%5.61%37.9001.7000.4410.2654.29%1.11%
201318.9002.6001.4000.53912.09%6.51%36.0001.6000.3660.2274.26%0.97%
201420.1003.5002.7000.76114.83%11.44%38.1001.9000.3660.1974.75%0.91%
201521.1004.1003.2000.78316.27%12.70%41.4002.3000.5650.2475.26%1.29%
201621.6003.9003.2000.83115.29%12.55%38.7002.1000.5210.2485.15%1.28%
201722.5002.3651.9690.8339.51%7.92%39.5002.8540.5420.1916.74%1.28%
Western EUSouthern EU
YearHWMA (Mt)RA Available (Mt)RA Placed (Mt)ΔUQF[a]QF[p]HWMA (Mt)RA Available (Mt)RA Placed (Mt)ΔUQF[a]QF[p]
2006153.10031.04815.9530.51416.86%8.66%100.00014.6902.7270.18612.81%2.38%
2007147.10031.01516.4390.53017.41%9.23%102.00015.6503.6030.23013.30%3.06%
2008144.90029.93016.7170.55917.12%9.56%95.90014.1500.5520.03912.86%0.50%
2009143.00031.35318.8130.60017.98%10.79%91.60013.8503.3620.24313.13%3.19%
2010130.80031.38018.6070.59319.35%11.47%75.30012.6113.0940.24514.35%3.52%
2011137.55031.92019.9570.62518.84%11.78%66.00012.3523.1870.25815.76%4.07%
2012119.31029.11019.0670.65519.61%12.85%50.70010.3682.2430.21616.98%3.67%
2013120.10028.75019.2600.67019.31%12.94%44.60010.2052.1740.21318.62%3.97%
2014115.40024.98518.2870.73217.80%13.03%45.900Data
N/a
Data
N/a
Data
N/a
Data
N/a
Data
N/a
2015115.20029.10422.5670.77520.17%15.64%48.4009.4102.1850.23216.28%3.78%
2016119.90028.69122.1970.77419.31%14.94%44.7009.4902.1280.22417.51%3.93%
2017122.40028.95022.6500.78219.13%14.97%44.7009.4942.4800.26117.52%4.58%
Table 5. Percentages of a possible decrease in HWMA production in the EU, when full utilization of available RA is occurring.
Year200620072008200920102011201220132014201520162017
Northern EU5.1%7.1%9.5%10.3%14.5%15.1%15.9%15.6%21.1%24.0%22.0%11.7%
Central and Eastern EU4.5%1.8%7.8%7.5%5.5%4.0%4.6%4.7%5.2%5.9%5.7%7.8%
Western EU25.4%26.7%26.0%28.1%31.6%30.2%32.3%31.5%27.6%33.8%31.5%31.0%
Southern EU17.2%18.1%17.3%17.8%20.1%23.0%25.7%29.7%N/A24.1%27.0%27.0%
Table 6. Calculation of the Product Material Circularity Index per pavement layer, according to the developed methodology, after Ellen McArthur Foundation’s proposed methodology and tailored for asphalt mixtures containing RA.
MCIMRA of Pavement Layers in Italian Motorways (OUTPUT)Wearing CourseBinder CourseBase Course
Material circularity indicator per pavement layer MCIMRA0.2130.23770.2643