1. Introduction
As one of the most important quasi-public goods, farmland not only plays a fundamental role in food security and material production, but also has lots of similar functions in green infrastructure network construction such as bio-diversity conservation, open space provision, urban green belt construction and environmental amenity. Farmland protection has become a new tool to manage green infrastructure and social-economic development [
1,
2,
3]. Therefore, farmland protection policies to reduce farmland loss are enforced in many parts of the world. According to those policies, territories were normally divided into free development and limited development areas for the sustainable use of resources. For example, the Green Land and White Land in the USA; the Red Functions Area and Green Functions Areas in The Netherlands; and Land-Use Planning and Main Function Planning in China [
4,
5] are common forms of spatial zoning practice. Despite having received attention world widely for their effectiveness in reducing farmland loss [
6,
7], those unbalanced protection policies have led to “windfalls” or “wipe out” phenomena for the relevant stakeholders of farmland resources, facing serious challenges in terms of economic fair and ecological justice [
8,
9,
10]. Moreover, due to the public-good and cross boundary nature of farmland ecological services [
11], spatial externalities or spillovers exist, which—if not adequately compensated for—could lead to an under provision of the public goods and services concerned [
12]. Therefore, an essential step to internalize those externalities is to provide farmland ecological compensation for farmland conservation, and horizontal farmland fiscal payments are one of the most important ways of doing this [
3,
13].
China has been experiencing an ever-growing urbanization process since the opening up policies started in the late 1970s. Rapid urban expansion occupied an excessive amount of farmland, which was a huge threat to food security. The Chinese government has expressed concerns about the rapid loss of farmland, thus implementing the strict farmland protection policies to reduce this, such as the Land-Use Planning, Primary Farmland Protection Areas and Main Function Planning. According to those plans, farmland to urban land conversion was restricted in territories with large amounts of farmland. That made farmland protection a burden for territories which have large amounts of farmland, since its marginal economic output is still low in the present market [
3]. Territories with no or less farmland could hold fewer responsibilities of farmland protection. Moreover, in order to guarantee the grain outputs, excessive amounts of chemical fertilizer and poisonous pesticides were overused by the farmers in those territories. This could lead to decreased farmland ecological services and unhealthy agricultural foods, which could further damage human well-being seriously [
1,
6,
14,
15,
16]. Therefore, the mechanism to compensate local governments for their public provision of farmland ecological services is urgently needed [
17,
18].
To assist public authorities to strengthen their decisions on incentives for farmland protection, farmland ecological compensation has recently attracted great attention due to its balanced consideration of both economic development and farmland protection [
3]. Compared with the traditional farmland compensation methods, a farmland ecological fiscal payment mechanism could not only significantly slow down farmland loss, but also protect farmland culture [
2,
19,
20,
21]. As farmland is usually owned by individuals in western countries, farmland ecological compensation can be conducted by applying market-based incentive instruments (e.g., the Farmland Protection Program, Transfer for Land Development Rights and Land Retirement Plan in the USA; Environmentally Sensitive Areas in the European Union; and Payment for Ecological Services in Costa Rica, etc.). However, farmland in China is either owned by the government. Therefore, to solve the “windfalls” or “wipe outs” dilemma and externalities during farmland protecton, the farmland protection incentive programs are always implemented from top to bottom according to the organization of administrative structures, namely the vertical fiscal transfer payment, such as the Grain for Green Program (Sloping Land Conversation Program), Primary Farmland Zones. However, those policies were criticized for their low efficiency, rent seeking and limited funds from the central government [
2,
3,
20,
21,
22]. Because of these limitations and the background of ecological civilization construction, farmland ecological compensation mechanism becomes a hot topic in China.
Despite the valuation of farmland ecological compensation criteria and farmland ecological compensation patterns being well documented [
1,
3,
23,
24,
25,
26,
27], farmland ecological compensation across regions, that is horizontal farmland ecological fiscal payment, is not well known. It has only been implemented in Brazil, Germany and Portugal [
6,
12,
18,
28,
29,
30] and still need to be popularized in China, and farmland ecological compensation zoning is one of the most fundamental aspect. Consequently, the question about whether a territory consumed more farmland service than it can produce is the most important part of this research. In other words, we need to estimate the farmland ecological surplus/deficit status of each territory. In this study, we assume it would be possible to achieve balance between consumption and production of ecological services at a district scale, which is different from the traditional assumption that the balance could only be achieved at a national level.
Taking the 48 districts of Wuhan Agglomeration in China as the example, this paper aims to study farmland ecological compensation zoning and assess the amount of horizontal fiscal payment from the perspective of ecological footprint (EF). The specific objectives are: (1) quantify the farmland ecological footprint and farmland biological capacity values of the 48 districts; (2) propose a farmland ecological compensation zoning index, and then categorize the 48 administrative units into surplus areas and deficit ones; (3) establish the farmland horizontal fiscal payment model by taking the farmland ecological deficit/surplus area, ecological value per hm2 and economic level into account, and then measuring the amount of farmland horizontal fiscal payment among the 48 districts of Wuhan Agglomeration.
2. Literature Review
Literature related to farmland ecological compensation zoning method has mainly used the following methods: the food security method [
30,
31,
32,
33], and farmland comprehensive productivity methods [
34]. Those studies are helpful when estimating the farmland surplus/deficit status of a certain territory. However, studies applying the food security method mainly focused on the economic value, and failed to take its various ecological services into consideration. The latter method relies heavily on weights, which are usually determined by quality data rather than quantity data. Current research on horizontal ecological fiscal payment mainly focused on the fields of water and forests [
12,
17,
18,
28,
29,
35,
36]. The vertical fiscal transfer payment is mainly estimated by applying contingent value method, choice modelling and opportunity cost method [
20,
21]. The methdology of a horizontal fiscal payment mainly includes the following 3 indicators: (i) the deficit/surplus area of farmland; (ii) the value of conservation 1 hm
2 farmland; and (iii) an indicator that reflected economic development level of local government [
18]. Ring [
12] indicated that area is a direct indicator for horizontal ecological fiscal payment; other indicators such as distance to urban center and economic level are also essential indicators. There is still a lack of research on farmland. A framework that integrates ecological indicators into economic assessments model of farmland is urgently needed among government agencies, NGOs and the society. Therefore, this paper proposes the following framework (
Figure 1) to build the foundation of the farmland ecological compensation zoning horizontal fiscal payment mechanism.
The ecological footprint/biological capacity model was developed by economist Rees and Wackemagel [
37]. Specifically, the ecological footprint model is a methodology to assess “The total area of productive land and water required continuously to produce all the resources consumed and to assimilate all the wastes produced, by a given population” [
38]. It provides a new perspective in regional sustainable development assessment and has been widely recognized and applied by scholars. Specifically, in the EF model, human resources and energy consumption items are expressed by 5 kinds of bio-production areas: farmland, pasture, forest, build-up land, and fossil fuel land [
37]. Biological capacity (BC) is the ecological system’s supply ability, including its self-lock, self-controlling functions and its ability to contain resources or environmental products [
39,
40]. It emphasizes the affordability of the ecological system and the tolerance capacity to human activities. Therefore, it has been widely used in the ecological security evaluations of farmland, water and forest [
31,
32,
33], but a limited attempt has been made to examine the ecological footprint of farmland, which is one of the most important land-use types for humans’ welfare.
Due to farmland’s fundamental role in human welfare (e.g., food security and amenity values), we just focus on farmland rather than all kinds of land in each district in this paper. Therefore, the modified EF/BC model was introduced into the farmland ecological compensation zoning by focusing on farmland. This model can determine the consumption and production of farmland ecological services at a district scale, which is named “territory farmland ecological status”. By covering both supply and demand sides of farmland ecological status, it can bridge the gap that ecological services and ecological value were always being neglected in the traditional farmland zoning studies.
In this study, the territory farmland ecological surplus/deficit status of each district was calculated first by applying the farmland ecological footprint/farmland biological capacity (FEF/FBC) model. Based on the values of those two indicators, we then developed farmland ecological compensation zoning index (FECZI) to identify whether a territory should be classified into ecological payment area or compensation one. Territories which consuming more farmland services than what can be generated should transfer farmland economic payment. The above two kinds of territories were named as the payment area and compensation area, respectively.
To employ this framework, we took the biggest metropolitan in central China—Wuhan Agglomeration as a case study. It will not only enrich the literature on farmland ecological zoning but also help the local governments to design a more reasonable horizontal farmland ecological compensation to solve the “windfalls” or “wipe outs” problems in the 48 territories, and achieve the sustainable goal between economic development and farmland protection.
3. Methodology
3.1. Farmland Ecological Footprint (FEF) Model
A modified ecological footprint model is introduced into this paper by just focuses on farmland, called the farmland ecological footprint (FEF) model. As an ecological land-use type with the highest productivity, farmland offers the most biomass to humans. Farmland ecological footprint can be calculated by adding up all the farmland ecosystem area appropriated by an individual to fill his/her annual shopping basket of consumption goods and services associated with farmland. Then for a certain region, FEF equals the per capita average farmland ecological footprint (
) times population size (N): Thus, the equation can be written as:
where
FEFi is the total farmland ecological footprint of region
i;
Ni is the population in region
i, which can be obtained from the
Hubei Statistical Yearbook 2016, and their values for every district are listed in
Appendix A.
is per capita farmland ecological footprint, which is an indicator to quantity per capita demand on farmland. As human resources and energy consumption items are expressed by farmland and other 4 kinds of bio-production areas [
37], per capita farmland ecological footprint is the average area of farmland required to sustain human natural resource consumption and assimilate human-generated waste associated with farmland, by one person.
r is the equivalence factor of farmland, and equals 2.52 [
41];
ci is annual consumption per capita of the
th kind of commodity,
pi is the world-average productivity amount of the
ith kind of commodity. The values and units of
and
pi for all districts are the same and listed in
Table 1 according to
Hubei Rural Statistical Yearbook 2016 and
Hubei Statistical Yearbook 2016.
3.2. Farmland Biological Capacity (FBC) Model
Farmland biological capacity (FBC) model can be calculated through multiplying all kinds of bio-productive land areas in the zone by equivalence factor and yield adjustment index [
38]. Farmland ecological carrying capacity can be calculated by multiplying territory farmland area by each conversion system for farmland ecological system. The equation is (2):
where
FBCi is the total biological capacity of the region
. According to the World Commission on Environment and Development (WCED), minus 12% should be deducted when calculating biological capacity [
40,
42]. Moreover, this paper just focuses on farmland ecological system, so this percentage should be changed to 3.5% [
43].
is the equivalence factor of farmland, it equals 2.52 [
41];
ai is bio-productive farmland area, namely the farmland area of a district and data were obtained from the
Department of Natural and Resources of Hubei Province, which were also listed in
Appendix A.
y is yield factor (ratio of territory average yield to world average yield). In this paper, yield factor of Wuhan Agglomeration to that of World is 1.00 [
44].
3.3. Farmland Ecological Compensation Zoning
The ecological footprint estimates human’s consumption of farmland ecological service from the demand perspective, whereas ecological capacity calculates farmland ecosystem capacity from the supply perspective. Therefore, after calculating the ratio of human’s demand of farmland ecological services to ecological services the nature can provide in a certain region, we can determine that the region should be divided into the payment area or compensation area. More specifically, comparisons can be made among territories in the same kind of state (deficit or surplus), because the ratio can give the specific quantity level of payment or compensation. This study sets this ratio of ecological footprint to local ecological capacity in a certain district as its farmland ecological compensation zoning index (FECZI), the specific equation as follows:
where
FECZIi is the farmland ecological compensation priority level of the region
;
is the farmland ecological footprint of the district
,
FBCi is the farmland ecological capacity of the district
. Theoretically we can divide the 48 districts in Wuhan Agglomeration into three types according to the value of
FECZIi, i.e., farmland ecological receiving district; farmland ecological balanced district and farmland ecological payment district. In particular, when
FEFi >
FBCi, it indicates the region is in the state of ecological deficit. This region consumes more farmland services than it can produce from its farmland resource base and it gains economic “windfalls” from farmland protection policy. Therefore, it should transfer farmland ecological payment to other areas. By contrast, when
FEFi < FBCi, it indicates the region is in the state of ecological surplus. It produces more farmland ecological services than its consumption, and provides farmland services to other territories, and it suffers economic loss from the farmland protection policy. Therefore, it should receive the horizontal farmland ecological payment. When
FEFi =
FBCi, it indicates the district just consume the exactly amount of farmland services as it can generate, brings the demand and supply of farmland ecological service into balance. However, it is technically impossible for one region to reach exactly equal farmland ecological footprint with its own farmland biological capacity. All of the 48 districts in Wuhan Agglomeration can be classified into two sub-types accordingly, based on the value of their FECZI. The specific classification standard is shown in
Table 2.
3.4. Horizontal Farmland Ecological Fiscal Payment Model
Approaches to determine the amount of horizontal farmland ecological payment mainly include the following 3 indicators: (i) the deficit/surplus area of farmland; (ii) the value of conservation 1 hm
2 farmland; (iii) an indicator that reflected economic development level of local government [
13,
45]. Therefore, the method to calculate the amount of horizontal farmland ecological fiscal payment is based on the farmland ecological value per hm
2 multiplied by the ecological area of farmland
. Moreover, the indicator of economic development level
is also taken into consideration in this paper. Therefore,for each districti, the horizontal farmland ecological fiscal payment
can be written as
where
is the amount of horizontal farmland ecological fiscal payment,
is the ecological value of 1 hm
2 farmland, which comes from the author’s previous study [
3];
is farmland ecological deficit/surplus area, which equals to the FEF minus FBC. The adjustment indicator
is defined as the ratio of
to
in this study.
3.5. Study Area and Data
Wuhan Agglomeration is the largest metropolitan in central China and located in the middle reaches of the Yangtze River. It is composed of Wuhan and other 8 cities and 48 districts within 100km, namely Huangshi, Ezhou, Huanggang, Xiaogan, Xianning, Xiantao, Tianmen and Qianjiang (
Figure 2). There are 9 national-level poverty districts and 3 provincial-level poverty districts in the Wuhan Agglomeration. The Gini index of Hubei province in 2014 is 0.385, which is lower than that of China (0.469) (
http://www.stats.gov.cn/). The total area was 5.78 × 10
6 hectares, with 2.06 × 10
6 hectares of farmland in 2015. The population was 31.26 × 10
6, of which, the agricultural population accounts for 41.77%. Its GDP achieved 187.88 × 10
10 Yuan in 2015, with only 13% coming from agriculture. Due to the rapid development of the economy and urbanization, Wuhan Agglomeration experienced serious farmland loss during the past two decades. The average annual decreasing rate was 1.35% from 2010 to 2015. Moreover, serious chemical fertilizer, pesticide pollution and non-point source pollution have happened during the traditional high input-output agricultural production. Wuhan Agglomeration faces serious bottleneck of economic and social development in the long term, especially in the field of farmland scarcity and its protection.
Besides being the largest metropolitan and socio-economic agglomeration in Central China, Wuhan Agglomeration is also one of the important bases for food production in China. Moreover, it is one of the two nationwide pilot experimental areas of Resource-saving and Environment-friendly Society and a fundamental part for the construction of ecological civilization in the Yangtze Economic Belt. All of the above makes Wuhan Agglomeration a good case for the study of farmland ecological compensation zoning and horizontal fiscal payment mechanism. All the indicators in Equations (1)–(4) are listed in
Table 1 and
Table 3.
4. Results (Listed in Appendix A)
4.1. Farmland Ecological Footprint in Wuhan Agglomeration
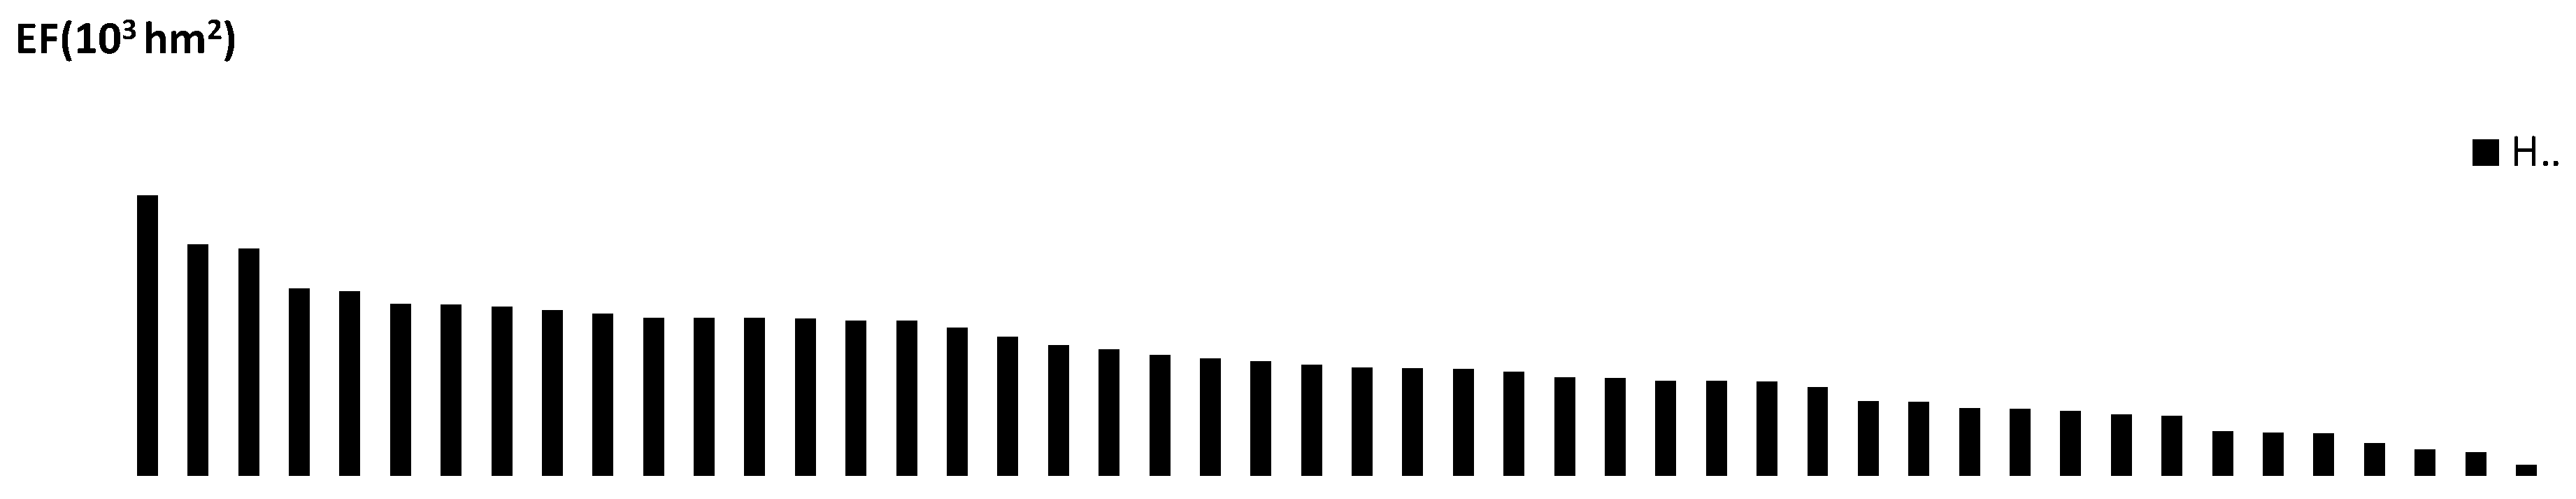
We can obtain the farmland’s ecological footprint (EF) of 48 districts in Wuhan Agglomeration according to Equation (1), and the specific results are shown in
Figure 3.
The total farmland ecological footprint (FEF) was 2400.92 × 10
3 hm
2 in 2015, while Hongshan has the highest FEF value (120.59 × 10
3 hm
2) and Tieshan has the lowest FEF value (4.49 × 10
3 hm
2). According to
Figure 3, it can be concluded that there are obvious spatial differences in FEF sizes among the 48 districts. The FEF ratios of Hongshan, Tianmen, Wuchang, Xiantao, Hanchuan, Qianjiang, Jiangan, Huangpi and Xiaonan are all above 3%, moreover, those 9 districts accounts for 29.06% of total FEF in the Wuhan Agglomeration. The share of FEF value is between 2% to 3% in Wuhan Agglomeration for Xiaonan, Daye, Xinzhou, Xishui, Macheng, Jiangxia, Qiaokou, Huangmei, Yangxin, Qichun, Jianghan, Caidian, Echeng, Wuxue, Hanyang. They account for 38.77% of the whole Agglomeration. The FEF value of 17 areas are at the average level (accounting for 1–2% of total FEF in Wuhan Agglomeration), namely Dawu, Hongan, Yingcheng, Xiaochang, Anlu, Luotian, Xianan, Yunmeng, Dongxihu, Qingshan, Chibi, Tongcheng, Chongyang, Huangzhou, Tongshan, Yingshanand Tuanfeng. These areas account for 28.19% of total FEF value in Wuhan Agglomeration. In addition, the FEF ratio of 7 districts (Xisaishan, Huarong, Huangshigang, Xialu, Liangzihu, Hannan, Tieshan) is lower than1% of total FEF value in the Wuhan Agglomeration.
Therefore, we can see that significant spatial differences are observed in Wuhan Agglomeration at district level. This will also make farmland protection different among districts.
4.2. Farmland Biological Capacity in Wuhan Agglomeration
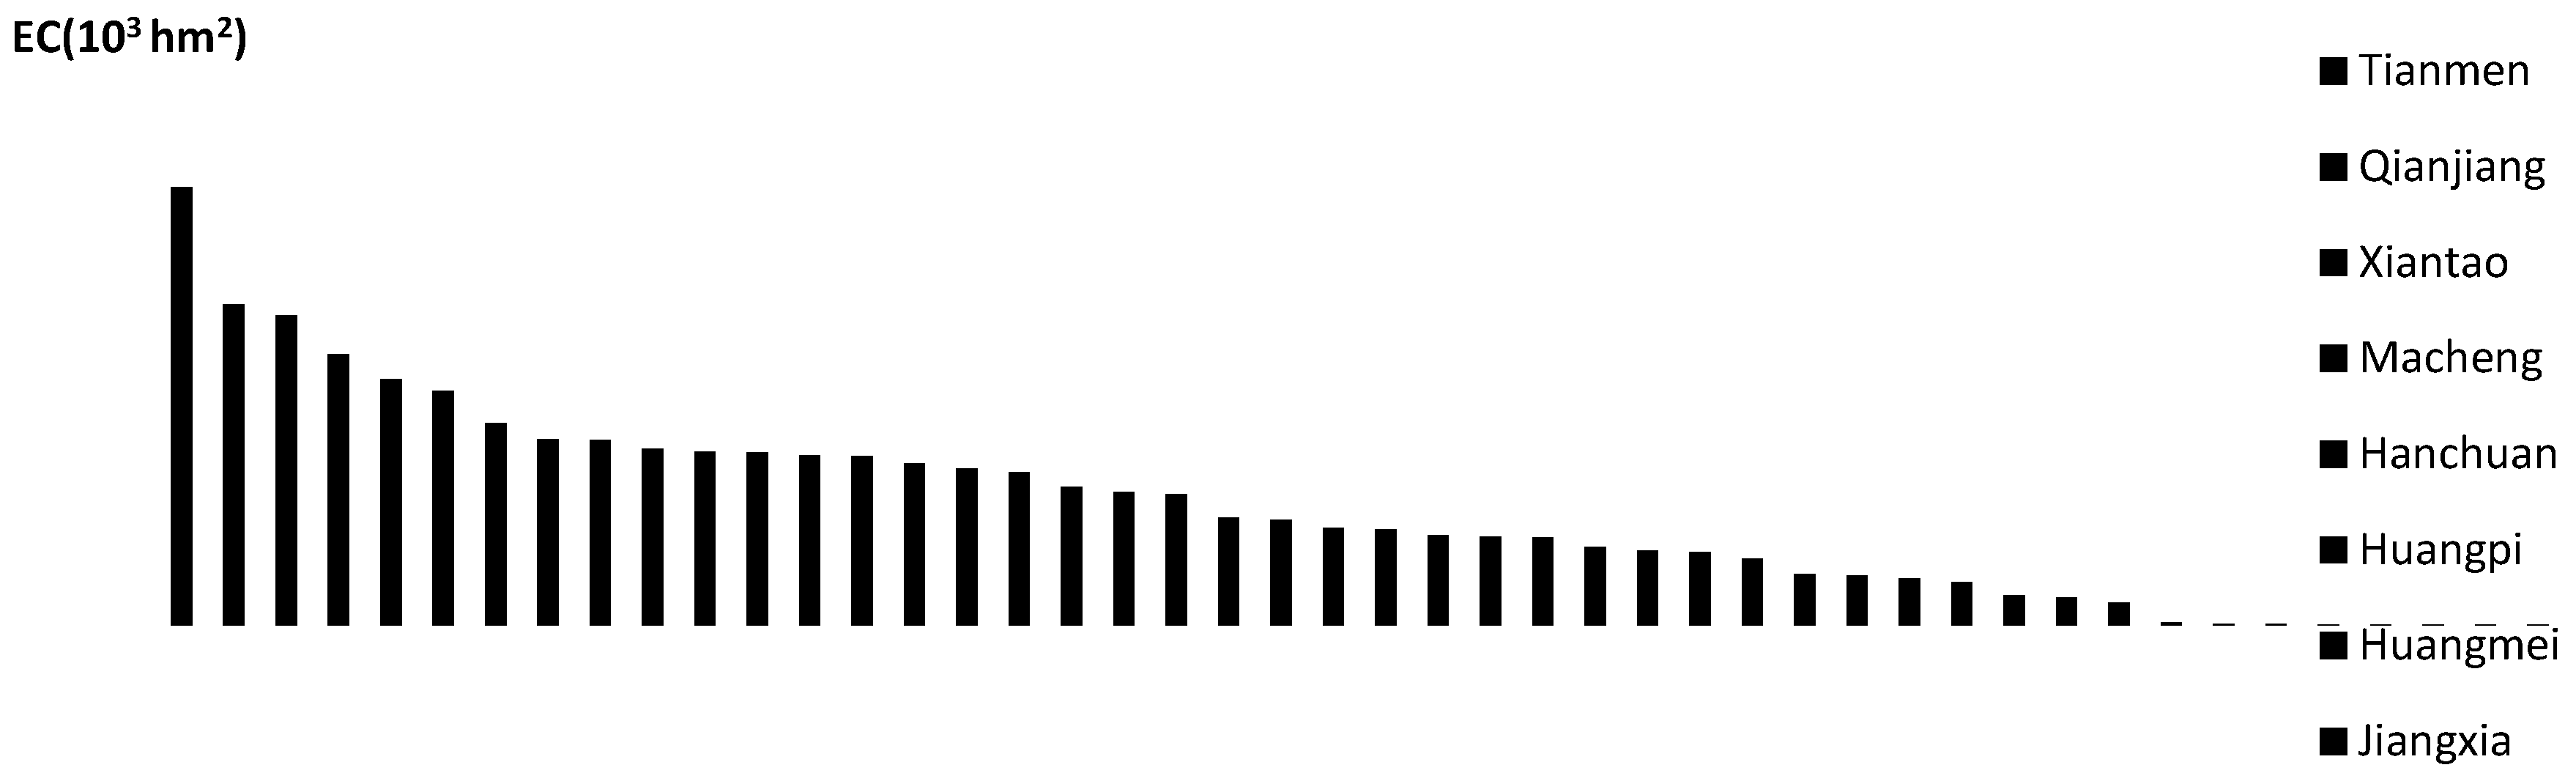
The farmland’s biological capacity (EBC) of the 48 districts in Wuhan Agglomeration can be calculated by formula (2) and the specific results are shown in
Figure 4.
The total farmland biological capacity (FBC) was 5014.56 × 10
3 hm
2 in 2015. Tianmen has the highest FBC value (408.93 × 10
3 hm
2). The FBC value of Jianghan and Tieshan were 0 due to having no farmland. As shown in
Figure 4, spatial difference also exists in the FBC value of Wuhan Agglomeration. There are 16 districts that account for more than 3% of total FBC value in Wuhan Agglomeration, Tianmen (8.15%), Qianjiang (5.97%), Xiantao (5.77%), Macheng (5.04%), Hanchuan (4.58%), Huangpi (4.35%), Huangmei (3.76%), Jiangxia (3.46%), Xishui (3.45%), Qichun (3.28%), Dawu (3.23%), Yangxin (3.21%), Yingcheng (3.16%), Anlu (3.15%), Xinzhou (3.01%). Compared with the total FBC value of Wuhan Agglomeration, the FBC proportion of the above 16 districts achieved 63.58%. The FBC value of 6 cities, including Hongan (2.92%), Xiaochang (2.85%), Xiaonan (2.58%), Wuxue (2.48%), Daye (2.44%), and Chibi (2.01%), accounted for 15.28% to the total value. Districts with FBC ratio between 1% and 2% are Caidian (1.96%), Yunmeng (1.82%), Luotian (1.78%), Chongyang (1.67%), Jiayu (1.65%), Xianan (1.63%), Tongcheng (1.46%), Tuanfeng (1.39%), Tongshan (1.37%), and Yingshan (1.23%). Moreover, in all 48 districts, FBC values of 17 districts are below 1%. Those 17 districts only accounted for 5.18% of the total FBC value in Wuhan Agglomeration.
4.3. Distribution of Farmland Ecological Compensation Types in Wuhan Agglomeration
We can obtain the farmland ecological payment areas and compensation areas of the 48 districts in Wuhan Agglomeration in 2015 according to Equation (3) and the classification standard in
Table 1 and the indicators in
Table 2. The specific results are shown in
Table 4 and
Figure 5.
Table 4 shows the distribution of GDP, farmland, and population of the payment area and compensation areas among the 48 districts. The results in
Table 4 indicate that there are 14 districts in Wuhan Agglomeration that need to transfer farmland ecological payment to other districts, namely Jiangan, Jianghan, Qiaokou, Hanyang, Wuchang, Qingshan, Hongshan, Dongxihu, Jiangxia, Huangshigang, Xisaishan, Xialu, Tieshan, and Echeng. Therefore, they belong to farmland ecological payment areas. They have only 5.68% of the farmland but account for 29.89% of the whole population, and 48.51% of total value of Wuhan Agglomeration. Compared with the remaining 34 districts, their economic levels are much higher. This indicates that for every unit conversion from farmland to urban land, they will produce much higher economic outputs, so they should transfer farmland ecological payment to the remaining 34 districts.
The remaining 34 districts of Wuhan Agglomeration are in the state of farmland ecological surplus. They account for 94.32% of the total farmland and 70.11% of the population in Wuhan Agglomeration, but only take a percentage of 51.49% to the whole Agglomeration. These districts make contributions to the maintenance and balance of ecological environment in Wuhan Agglomeration, so they should receive farmland ecological compensation and be classified into farmland ecological compensation areas. This also indicates that for every unit conversion from farmland to urban land, their economic output is lower than that of the 14 payment areas. It will be more efficient for those districts to protect the farmland for the whole area while accepting farmland ecological compensation from the other districts.
4.4. Horizontal Farmland Ecological Fiscal Payment in the 48 Districts of Wuhan Agglomeration
Horizontal farmland ecological fiscal payments in the 48 districts of Wuhan Agglomeration are calculated by combining Equation (4) and data from
Section 3.5. The results are shown in
Appendix A. According to
Appendix A, district transfers the largest farmland ecological payment area is Hongshan (109,901.05 × 10
4 Yuan), while the least is Tieshan (83.69 × 10
4 Yuan). Payment districts are either the districts with relatively small amounts of farmland, such as Wuchang (53,182.32 × 10
4 Yuan), and Jiangan (39,142.75 × 10
4 Yuan) or the districts in which the population is relatively large. e.g., Huangzhou (337.15 × 10
4 Yuan) and Hannan (216.30 × 10
4 Yuan).
Appendix A also indicated that the largest farmland ecological compensation area is Tianmen (−84076.11 × 10
4 Yuan), while the least is Hannan (−1340.58 × 10
4 Yuan). Districts with less farmland area receive fewer transfers, while the others gain according to their farmland area and economic development.
5. Discussion and Policy Implications
5.1. Discussion
From the perspective of Ecological Footprint, this study calculates the farmland’s ecological footprint (FEF) and farmland’s biological capacity (FBC) values of the 48 district administrative units in Wuhan Agglomeration by applying the FEF/FBC model. Moreover, according to the FECZI values, we divided the 48 districts into farmland ecological payment area and compensation area, and then establish a horizontal farmland ecological fiscal payment model (HFP) so as to balance regional development. Nevertheless, there exist the following limitations in this study:
First, neglect of ecological services generating from wetland, forest and pasture may understate the biological capacity both in urbanized areas and agricultural areas. The main focus in this study is on ecological surplus or deficit of farmland protection and development. Actually wetland, forest and pasture are distributed and can provide ecological services for human beings in Wuhan Agglomeration. Without consideration of these ecological services, the biological capacity is underestimated.
Second, using permanent resident population excluding flow population to calculate ecological footprint may understate the ecological footprint in urbanized areas and overstate the footprint in rural areas. Population used in this paper is the permanent resident population, not the real population including inflow and outflow, which may lead to bias of farmland ecological footprint. More specifically, it may overestimate the farmland ecological footprint in rural areas, and underestimate it in urban areas.
Third, the static not dynamic nature of farmland is considered. Farmland is a kind of natural capital which accumulates and varies with time. The output of farmland depends on climate, crop rotation, cropping system and field management and so on. We try to compare the ecological state in 2015 with 2008 and reflect the dynamic process of the biological capacity and ecological footprint. However, the methods we employed in 2015 and 2008 are different and the results may be incomparable.
Last but not least, both biological capacity and ecological footprint rely on ecological construction launched by the government. Since the pilot Resource Saving and Environmental Friendly society was approved by central government, land sparing and sharing, and low carbon economy movement have been conducted at district and Agglomeration scales. These ecological movements surely improve the biological capacity and mitigate ecological footprint. Because of the relevant data not being available, the study neglects the ecological improvement which may understate the ecological surplus.
Therefore, we suggest future studies to link other non-agricultural lands (wetland, forest and pasture), consider the mobility of population, dynamic of farmland output and poverty index, distinguish the relationship between natural capital flows and capital stocks [
46], fully consider the improvement of ecological construction, so as to precisely design horizontal fiscal transfer payment mechanisms, and coordinate farmland preservation and development.
5.2. Policy Implication
Firstly, in order to safeguard food security and ecological security, China’s Central government has initiated a series of farmland preservation policies since the mid-1990, such as prime farmland preservation in 1994, balance of farmland occupied and rehabitated in 1998, farmland conversion application and approval in 1998, Grain for Green in 1998, agricultural tax free in 2004, subsidization of farmland cultivation in 2005 and Main functional Zone Planning in 2010. All the above farmland preservation up-down institutional arrangements have effects in the short run, but farmland loss is serious nationwide. The main reasons associated with farmland loss lie in comparative disadvantage between farmland preservation and development. Once a region or district is classified into farmland preservation area, the local government will suffer wipeout. Conversely, local government in the developable area will gain windfall from the higher economic returns of land development, so establishment of ‘windfall for wipeout’ mechanism targeting ‘windfall-wipeout dilemmas’ is of importance worldwide. On the basis of farmland ecological surplus or deficit state, building a horizontal fiscal payment and compensation mechanism can equally match the local governments’ responsibility and fiscal revenue associated with farmland preservation and development and solve the ‘windfall-wipeout dilemmas’. In fact, a horizontal farmland ecological payment has been implemented in some countries, such as Brazil and Germany [
17,
29,
47]. The bottom-up institutional innovation of farmland preservation in Chinese developed areas, such as Songjiang, Shanghai and Lishui, Quzhou, Hangzhou, Ningbo, Zhejiang is a workable mechanism which is close to ecological horizontal fiscal payment and compensation in principle [
48]. The policy maker should take the up-down institutional arrangement and bottom-up innovation into consideration.
Secondly, the farmland ecological condition has been improved since the construction of pilot for Resource Saving and Environmental Friendly society in 2007. According to Yang et al., the 24 districts of Wuhan Agglomeration belonged to the farmland ecological payment area and the remaining 24 districts should accept farmland ecological compensation in 2008 [
45]. Cao et al. divided Hubei into 102 districts into 55 farmland deficit areas, 12 balanced areas, and 33 farmland surplus areas by applying a farmland comprehensive level in 2008 [
49]. Yang et al. applied a food security model in 2008 to find that the 17 districts of Wuhan Agglomeration should pay for other districts [
50]. Change in net ecological surplus of 2613.64 × 10
3 hm
2 and decrease in deficit areas may be attributed to Resource Saving and Environmental Friendly society. So besides the above mentioned 14 ecological deficit areas payment for 34 ecological surplus areas through horizontal fiscal payment mechanism inside of Wuhan Agglomeration, the net surplus may be offset by a horizontal fiscal payment mechanism among provinces and vertical fiscal transfer from central government to provincial governments.
6. Conclusions
On the Basis of the ecological surplus and deficit state in each administrative area, it is a widely accepted principle to build ecological fiscal transfer payment institution [
17,
29,
47]. We establish a theoretical framework for farmland ecological fiscal payment and compensation according to biological capacity and ecological footprint associated with farmland preservation and development. Under the theoretical framework, we take the biggest metropolitan area, Wuhan Agglomeration in Central China, as a case study and we find 14 payment areas can compensate for 34 compensation areas partially through horizontal fiscal payment mechanism proposed in this paper. The net ecological surplus may be offset by the combination of provincial horizontal fiscal transfer and vertical fiscal transfer from central government to provincial governments. The findings may be contributed to the reform of farmland ecological compensation as well as innovation of fiscal payment mechanism in Wuhan Agglomeration, and similar regions in the developing world. Finally, results show that,
(1) The farmland ecological footprint (FEF) decreases spatially from the center to the boundary of Wuhan Agglomeration. Significant spatially differences are observed among the 48 districts, the FEFs in the central urbanized areas are obviously higher than the agricultural dominant areas of the boundary. Hongshan has the highest FEF value (120.59 × 10³ hm2) while Tieshan has the lowest FEF value (4.49 × 10³ hm2). Moreover, the FEF ratio which accounts for >3%, 2–3%, 1–2%, <1% are 9, 15, 17 and 7 districts, respectively.
(2) The farmland biological capacity (FBC) increases spatially from the center to the boundary of Wuhan Agglomeration. Spatial heterogeneity was also observed in the distribution of FBC. The abundant farmland distributed areas outside of the center provide higher ecological services than the central farmland scarce areas. Tianmen has the highest FBC value (408.93 × 10³ hm2), however, the FBC values of Jianghan and Tieshan were 0 due to having no farmland. The FBC ratio which accounts for >3%, 2–3%, 1–2%, <1% are 16, 6, 9 and 17 districts respectively.
(3) Wuhan Agglomeration is an ecological surplus area and differs heterogeneously in space. The total FEF in Wuhan Agglomeration has been calculated as 2400.92 × 103 hm2 in 2015. The total FBC achieves 5014.56 × 103 hm2 in 2015. So the FBC can offset the FEF. According to their farmland ecological surplus or deficit state, the 48 districts in Wuhan Agglomeration are divided into two types, the FEF value of 14 districts are larger than their FBC value, which indicate they are consuming farmland ecological services from other districts freely and so they are divided into farmland ecological payment areas. For the other 34 districts, they are divided into farmland ecological compensation areas.
(4) The horizontal farmland ecological fiscal payment mechanism is of practical feasibility in Wuhan Agglomeration. The largest farmland ecological payment area is Hongshan (109,901.05 × 104 Yuan), while the lowest is Tieshan (83.69 × 10⁴ Yuan). The largest farmland ecological compensation area is Tianmen (−84,076.11 × 104 Yuan), while the lowest is Hannan (−1340.58 × 104 Yuan). According to the Hubei Statistical Year Books currently, the proportion of transfer payment to local GDP each district ranges from 0.11% to 1.91%, which is low and in the realm of affordability of the local government.


