Grain Self-Sufficiency Capacity in China’s Metropolitan Areas under Rapid Urbanization: Trends and Regional Differences from 1990 to 2015


Abstract
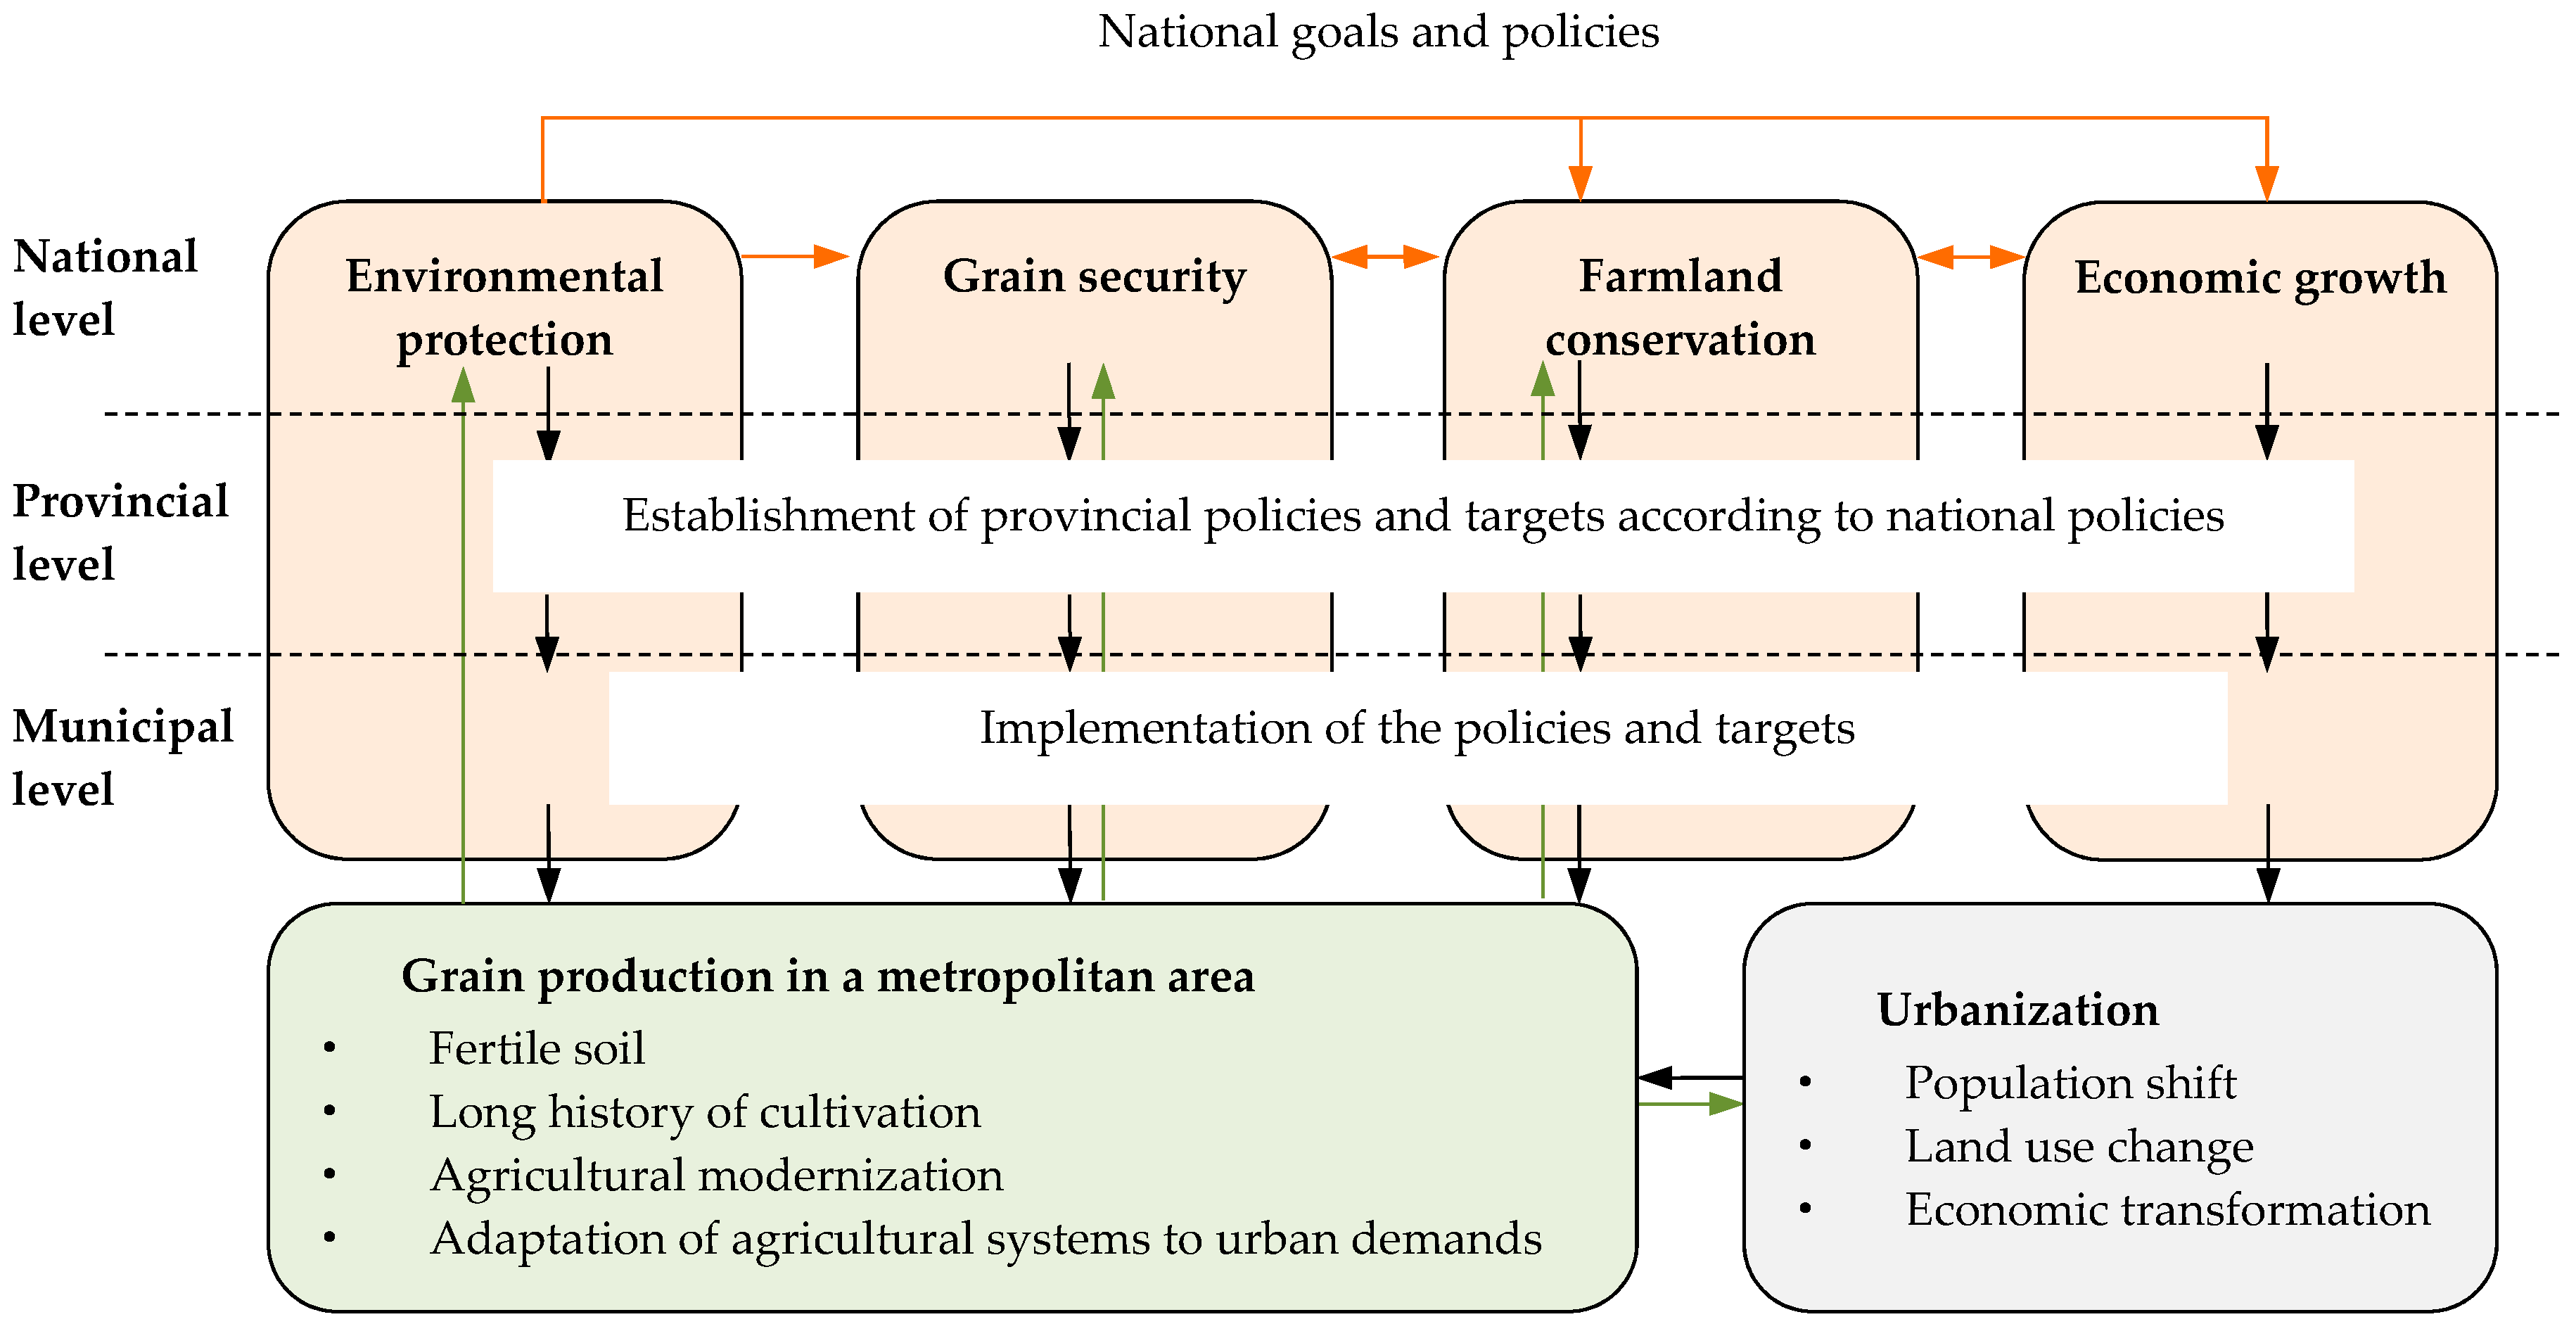
:1. Introduction
2. Materials and Methods
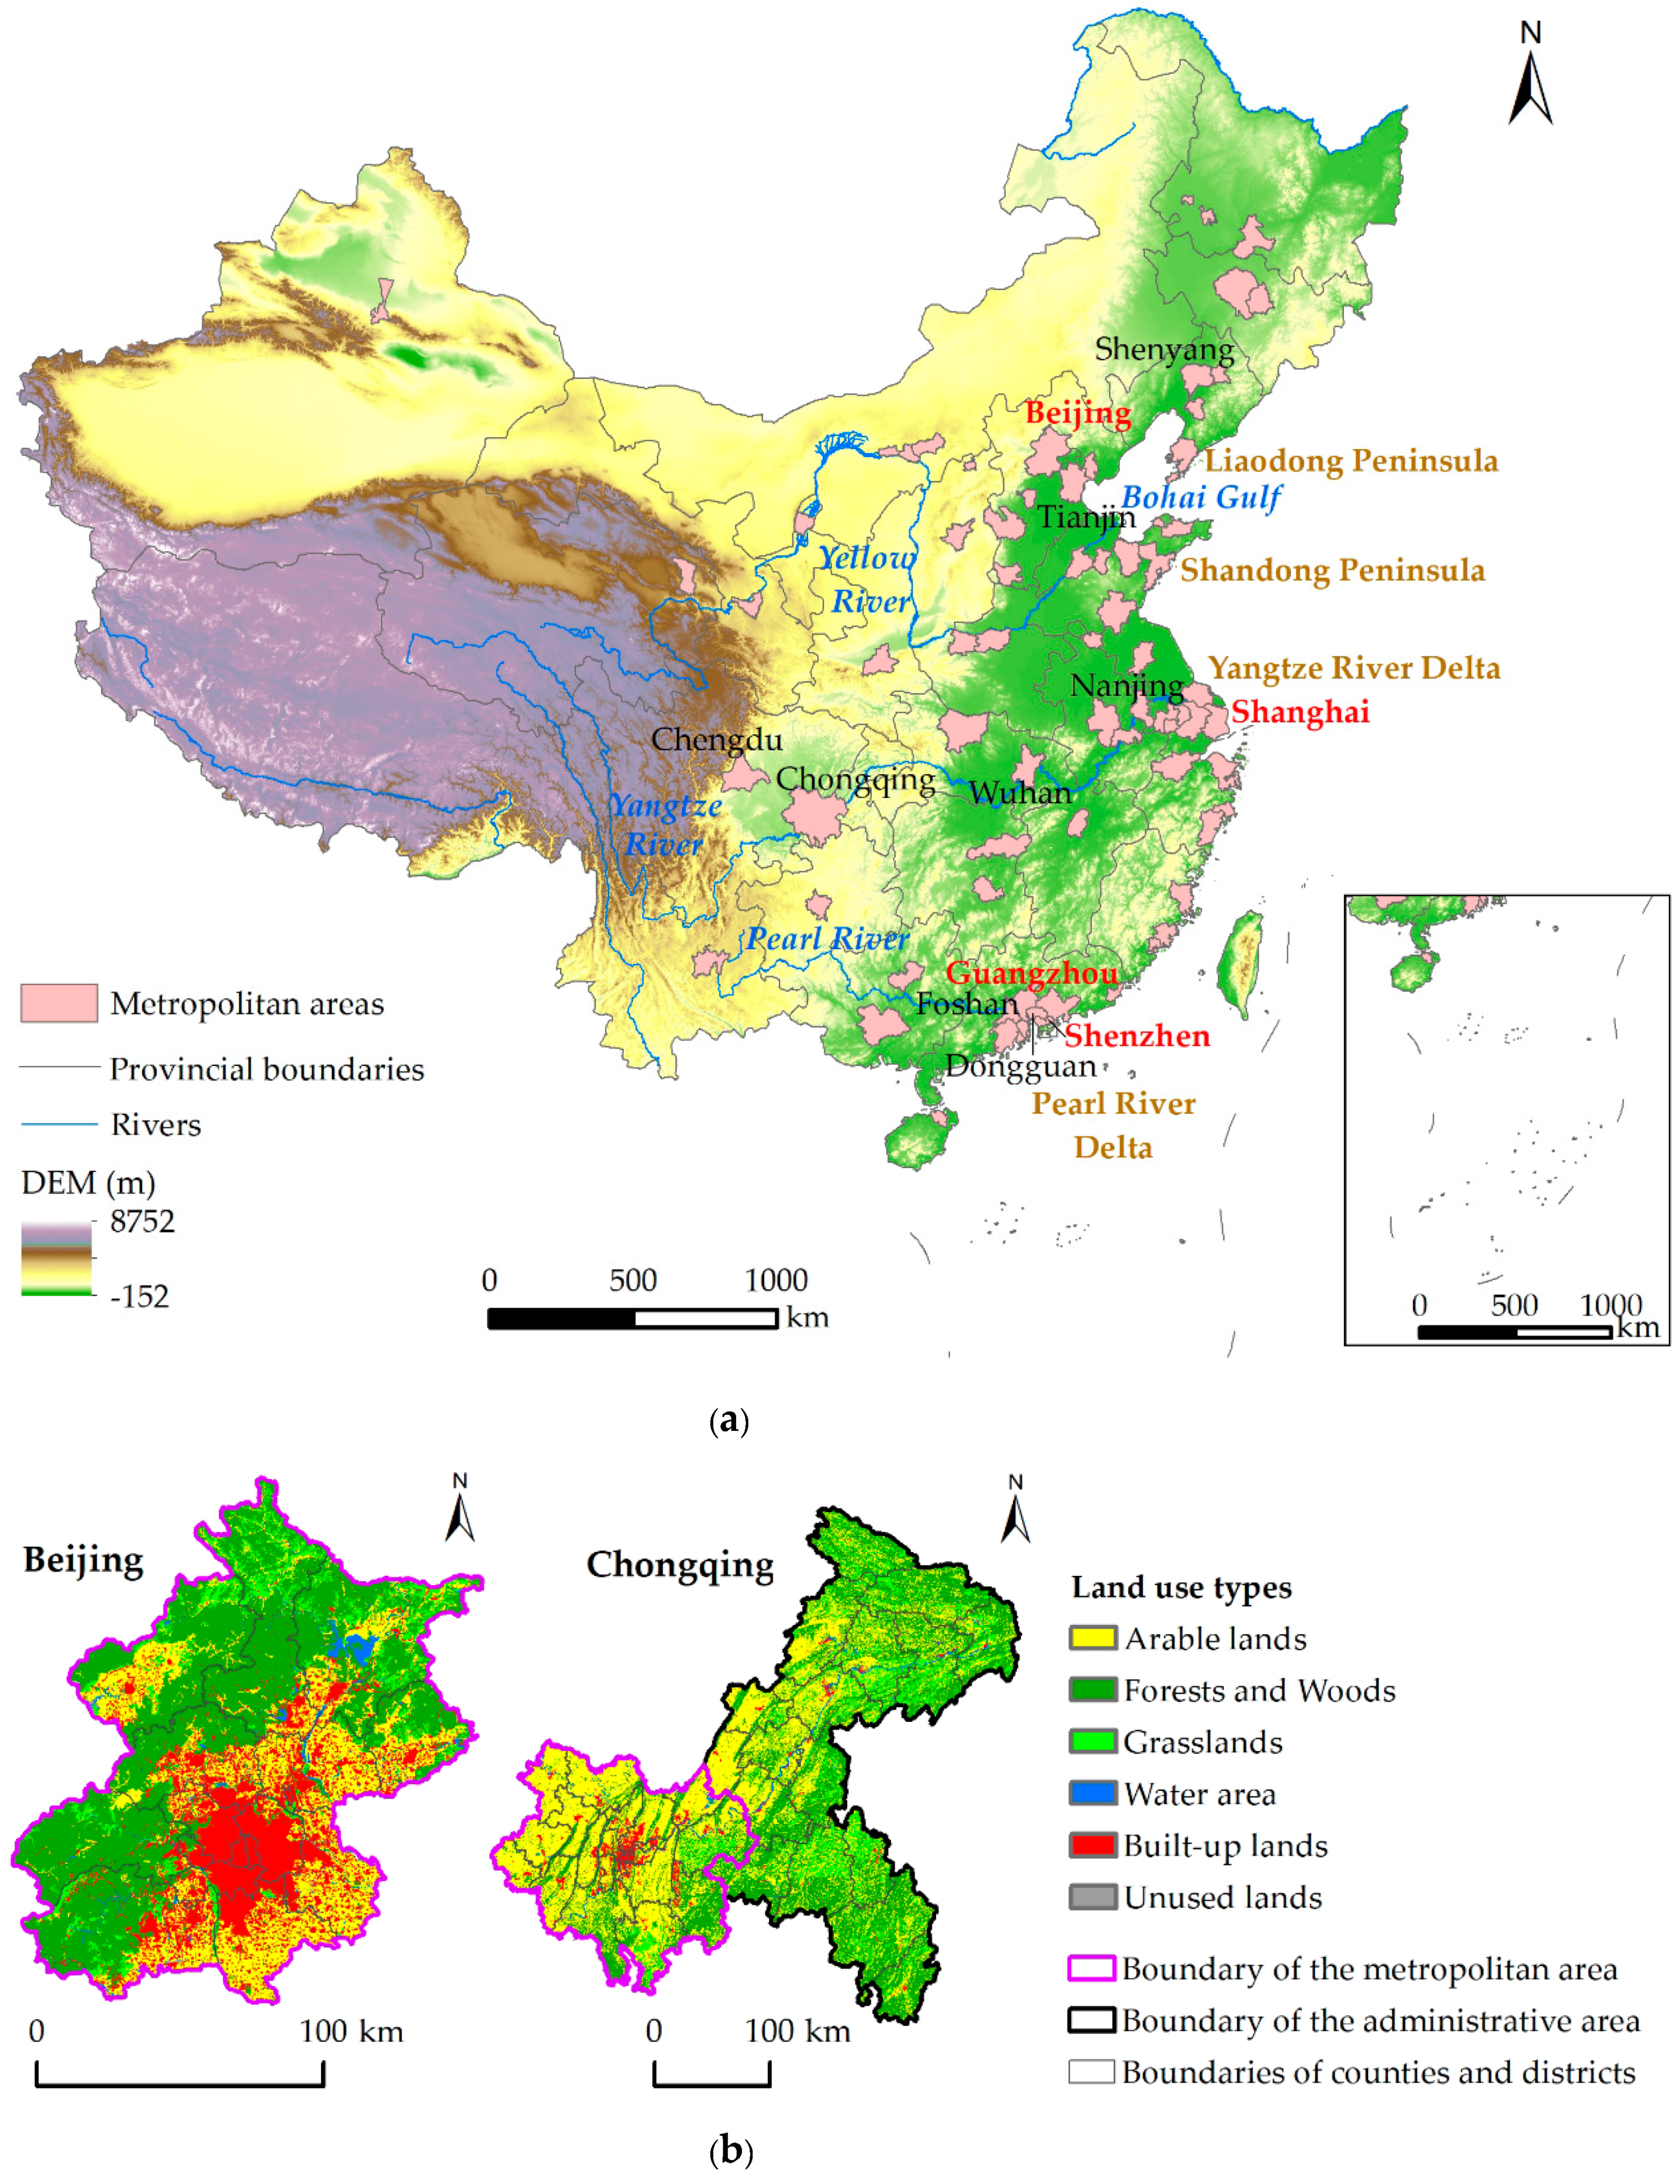
2.1. Study Areas
2.2. Data Sources
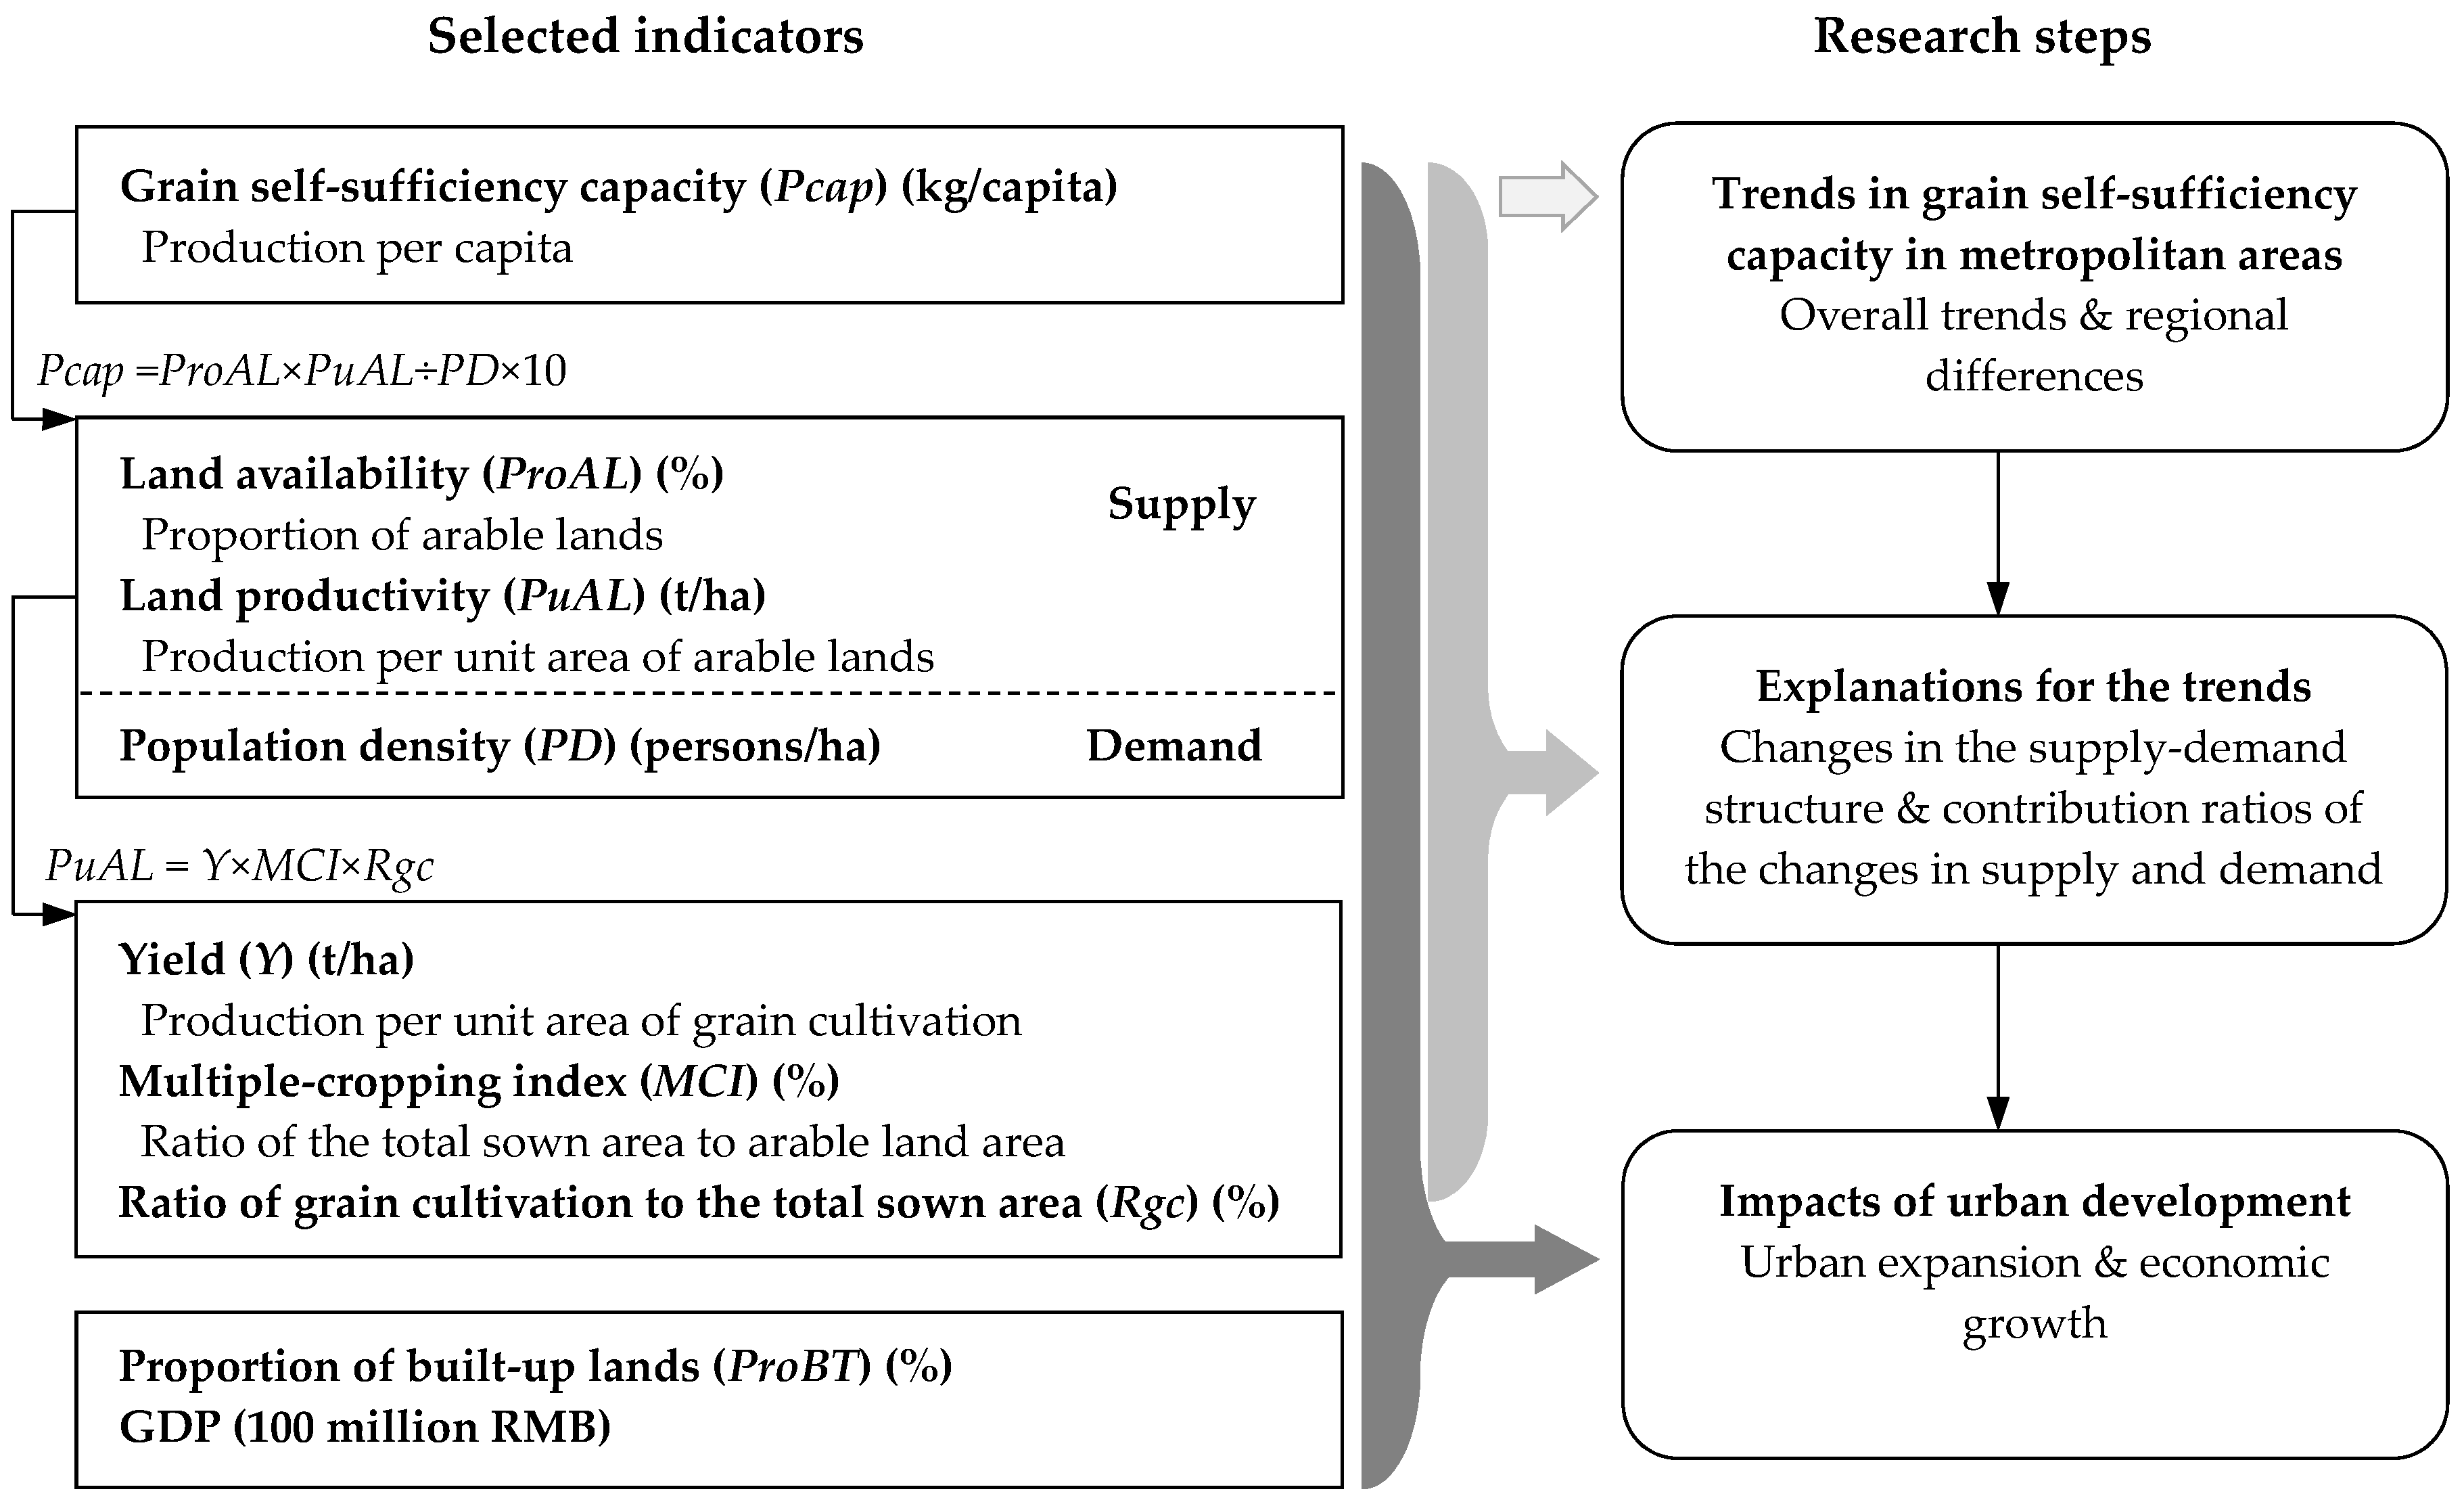
2.3. Methodology
3. Results
3.1. The Trends of Grain Self-Sufficiency Capacity in China’s Metropolitan Areas
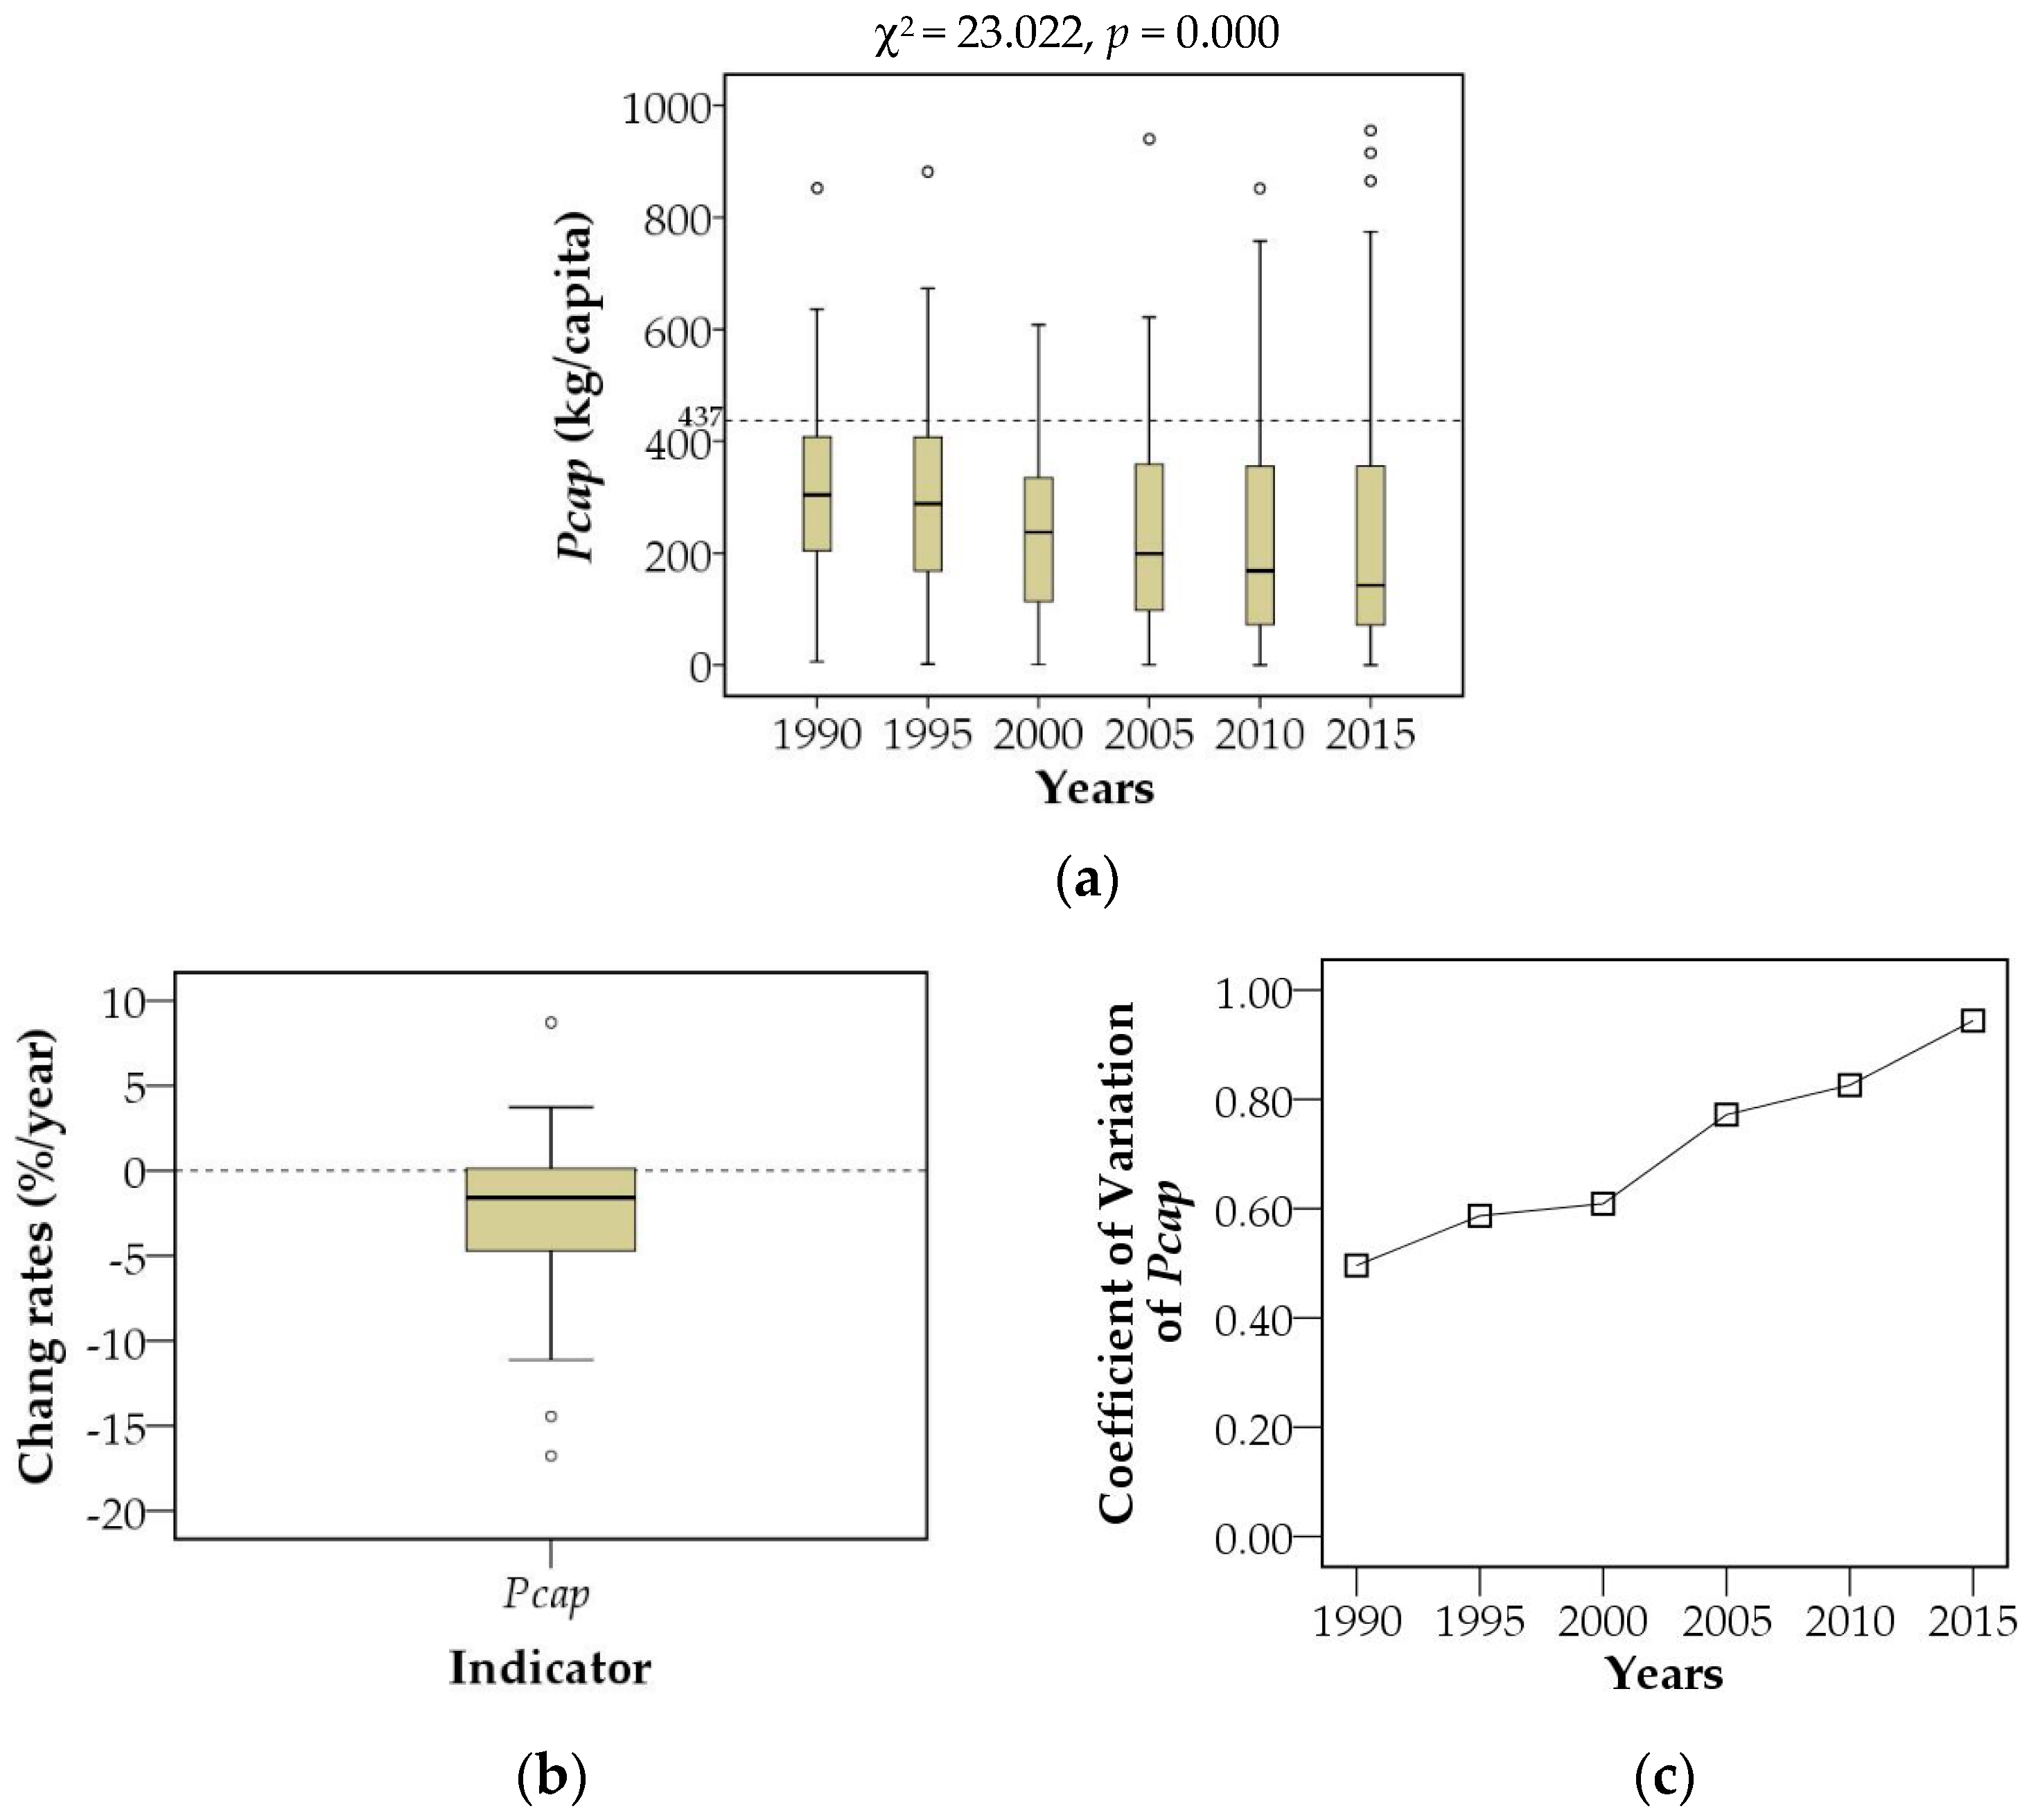
3.1.1. Overall Trends of Grain Self-Sufficiency Capacity
3.1.2. Regional Differences in the Trends of Grain Self-Sufficiency Capacity
3.2. Contributions of the Changes in Grain Supply and Demand to the Trends of Grain Self-Sufficiency Capacity in China’s Metropolitan Areas
3.2.1. Changes in the Supply–Demand Relationship for Grains in China’s Metropolitan Areas
3.2.2. Contributions of the Changes in Supply and Demand to the Trends in Grain Self-Sufficiency
3.3. Impacts of Urban Expansion and Economic Growth on Grain Self-Sufficiency in China’s Metropolitan Areas
4. Discussion
4.1. Implications for Policies Related to Grain Production in China’s Metropolitan Areas
4.2. A Brief Comparison with Some Metropolitan Areas in the Global North
4.3. Limitations of the Study
5. Conclusions
Author Contributions
Funding
Acknowledgments
Conflicts of Interest
Appendix A
Appendix B
Appendix C

References
- United Nations. World Urbaniszation Prospects: Key Facts 2018. Available online: https://population.un.org/wup/Publications/Files/WUP2018-KeyFacts.pdf (accessed on 26 December 2018).
- Sinclair, R. Von Thünen and urban sprawl. Ann. Assoc. Am. Geogr. 1967, 57, 72–87. [Google Scholar] [CrossRef]
- Satterthwaite, D.; McGranahan, G.; Tacoli, C. Urbanization and its implications for food and farming. Phil. Trans. R. Soc. 2010, 365, 2809–2820. [Google Scholar] [CrossRef] [PubMed] [Green Version]
- Bryant, C.R. Farmland conservation and farming landscapes in urban-centred regions: The case of the Ile-de-France region. Landsc. Urban Plan. 1986, 13, 251–276. [Google Scholar] [CrossRef]
- Nelson, A.C. Economic critique of U.S. prime farmland preservation policies: Towards state policies that influence productive, consumptive, and speculative value components of the farmland market to prevent urban sprawl and foster agricultural production in the United States. J. Rural Stud. 1990, 6, 119–142. [Google Scholar]
- Alterman, R. The challenge of farmland preservation: Lessons from a six-nation comparison. J. Am. Plan. Assoc. 1997, 63, 220–243. [Google Scholar] [CrossRef]
- Kashian, R.; Skidmore, M. Preserving agricultural land via property assessment policy and the willingness to pay for land preservation. Econ. Dev. Q. 2002, 16, 75–87. [Google Scholar] [CrossRef]
- Bengston, D.N.; Fletcher, J.O.; Nelson, K.C. Public policies for managing urban growth and protecting open space: Policy instruments and lessons learned in the United States. Landsc. Urban Plan. 2004, 69, 271–286. [Google Scholar] [CrossRef]
- Van Asselt, E.D.; Van Bussel, L.G.J.; Van der Voet, H.; Van der Heijden, G.W.A.M.; Tromp, S.O.; Rijgersberg, H.; Van Evert, F.; Van Wagenberg, C.P.A.; Van der Fels-Klerx, H.J. A protocol for evaluating the sustainability of agri-food production systems—A case study on potato production in peri-urban agriculture in The Netherlands. Ecol. Indic. 2014, 43, 315–321. [Google Scholar] [CrossRef]
- Toth, A.; Rendall, S.; Reitsma, F. Resilient food systems: A qualitative tool for measuring food resilience. Urban Ecosyst. 2016, 19, 19–43. [Google Scholar] [CrossRef]
- Aubry, C.; Kebir, L. Shortening food supply chains: A means for maintaining agriculture close to urban areas? The case of the French metropolitan area of Paris. Food Policy 2013, 41, 85–93. [Google Scholar] [CrossRef]
- Akimowicz, M.; Cummings, H.; Landman, K. Green lights in the Greenbelt? A qualitative analysis of farm investment decision-making in peri-urban Southern Ontario. Land Use Policy 2016, 55, 24–36. [Google Scholar] [CrossRef] [Green Version]
- Bertoni, D.; Cavicchioli, D. Farm succession, occupational choice and farm adaptation at the rural-urban interface: The case of Italian horticultural farms. Land Use Policy 2016, 57, 739–748. [Google Scholar] [CrossRef]
- Morel, K.; San Cristobal, M.; Leger, F.G. Small can be beautiful for organic market gardens: An exploration of the economic viability of French microfarms using MERLIN. Agric. Syst. 2017, 158, 39–49. [Google Scholar] [CrossRef]
- Pölling, B.; Sroka, W.; Mergenthaler, M. Success of urban farming’s city-adjustments and business models—Findings from a survey among farmers in Ruhr Metropolis, Germany. Land Use Policy 2017, 69, 372–385. [Google Scholar] [CrossRef]
- Olsson, E.G.A.; Kerselaers, E.; Kristensen, L.S.; Primdahl, J.; Rogge, E.; Wästfelt, A. Peri-urban food production and its relation to urban resilience. Sustainability 2016, 8, 1340. [Google Scholar] [CrossRef]
- Wästfelt, A.; Zhang, Q. Reclaiming localisation for revitalising agriculture: A case study of peri-urban agricultural change in Gothenburg, Sweden. J. Rural Stud. 2016, 47, 172–185. [Google Scholar] [CrossRef]
- Kennedy, C.; Cuddihy, J.; Engel-Yan, J. The changing metabolism of cities. J. Ind. Ecol. 2007, 11, 43–59. [Google Scholar] [CrossRef]
- Penker, M. Mapping and measuring the ecological embeddedness of food supply chains. Geoforum 2006, 37, 368–379. [Google Scholar] [CrossRef]
- Porter, J.R.; Dyball, R.; Dumaresq, D.; Deutsch, L.; Matsuda, H. Feeding capitals: Urban food security and self-provisioning in Canberra, Copenhagen and Tokyo. Glob. Food Secur. -A.G.R. 2014, 3, 1–7. [Google Scholar] [CrossRef]
- Nixon, P.A.; Ramaswami, A. Assessing current local capacity for agrifood production to meet household demand: Analyzing select food commodities across 377 US metropolitan areas. Environ. Sci. Technol. 2018, 52, 10511–10521. [Google Scholar] [CrossRef] [PubMed]
- Orlando, F.; Spigarolo, R.; Alali, S.; Bocchi, S. The role of public mass catering in local foodshed governance toward self-reliance of Metropolitan regions. Sustain. Cities Soc. 2019, 44, 152–162. [Google Scholar] [CrossRef]
- Monaco, F.; Zasada, I.; Wascher, D.; Glavan, M.; Pintar, M.; Schmutz, U.; Mazzocchi, C.; Corsi, S.; Sali, G. Food production and consumption: City regions between localism, agricultural land displacement, and economic competitiveness. Sustainability 2017, 9, 96. [Google Scholar] [CrossRef]
- Wascher, D.M.; Jeurissen, L. Urban food security at the crossroads between metropolitan food planning and global trade: The case of the Antwerp–Rotterdam–Düsseldorf region. Agroecol. Sustain. Food 2017, 41, 944–964. [Google Scholar] [CrossRef]
- Giombolini, K.J.; Chambers, K.J.; Schlegel, S.A.; Dunne, J.B. Testing the local reality: Does the Willamette Valley growing region produce enough to meet the needs of the local population? A comparison of agriculture production and recommended dietary requirements. Agric. Hum. Values 2011, 28, 247–262. [Google Scholar] [CrossRef]
- Tedesco, C.; Petit, C.; Billen, G.; Garnier, J.; Personne, E. Potential for recoupling production and consumption in peri-urban territories: The case-study of the Saclay plateau near Paris, France. Food Policy 2017, 69, 35–45. [Google Scholar] [CrossRef]
- Sioen, G.B.; Sekiyama, M.; Terada, T.; Yokohari, M. Post-disaster food and nutrition from urban agriculture: A self-sufficiency analysis of Nerima Ward, Tokyo. Int. J. Environ. Res. Public Health 2017, 14, 748. [Google Scholar] [CrossRef]
- Sioen, G.B.; Terada, T.; Sekiyama, M.; Yokohari, M. Resilience with mixed agricultural and urban land uses in Tokyo, Japan. Sustainability 2018, 10, 435. [Google Scholar] [CrossRef]
- Cohen, B. Urbanization in developing countries: Current trends, future projections, and key challenges for sustainability. Technol. Soc. 2006, 28, 63–80. [Google Scholar] [CrossRef]
- Seto, K.C.; Ramankutty, N. Hidden linkages between urbanization and food systems. Science 2016, 352, 943–945. [Google Scholar] [CrossRef]
- Otsuka, K. Food insecurity, income inequality, and the changing comparative advantage in world agriculture. Agric. Econ. 2013, 44, 7–18. [Google Scholar] [CrossRef]
- Ghose, B. Food security and food self-sufficiency in China: From past to 2050. Food Energy Secur. 2014, 3, 86–95. [Google Scholar] [CrossRef]
- Ito, J.; Ni, J. Capital deepening, land use policy, and self-sufficiency in China’s grain sector. China Econ. Rev. 2013, 24, 95–107. [Google Scholar] [CrossRef]
- Dong, X.; Veeman, T.S.; Veeman, M.M. China’s grain imports: An empirical study. Food Policy 1995, 20, 323–338. [Google Scholar] [CrossRef]
- Zheng, Z.; Henneberry, S.R. Estimating the impacts of rising food prices on nutrient intake in urban China. China Econ. Rev. 2012, 23, 1090–1103. [Google Scholar] [CrossRef]
- Veeck, G. China’s food security: Past success and future challenges. Eurasian Geogr. Econ. 2013, 54, 42–56. [Google Scholar] [CrossRef]
- He, C.; Liu, Z.; Xu, M.; Ma, Q.; Dou, Y. Urban expansion brought stress to food security in China: Evidence from decreased cropland net primary productivity. Sci. Total Environ. 2017, 576, 660–670. [Google Scholar] [CrossRef] [PubMed]
- Lichtenberg, E.; Ding, C. Assessing farmland protection policy in China. Land Use Policy 2008, 25, 59–68. [Google Scholar] [CrossRef]
- Liu, Y.; Fang, F.; Li, Y. Key issues of land use in China and implications for policy making. Land Use Policy 2014, 40, 6–12. [Google Scholar] [CrossRef]
- Li, X.; Zhang, W.; Peng, Y. Grain output and cultivated land preservation: Assessment of the Rewarded Land Conversion Quotas Trading Policy in China’s Zhejiang Province. Sustainability 2016, 8, 821. [Google Scholar] [CrossRef]
- Ho, S.P.S.; Lin, G.C.S. Non-agricultural land use in post-reform China. China Q. 2004, 179, 758–781. [Google Scholar] [CrossRef]
- Wu, Y.; Peng, Y.; Zhang, X.; Skitmore, M.; Song, Y. Development priority zoning (DPZ)-led scenario simulation for regional land use change: The case of Suichang County, China. Habitat Int. 2012, 36, 268–277. [Google Scholar] [CrossRef] [Green Version]
- Ye, L.; Wu, A.M. Urbanization, land development, and land financing: Evidence from Chinese cities. J. Urban Aff. 2014, 36, 354–368. [Google Scholar] [CrossRef]
- Guo, S.; Liu, L.; Zhao, Y. The business cycle implications of land financing in China. Econ. Model. 2015, 46, 225–237. [Google Scholar] [CrossRef]
- Li, J.; Sun, L. Thinking of the development of water-saving agriculture in Beijing. Heilongjiang Agric. Sci. 2015, 12, 155–160. (In Chinese) [Google Scholar]
- Yang, H.; Li, X. Cultivated land and food supply in China. Land Use Policy 2000, 17, 73–88. [Google Scholar] [CrossRef]
- Tan, M.H. The transition of farmland production functions in metropolitan areas in China. Sustainability 2014, 6, 4028–4041. [Google Scholar] [CrossRef]
- Yang, Z.; Hao, P.; Liu, W.; Cai, J. Peri-urban agricultural development in Beijing: Varied forms, innovative practices and policy implications. Habitat Int. 2016, 56, 222–234. [Google Scholar] [CrossRef] [Green Version]
- Green, H.L. Hinterland Boundaries of New York City and Boston in Southern New England. Econ. Geogr. 1955, 31, 283–300. [Google Scholar] [CrossRef]
- Feldt, A.G. The metropolitan area concept: An evaluation of the 1950 SMA’s. J. Am. Stat. Assoc. 1965, 60, 617–636. [Google Scholar] [CrossRef]
- OECD. Redefining “Urban”: A New Way to Measure Metropolitan Areas; OECD Publishing: Paris, France, 2012; Available online: https://doi.org/10.1787/9789264174108-en (accessed on 26 June 2017).
- Mazzocchi, C.; Sali, G.; Corsi, S. Land use conversion in metropolitan areas and the permanence of agriculture: Sensitivity Index of Agricultural Land (SIAL), a tool for territorial analysis. Land Use Policy 2013, 35, 155–162. [Google Scholar] [CrossRef]
- Newman, L.; Powell, L.J.; Wittman, H. Landscapes of food production in agriburbia: Farmland protection and local food movements in British Columbia. J. Rural Stud. 2015, 39, 99–110. [Google Scholar] [CrossRef]
- Long, Y.; Han, H.; Lai, S.K.; Mao, Q. Urban growth boundaries of the Beijing Metropolitan Area: Comparison of simulation and artwork. Cities 2013, 31, 337–348. [Google Scholar] [CrossRef]
- Qi, W.; Liu, S.; Jin, H. Applicability of the new standard of city-size classification in China. Prog. Geogr. 2016, 35, 47–56. (In Chinese) [Google Scholar]
- Hu, X. On the spatial agglomeration and dispersion in coastal regions. City Plan. Rev. 1998, 22, 22–28. (In Chinese) [Google Scholar]
- Yue-min, X.H.N. Study on the development of big cities and the formation of metropolitan areas in China. Urban Probl. 2005, 123, 11–15. (In Chinese) [Google Scholar]
- Zhao, D.; Han, Z.; Zhao, B. Spatial framework and change of the Northeast China’s economic links. Sci. Geogr. Sin. 2016, 36, 846–854. (In Chinese) [Google Scholar]
- Yang, L.; Xue, Q. Administrative boundary re-organization: A perspective of economic linkage between the city and its counties. Shandong Soc. Sci. 2017, 267, 132–138. (In Chinese) [Google Scholar]
- Liu, J.; Liu, M.; Tian, H.; Zhuang, D.; Zhang, Z.; Zhang, W.; Tang, X.; Deng, X. Spatial and temporal patterns of China’s cropland during 1990–2000: An analysis based on Landsat TM data. Remote Sens. Environ. 2005, 98, 442–456. [Google Scholar] [CrossRef]
- Clapp, J. Food self-sufficiency: Making sense of it, and when it makes sense. Food Policy 2017, 66, 88–96. [Google Scholar] [CrossRef] [Green Version]
- Song, X.; Ouyang, Z. Key influencing factors of food security guarantee in China during 1999–2007. Acta Geogr. Sin. 2012, 67, 793–803. (In Chinese) [Google Scholar]
- Xie, H.; Liu, G. Spatiotemporal differences and influencing factors of multiple-cropping index in China during 1998–2012. J. Geogr. Sci. 2015, 25, 1283–1297. [Google Scholar] [CrossRef]
- Kauppi, P.E.; Ausubel, J.H.; Fang, J.; Mather, A.S.; Sedjo, R.A.; Waggoner, P.E. Returning forests analyzed with the forest identity. Proc. Natl. Acad. Sci. USA 2006, 103, 17574–17579. [Google Scholar] [CrossRef] [Green Version]
- Shi, L.; Zhao, S.; Tang, Z.; Fang, J. The changes in China’s forests: An analysis using the forest identity. PLoS ONE 2011, 6, e20778. [Google Scholar] [CrossRef] [PubMed]
- Hou, D.; Zhou, H. Study on modern agriculture development of resource-based city based on entropy method—Taking Jixi City as a study case. Agric. Econ. Manag. 2017, 42, 80–87. (In Chinese) [Google Scholar]
- Wang, Q.; Liu, X.; Yue, T.; Wang, C.; Wilson, J.P. Using models and spatial analysis to analyze spatio-temporal variations of food provision and food potential across China’s agro-ecosystems. Econ. Model. 2015, 306, 152–159. [Google Scholar] [CrossRef]
- Fang, C. Important progress and future direction of studies on China’s urban agglomerations. J. Geogr. Sci. 2015, 25, 1003–1024. [Google Scholar] [CrossRef] [Green Version]
- Fang, C.; Yu, D. Urban agglomeration: An evolving concept of an emerging phenomenon. Landsc. Urban Plan. 2017, 162, 126–136. [Google Scholar] [CrossRef]
- Li, G.; Zhao, Y.; Cui, S. Effects of urbanization on arable land requirements in China, based on food consumption patterns. Food Secur. 2013, 5, 439–449. [Google Scholar] [CrossRef]
- Xu, G.; Huang, X.; Zhong, T.; Chen, Y.; Wu, C.; Jin, Y. Assessment on the effect of city arable land protection under the implementation of China’s National General Land Use Plan (2006–2020). Habitat Int. 2015, 49, 466–473. [Google Scholar] [CrossRef]
- Li, W.; Wang, D.; Li, H.; Liu, S. Urbanization-induced site condition changes of peri-urban cultivated land in the black soil region of northeast China. Ecol. Indic. 2017, 80, 215–223. [Google Scholar] [CrossRef]
- Bryant, C.R.; Chahine, G. Action research and reducing the vulnerability of peri-urban agriculture: A case study from the Montreal Region. Geogr. Res. 2016, 54, 165–175. [Google Scholar] [CrossRef]
- Nixon, D.V.; Newman, L. The efficacy and politics of farmland preservation through land use regulation: Changes in southwest British Columbia’s Agricultural Land Reserve. Land Use Policy 2016, 59, 227–240. [Google Scholar] [CrossRef]
- Zobbe, H. The economic and historical foundation of the Common Agricultural Policy in Europe. In Proceedings of the Fourth European Historical Economics Society Conference, Merton College, Oxford, UK, 21 September 2001. [Google Scholar]
- Toullalan, M. Les Enjeux de la Production et de l’Approvisionnement Alimentaires en Ile-de-France. Available online: http://www.lafranceagricole.fr/r/Publie/FA/p1/Infographies/Web/2012-03-13/55016_2.pdf (accessed on 6 April 2019). (In French).
- Poulot, M. L’agriculture francilienne dans la seconde moitié du XXe siècle: Vers un postproductivisme de proximité? Pour 2010, 205, 161–177. (In French) [Google Scholar] [CrossRef]
- Darly, S.; Torre, A. Conflicts over farmland uses and the dynamics of “agri-urban” localities in the Greater Paris Region: An empirical analysis based on daily regional press and field interviews. Land Use Policy 2013, 33, 90–99. [Google Scholar] [CrossRef]
- Recanati, F.; Maughan, C.; Pedrotti, M.; Dembska, K.; Antonelli, M. Assessing the role of CAP for more sustainable and healthier food systems in Europe: A literature review. Sci. Total Environ. 2019, 653, 908–919. [Google Scholar] [CrossRef] [PubMed]
- Huang, J.; Ridoutt, B.G.; Xu, C.; Zhang, H.; Chen, F. Cropping pattern modifications change water resource demands in the Beijing metropolitan area. J. Integr. Agric. 2012, 11, 1914–1923. [Google Scholar] [CrossRef]


| Trends of Grain Self-Sufficiency | Metropolitan Areas | Pcap (kg/capita) | Change Rate of Pcap (%/year) | |
|---|---|---|---|---|
| 1990 | 2015 | |||
| Decrease in the center of the megalopolises | Beijing | 245 | 29 | −7.6 |
| Shanghai | 183 | 46 | −6.0 | |
| Shenzhen | 49 | 0.004 | −17 | |
| Guangzhou | 190 | 33 | −7.3 | |
| Decrease in traditional grain production regions in the West | Chengdu | 406 | 154 | −4.1 |
| Chongqing | 410 | 297 | −1.2 | |
| Decrease in areas with low self-sufficiency in Northwestern China | Urumqi | 85 | 36 | −4.2 |
| Xining | 223 | 84 | −3.2 | |
| Increase in traditional grain production regions in Northeastern China | Harbin | 514 | 775 | 0.3 |
| Changchun | 852 | 955 | 0.3 | |
| Increase in the periphery of the megalopolises | Nantong | 304 | 468 | 1.2 |
| Baoding | 364 | 391 | 0.1 | |
| Shenyang | 362 | 320 | 0.1 | |
| Improvement in the North | Baotou | 132 | 375 | 3.7 |
| Lanzhou | 58 | 79 | 1.0 | |
| Indicators | 1990 | 1995 | 2000 | 2005 | 2010 | 2015 | Change Rates | |
|---|---|---|---|---|---|---|---|---|
| PD- | ProAL | 0.356 ** | 0.217 | 0.125 | 0.026 | −0.075 | −0.096 | −0.565 *** |
| PuAL | 0.38 ** | 0.257 * | 0.23 | −0.105 | −0.207 | −0.205 | −0.525 *** | |
| Y | 0.144 | 0.138 | 0.226 | 0.134 | −0.06 | −0.097 | −0.344 ** | |
| MCI | 0.131 | 0.146 | 0.206 | 0.105 | 0.1 | 0.21 | −0.029 | |
| Rgc | 0.148 | 0.096 | −0.151 | −0.312 ** | −0.303 * | −0.35 ** | −0.572 *** | |
| ProAL- | PuAL | 0.257 * | 0.239 * | 0.298 * | 0.515 *** | 0.615 *** | 0.645 *** | 0.613 *** |
| Y | 0.298 * | 0.3 * | 0.278 * | 0.464 *** | 0.536 *** | 0.515 *** | 0.307 ** | |
| MCI | −0.078 | −0.133 | −0.096 | 0.076 | 0.102 | 0.118 | 0.261 * | |
| Rgc | 0.203 | 0.242 * | 0.205 | 0.304 * | 0.367 ** | 0.431 *** | 0.587 *** | |
| Characteristics in Regard to Contributions to Grain Self-Sufficiency | Metropolitan Areas | PD (Persons/ha) | Y (t/ha) | MCI (%) | Rgc (%) | |||||
|---|---|---|---|---|---|---|---|---|---|---|
| 1990 | 2015 | 1990 | 2015 | 1990 | 2015 | 1990 | 2015 | |||
| Enlarging contradiction between rising demands and decreasing supply | In the center of the megalopolises | Beijing | 6.6 | 13.3 | 5.5 | 6.0 | 140 | 80 | 58.2 | 33.9 |
| Shanghai | 16.8 | 30.4 | 5.9 | 6.9 | 200 | 180 | 43.2 | 24.9 | ||
| Shenzhen | 8.8 | 60.4 | 4.6 | 4.9 | 200 | 160 | 22.6 | 0.04 | ||
| Guangzhou | 9.0 | 19.3 | 5.2 | 4.9 | 170 | 280 | 49.3 | 15.5 | ||
| In the periphery of megalopolises | Tianjin | 8.2 | 14.8 | 4.0 | 5.2 | 130 | 120 | 46.5 | 45.5 | |
| Hangzhou | 4.9 | 8.1 | 4.8 | 6.0 | 270 | 140 | 40.3 | 23.5 | ||
| Jiangmen | 4.0 | 5.3 | 5.0 | 4.9 | 220 | 180 | 44.9 | 40.8 | ||
| In the West | Chengdu | 7.9 | 12.6 | 5.4 | 6.3 | 210 | 160 | 46.0 | 37.6 | |
| Chongqing | 5.7 | 6.8 | 4.1 | 5.2 | 210 | 150 | 41.2 | 42.5 | ||
| Increasing self-sufficiency because of rising land productivity | High self-sufficiency | Harbin | 4.9 | 5.4 | 4.8 | 7.4 | 100 | 100 | 75.8 | 79.1 |
| Changchun | 3.3 | 4.1 | 6.3 | 7.6 | 100 | 80 | 59.3 | 85.5 | ||
| Low self-sufficiency | Baotou | 3.6 | 5.5 | 2.1 | 4.7 | 130 | 140 | 45.0 | 89.4 | |
| Lanzhou | 4.3 | 6.8 | 1.5 | 3.7 | 100 | 120 | 57.7 | 45.7 | ||
| Indicators | rY | rMCI | rRgc | rPuAL | rProAL | rPD | rPcap | rGDP |
|---|---|---|---|---|---|---|---|---|
| Spearman’s Correlation Coefficients | ||||||||
| rGDP- | −0.056 | −0.1 | −0.048 | −0.111 | −0.077 | 0.198 | −0.11 | 1 |
| rProBT- | −0.26 * | −0.239 * | −0.39 ** | −0.504 *** | −0.634 *** | 0.486 *** | −0.552 *** | 0.354 ** |
| Simple Linear Regression Models (rProBT as independent variable) | ||||||||
| a(rProBT) | −0.202 * | −0.243 * | −0.748 ** | −1.175 *** | −0.275 *** | 0.369 *** | −1.63 *** | 0.322 ** |
| Constant | 1.606 | 0.037 | 1.031 | 2.629 | 0.13 | 0.706 | 1.807 | 7.693 |
| R Square | 0.066 | 0.059 | 0.123 | 0.208 | 0.252 | 0.158 | 0.269 | 0.13 |
© 2019 by the authors. Licensee MDPI, Basel, Switzerland. This article is an open access article distributed under the terms and conditions of the Creative Commons Attribution (CC BY) license (http://creativecommons.org/licenses/by/4.0/).
Share and Cite
Huang, J.; Liang, Z.; Wu, S.; Li, S. Grain Self-Sufficiency Capacity in China’s Metropolitan Areas under Rapid Urbanization: Trends and Regional Differences from 1990 to 2015. Sustainability 2019, 11, 2468. https://doi.org/10.3390/su11092468
Huang J, Liang Z, Wu S, Li S. Grain Self-Sufficiency Capacity in China’s Metropolitan Areas under Rapid Urbanization: Trends and Regional Differences from 1990 to 2015. Sustainability. 2019; 11(9):2468. https://doi.org/10.3390/su11092468
Chicago/Turabian StyleHuang, Jiao, Ze Liang, Shuyao Wu, and Shuangcheng Li. 2019. "Grain Self-Sufficiency Capacity in China’s Metropolitan Areas under Rapid Urbanization: Trends and Regional Differences from 1990 to 2015" Sustainability 11, no. 9: 2468. https://doi.org/10.3390/su11092468