Abstract
Based on the two knowledge dimensions of availability and accessibility, this study investigates the influence of cooperation with external organizations on technological, product, and process innovations. Using longitudinal data from Spanish manufacturing firms, we estimate dynamic random-effects probit models and thus take into account that technological innovations exhibit persistent behavior. We find that cooperation with suppliers and universities is positively associated with both product and process innovations. However, sectoral analysis according to technological intensity reveals that cooperation with suppliers increases the propensity to technological innovation in industries with a higher degree of technological intensity, while cooperation with universities increases the likelihood of innovation in industries with a lower degree of technological intensity. Moreover, empirical results indicate a high degree of true or genuine state dependence in both types of innovations. Based on these findings, we discuss the theoretical, managerial, and policy implications of the study.
1. Introduction
As the business world gets increasingly competitive and globalized, innovation has increasingly become the source of sustainable competitive advantage [1]. Innovation can be spurred by collaboration because it allows access to external resources in general, and knowledge in particular, that a firm may lack in-house [2,3,4,5]. As different cooperative partners may have different knowledge bases that are complementary to a firm’s knowledge base, collaboration relationships could be forged with a variety of partners and each of these relationships could have a different impact on innovation [6]. This paper addresses this issue by focusing on the impact of collaborating with four partners—universities or higher educational institutions (HEIs), customers, suppliers, and competitors—on technological, product, and process innovations.
We delineate two dimensions of knowledge—availability and accessibility—and rank the four collaboration relationships separately on each dimension. We then combine these pairs of ranks to formulate hypotheses with regards to the impact of each of the four collaborative relationships on product and process innovations. Our systematic approach provides a more fine-grained analysis of the relationship between collaborative relationships and technological innovation. Another contribution of the study is associated with the estimation strategy. By applying dynamic panel probit models, we account for the persistence in the propensity to technological innovations. Therefore, this study brings together two strands of the literature: the impact of collaboration on innovation performance, and the persistence in innovation. Finally, we present a sectoral analysis, whereby the sectoral classification is based on technological intensity.
The study is organized as follows. First, we briefly review the literature on the impact of collaboration on different types of innovation. Then, based on the literature, we delineate two dimensions of knowledge, availability and accessibility, which jointly determine the impact of a particular collaborative relationship on a specific type of innovation. We then make a case for the ranking of each of the four collaborative partners on product and process innovations, across both the availability and accessibility knowledge dimensions. Based on this ranking, we develop hypotheses with regards to the impact of collaborating with each of the four partners on technological innovations. Next, we describe our methodology, which is followed by a discussion of the results. We conclude with the main findings and contributions of our paper to theory and practice.
2. Literature Review and Development of Hypotheses
Collaboration is a complex phenomenon because firms usually collaborate with a variety of partners [7]. Scholars have typically unpacked it based on partnering entity (e.g., [3,7,8,9]. We follow this tradition by distinguishing between different types of partners. Similar to [8,9], we consider ties with competitors and universities or Higher Education Institutions (HEIs). Moreover, we distinguish between collaborative partners, customers, and suppliers, in a vertical collaboration. This is because customers and suppliers are at opposite ends of the supply chain, and the dynamics between a firm and its customers and between a firm and its suppliers are different and might have different impacts on innovation [7,10]. We develop hypotheses on the relationship between these four types of cooperative relationships and technological, product, and process innovations.
Theoretical insights into firms’ motivation to engage in cooperation for innovation are provided by three distinct theoretical frameworks: the resource-based view of the firm, the knowledge-based view of the firm, and the concept of absorptive capacity. The resource-based view regards firms as bundles of tangible and intangible resources [11]. It proposes that firms cooperate with different partners to access external resources that are complementary to firms’ internal resource and thus exploit synergies between them [12,13,14,15]. The knowledge-based view regards firms as institutional knowledge creators and facilitators [16], in particular regarding the transformation of tacit into explicit knowledge that can be used for the development of new products and processes [7]. Because firms do not possess all the necessary knowledge, cooperation for innovation enables them to tap into a diverse pool of external knowledge sources. In other words, firms can seldom successfully and continuously innovate without adopting open innovation practices and thus utilizing not only internal innovation capabilities but also external knowledge sources [2,7,17]. Complementarity between internal and external knowledge is emphasized through the concept of absorptive capacity. Originally developed by [18], this refers to a firm’s ability to acquire, absorb, and utilize external knowledge. Absorptive capacity, as a necessary precursor of collaboration, has a dual role in a firm: on the one hand, it determines the firm’s internal knowledge base; on the other hand, it crucially contributes to the firm’s ability to assimilate external knowledge [13,17,19,20,21].
We delineate two dimensions of knowledge—availability and accessibility—on which we rank each of the four collaborative partners vis-à-vis each type of technological innovation. We then combine these ranks to develop eight hypotheses. Innovation requires knowledge, and two dimensions seem to be the most relevant: the likelihood of availability of relevant knowledge from the collaborative partner, and the accessibility of the relevant knowledge. These dimensions are consistent with the two dimensions posited by [7] concerning product innovation, i.e., the breadth of new knowledge and the ease of accessing new knowledge, and by [10] in relation to process innovation, that is, a position in the knowledge chain and a contextual knowledge distance.
Availability of knowledge captures the likelihood of a collaborative partner having knowledge that is relevant and useful to the focal firms in introducing a particular type of innovation. Firms are typically looking for knowledge that is different but complementary to the knowledge that they possess. If the knowledge provided from collaborative partners is too different from the firm’s knowledge, it may not be relevant, but if it is too similar or overlaps too much with the firm’s knowledge then it will not be useful. Therefore, the degree of similarity of knowledge possessed by each collaborative partner relative to the focal firms would determine whether their knowledge is relevant and useful. In particular, knowledge provided by competitors would be most similar to the focal firms, while knowledge from HEIs would be most dissimilar, with customers and suppliers falling in between these two extremes [10].
Concerning product innovation, HEIs would rank the highest in terms of availability of relevant knowledge, followed by competitors, then customers and finally suppliers. HEIs possess a broader knowledge base than other collaborative partners [10], and hence would have a higher availability of knowledge in general. Further, HEIs tend to be at the cutting edge of knowledge and would be able to provide the radical breakthroughs that are at the heart of product innovation [6]. After HEIs, competitors would be the partner with the highest availability of product innovation knowledge, since they would attempt to have the first-mover advantage [22] or technological leadership at each stage of the product life cycle (e.g., Apple versus Samsung in the smartphone industry). Customers have useful knowledge with regards to the introduction of new products, particularly when market needs are heterogeneous, and when technology is ‘sticky’ [23,24]. Finally, although suppliers may not have much of directly relevant knowledge with regards to product innovation [7], they could indirectly facilitate its introduction, as firms may subcontract their non-core activities to suppliers, thereby focusing on their core competencies leading to more product innovation [6,25].
In relation to process innovation, suppliers would rank the highest in terms of availability of relevant knowledge, followed by competitors, HEIs, and customers. Suppliers possess knowledge of cost-reducing technologies [6,25], which is a key aspect of process innovation. Competitors belong to the same industry as the focal firms and therefore, best practices with regards to processes developed and held by them would be both relevant and potentially useful to the focal firm [10,26]. Although HEIs are often perceived as relevant only for product innovation, in the process of conducting their research and benchmark studies they may gain useful knowledge about best practices and processes that could facilitate process innovation in the focal firm [10,27,28]. Finally, customers would rank the lowest in terms of availability of relevant knowledge for process innovation, since they are relatively distant in terms of the contextual knowledge and are downstream in the knowledge chain [10].
Accessibility of knowledge captures the likelihood that the relevant and useful knowledge that a collaborative partner might possess regarding a particular type of innovation could be accessed from that partner. Accessibility is typically a function of the strength of the relationship between the focal firm and the collaborative partner, such that the stronger the relationship, the better the accessibility of knowledge. Typically, among the four collaborative partners, in general, accessibility of knowledge from suppliers would be the highest, as they are tightly coupled with the focal firm and they would have an incentive to cooperate [7,10]. In contrast, accessibility of knowledge from competitors would the lowest as typically, direct ties do not exist between them and the focal firm.
Regarding product innovation, suppliers would rank the highest in terms of accessibility of relevant knowledge, followed by HEIs, then customers, and finally competitors. Suppliers may offer limited new knowledge, but this knowledge is easily accessible [7], especially as firms would typically have more power in this collaborative relationship. Hence, they would rank the highest in terms of accessibility. In recent years, many firms have begun life as university spin-offs [29,30,31] and continue to collaborate with them as they grow and mature. Further, firms and universities are increasingly entering into partnership programs. Thus, HEIs would the ranked second in terms of accessibility. Customers would typically be more numerous than suppliers or HEIs and have more power in their relationship vis-à-vis the focal firm, therefore accessing knowledge from them would be harder than it would be from suppliers or HEIs. Finally, competitors’ knowledge concerning product innovation would be difficult to access because they would actively block such access [7].
In relation to process innovation, suppliers would rank the highest in terms of accessibility of relevant knowledge, followed by HEIs, then customers, and finally competitors. Suppliers by design are already tied to the focal firm, and these ties would typically be strong. Further, these relationships usually involve the product or service delivery processes, hence accessibility to the knowledge relevant for process innovation from suppliers would be the highest. HEIs are not automatically tied to the focal firm, but nevertheless provide inexpensive, low-risk access to specialized knowledge [6,32]. Such knowledge could be relevant for process innovation, in particular if it involves technical problem solving [33], and would rank second after suppliers in relation to accessibility to knowledge relevant for process innovation [10]. They would be followed by customers, who typically may not have the incentive to provide the focal firm with their time and effort in undertaking process innovations, which are less relevant to them than new products [10]. Finally, competitors, as pointed out earlier, would be reluctant to share their knowledge relevant to process innovations, given that complex knowledge embedded in process innovation is more difficult to replicate than knowledge embedded in product innovation [10].
Based on the above discussion on two dimensions of knowledge, we present their rankings for product innovation in Figure 1 (for product innovation) and in Figure 2 (for process innovation).
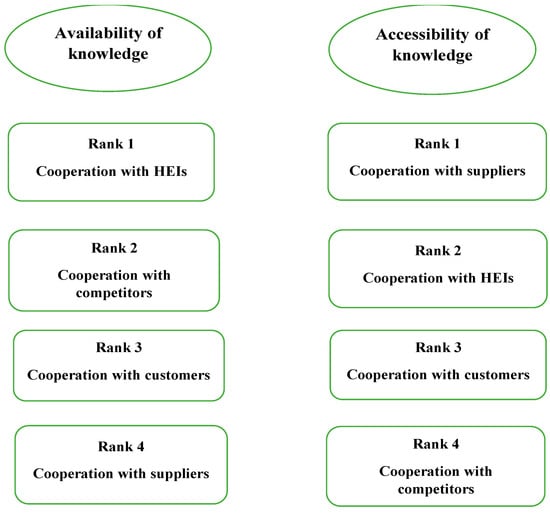
Figure 1.
The ranking of collaborative partners based on two dimensions of knowledge and their impact on product innovation.
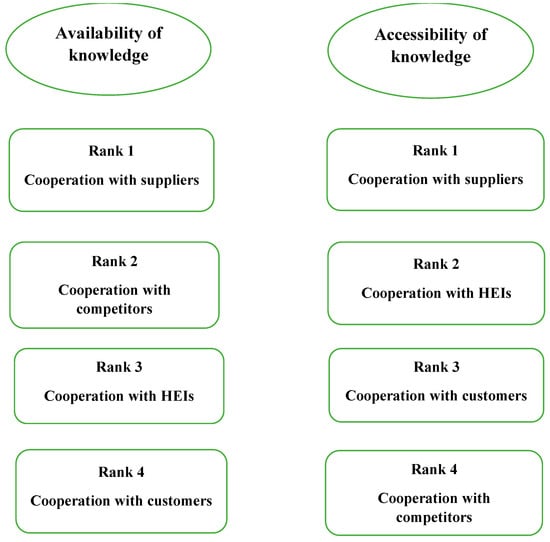
Figure 2.
The ranking of collaborative partners based on two dimensions of knowledge and their impact on process innovation.
2.1. Collaboration with Higher Educational Institutions (HEIs)
HEIs have been ranked as the highest in terms of availability and second in terms of accessibility of knowledge relevant to the development of new products. HEIs possess a broader knowledge base than any other cooperative partner [7]. Besides, universities by design have a multidisciplinary approach to knowledge and research. These two features—the breadth and interdisciplinarity of knowledge—can greatly facilitate product innovation in firms cooperating with universities. Another benefit of cooperating with universities relative to other partners is the low possibility of opportunistic behavior and knowledge leakages. Therefore, firms do not have to be particularly concerned how to protect their intellectual property and whether universities will share their knowledge of the focal firm’s production and organizational processes with other firms [15]. Moreover, cooperation with universities and other public institutions should be particularly dominant in firms further away from the technological frontier, given their limited technological and financial resources [15,34].
This has led us to hypothesize the following:
H1A:
Collaboration with HEIs has a larger positive impact on product innovation than collaboration with customers, suppliers, or competitors.
HEIs have been ranked third in terms of availability, and second in terms of accessibility of knowledge relevant to process innovation. Based on these dimensions of knowledge, HEIs would have the second-highest impact on process innovation, after suppliers [10]. HEIs have a broad knowledge base and collaboration with them brings the opportunity to access it. Concerning the type of innovation, the literature argues that collaboration with HEIs is primarily focused on product innovation [10]. However, HEIs can also foster process innovation in the focal firm, by analyzing the current production process and suggesting efficiency improvements. We therefore hypothesize the following:
H1B:
Collaboration with HEIs has a larger positive impact on process innovation than collaboration with customers or competitors but a smaller positive impact on process innovation than collaboration with suppliers.
2.2. Collaboration with Customers
Customers are ranked third both in terms of availability and accessibility of knowledge relevant for product innovation. As customers have better accessibility than competitors, collaborating with them should induce a higher impact on product innovation relative to competitors [7]. Cooperation with customers can facilitate product innovation as customers can reveal their preferences and unfulfilled needs to the focal firm [17,35]. The joint development of a new product could improve market share and product credibility, and potentially reduce risks associated with the commercialization of new products [12,14,15]. However, sometimes customers might not be aware of their preferences and even more so of their unmet needs. In this case, the first task that firms need to undertake is to discover customers’ preferences and needs [7,36]. In other words, firms need to transform customers’ tacit knowledge into explicit knowledge that can be utilized in developing new products or improving existing ones.
Accordingly, it is hypothesized:
H2A:
Collaboration with customers has a smaller positive impact on product innovation than collaboration with HEIs or suppliers but a larger positive impact on product innovation than collaboration with competitors.
Customers have been ranked fourth with regards to availability of knowledge relevant to process innovation and third with respect to accessibility of knowledge. Consequently, collaboration with customers should have the lowest impact compared to collaborations with the other three partners [10]. Cooperation with customers is least likely to foster process innovation, because customers have specific preferences and needs in relation to the design and functionality of a new product, but they have little, if any interest, in how a new product is produced [10]. Therefore, we formulate:
H2B:
Collaboration with customers has a smaller positive impact on process innovation than collaboration with HEIs, suppliers, or competitors.
2.3. Collaboration with Suppliers
Although suppliers are ranked last with regards to availability of knowledge relevant for product innovation, they are ranked second concerning the accessibility of knowledge. Accordingly, collaboration with suppliers should have a smaller impact on product innovation than HEIs, but a larger impact compared to customers and competitors [7]. Cooperating with suppliers will enable firms to access more limited new knowledge, as both the focal firm and its suppliers operate in the same or similar industries [15]. However, cooperation with suppliers is still beneficial to the focal firm as they have complementary capabilities and share common goals [7,17]. Still, cooperating with suppliers can be hampered by the Not-Invented-Here syndrome, as the employees in the focal firm might reject supplier’s technological knowledge because it was not developed in-house [36,37,38].
We therefore formulate the following:
H3A:
Collaboration with suppliers has a smaller positive impact on product innovation than collaboration with HEIs but a larger positive impact than collaboration with customers or competitors.
Suppliers have been ranked first both in terms of both availability and accessibility of knowledge associated with process innovation, which implies that they will have the highest influence compared to the other three collaboration partners [10]. Firms can easily access knowledge possessed by their suppliers, but the knowledge base is narrower than in the case of other cooperative partners because they operate in the same or similar industries. If suppliers deliver custom-made production factors, rather than standardized, then firms will prefer to limit their collaboration to few suppliers and foster a long-term relationship with them [10,37]. Collaboration with suppliers facilitates the introduction of process innovation in the focal firm in several ways. First, through a continuous and long-term collaboration, suppliers gain firm-specific knowledge about the production process in the focal firm. In turn, they can suggest improvements in the transportation, inventory management and the production process that will increase efficiency and productivity of the focal firm [10,35]. Second, as suppliers collaborate with a large number of firms in the same industry, they can inform the focal firm about the best practices in other firms, without revealing their identity. Third, a close relationship between the focal firm and its supplier facilities an easier exchange of both tacit and explicit knowledge.
Thus, we formulate:
H3B:
Collaboration with suppliers has a larger positive impact on process innovation than collaborations with HEIs, customers, and competitors.
2.4. Collaboration with Competitors
Competitors are ranked second regarding availability of knowledge relevant for product innovation, but they are ranked last in terms of accessibility. Although this results in a tie with customers, given that competitors provide the lowest accessibility to the focal firm, they are ranked fourth in terms of impact on product innovation [7]. In contrast to cooperating with universities, which entails the lowest, if any, market risk, the possibility of opportunistic behavior and knowledge leakage is highest when firms cooperate with their competitors [38,39]. These appropriation issues often result in knowledge exchange being limited to explicit knowledge, and thus excluding tacit knowledge exchange [36]. Empirical studies on R&D cooperation usually report the smallest number of firms cooperating with competitors (see, e.g., [14,15]) given that trust has been recognized as the necessary success factor for R&D cooperation [15,35,37,39,40,41,42]. However, although firms avoid collaborating with competitors, this type of collaboration is most frequently found in high-technology sectors, as firms in these sectors are continuous innovators, engaged in large and risky R&D investments. Thus, firms in high-technology sectors use cooperation with competitors as the cost and/or risk reduction strategy through economies of scale and rationalized R&D processes [12,14,15]. Another feature of cooperation with competitors is that they have a similar knowledge base as their competitors, which means that there is little scope for synergistic effects with regards to innovation activities in the focal firm [7]. Consequently, complementary effects are more likely to arise in the case when a competing firm possesses a more differentiated knowledge base.
Thus, the following hypothesis will be tested.
H4A:
Collaboration with competitors has a smaller positive impact on product innovation than collaboration with HEIs, customers, or suppliers.
Competitors are ranked second in relation to availability of knowledge relevant to process innovation and fourth with regards to accessibility. Accordingly, collaboration with competitors would have the third-highest impact (after suppliers and HEIs), followed by collaboration with customers [10]. Cooperation with competitors is limited due to potential opportunistic behavior, knowledge leakage, and problems with protecting intellectual property. Competitors are less likely to gain knowledge about the focal firm’s production process than product innovation, because they have very limited access to other firms’ manufacturing processes. In contrast, if a rival company wants to imitate a new product developed by other firms, it can analyze the product and use reverse engineering to develop a similar product [10].
Therefore, we hypothesize the following:
H4B:
Collaboration with competitors has a smaller positive impact on process innovation than collaborations with HEIs or suppliers, but a larger positive impact than collaborations with customers.
2.5. Persistence of Innovation
Theoretical arguments explaining the persistence of innovation are based on three distinct subdisciplines of economics [43,44,45,46]. First, the economics of knowledge from the evolutionary theory is associated with the knowledge creation through learning-by-doing and learning-to-learn effects. In this case, the persistence of innovation stems from the current or future use of knowledge created through the introduction of past innovations, that is, innovation in the past has an impact on the present innovation [46]. As a result, cumulative knowledge leads to a dynamic increasing returns and state dependence in innovative activities [45]. That is why this approach is termed the “dynamic scale economics” hypothesis [46]. Furthermore, the economics of organization suggest that knowledge creation and accumulation together with the creation of routines result in the creation of dynamic capabilities, which emphasizes an important role of continuous innovation in achieving competitive advantages [47]. However, it is important to distinguish between true or genuine state dependence and spurious state dependence. The former refers to the positive effect of past innovation on the introduction of current innovation. The latter occurs when unobserved effects or omitted variables are correlated over time, i.e., spurious state dependency might be reflected in time-invariant, unobserved firm characteristics [45]. Furthermore, [48] discusses two features of persistence: past and path dependence. The former reflects the initial effect of contingent factors that is constant over time, whereas the latter reflects the effect of contingent factors on the rate and direction of the innovation processes over time. Consequently, contingency is critical for path dependence, while initial conditions are the key factor in determining past dependence [46].
Second, the economics of organization recognizes the relevance of sunk costs incurred in the process of establishing a formal R&D department. Because of sunk costs, firms need to continuously invest in R&D activities. Consequently, sunk costs create barriers to entry and exit in relation to R&D activities [45]. Third, the economics of innovation or the new Schumpeterian approach [48] discusses the role of financial obstacles in funding R&D activities. Previous successfully introduced product or process innovations generate profit that is invested in current innovation activities. It also increases firms’ market power, and thus reduces financial obstacles that firms might encounter when investing in contemporaneous innovations. This hypothesis explaining the persistence in innovation is known as the “success breeds success” hypothesis.
Concerning the degree of persistence, previous empirical evidence suggests that process innovation tends to be less persistent than product innovation because product innovation plays the key role in the long-term competitiveness of many industries and markets [43,49,50]. In contrast, process innovation is introduced sporadically, as a result of major investments. In turn, the discontinuity of major investments leads to a lower degree of persistence of process innovation compared to product innovation.
3. Methodology
3.1. Data
We analyze the dataset from the Spanish Business Strategies Survey (SBSS). The survey has been conducted annually since 1990 and covers all manufacturing sectors in Spain following NACE-Rev.1 classification [51]. The data were gathered by the Public Enterprise Foundation and sponsored by the Spanish Ministry of Industry [10,51] (for more information, see https://www.fundacionsepi.es/). The survey gathers information on a wide range of firms’ activities and different measures of firms’ performance, including innovation-related activities and performance. Accordingly, a number of studies utilized the SBSS data to investigate research questions in relation to firms’ innovation activities [51,52].
The sample is representative of Spanish manufacturing firms, insofar as the sampling methodology is dependent on firm size [52,53]. Namely, a random stratified sampling is employed for firms with more than 10 and fewer than 200 employees, whereas all larger firms (more than 200 employees) are included in the survey. Those firms that exit the sample for various reasons are replaced by newly established firms, using the same sampling procedure as in the initial year (1990) [51,52].
Our sample is an unbalanced panel including 11,141 firm–year observations and covering the period from 2001 to 2011, of which 980 observations are about firms in high-technology sectors, 1989 observations are on firms in medium-high-technology sectors, 3241 observations are on firms in the medium-low-tech sector, and 4931 are low-technology firm observations. Non-R&D innovators, termed neglected or hidden innovators [53,54,55], account for almost half of innovating firms in Europe [53,55,56,57]. Therefore, our sample is not restricted to R&D performers (e.g., [54,58,59]), as several studies found that non-R&D-related firm activities also contribute to their innovation activities [51,54,55].
Table A1 in the Appendix A shows variable description and descriptive statistics. In the longitudinal sample of Spanish firms in 2001–2011, on average, slightly less than one-fifth of firms (19.1%) introduced product innovation, while less than one-third of firms (30.5%) engaged in process innovation. Looking at sectoral innovation activities, as expected, high-tech and medium-high-tech firms are more innovative than firms in medium-low- and low-tech sectors. For instance, 34.5% of high-tech firms introduced product innovation relative to 16.2% of low-tech firms. Similarly, 42.1% of high-tech firms engaged in process innovation compared to 26.7% of low-tech firms.
Concerning cooperative relationships, the largest number of firms cooperated with HEIs and/or technological parks (22.5%), followed by firms cooperating with suppliers (20.3%) and with customers (17.6%). The smallest number of firms cooperated with competitors (2.5%). As noted in [13], one of the objectives of innovation policy in Spain during the last decade is to encourage closer interaction between firms and universities and other public institutions. This is reflected in our data, as more than one-fifth of total firms collaborate with universities and technological parks. Looking at the sectoral cooperative activities, the number of firms cooperating with a certain type of a partner increases as technological intensity of the industry increases. For example, 40.1% of high-tech firms report to cooperate with their customers, while only 7.4% of low-tech firms cooperate with this type of partner. While almost half of high-tech firms (49.4%) cooperate with HEIs, the proportion is three times lower for low-tech firms (14.2%).
Regarding absorptive capacity, firms on average invest 0.9% of their sales in R&D (in-house and external) activities. One-fifth of firms have a separate R&D department (21.3%), while the modal firm employees two R&D personnel. As expected, firms in high-tech and medium-high-tech industries have a higher absorptive capacity than firms in medium-low- and low-tech industries. While high-tech firms invest 2.4% of their sales in R&D, low-tech firms invest only 0.3%. More than a half high-tech firms (53.8%) have a separate R&D department, while this share is only 13.3% for low-tech firms. High-tech firms employ on average five R&D staff, whereas low-tech firms employ only one R&D staff.
In relation to non-R&D activities, 16.8% of firms conducted a market research and marketing activities in fostering the commercialization phase of a new product, while 28.2% of firms have undertaken design activities. The market share of the modal firm is 9.40%, while 35.2% of firms belong to an enterprise group. On average, firms export one-fifth of their sales (19.6%). A modal firm has 66 employees, while the average firm age is 30 years. Finally, Table A2 and Table A3 show the correlation matrix, whereby no pairwise correlations are higher than 0.7, thus suggesting no potential multicollinearity problems [31].
3.2. Model Specification
Following [60], product innovation encompasses the introduction of new or significantly improved goods or services [7], whereas process innovation includes introduction of new machinery, new methods of organizing production and new software related to industrial processes. Product innovation aims for novelty and tends to be more radical, whereas process innovation aims for efficiency and tends to be more incremental [10]. Thus, the two dependent variables are binary indicators equal to 1 if a firm introduced a certain type of innovation in period t and zero otherwise. The variable Product innovation captures product innovation, while the variable Process innovation measures firms’ engagement in process innovation.
All regressors (independent variables of interest and control variables) are lagged one period to take into account that the impact of firms’ internal and external factors on innovation is not instantaneous, but rather occurs with a time lag [10]. The variables of interests are binary indicators for cooperation with four types of partners. The variable Cooperation with customerst–1 is equal to 1 if a firm cooperation for innovation with customers in period t–1, and zero otherwise. The variable Cooperation with supplierst–1 is equal to 1 if a firm cooperated with suppliers in period t–1, and zero otherwise. The variable Cooperation with competitorst–1 is equal to 1 if a firm cooperated with competitors in period t–1, and zero otherwise. Finally, the variable Cooperation with HEIst–1 is equal to 1 if a firm cooperated with universities and/or technological canters in period t–1, and zero otherwise.
The control variables include a range of variables capturing firm and market characteristics. The variable Market researcht–1 is a dummy variable (DV) equal to 1 if a contracted market research and marketing for the commercialization of new products in period t–1 and zero otherwise [54,58]. The variable Designt–1 is equal to 1 if a firm conducted design activities in period t–1, and zero otherwise [51,52,53,54,55,58]. These two variables were included to control for non-R&D activities that could lead to innovation. Firms in low- and medium-technology sectors often innovate without R&D, focusing on adaption and learning by doing through design and process improvements [61]. This is particularly relevant in the Spanish context, where the manufacturing sector is characterized by a large number of firms operating in traditional low-technology sectors and of small and medium-sized firms [54]. In addition, firms can innovate without R&D by combining existing knowledge in new ways, utilizing industrial design and engineering activities [61].
R&D activities are particularly relevant determinants of technological innovation and of absorptive capacity [32,61]. Concerning types of innovation, product innovation usually requires a certain degree of R&D activities [61], while process innovation is more affected by non-R&D activities [62,63] and by collaboration with suppliers [61,63]. To operationalize absorptive capacity, we include more than one indicator, as suggested by previous studies [54,55]. Accordingly, we model three variables as a proxy for absorptive capacity. The first is variable Total R&Dt–1, which measures R&D intensity as a ratio of total (internal and external) R&D expenditures to sales in period t–1 [10,54,64,65]. The second variable is the number of R&D personnel in period t–1 in natural logarithm (variable R&D stafft–1). The third variable is a dummy variable equal to 1 if a firm has technological or R&D department or committee in period t–1, and zero otherwise (variable R&D department–1) [54]. In accounting for the market power of firms, we model their market share (variable Market sharet–1) as the weighted sum of a firm’s market shares in markets in which the firm sells its products in period t–1 [66,67]. This variable is included to test the hypothesis advanced by [68] known as Mark II or the classical Schumpeterian hypothesis [69]. According to this hypothesis, large firms, due to their market power, are more likely to innovate than small firms. “With their accumulated stock of knowledge in specific technological areas, their advanced competence in large scale R&D projects, production and distribution and their relevant financial resources, they create barriers to entry to new entrepreneurs and small firms” [69] (p. 47). We also control for firms’ belonging to an enterprise group in period t–1 (variable Groupt–1) [54,59]. It is assumed that innovation activities of individual firms that belong to a group can benefit from the opportunities arising from organizational synergies within the group. Moreover, firms belonging to a group might have an easier access to external funding [66]. Firms’ international activities are captured by the variable Export intensityt–1, as the ratio of exports to sale in period t–1 [32,58,64].
Firm size is proxied by the number of employees in period t–1 (in natural logarithm, variable Firm sizet–1) [10,32,54]. To account for firms’ experience and learning, we model firm age in period t–1 (in natural logarithm, variable Firm aget–1) [51,64]. Finally, industry heterogeneity is modelled by the inclusion of dummy variables for 19 sectors (see Table A1 for the list of sectors).
3.3. Empirical Method
Our estimation strategy encompasses a dynamic panel analysis, which, besides controlling for unobserved heterogeneity and potential reverse causality [70], allows modelling the persistence of innovation [43]. More specifically, a dynamic specification accounts for state dependence process of the dependent variable, modelled as a t–1 lag. The t–1 lagged value of the dependent variable can be interpreted as true or genuine state dependence, that is, as the causal effect of product and process innovations in one period on their propensity in the subsequent period.
Specifically, we employ a dynamic random effects probit model with unobserved heterogeneity. We assume that companies can be characterized by a latent product or process innovation propensity (). Formally,
In Equation (1), the latent outcome variable captures the probabilities of introducing product or process innovation in a firm i (i = 1,…,N) in period t (t = 2001,…,2011) as a function of the set of time-varying lagged explanatory variables Zit-1 that are considered strictly exogenous, conditional on the unit-specific unobserved effect ci, while uit is an idiosyncratic error term [70]. The coefficient captures the degree of true or genuine state dependence of product or process innovation. That it, measures the extent to which engaging in product or process innovation in period t–1 increases or decreases the likelihood of current product or process innovation in period t. Furthermore, we assume 0), that is, binary indicator functions that are equal to 1 if the latent propensity is positive and 0 otherwise.
Following [44], both unobserved effects and initial conditions should be controlled when exploring the persistence of innovation. Unobserved firm heterogeneity is associated with the entrepreneurial attitude toward risk, managerial abilities and other firm-specific (idiosyncratic) characteristics. If both unobserved heterogeneity and initial conditions are not modeled, spurious persistence could be misinterpreted as true dependence or persistence. Spurious state dependence arises when unobserved effects are correlated over time. In this case, initial conditions have to be estimated [46]. Initial condition problem arises when the initial outcome of the dependent variable does not coincide with the beginning of the process under investigation. In that case, initial observation is endogenous, i.e., correlated to the error term, which results in biased estimates of the autoregressive parameter [48]. There are two approaches to dealing with the initial condition problem. The first was proposed by [71], wherein the distribution of the initial condition (value) is conditional on unobserved effect and observed exogenous variables, while [72] suggests an alternative Conditional Maximum Likelihood estimator in which the distribution of unobserved effect is conditional on the initial condition and exogenous variables. Therefore, this estimator assumes the exogeneity of the initial conditions [70].
As in most studies that use longitudinal data, our panel is also affected by the initial condition problem. Namely, we do not have information on the companies since their creation, but only for a limited period of time. Firms could have introduced product and process innovations prior to our sample period. In order to account for the problem of initial conditions, we follow the proposal by [72] presented in Equation (2):
The unobserved specific effects are estimated conditional on the dependent variable in the initial period (), the initial values of all time-varying covariates (Zi0) and the within-firm averages of the explanatory variables where the averages are based on all periods t = 2001,…,2011. is a firm-specific time-constant error term, normally distributed with mean 0 and variance [70].
4. Empirical Results
Table 1 and Table 2 show the results from dynamic random-effects probit models in which the dependent variables are Product innovation and Process innovation, respectively. Besides analyzing the full sample, we divided firms into four industry categories based on the technological intensity of industries: high-technology industries, medium-high-technology industries, medium-low-technology industries and low-technology industries. This sectoral analysis will enable us to examine whether cooperation with various partners exerts a differentiated effect depending on the type of industries in which firms operate.

Table 1.
Estimation results from dynamic random-effects probit models. The dependent variable is Product innovation.
Table 2.
Estimation results from dynamic random-effects probit models. The dependent variable is Process innovation.
To quantitatively interpret the impact of cooperative partners and the magnitude of persistence of product and process innovations, we estimate the average partial effects in Table 3 and Table 4 below. Looking at Table 3, the largest effect on the propensity to product innovation has the introduction of past product innovation, which represents true or genuine state dependence. This largest partial effect is found in the full sample, as well as in subsamples of industries. For instance, in the full sample, the likelihood of contemporaneous product innovation increases by 25.3% if a firm introduced product innovation in the previous period. Concerning sectoral analysis, the largest persistence, unsurprisingly, is found in high-technology industries. Namely, firms in high-technology sectors are 37.8% more likely to introduce contemporaneous product innovation if they introduced product innovation in the previous period. Even the smallest partial effect for firms in medium-high-tech industries of 19.8% is large enough to be economically substantial (i.e., neither too large to be implausible nor too small to be of no policy interest).
Table 3.
Average partial effects for the model in which the dependent variable is Product innovation.
Table 4.
Average partial effects for the model in which the dependent variable is Process innovation.
Regarding the average partial effects for process innovation showed in Table 4, the largest effect on the propensity to process innovation has the previous process innovation. This implies that for both types of technological innovation, true state dependence is the key factor affecting the propensity to innovate. In the full sample of manufacturing firms, the propensity to introduce process innovation in the current period is 32.6% if a firm introduced process innovation in the previous period. Looking at the results by sectors, similar to product innovation, the largest true dependence is found for firms in high-technology industries. The probability of process innovation increases by 45.6% if high-tech firms introduced new processes in the previous period. The smallest effect of 28% is reported for low-technology industries. This result implies that even firms that have the lowest technology intensity are almost one-third more likely to innovate in the current period as a result of process innovation in the previous period.
Next we focus on interpreting the average partial effects of cooperation with different partners. With respect to cooperation with suppliers, its impact on product innovation in more technology-intensive industries is positive and statistically significant. Namely, firms in high-tech industries that cooperate with suppliers are 9.5% (p < 0.01) more likely to introduce product innovation than those firms that do not cooperate, while this propensity is 5.6% (p < 0.05) for firms in medium-high-tech industries. For process innovation, its propensity increases by 6.7% (p < 0.05) in high-tech firms that cooperate with suppliers.
Regarding cooperation with competitors, we found a marginally significant (p < 0.10) and positive effect of this type of partnership on product innovation in medium-low-tech firms and on process innovation in high-tech firms (p < 0.10).
Cooperation with HEIs has positive, but rather small, effects on technological innovations in firms operating in sectors characterized by a lower technology intensity. Concerning product innovation, medium-low-tech firms are 2.8% more likely to engage in this type of innovation (p < 0.05) than firms in the same sectors that do not cooperate with HEIs. A similar effect with respect to the magnitude is found in low-tech firms, although only marginally significant (p < 0.10). The magnitude of the effects is slightly higher in the case of process innovation. Cooperating with HEIs increases the likelihood of process innovation in medium-low-tech industries by 3.4% (although only marginally, p < 0.10) and in low-tech firms by 4.6% (p < 0.01).
Next we focus on the estimated impact of control variables. Regarding absorptive capacity, we found a mixed impact on both types of technological innovations. R&D intensity has no impact on both product and process innovations and even has a negative effect on process innovation in firms in low-tech industries. Having an R&D department marginally increases the probability of introducing product innovation in high-tech firms (p < 0.10), but the impact on process innovation is much stronger (p < 0.01) and larger. R&D staff has a marginally (p < 0.10) negative effect on process innovation in high-tech firms.
Interesting results are found for non-R&D activities. Namely, we found a positive and significant impact of market research on product innovation in medium-low-tech firms, whereas design increases the likelihood of product innovation in both medium-high-tech and medium-low-tech industries and on process innovation in low-tech industries. The impact of market share on both product and process innovations is not statistically significant in any industry. Thus, there is sufficient evidence to reject the classical Schumpeterian hypothesis Mark II that firms with market power are more likely to innovate.
Belonging to an enterprise group has a differential effect on product innovation. While for high-tech firms belonging to a group negatively affects the propensity to innovate (p < 0.05), the impact is positive for low-tech firms (p < 0.05). These results are repeated for process innovation, except that we found no effect in low-tech firms. Exporting firms in medium-high-tech industries have a higher likelihood of undertaking product innovation than non-exporting firms belonging to the same type of industries. However, the effect of export on process innovation is not significant in any type of industries. Regarding the effect of firm size, the results suggest no differences in the propensity to introduce product innovation between large and small firms. We do find a significant effect (p < 0.01) in the case of process innovation in low-tech firms. Namely, large firms in low-tech industries are more likely to introduce process innovation than their smaller counterparts. Finally, firm age has a negative and significant impact on process innovation in low-tech firms. Thus, younger, low-tech firms are more prone to undertaking this type of innovation than their older counterparts.
Table 5 summarizes empirical findings in relation to each hypothesis, which will be discussed in the following section.
Table 5.
Summary of decisions on hypotheses.
5. Discussion
This study investigates the impact of cooperation with different partners on technological, product and process, innovations in Spanish manufacturing firms. Moreover, the study examines how state dependence, unobserved heterogeneity, and observed heterogeneity jointly affect innovation performance. The literature suggests several reasons for the persistence in innovation performance and thus, it is necessary to model state dependence after controlling for unobserved heterogeneity across firms. For this purpose, a dynamic random effects probit model that solves the initial conditions problem using the Wooldridge solution is estimated. A random effects specification explicitly introduces unobserved individual heterogeneity into the dynamic model by specifying random effects.
The empirical results for both product and process innovations indicate the presence of significant dynamics of genuine state dependence and unobserved heterogeneity across firms. Concerning genuine state dependence, the effects are not only highly statistically significant, but also rather large in magnitude. On average, in the full sample, firms that introduced product innovation in the previous period are 25.3% more likely to innovate again in the current period. Looking at the sectoral results, the largest persistence is found in high-technology industries, followed by medium-low- and low-technology industries, while the smallest effect is found in medium-high-tech industries. The magnitude of genuine state dependence is even higher for process innovation. Namely, previous engagement in process innovation increase the likelihood of current propensity to process innovation by 32.6% in the full sample. Concerning sectoral analysis, the largest effect is estimated for high-technology industries and the smallest for low-technology industries.
However, we also found significant effects of unobserved heterogeneity captured by the initial condition and the within-unit averages of time-varying independent variables. Here we found a statistically significant (p < 0.01) and substantial positive effect of the initial condition of product innovation in the full sample, as well as in each industry category. In addition, the initial conditions for R&D staff are negative and significant in low-technology industries, while initial firm size has a marginally (p < 0.10) negative effect in medium-low-tech firms. For process innovation, we found a statistically significant (p < 0.01) and substantial positive effect of the initial condition of process innovation in the full sample, as well as in each industry category. Another significant initial condition is found for firm size, suggesting that the propensity to process innovation is negatively affected by initial firm size. This result holds for each industry category. The evidence of unobserved heterogeneity indicates that those characteristics that are correlated with unobserved variables are associated with innovation performance, that is, firms are characterized by time-constant unobserved variables that affect their propensity to innovate. Quantitatively, approximately 21% for product innovation and 10% for process innovation of the latent error variance is attributable to unobserved heterogeneity, as measured by the intra-unit correlation coefficient (ICC), .
Focusing on our formulated hypotheses regarding cooperation for innovation, we find no evidence to support our hypotheses, with one exception (H1a in low-tech firms). Our results also reveal that firms exert no benefits from a portfolio approach to cooperation [34]. Namely, we find distinct patterns of individual effects of different cooperative partners. Regarding product innovation, firms in the full sample are positively affected by cooperate with suppliers (p < 0.01) and with HEIs (p < 0.05) and the impact of suppliers is larger than the impact of HEIs, as the average partial effects are 0.034 and 0.019, respectively. However, sectoral analysis has revealed that firms in high-tech and medium-high-tech industries benefit solely by cooperating with suppliers, while firms at a low level of technology intensity (medium-low- and low-tech industries) benefit solely from cooperating with HEIs. Therefore, although a larger number of firms at a higher technology level engage in any type of cooperation than firms at a lower technology level (see Table A1 with descriptive statistics), they only seem to benefit from cooperation with suppliers.
Looking at the average partial effects of cooperation on process innovation, quantitatively we found the same pattern as for product innovation, although the magnitude of impact is the same for cooperation with HEIs as for cooperation with suppliers. Namely, in the full sample, our results indicate that the propensity to process innovation increases by 3.6% and 3.7% from cooperation with suppliers and HEIs, respectively. These magnitudes are statistically the same, as their 95% significance intervals overlap. Focusing on sectoral analysis, high-tech firms benefit the most from cooperation with suppliers and marginally from competitors, while medium-high-tech firms seem to obtain no benefits from cooperation. Finally, cooperating with HEIs increases the propensity to process innovation in medium-low-tech industries (although only marginally, p < 0.10) and in low-tech industries (p < 0.01).
In summing up, similar to [10], we found that upstream collaboration with suppliers and HEIs has significantly higher impact on product and process innovation than downstream collaboration with customers and competitors. Therefore, accessibility rather than availability of knowledge matters the most for technological innovations. The summary of main results is presented in Figure 3 for high-tech firms, Figure 4 for medium-high-tech firms, in Figure 5 for medium-low-tech firms and in Figure 6 for low-tech firms.
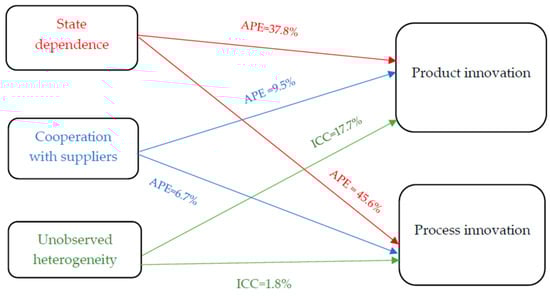
Figure 3.
Summary of results for high-tech firms.
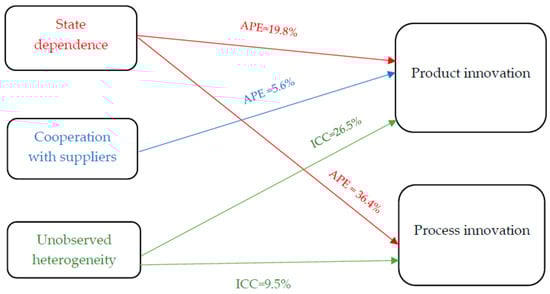
Figure 4.
Summary of results for medium-high-tech firms.
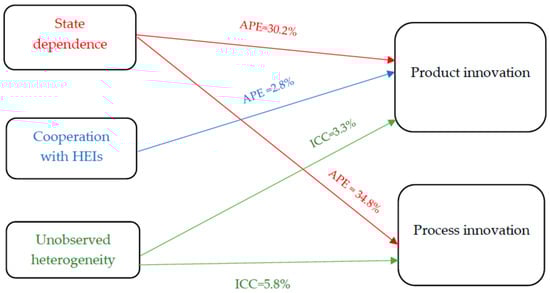
Figure 5.
Summary of results for medium-low-tech firms.
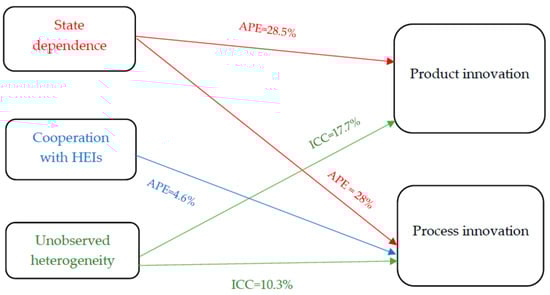
Figure 6.
Summary of results for low-tech firms.
Although firms in our sample cooperate with all four partners, as can be seen in Table A1 with descriptive statistics, empirical findings suggest that a single type of partner positively contributes to the technological aspects of firms’ innovation performance. This finding could point out to a low degree of transformation capability in Spanish firms. Namely, absorptive capacity has four dimensions [73], including transformation capability, which refers to the integration of newly acquired knowledge from external sources into the firm’s internal knowledge base [74]. In relation to our study, the lack of evidence on the benefits of a portfolio approach to cooperation could suggest that Spanish firms do not possess enough transformation capability to integrate acquired external knowledge from various partners. According to Forés and Camisón [74], accumulating knowledge, whether from internal or external sources, is a necessary but not sufficient condition for firms’ survival, because if firms do not convert that new knowledge into technological and/or non-technological innovations, “superior rents will not be obtained” [74] (p. 833]. Given the path-dependent nature of absorptive capacity [18,74], Spanish firms might be “locked in” at a permanently low degree of transformation capability.
Another potential explanation for the lack of benefits of the portfolio approach to innovation found in the study could be that the cooperation depth is not sufficient to exert a positive innovation effect. Namely, while we are able to investigate the impact of cooperation breadth reflected in cooperation with various partners, we are unable to control for cooperation depth. This refers to the intensity of cooperation with various partners [38]. It could be that firms are willing to cooperate with various partners but find it difficult to establish and maintain intensive cooperative relationships due to the lack of trust and the risk of knowledge leakage. According to Ritala et al. [75], knowledge leakage can be particularly harmful in the process of the development of product and process innovations, prior to their commercialization. In this stage of the innovation process, firms cannot use any formal mechanisms of protection, such as patents and trademarks, and must resort to secrecy and speed to market to minimize the risk of knowledge leakage and opportunistic behavior of a cooperative partner [49,76]. Therefore, although the literature emphasizes a positive impact of a strategic and intensive cooperation on innovation performance [77], Spanish firms might be struggling to establish and maintain trustful relations with cooperative partners and overcome the fear of knowledge leakage.
Finally, the “attention-based” view of the firm [78] recognizes that management attention is a key but finite resource for firms. In the case of cooperation, the “attention allocation problem” would arise because cooperation with different partners is demanding on management attention and thus entails an opportunity cost with respect to other innovation activities. Once a firm reaches a certain number of collaborative partners, managers do not have enough time and effort to dedicate to additional collaborative partners [14]. If this argument holds in practice, it would mean that Spanish firms, especially those with limited management resources, should focus on fewer cooperative partnerships, rather than spreading their resources thinly and thus underutilizing external knowledge.
6. Conclusions
Based on the accessibility and availability of knowledge, the study investigates how cooperative ties with customers, suppliers, competitors and HEIs influence product and process innovations in Spanish manufacturing firms. Empirical results from the dynamic probit models reveal positive and significant effects of cooperation with suppliers and HEIs on both types of innovations. Greco et al. [79], in their review of empirical evidence on the impact of inbound, outbound, and coupled open innovation practices on firms’ innovation performance, concluded that supplier-based and research-institution-based coupled practices (i.e., collaborative ties) uniformly had positive innovation effects in previous empirical studies. Our results from the full sample are consistent with this conclusion.
Furthermore, we extended the analysis by dividing all manufacturing sectors into four categories depending on their degree of technological intensity. Empirical findings from sectoral analysis indicate that cooperation with suppliers positively and significantly increases the propensity to technological innovations in high-technology and medium-high-tech industries, while cooperation with universities has a positive effect on technological innovations in medium-low- and low-technology firms. Therefore, looking at the findings from sectoral analysis, we can conclude that, although firms cooperate with all four cooperative partners, only one type has a positive influence on the propensity to technological innovations. These results have direct policy implications. Policy makers should avoid adopting the “one size fits all policy,” but rather focus on encouraging collaboration between universities and firms operating in low-technology industries.
Concerning the lack of findings on the impact of cooperation with customers on innovation performance, this could be explained by the fact that firms, when cooperating with customers, focus on the commercialization of new products [36]. That would mean that the impact on the technological aspects of innovation, i.e., the introduction of product and process innovations, is unaffected by customer involvement, as our findings suggest. However, we do not have a measure of the market success (that is, innovative sales) available in our dataset, so future research on Spanish manufacturing firms could test this proposition.
Regarding the dimensions of knowledge relevant for product and process innovations, overall findings indicate that accessibility, rather than availability, increases the likelihood of firms’ engagement in technological innovations, in particular product innovation. This finding is consistent with [7] for product innovation and [10] for process innovation. Both studies used the same survey of the Spanish firms as in our study but cover 1998–2002. In this respect, our study can be regarded as a follow-up study to [7,10], while taking into account the persistence of product and process innovations.
Another important finding from the empirical analysis is the magnitude of genuine state dependence in product and process innovations. To distinguish between true and spurious state dependence is of considerable interest for policy makers. For example, if there exists true state dependence in technological innovations, then short-term innovation policies tend to improve firms’ innovation activities in the long term. On the other hand, if unobserved heterogeneity is correlated over time and not properly controlled for, then the past innovation activity may appear to be a determinant of future innovation performance, solely because it is a proxy for such temporally persistent unmeasured variables. In this case, short-term innovation policies have no effect on the longer-term innovation performance. Our empirical evidence implies a large degree of true or genuine state dependence, thus short-term innovation policies should have a large impact on innovation performance in firms that are already innovating.
Regarding theoretical contributions, our study contributes to the innovation management literature in two important ways. First, this study finds that Spanish firms do not benefit from a portfolio approach to cooperation [34]. Namely, although firms cooperate to a varying degree with customers, suppliers, competitors and universities, only cooperating with a single type of partner increases firm innovation performance measured through the technological aspects of the innovation process. Specifically, cooperating with suppliers fosters technological innovations in firms operating in industries at a higher level of technological intensity, while cooperating with universities enhances innovation performance of firms operating in industries at a lower level of technological intensity. We offer several potential explanations for the lack of the positive effects of cooperating with a broad network of partners.
Second, our study empirically contributes to the longstanding discussion on the impact of cooperation on innovation performance. Although the potential benefits and costs of cooperating with individual partners are well established in the innovation management literature, little empirical research combines insights from two streams of research—on the impact of cooperation on innovation and on the persistence of innovation. By estimating dynamic models, we account for two prominent features of innovation activities: their persistence and the impact of unobserved heterogeneity. Few previous empirical studies explore the effectiveness of cooperation for innovation in a dynamic context that encompasses unobserved firm heterogeneity and accounts for initial conditions.
The influence of cooperation on innovation performance is a relevant topic not only in innovation research but also in industry practice. Our study has important managerial implications. First, managers in Spanish firms, especially those responsible for establishing and maintaining cooperative relations, should be aware that cooperating with a broad range of different partners is not necessarily beneficial to their firm’s innovation performance. They should identify potential issues that prevent their companies to fully reap the benefits of cooperation in the form of technological innovations. Potential issues that could cause limited benefits from cooperation are a low degree of transformation capability in Spanish companies and the risk of opportunistic behavior and knowledge leakage. If managers are able to uncover the causes of sub-optimal effects of cooperation, it will have a far-reaching positive influence on innovation performance. Moreover, policy makers, besides continuing to support cooperation with public institutions, in particular with universities, should investigate why Spanish firms struggle to transform external knowledge into superior innovation performance and could potentially design novel policy instruments or modify existing ones to address this issue.
Second, our study shows that the largest positive effect on innovation performance has true or genuine state dependence. Therefore, if firms are currently locked in at a low degree of transformation capability, resolving this issue in the future can have a multiplying effect on innovation performance not only through the increase of cooperation effects but also through enhancing firms’ absorptive capacity. The latter is characterized by a path-dependent nature, which suggests that enhancing absorptive capacity has long-term strategic consequences. Finally, managers should be aware of negative consequences of the “attention allocation problem” and consider whether they have enough time and whether they put enough effort into maintaining existing cooperative relations and absorbing the optimal level of external knowledge. If not, then they could use strategic foresight to consider various scenarios [80] that might improve innovation performance, such as reducing the number of partners or delegating managerial responsibilities so that existing relations can be maintained, and new ones established.
Notwithstanding the contributions of the study, it suffers from limitations that can offer avenues for further research. First, a similar model could be estimated for small and large firms separately. In this way, we could compare how various cooperative relationships affect innovation activities in different firm size categories. Second, our study investigates the impact of cooperation with external organizations on technological innovations in Spain. Estimating the model for other countries would provide the basis for a comparison with our findings. Finally, the findings from this study are limited to manufacturing firms. It would be interesting to examine a cooperation-innovation relationship in the service sector and identify similarities and differences between the manufacturing and service sector [7,81].
Author Contributions
Conceptualization, D.R. and J.P.; methodology, D.R.; software, D.R.; formal analysis, D.R.; writing—original draft preparation, D.R. and J.P.; writing—review and editing, D.R.
Funding
This research received no external funding.
Conflicts of Interest
The authors declare no conflict of interest.
Appendix A
Table A1.
Variable description and summary statistics.
Table A1.
Variable description and summary statistics.
| Variable Name | Variable Description | Full Sample | High-Technology Industries | Medium-High-Technology Industries | Medium-Low-Technology Industries | Low-Technology Industries |
|---|---|---|---|---|---|---|
| Mean (Standard Deviation) | Mean (Standard Deviation) | Mean (Standard Deviation) | Mean (Standard Deviation) | Mean (Standard Deviation) | ||
| Product innovation | DV = 1 if a firm introduced product innovation in period t; zero otherwise | 0.191 (0.393) | 0.345 (0.476) | 0.285 (0.452) | 0.131 (0.337) | 0.162 (0.369) |
| Process innovation | DV = 1 if a firm introduced process innovation in period t; zero otherwise | 0.305 (0.460) | 0.421 (0.494) | 0.383 (0.486) | 0.277 (0.448) | 0.267 (0.443) |
| Cooperation with customerst-1 | DV = 1 if a firm cooperated with customers in period t–1; zero otherwise | 0.176 (0.381) | 0.401 (0.490) | 0.336 (0.472) | 0.161 (0.368) | 0.074 (0.262) |
| Cooperation with supplierst-1 | DV = 1 if a firm cooperated with suppliers in period t–1; zero otherwise | 0.203 (0.402) | 0.380 (0.486) | 0.369 (0.483) | 0.162 (0.368) | 0.127 (0.333) |
| Cooperation with competitorst-1 | DV = 1 if a firm cooperated with competitors in period t–1; zero otherwise | 0.025 (0.157) | 0.073 (0.261) | 0.050 (0.218) | 0.017 (0.128) | 0.013 (0.114) |
| Cooperation with HEIst-1 | DV = 1 if a firm cooperated with HEIs and/or technological parks in period t–1; zero otherwise | 0.225 (0.417) | 0.494 (0.500) | 0.363 (0.481) | 0.190 (0.392) | 0.142 (0.349) |
| Market researcht-1 | DV = 1 if a firm carried out or contracted market studies and marketing for the commercialization of new products in period t–1; zero otherwise | 0.168 (0.372) | 0.343 (0.475) | 0.173 (0.379) | 0.121 (0.326) | 0.158 (0.365) |
| Designt-1 | DV = 1 if a firm has undertaken design activities in period t–1; zero otherwise | 0.282 (0.450) | 0.323 (0.468) | 0.395 (0.489) | 0.207 (0.405) | 0.264 (0.441) |
| TotalR&Dt-1 | R&D intensity equal to total (internal and external) R&D expenditures in period t–1 divided by sales in period t–1 | 0.009 (0.108) | 0.024 (0.040) | 0.023 (0.283) | 0.005 (0.014) | 0.003 (0.014) |
| Market sharet-1 | Weighted sum of a firm’s market shares in markets in which it sells its products in period t–1 | 9.396 (17.374) | 10.952 (16.504) | 12.064 (19.475) | 9.667 (17.577) | 7.843 (16.055) |
| R&D stafft-1 | Number of R&D personnel (in natural logarithm) in period t–1 | 0.582 (1.117) | 1.630 (1.641) | 1.112 (1.496) | 0.412 (0.868) | 0.290 (0.723) |
| Groupt-1 | DV = 1 if a firm belongs to an enterprise group in period t–1; zero otherwise | 0.352 (0.478) | 0.566 (0.496) | 0.489 (0.500) | 0.350 (0.477) | 0.253 (0.435) |
| R&D departmentt-1 | DV = 1 if a firm has technological or R&D department or committee in period t–1; zero otherwise | 0.213 (0.409) | 0.538 (0.499) | 0.333 (0.472) | 0.166 (0.372) | 0.133 (0.340) |
| Export intensityt-1 | The ratio of exports to sales in period t–1 | 0.196 (0.270) | 0.286 (0.289) | 0.341 (0.313) | 0.189 (0.273) | 0.125 (0.211) |
| Firm sizet-1 | Number of employees in period t–1 (in natural logarithm) | 4.182 (1.453) | 4.774 (1.429) | 4.732 (1.549) | 4.103 (1.427) | 3.893 (1.383) |
| Firm aget-1 | Firm age in period t–1 (in natural logarithm) | 3.414 (0.515) | 3.565 (0.533) | 3.452 (0.522) | 3.379 (0.493) | 3.420 (0.507) |
| Meat products | DV = 1 if a firm operates in sector “Meat products”; zero otherwise | 0.032 (0.176) | 0.073 (0.261) | |||
| Food and tobacco | DV = 1 if a firm operates in sector “Food and tobacco”; zero otherwise | 0.094 (0.293) | 0.215 (0.411) | |||
| Beverage | DV = 1 if a firm operates in sector “Beverage”; zero otherwise | 0.020 (0.139) | 0.045 (0.206) | |||
| Textiles and clothing | DV = 1 if a firm operates in sector “Textiles and clothing”; zero otherwise”; zero otherwise | 0.072 (0.258) | 0.161 (0.367) | |||
| Leather, fur and footwear | DV = 1 if a firm operates in sector “Leather, fur and footwear”; zero otherwise | 0.026 (0.158) | 0.057 (0.233) | |||
| Timber | DV = 1 if a firm operates in sector “Timber”; zero otherwise | 0.038 (0.191) | 0.086 (0.280) | |||
| Paper | DV = 1 if a firm operates in sector “Paper”; zero otherwise | 0.037 (0.188) | 0.085 (0.279) | |||
| Printing | DV = 1 if a firm operates in sector “Printing”; zero otherwise | 0.048 (0.214) | 0.108 (0.311) | |||
| Chemicals and pharmaceuticals | DV = 1 if a firm operates in sector “Chemicals and pharmaceuticals”; zero otherwise | 0.067 (0.250) | 0.772 (0.419) | |||
| Plastic and rubber products | DV = 1 if a firm operates in sector “Plastic and rubber products”; zero otherwise | 0.053 (0.225) | 0.184 (0.388) | |||
| Nonmetal mineral products | DV = 1 if a firm operates in sector “Nonmetal mineral products”; zero otherwise | 0.076 (0.265) | 0.260 (0.439) | |||
| Basic metal products | DV = 1 if a firm operates in sector “Basic metal products”; zero otherwise | 0.034 (0.180) | 0.116 (0.320) | |||
| Fabricated metal products | DV = 1 if a firm operates in sector “Fabricated metal products”; zero otherwise | 0.129 (0.335) | 0.440 (0.496) | |||
| Machinery and equipment | DV = 1 if a firm operates in sector “Machinery and equipment”; zero otherwise | 0.060 (0.238) | 0.332 (0.471) | |||
| Computer products, electronics and optical | DV = 1 if a firm operates in sector “Computer products, electronics and optical”; zero otherwise | 0.020 (0.142) | 0.228 (0.419) | |||
| Electric materials and accessories | DV = 1 if a firm operates in sector “Electric materials and accessories”; zero otherwise | 0.044 (0.204) | 0.242 (0.429) | |||
| Vehicles and accessories | DV = 1 if a firm operates in sector “Vehicles and accessories”; zero otherwise | 0.052 (0.223) | 0.304 (0.460) | |||
| Other transport equipment | DV = 1 if a firm operates in sector “Other transport equipment”; zero otherwise | 0.022 (0.148) | 0.122 (0.328) | |||
| Furniture | DV = 1 if a firm operates in sector “Furniture”; zero otherwise | 0.053 (0.224) | 0.121 (0.325) | |||
| Other manufacturing | DV = 1 if a firm operates in sector “Other manufacturing”; zero otherwise | 0.023 (0.150) | 0.049 (0.217) |
Table A2.
Correlation matrix in the full sample.
Table A2.
Correlation matrix in the full sample.
| 1. | 2. | 3. | 4. | 5. | 6. | 7. | 8. | 9. | 10. | |
|---|---|---|---|---|---|---|---|---|---|---|
| 1. Cooperation with customerst-1 | 1.000 | |||||||||
| 2. Cooperation with supplierst-1 | 0.680 *** | 1.000 | ||||||||
| 3. Cooperation with competitorst-1 | 0.480 *** | 0.491 *** | 1.000 | |||||||
| 4. Cooperation with HEIst-1 | 0.253 *** | 0.255 *** | 0.251 *** | 1.000 | ||||||
| 5. Market researcht-1 | 0.221 *** | 0.300 *** | 0.279 *** | 0.101 *** | 1.000 | |||||
| 6. Designt-1 | 0.220 *** | 0.288 *** | 0.230 *** | 0.120 *** | 0.362 *** | 1.000 | ||||
| 7. Total R&Dt-1 | 0.092 *** | 0.090 *** | 0.064 *** | 0.039 *** | 0.033 *** | 0.060 *** | 1.000 | |||
| 8. Market sharet-1 | 0.126 *** | 0.154 *** | 0.162 *** | 0.021 ** | 0.143 *** | 0.051 *** | 0.003 | 1.000 | ||
| 9. R&D stafft-1 | 0.493 *** | 0.541 *** | 0.528 *** | 0.279 *** | 0.354 *** | 0.312 *** | 0.099 *** | 0.185 *** | 1.000 | |
| 10. Groupt-1 | 0.270 *** | 0.282 *** | 0.322 *** | 0.127 *** | 0.237 *** | 0.127 *** | 0.025 *** | 0.259 *** | 0.370 *** | 1.000 |
| 11. R&D departmentt-1 | 0.537 *** | 0.586 *** | 0.529 *** | 0.224 *** | 0.338 *** | 0.278 *** | 0.097 *** | 0.170 *** | 0.636 *** | 0.307 *** |
| 12. Export intensityt-1 | 0.308 *** | 0.291 *** | 0.305 *** | 0.088 *** | 0.131 *** | 0.181 *** | 0.031 *** | 0.097 *** | 0.355 *** | 0.338 *** |
| 13. Firm sizet-1 | 0.363 *** | 0.422 *** | 0.454 *** | 0.200 *** | 0.351 *** | 0.241 *** | 0.044 *** | 0.303 *** | 0.588 *** | 0.618 *** |
| 14. Firm aget-1 | 0.120 *** | 0.161 *** | 0.161 *** | 0.057 *** | 0.170 *** | 0.109 *** | 0.015 * | 0.122 *** | 0.219 *** | 0.141 *** |
Table A3.
Correlation matrix (continued).
Table A3.
Correlation matrix (continued).
| 11. | 12. | 13. | 14. | |
|---|---|---|---|---|
| 11. R&D departmentt-1 | 1.000 | |||
| 12. Export intensityt-1 | 0.305 *** | 1.000 | ||
| 13. Firm sizet-1 | 0.451 *** | 0.421 *** | 1.000 | |
| 14. Firm aget-1 | 0.189 *** | 0.167 *** | 0.305 *** | 1.000 |
Notes: *** p < 0.01, ** p < 0.05, * p < 0.10.
References
- Chereau, P. Strategic management of innovation in manufacturing SMEs: Exploring the predictive validity of strategy-innovation relationship. Int. J. Innov. Manag. 2015, 19, 1550002. [Google Scholar] [CrossRef]
- Chesbrough, H.W. Open Innovation: The New Imperative for Creating and Profiting from Technology; Harvard Business School Press: Boston, MA, USA, 2003. [Google Scholar]
- Dahlander, L.; Gann, D.M. How open is innovation? Res. Policy 2010, 39, 699–709. [Google Scholar] [CrossRef]
- Henttonen, K.; Hurmelinna-Laukkanen, P. Determinants of R&D collaboration: An empirical analysis. Int. J. Innov. Manag. 2014, 18, 1450026. [Google Scholar]
- Spithoven, A.; Teirlinck, P. External R&D: Exploring the functions and qualifications of R&D personnel. Int. J. Innov. Manag. 2010, 14, 967–987. [Google Scholar]
- Belderbos, R.; Carree, M.A.; Lokshin, B.; Fernández, J. Inter-temporal patterns of R&D collaboration and innovative performance. J. Technol. Trans. 2015, 40, 123–137. [Google Scholar]
- Un, C.A.; Cuervo-Cazurra, A.; Asakawa, K. R&D collaborations and product innovation. J. Prod. Innov. Manag. 2010, 27, 673–689. [Google Scholar]
- Badillo, E.R.E.; Moreno, R. Are Collaborative Agreements in Innovation Activities Persistent at the Firm Level? Empirical Evidence for the Spanish Case. Rev. Ind. Org. 2015, 49, 71–101. [Google Scholar] [CrossRef][Green Version]
- Segarra-Blasco, A.; Arauzo-Carod, J.-M. Sources of innovation and industry-university interaction: Evidence from Spanish firms. Res. Policy 2008, 37, 1283–1295. [Google Scholar] [CrossRef]
- Un, C.A.; Asakawa, K. Types of R&D collaborations and product innovation: The benefit of collaborating upstream in the knowledge chain. J. Prod. Innov. Manag. 2015, 32, 138–153. [Google Scholar]
- Barney, J. Firm resources and sustained competitive advantage. J. Manag. 1991, 17, 99–120. [Google Scholar] [CrossRef]
- Arranz, N.; de Arroyabe, J.C.F. The choice of partners in R&D cooperation: An empirical analysis of Spanish firms. Technovation 2018, 28, 88–100. [Google Scholar]
- Vega-Jurado, J.; Gutiérrez-Gracia, A.; Fernández-de-Lucio, I. Does external knowledge sourcing matter for innovation? Evidence from the Spanish manufacturing industry. Ind. Corp. Chang. 2009, 18, 637–670. [Google Scholar] [CrossRef]
- Radicic, D.; Pugh, G.; Douglas, D.; Jackson, I. Cooperation for innovation and its impact on technological and non-technological innovations: Empirical evidence for European SMEs in traditional manufacturing industries. Int. J. Innov. Manag. 2019. [Google Scholar] [CrossRef]
- Radicic, D.; Pugh, G.; Douglas, D. Promoting cooperation in innovation ecosystems: Evidence from European traditional manufacturing SMEs. Small Bus. Econ. 2018. [Google Scholar] [CrossRef]
- Kogut, B.; Zander, U. Knowledge of the Firm, Combinative Capabilities, and the Replication of Technology. Org. Sci. 1992, 3, 383–397. [Google Scholar] [CrossRef]
- Ahn, J.M.; Kim, D.; Moon, S. Determinants of innovation collaboration selection: A comparative analysis of Korea and Germany. Innov. Org. Manag. 2017, 19, 125–145. [Google Scholar] [CrossRef]
- Cohen, W.M.; Levinthal, D.A. Absorptive Capacity: A New Perspective on Learning and Innovation. Adm. Sci. Q. 1990, 35, 128–152. [Google Scholar] [CrossRef]
- De Paris Caldas, L.F.; de Oliveira Paula, F.; van Aduard de Macedo-Soares, T.D.L. Industry innovation spending and openness to collaboration as levers for firm performance. Eur. J. Innov. Manag. 2019. [Google Scholar] [CrossRef]
- Kim, H.C.; Yoon, W. Study on Types of Technology Cooperation Partner and Innovation Performance: Focusing on Incremental and Radical Innovation. Int. J. Innov. Manag. 2019, 23, 1950005. [Google Scholar] [CrossRef]
- Smirnova, M.M.; Rebiazina, V.A.; Khomich, S.G. When does innovation collaboration pay off? The role of relational learning and the timing of collaboration. Ind. Mark. Manag. 2018, 74, 126–137. [Google Scholar] [CrossRef]
- Lieberman, M.B.; Montgomery, D.B. First-mover advantages. Strat. Manag. J. 1988, 9, 41–58. [Google Scholar] [CrossRef]
- Sánchez-González, G.; Gonzales-Alvares, N.; Nieto, M. Sticky information and heterogeneous needs as determining factors of R&D collaboration with customers. Res. Policy 2009, 38, 1590–1603. [Google Scholar]
- Von Hippel, E.; Katz, R. Shifting innovation to users via toolkits. Manag. Sci. 2002, 48, 821–833. [Google Scholar] [CrossRef]
- Aune, T.B.; Gressetvold, E. Supplier involvement in innovation processes: A taxonomy. Int. J. Innov. Manag. 2011, 15, 121–143. [Google Scholar] [CrossRef]
- Tsai, W.; Su, K.-H.; Chen, M.-J. Seeing through the eyes of a rival: Competitor acumen based on rival-centric perceptions. Acad. Manag. J. 2011, 54, 761–778. [Google Scholar] [CrossRef]
- Ki-Chan, K.; Changsoo, S.; Roemer, T.; Yassine, A. Configuration and coordination of activities within a supply chain: Exploring the synergy between modularity and information technology. Int. J. Autom. Technol. Manag. 2006, 6, 6–19. [Google Scholar]
- Ro, Y.K.; Liker, J.K.; Fixson, S.K. Evolving models of supplier involvement in design: The deterioration of the Japanese model in U.S. auto. IEEE Trans. Eng. Manag. 2008, 55, 359–377. [Google Scholar] [CrossRef]
- Perez, M.P.; Sánchez, A.M. The development of university spin-offs: Early dynamics of technology transfer and networking. Technovation 2003, 23, 823–831. [Google Scholar] [CrossRef]
- Pirnay, F.; Surlemont, B. Toward a typology of university spin-offs. Small Bus. Econ. 2003, 21, 355–369. [Google Scholar] [CrossRef]
- Van Burg, E.; Romme, A.G.L.; Gilsing, V.A.; Reymen, I.M. Creating University Spin-Offs: A Science-Based Design Perspective. J. Prod. Innov. Manag. 2008, 25, 114–128. [Google Scholar] [CrossRef]
- Torugsa, N.A.; Arundel, A. Private-public collaboration and innovation performance: Does training matter? Int. J. Innov. Manag. 2013, 17, 1340011. [Google Scholar] [CrossRef]
- Cohen, W.; Nelson, R.; Walsh, J. Links and impacts: The influence of public research on industrial R&D. Manag. Sci. 2002, 48, 1–23. [Google Scholar]
- Faems, D.; Van Looy, B.; Debackere, K. Interorganizational Collaboration and Innovation: Toward a Portfolio Approach. J. Prod. Innov. Manag. 2005, 22, 238–250. [Google Scholar] [CrossRef]
- De Paula, I.C.; de Campos, E.A.R.; Pagani, R.N.; Guarnieri, P.; Kaviani, M.A. Are collaboration and trust sources for innovation in the reverse logistics? Insights from a systematic literature review. Supply Chain Manag. Int. J. 2019. [Google Scholar] [CrossRef]
- Galati, F.; Bigliardi, B. Does different NPD project’s characteristics lead to the establishment of different NPD networks? A knowledge perspective. Technol. Anal. Strat. Manag. 2017, 29, 1196–1209. [Google Scholar] [CrossRef]
- Radicic, D.; Balavac, M. In-house R&D, external R&D and cooperation breadth in Spanish manufacturing firms: Is there a synergistic effect on innovation outputs? Econ. Innov. New Technol. 2018. [Google Scholar] [CrossRef]
- Radicic, D.; Pugh, G. Performance effects of open innovation in European small and medium-sized enterprises. J. Small Bus. Manag. 2017, 55, 76–114. [Google Scholar] [CrossRef]
- De Silva, M.; Howells, J.; Meyer, M. Innovation intermediaries and collaboration: Knowledge-based practices and internal value creation. Res. Policy 2018, 47, 70–87. [Google Scholar] [CrossRef]
- Allmendinger, M.; Berger, P. Selecting corporate firms for collaborative innovation. Entrepreneurial decision making in asymmetric partnerships. Int. J. Innov. Manag. 2019. [Google Scholar] [CrossRef]
- Rajalo, S.; Vadi, M. University-industry innovation collaboration: Reconceptualization. Technovation 2017, 62, 42–54. [Google Scholar] [CrossRef]
- Zach, F.J.; Hill, T.L. Network, knowledge and relationship impacts of innovation in tourism destinations. Tour. Manag. 2017, 62, 196–207. [Google Scholar] [CrossRef]
- Ayllón, S.; Radicic, D. Persistence and complementarities between technological innovations and exports. Appl. Econ. 2019, 51, 3650–3664. [Google Scholar] [CrossRef]
- Raymond, W.; Mohnen, P.; Palm, F.; Van Der Loeff, S.S. Persistence of Innovation in Dutch Manufacturing: Is It Spurious? Rev. Econ. Stat. 2010, 92, 495–504. [Google Scholar] [CrossRef]
- Peters, B. Persistence of Innovation: Stylized Facts and Panel Data Evidence. J. Technol. Transf. 2009, 34, 226–243. [Google Scholar] [CrossRef]
- Le Bas, C.; Scellato, G. Firm Innovation Persistence: A Fresh Look at the Frameworks of Analysis. Econ. Innov. New Technol. 2014, 23, 423–446. [Google Scholar] [CrossRef]
- Colombelli, A.; von Tunzelmann, N. The persistence of innovation and path dependence. In Handbook on the Economic Complexity of Technological Change; Antonelli, C., Ed.; Edward Elgar: Cheltenham, UK, 2011; pp. 105–119. [Google Scholar]
- Antonelli, C.; Crespi, F.; Scellato, G. Inside innovation persistence: New evidence from Italian micro-data. Struct. Chang. Econ. Dyn. 2012, 23, 341–353. [Google Scholar] [CrossRef]
- Tajeddini, K. Financial Orientation, Product Innovation and Firm Performance—An Empirical Study in the Japanese SMEs. Int. J. Innov. Technol. Manag. 2016, 13, 1640005. [Google Scholar] [CrossRef]
- Uzkurt, C.; Kimzan, H.S.; Yilmaz, C. A case study of the mediating role of innovation on the relationship between environmental uncertainty, market orientation, and firm performance. Int. J. Innov. Technol. Manag. 2016, 13, 1750003. [Google Scholar] [CrossRef]
- Santamaria, L.; Nieto, M.J.; Barge-Gil, A. Beyond formal R&D: Taking advantage of other sources of innovation in low- and medium-technology industries. Res. Policy 2009, 38, 507–517. [Google Scholar]
- Montoya, P.V.; Zárate, R.S.; Guerras-Martín, L.A. Does the technological sourcing decision matter? Evidence from Spanish panel data. R&D Manag. 2007, 37, 161–172. [Google Scholar]
- Barge-Gil, A.; Nieto, M.J.; Santamaria, L. Hidden innovators: The role of non-R&D activities. Technol. Anal. Strat. Manag. 2011, 23, 415–432. [Google Scholar]
- Hervas-Oliver, J.-L.; Garrigos, J.A.; Gil-Pechuan, I. Making sense of innovation by R&D and non-R&D innovators in low technology contexts: A forgotten lesson for policymakers. Technovation 2011, 31, 427–446. [Google Scholar]
- Hervas-Oliver, J.L.; Sempere-Ripoli, F.; Boronat-Moll, C.; Rojas, R. Technological innovation without R&D: Unfolding the extra gains of management innovations on technological performance. Technol. Anal. Strat. Manag. 2015, 27, 19–38. [Google Scholar]
- European Commission. European Innovation Scoreboard 2007: Comparative Analysis of Innovation Performance; European Commission: Brussels, Belgium, 2008. [Google Scholar]
- OECD. Measuring Innovation: A New Perspective; OECD Publications: Paris, France, 2010. [Google Scholar]
- Aboal, D.; Garda, P. Technological and non-technological innovation and productivity in services vis-à-vis manufacturing sectors. Econ. Innov. New Technol. 2016, 25, 435–454. [Google Scholar] [CrossRef]
- Evangelista, R.; Vezzani, A. The economic impact of technological and organizational innovations. A firm-level analysis. Res. Policy 2010, 39, 1253–1563. [Google Scholar] [CrossRef]
- OECD. Oslo Manual—Proposed Guidelines for Collecting and Interpreting Innovation Data, 3rd ed.; OECD Publications: Paris, France, 2005. [Google Scholar]
- Huang, C.; Arundel, A.; Hollanders, H. How Firms Innovate: R&D, Non-R&D, and Technology Adoption; UNU-MERIT Working Paper No. 2010-027; The United Nations University - Maastricht Economic and Social Research Institute on Innovation and Technology: Maastricht, The Netherlands, 2010. [Google Scholar]
- Polder, M.; van Leeuwen, G.; Mohnen, P.; Raymond, W. Product, Process and Organizational Innovation: Drivers, Complementarity and Productivity Effects; MPRA Paper No. 23719; Munich Personal RePEc Archive: Munich, Germany, 2010. [Google Scholar]
- Rouvinen, P. Characteristics of product and process innovators: Some evidence from the Finnish innovation survey. Appl. Econ. Lett. 2002, 9, 575–580. [Google Scholar] [CrossRef]
- Hottenrott, H.; Lopes-Bento, C. R&D partnerships and innovation performance: Can there be too much of a good thing? J. Prod. Innov. Manag. 2016, 33, 773–794. [Google Scholar]
- Vega-Jurado, J.; Gutierrez-Gracia, A.; Fernandez-de-Lucio, I.; Manjarres-Henriquez, L. The effect of external and internal factors on firms’ product innovation. Res. Policy 2008, 37, 616–632. [Google Scholar] [CrossRef]
- Bartoloni, E.; Baussola, M. Does technological innovation undertaken alone have a real pivotal role? Product and marketing innovation in manufacturing firms. Econ. Innov. New Technol. 2016, 25, 91–113. [Google Scholar] [CrossRef]
- Schubert, T. Marketing and Organisational Innovations in Entrepreneurial Innovation Processes and their Relation to Market Structure and Firm Characteristics. Rev. Ind. Org. 2010, 36, 189–212. [Google Scholar] [CrossRef]
- Schumpeter, J.A. Capitalism, Socialism and Democracy; Allen and Unwin: London, UK, 1943; Originally published in the USA in 1942; Reprinted by Routledge, London in 1994. [Google Scholar]
- Malerba, F.; Orsenigo, L. Schumpeterian patterns of innovation. Camb. J. Econ. 1995, 19, 47–65. [Google Scholar]
- Grotti, R.; Cutuli, G. xtpdyn: A community-contributed command for fitting dynamic random-effects probit models with unobserved heterogeneity. Stata J. 2018, 18, 844–862. [Google Scholar] [CrossRef]
- Heckman, J.J. The incidental parameters problem and the problem of initial conditions in estimating a discrete time—Discrete data stochastic process. In Structural Analysis of Discrete Data with Econometric Applications; Manski, C.F., McFadden, D., Eds.; MIT Press: Cambridge, UK, 1981. [Google Scholar]
- Wooldridge, J.M. Simple solutions to the initial conditions problem for dynamic, nonlinear panel data models with unobserved heterogeneity. J. Appl. Econom. 2005, 20, 39–54. [Google Scholar] [CrossRef]
- Zahra, S.A.; George, G. Absorptive capacity: A review, reconceptualization, and extension. Acad. Manag. Rev. 2002, 27, 185–203. [Google Scholar] [CrossRef]
- Forés, B.; Camisón, C. Does incremental and radical innovation performance depend on different types of knowledge accumulation capabilities and organizational size? J. Bus. Res. 2016, 69, 831–848. [Google Scholar] [CrossRef]
- Ritala, P.; Olander, H.; Michailova, S.; Husted, K. Knowledge sharing, knowledge leaking and relative innovation performance: An empirical study. Technovation 2015, 35, 22–31. [Google Scholar] [CrossRef]
- Liu, W.; Atuahene-Gima, K. Enhancing product innovation performance in a dysfunctional competitive environment: The roles of competitive strategies and market-based assets. Ind. Mark. Manag. 2018, 73, 7–20. [Google Scholar] [CrossRef]
- Brem, A.; Nylund, P.A.; Schuster, G. Innovation and de facto standardization: The influence of dominant design on innovative performance, radical innovation, and process innovation. Technovation 2016, 50, 79–88. [Google Scholar] [CrossRef]
- Ocasio, W. Towards an attention-based view of the firm. Strat. Manag. J. 1997, 18, 187–206. [Google Scholar] [CrossRef]
- Greco, M.; Grimaldi, M.; Cricelli, L. Open innovation actions and innovation performance. Eur. J. Innov. Manag. 2015, 18, 150–171. [Google Scholar] [CrossRef]
- Adegbile, A.; Sarpong, D.; Meissner, D. Strategic foresight for innovation management: A review and research agenda. Internat. J. Innov. Technol. Manag. 2017, 14, 1750019. [Google Scholar] [CrossRef]
- Damanpour, F.; Aravind, D. Product and Process Innovations: A Review of Organizational and Environmental Determinants. In Innovation, Science, and Institutional Change; Hage, J., Meeus, M., Eds.; Oxford University Press: Oxford, UK, 2006; pp. 38–66. [Google Scholar]


© 2019 by the authors. Licensee MDPI, Basel, Switzerland. This article is an open access article distributed under the terms and conditions of the Creative Commons Attribution (CC BY) license (http://creativecommons.org/licenses/by/4.0/).