Abstract
Despite the readily available consumer price information, price dispersion persists for products and services and has been extensively researched. However, there is scant literature on the influence of price dispersion on consumer behavior. The present study uses actual consumer purchase data of software service subscriptions and applies range–frequency principles to investigate how a customer’s price and relative position along a distribution at initial subscription might impact their subscription lifetimes. The study findings reveal that, in general, consumers paying higher initial prices retain their subscriptions longer, confirming the relationship between a consumer’s service value expectation and search cost. However, the amount of a consumer’s paid prices relative to that of other consumers’ can be helpful in predicting subscription duration. Consumers paying a relatively high price compared with others with similar subscription beginning dates have shorter subscription durations, which raise a concern regarding use of individual customer’s price information. The study suggests that principles of range–frequency theory are useful for comprehensively integrating price dispersion information. One interesting and counterintuitive implication of our analysis is that advantaged-price inequities (where the focal customer’s paid price is lower compared to another customer’s paid price) can also raise concerns about unfairness.
1. Introduction
According to a recent report by International Data Corp. on worldwide software licenses, maintenance, and subscription forecasts for 2016–2020, subscription software revenues should have reached $150 billion by 2017. The usage of software-as-a-service (e.g., Dropbox, Microsoft Office 365, and antivirus software) is common in high-speed internet regions. Indeed, subscription-based services are not limited to software. Cable TV, mobile communications, newspapers (e.g., NY Times), sports memberships, car insurance, video/audio streaming (e.g., YouTube and Spotify), merchandise delivery (e.g., Amazon Prime), business-to-business management (e.g., HP and Bench), and many more are in demand. Netflix alone has 139 million subscribers internationally, earning $16 billion in 2018 [1]. Subscription services are and will, undoubtedly, continue to be embedded in our lives.
The subscription business model offers many advantages, such as flexibility in resource planning and better prediction of revenue streams. Moreover, the strength of the relationships between customers and firms depends on the service quality, and trust is key to successful subscription-based services. Janzer [2] (p. 7) states that, “subscription businesses shift their focus from the point of sale to the long-term, ongoing customer relationship.” Accordingly, there have been several studies on customer lifetime value and customer relationship length in the service industry, including service subscriptions [3,4,5].
Service quality and design is known to directly impact service trial and repurchase intentions [6,7,8]. Other factors, such as customer satisfaction, brand equity, marketing communications, and channel offerings are well known to influence service duration. Furthermore, the association between customer purchase price and service satisfaction eventually leads to customer retention [9,10]. Purchase price serves as a basis for customer reservation price and acquisition value. As expected, a higher paid price is, associated with greater service value expectations and brand loyalty. Not limited to actual paid prices, but price perceptions, including price unfairness, are recognized to influence customer retention. “Utility is perceived value and is therefore subjective, not objective” [11]. Thus, customers’ price perceptions are subjective, which directly impacts their perception of utility. Bolton and Lemon [10], used a dynamic model with a mixture of components, including prior-usage levels, prices, and customer expectations, to explain payment equity (fairness) perception, inducing satisfaction and future-service usage. However, extant research on consumers’ price perceptions and the influence on service lifetime was mostly limited to the concept of individually secluded (in contrast to comparing to other individuals) price perception or methodologically experimental and survey-based research.
In the domain of price perceptions, this study focuses on the dispersion of customers’ paid prices and their relative positions among these prices, assuming customers can pay different prices and can apply social price comparisons (where a customer compares her own price with that of others’). From realizing and recognizing the estimated relativity of paid prices, customers can form non-observable price perceptions and judgments, which impact subscription durations. In other words, by examining one’s paid price at the beginning of a subscription and comparing it with that of others’, this study seeks to find possible relations to subscription renewal iterations. This study contributes to the understanding of the intersecting issues of paid price, price dispersion, and service-subscription duration by delving into a distinctive aspect of price information, which is now easily obtainable. In particular, the study addresses the following research questions that emerge with respect to service-subscription duration:
Q1. Do the magnitude of initial purchase price and relative position in paid price dispersion among subscribers influence service-subscription duration?
Q2. Are the range and frequency principles of range-frequency theory useful in understanding customer price perceptions/satisfactions within paid price distribution? And if so, how do these principles impact the length of service subscription?
Q3. What should the service offering firm be worried about when deciding its price and price promotion strategy that results in different paid prices by customers for otherwise an equivalent service?
Data obtained from a Fortune 500 company is analyzed to find the possible association among customer’s paid price, paid price distribution of similar customers, and service subscription duration. To integrate price distribution information obtained from many customers, the principles from range-frequency theory [12] are employed. Negative binomial regression analysis is applied to infer the relationship between these variables. The findings are as follows: (1) In general, customers paying a high price retain their service subscriptions for a longer duration. This result confirms the commonly accepted concept that customers who highly value the service are less sensitive to price and more loyal to the firm. (2) Considering the social paid price dispersion, relatively high paying customers compared with others with similar subscription starting dates have shorter subscription durations. This finding seems to contradict the first finding regarding correlation between paid price and subscription duration. However, the underlying mechanism is that relatively high price among price distribution has a moderating effect that reduces the preceding correlation. On the whole, it raises a concern that merely using individual customer’s price information is not sufficient, and a broader perspective on paid price is needed in predicting subscription length. (3) Integrating range and frequency values from price dispersion, it is found that price inequity, including advantaged-price inequities (where the focal customer’s paid price is lower than another customer’s paid price), can lead to shorter subscription duration. This finding reveals a possible price unfairness perception when different prices are paid by customers.
This study contributes to literature in several ways. By including actual customers’ purchase-price dispersion (i.e., paid prices vs. relative positioning of offered price), it investigates the effect of potential initial purchase-price dispersion perception on service duration. Some studies have incorporated similar types of social-price comparisons [11,13,14,15]. Representatively, Xia et al. [13] summarized the experiments conducted with various social price comparisons scenarios, which found that price inequity could lead to unfair perceptions, thus shrinking purchase probability. However, this appears to be the first study, to my knowledge, that connects primary purchase-price dispersion to actual customer behavior and service retention.
However, the possibility and impact of customers comparing prices has not been extensively studied. Typical referential price comparisons focus on comparing offered prices to past prices or to a similar product’s or competitor’s price. Such activities are shown to impact consumer behaviors, such as brand choices [16,17]. The present study shows that the information of price offered to others, which is a newly accessible type of information, may be associated with service subscription lifetime. Furthermore, the study suggests a few theories to understand the underlying process. To effectively use price distribution data, the study shows that the principles of the range–frequency model [12,18] are suitable for assessing the impact of price dispersion and comparisons. In addition, the potential role of unfair price perception is addressed. Analysis of frequency values reveal that advantageous price inequities, when customers are offered lower prices, and disadvantageous price inequities, when customers are charged higher prices, show similar tendencies, which can lead to shorter subscription spans. This supports past findings about price unfairness [19].
The present study differs from earlier studies on price dispersion mainly from two perspectives. First, price information trustworthiness is assumed. Price distribution data can be generally gathered from online/offline marketplaces. However, the dataset in this study comprises data from actual customer payments, making it much more authoritative. By applying real purchase data, the concerns of maintaining acceptable price ranges in comparisons are minimized [20,21]. In addition, some firms are known to set unrealistically high list prices accompanied by high-price discounts to lure customers. This behavior is disregarded. Furthermore, actual purchase data excludes various biases related to the survey process. Second, most studies on price dispersion focused on existential reasoning or sought links between dispersion characteristics and product attributes [22,23,24,25,26].
There are a few studies that have used service industry firms’ data to study the price-comparison effects outside the topic of reference prices [9]. Retail data, provided by various syndicated services or projects, have been extensively studied over the years. Most subscription services, including online software services, differ from retail products, in that firms sell directly to customers and have more control over how services are sold, including prices and promotions. This difference is important to price perceptions, because the service firm remains responsible for its purchase-price dispersion. Thus, price perception can highly impact consumer satisfaction and subscription duration. Moreover, because subscription-based software services are generally offered via an online presence, the probability of customers observing online price dispersion is much higher than in other venues (Price history tracking sites (e.g., camelcamelcamel.com) or price comparison sites (e.g., Google Shopping) are easily accessible).
This research differs significantly from typical reference price studies. Reference price is generally an internal price point or range, formed by experience and information, to which an individual compares the offered price of a product or service [10], whereas a price-comparison judgment can affect the internal reference price and change it. This research focuses on price-comparison judgments between one’s offered price and other customers’ offered prices. The price-comparison judgments in the present research focus on the actual prices and do not involve internal subjective prices. In general, a potential customer of an online service will spend time researching before making a decision.
The rest of the article is structured as follows. First, reviews of existing relevant literature on price judgments and service subscription duration are offered. Then, explanation of the data and methodology used is offered with specific descriptions of the research models. The detailed empirical results of the analysis and discussion of each finding are shown. Finally, a concluding section is presented to discuss the implications of the study findings for managers and researchers, where limitations of this study and related future research topics are also included.
2. Literature Review
Related main topics are summarized in the literature review. First, by characterizing past price dispersion research, the study shows how the current research differs. Then, price-related factors known to influence consumer behavior and, potentially, service duration are described. A detailed description and use of the principles of range-frequency theory is given. Finally, a summary of factors known to influence service duration is presented.
2.1. Price Dispersion and Price Perceptions
Surprisingly, price does not converge to a single value in this information technology era. Moreover, it seems logical to assume that online price dispersion should be less frequent than offline, or, to some extent, non-existent. However, several studies have found that different online prices for identical products remain dispersed, despite common logic [25,27,28,29]. Therefore, several studies have focused on the existence, reasons, and characteristics of price dispersion [30]. More recently, scholars have focused on the association between price dispersion and consumer behavior. For instance, Wu et al. [31] examined how price dispersion in the consumer-to-consumer market influenced perceived risk and trust for different product types.
Reference price is a topic closely related to price dispersion. It is typically referred to as the internal price point or range, which is formed by experience and information, to which an individual compares the offered price of a product or service [11,17]. Several studies [17,32] have examined reference-price formation and its impact given the diverse price-comparison points. For instance, Briesch et al. [33] find that brand-specific internal reference price provides the best fit among different reference price models using data on consumer-packaged goods. Lattin and Bucklin [34] include promotion expectation and find a sticker shock effect. However, these studies differ from the present research in terms of comparing entities. Rather than comparing the internalized price or other reference price with the offered price, this study focuses on one customer’s paid price versus another customer’s paid price. This type of price comparison delves into the topic of (un)fair price perceptions.
Research on unfair price perceptions has found that similar customers purchasing from the same firm were the most influential comparison entities [35,36,37]. Xia et al. [13] provided a classification of price comparisons, grouping them into three types of judgments: price equity (i.e., prices are equal); advantaged-price inequity (i.e., one customer’s price is lower than another customer’s price); and disadvantaged-price inequity (i.e., one customer’s price is higher than another customer’s price). Disadvantaged-price inequity is proven to increase perception of loss, thus lowering the perceived value of the transaction [13,19]. At times, this triggers customer retaliation [38,39]. However, the impact of advantaged-price inequity on consumers is more complex. Some researchers have argued that heightened customer satisfaction and perceived transaction value are possible [19,40,41]. However, when advantaged-price inequity is deemed unfair, it erodes the positive effects. Note that the rationale underlying the price difference critically impacts perceived unfairness. One exception, cost shift has been perceived as a justifiable reason for price differences and changes [42]. This article focuses on how customers can integrate and comprehensively perceive the ample information available on prices.
2.2. Range-Frequency Price Judgments
When realizing customer transaction satisfaction using distribution of prices, range–frequency theory [12,43] is useful [18]. This theory states that the judged value of a stimulus is determined by two principles: range and frequency. Leveraging the range principle, judgments of focal stimuli are related to the extreme value points. However, leveraging the frequency principle, judgments of focal stimuli are based on rank within the distribution [18].
Niedrich et al. [18] revealed the effectiveness of the range-frequency theory over other price judgments, including past-purchase price stimulus or range-only or frequency-only applications. They used panel data from grocery purchases to contrast different utility equations in choice situations. Cunha & Shulman [32] also provide some empirical evidence in support of range-frequency approach to integrate price distribution information with different items in the same category. However, their research focused on comparing different products, where they experimented with advertisements or observed shoppers in the store; they did not consider other prices from internet searches or temporal price shifts paid by other customers. This research broadens the comparisons to other customers’ paid prices of equivalent services and the long-lasting effect on service duration.
2.3. Factors Affecting Consumer’s Service Subscription Durations
Several past papers in the literature have considered the issue of consumer’s service subscription decision. Some studies have focused on adoption or willingness-to-pay for subscription services, revealing important consumer characteristics, such as usage rate, perceived convenience, and unfairness perceptions [44,45,46]. Multiple factors influencing customer churn in (subscription) services were found. Customer satisfaction [9,46,47], brand image [47], service quality [6,7], personal research [48], trust [49], switching cost/barriers [47,49] are found to impact service retention. In addition, behavioral characteristics of consumer’s subscription, for instance, expenditure [4,50], usage pattern [51], cross service ownership (i.e., telephone and mobile bundle services) [4], and even complaints [50] are known to impact prediction of customer churns.
While several factors are important and generally accepted predictors of customer churn, in many cases, they are not readily available to firms. However, while customer behavioral data are easily captured and used by firms, individual attitudinal data are (most often) hard to acquire. The present study explores the initial subscription paid prices data that most firms accumulate by default, providing new intuitions to this latent information source.
3. Methodology and Model
3.1. Methodology and Data
A negative binomial regression model is applied to investigate whether the number of years a customer renews a subscription is related to initial paid subscription fees and price distributions. A Poisson regression model is widely used when the dependent variable (the total number of subscription renewals) is a count variable (non-negative integers), such as the total number of occurrences of an event. A Poisson distribution of the dependent variable is assumed for a Poisson regression model. This distribution has a single parameter that represents the mean and the variance, which is a major drawback. Since the data showed over-dispersion (non-equal means and variances of error terms), a negative binomial regression model is implemented in this research [52,53]. The negative binomial is the most commonly used substitute to the Poisson model [54,55]. The negative binomial regression is represented as follows.
From Equation (1), α (≥0) is the heterogeneity(over-dispersion) parameter representing the extent of overdispersion. If α = 0, the model can be simplified to a Poisson regression. The negative binomial model relaxes an assumption from Poisson regression by considering a gamma distribution for exponentiated random error.
The data were acquired from a Fortune-500 subscription-based software service company, who wishes to remain anonymous (The data was provided under confidentiality agreement, and thus is not available to the public). The data comprise 3568 customers’ initial paid prices (in US dollars), the total number of subscription years (number of subscription renewals, to be exact), and subscription start dates. All customers began their subscriptions between January 2009 and December 2011. Seasonality is controlled by utilizing information of subscription start month. Figure 1 depicts price trends with dispersion and a histogram of total renewing years. Average renewing years per customer is around 1.57 with a standard deviation of 1.41.
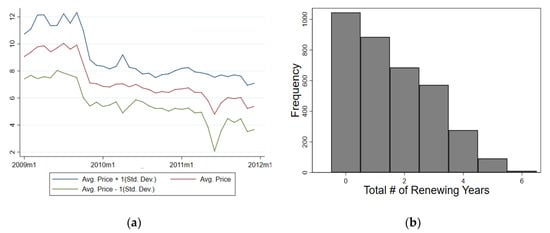
Figure 1.
(a) Monthly Price Dispersion; (b) Histogram of Total Number of Renewing Years.
A customer’s price dispersion of initial subscription uses 2 weeks’ data of other customer’s paid prices prior to the beginning of the subscription (No meaningful difference was found comparing results from 1 or 3 weeks of data). This dataset is unique for two main reasons. First, actual customer-paid price dispersion is observable. Note that, not all prices from paid customers are available. However, sufficient data are included to represent substantial price distribution. Past studies only captured probable price dispersion, collecting data from internet-price trackers, shopping websites, or price-comparison sites. It is highly probable that they included unpaid prices, such as high-posted prices for promotion reference points or unavailable deep-price discounts just to lure price deal-seeking consumers. In addition, the collection of internet data cannot capture the distribution of customers-paid prices, because sales information is generally not presented online. From the study, it is possible to concentrate on actual price dispersion per customer and explore the firm’s relationship with the customer to assess lifetime value.
To implement paid price distribution information, the principles of range and frequency from the range-frequency theory are applied. Parducci [12] and Niedrich et al. [18] converted the two aforementioned principle values of range-frequency theory as the following equations, which are also used here:
Range value, Rangei,k of consumer i in the price context k (2 weeks of paid initial subscription prices by consumers) is defined by the proportion in the equation, where Pi,k is the price i, Pmin,k is the minimum price in k, and Pmax,k is the maximum price in k. The frequency value, Frequencyi,k, is defined by the proportion where Ranki,k is the rank of consumer i’s price in k, and Nk is the total number of prices in k. By construction, the range value and frequency value are bounded between 0 and 1. Also, note that for both of the values, higher magnitudes are linked to higher prices among the distribution.
3.2. Model
To examine if social price distribution information and the range-frequency theory are significant in understanding the subscription lifetime of customers, four models are compared. First, a purchase-price-only model is used as a base model.
Purchase price is a form of reservation value for a service, representing the customer’s perception of the value of the offered service. It would be fair to assume that the higher price paid by a customer would be correlated with the duration of the service subscription. However, because the average paid price changes over time, the paid price alone is clearly insufficient for predicting consumer service valuation. Thus, models implementing frequency value or range value exclusively are applied (Figure 2).
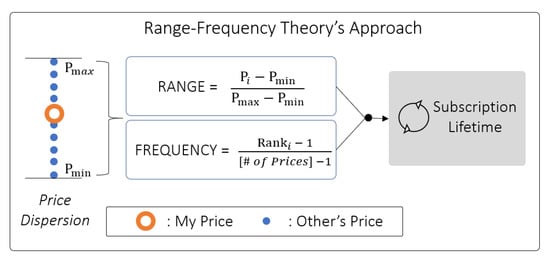
Figure 2.
Research Model.
Furthermore, the full range-frequency incorporated model is applied, where range and frequency values are both accommodated. This model is included to study whether the integration of principle values from the range-frequency theory is useful even when considering initial subscription price dispersions impact on the length of subscription duration, extending the work of Parducci [12] and Niedrich et al. [18].
4. Model Analysis and Findings
Table 1 presents the summary description of variables. The number of price points included in deciding price dispersion is a factor. On average, it is 82. This is the average number of price points that comprises price dispersion, making range and frequency values worth exploring. In addition, variance of the dependent variable is 1.98, in contrast to the mean of 1.57, indicating there is a possibility of over-dispersion.

Table 1.
Descriptive Statistics and Correlations among Variables.
Multicollinearity is one possible concern for including price dispersion values and the price itself into one regression. The correlations among these price-related variables are high. To account for the collinearity issue of the independent variables, the study considered the variance inflation factor (VIF) of the price and the price-related independent variables for each model and found that VIFs were lower than 5, highest being 3.2. This allows us to dismiss the collinearity issue. This follows a rather strict collinearity check from Menard [56], compared with the allowed VIF limits used by Neter et al. [57] and Kennedy [58].
All of the models showed statistically non-zero α (i.e., non-equal means and variances), indicating over-dispersion and that negative binomial regression should be preferred over Poisson regression (The analysis was done using Stata 15.1). In particular, when the likelihood ratio test was conducted, p-values for null hypothesis (α = 0) of the base model, Frequency only Model, Range only Model, and Range & Frequency Model, were all below 0.01 (To be specific, (1) were 40.12, 45.31, 10.90, and 9.55, with p-values all below 0.01). In addition, the Wald test results for overall model significance in Table 2 showed that explanatory variables were statistically significant for all models.
Table 2.
Parameter Estimates for Different Models.
Table 2 shows that the initial purchase price is relevant when determining the extension of service subscriptions. These results are consistent across all models. Customers who pay a relatively higher price at initial subscription purchase tend to stay longer with the firm. For instance, the coefficient of initial purchase price in the base model indicates that the expected log number of total renewal years will increase by 0.114 with a dollar increase of initial payment and other models show this effect may be larger when other price dispersion values are integrated together. This result is directly related to customer lifetime value, and is quite intuitive, because high-price payments can represent customers who value the service relatively higher. Customers who evaluate a service highly would be less sensitive to price and might search less for better price deals. High-paying customers could also be brand (firm) loyal customers or price-insensitive customers who do not spend time or effort in seeking price deals or discounts.
The model that examines frequency or range values separately (model 2 and 3) showed that these price dispersion variables were useful for understanding customers’ subscription durations. By comparing LL ratios, the AICs and BICs for model fits, higher LL and lower AIC and BIC were observed, compared with the base model. Similar to the other studies that incorporated price judgments (concept of reference price) for choice, the model fit was significantly better than those leveraging only paid price [33,34,59,60]. Moreover, it is apparent that the range–frequency model is superior to the base initial-purchase-price-only model or the frequency/range-value-only model. Thus, the social price dispersion of paid prices, represented by the range and frequency values, are linked to customer subscription duration.
Considering the variables independently, higher frequency or range values lead to lower renewal years. In other words, lower frequency/range value which indicates that a customer has paid a relatively lower price, is associated with longer subscription duration. In particular, for one unit increase on frequency (range) value, the expected log number of renewal years decreases by 0.538 (0.948). This finding shows how companies should manage their price promotion and price discrimination strategies. The fact that loyal customers value a product relatively high, as represented by paid price, is largely accepted. Nonetheless, the price dispersion of paid prices invoked by periodical price promotions and discrimination (e.g., coupon usage, website history tracking, and channel differentiation) was mostly ignored. The study results expose how not only a high-purchase price at the initial purchase decision, but also a lower paid price relative to similar customers is possibly related to long-time customer-churn tendencies and service subscription durations. Furthermore, this also serves as a warning that simply high-price paying customers are not the most loyal customers with a greatest lifetime value. Firms should be cautious when trying to extract the highest customer’s reservation value when initiating service subscriptions.
It is complicated when both price dispersion variables are included. Previously, variables describing rank (frequency) and range among price distribution were tested for their utility in predicting possible transaction satisfaction. They clearly showed that relatively higher paid prices are linked to shorter subscription period. However, when both range and frequency values are implemented together the frequency value effect becomes non-significant. This is a clear example of negative confounding. The range value is associated with the frequency value by construction and its relationship with subscription duration is shown in model 2. To overcome this problem, a squared term of frequency value was included to explore the potential non-linear effect (Several studies used nonlinear models to prevent confounding [61,62]. The quadratic component of frequency value was selected to account for possible nonlinear effect of price dispersion, because relatively much higher/lower paid price can be associated with unfair price perceptions and (non)noticeable price differences). Table 2 shows the analysis results for the newly proposed model 4.
The basic findings of initial purchase price and range value effect match those of the previous results. However, coefficients of the frequency value and its quadratic term depict an interesting convolution. Merely focusing on the coefficients of the two terms imply that if the frequency value is above 0.86, its impact will be positive, and if it is below 0.86, its impact will be negative. When the frequency value is around 0.5 (≈ 0.43 = 0.643 ÷ (0.748 × 2)), indicating that the customer’s paid price is near the median value of price dispersion, the positive effect on longer subscription duration is the greatest. However, note that the frequency value, in general, had a negative overall influence on duration. To explain, examining the opposite coefficient signs of the frequency-value squared and the linear terms with the previous findings, the possible negative (positive) impact from the frequency value is smallest (greatest) when one’s purchase price is near the median. Therefore, given that the other variables are fixed, customers who pay approximately the median price on a given time will generally retain their subscription the longer. This finding can be partially related to research by Keaveney & Parthasarathy [48], in which they find that customers who personally researched more (instead of blindly following word-of-mouth) have a greater tendency to continue an online service. Customers who actually found greater value for the selected service would be less likely to seek deeper price discounts, and more likely to forego unjust high prices.
This intriguing finding provides insight into price perceptions and fairness concerns. Past studies have persistently claimed that price (un)fairness perception is critical for understanding satisfaction and transaction utility. Different prices for the same item purchase obviously triggers customers’ price perception to be unfair and unjust, leading to decreased transaction utility [13]. This unfairness perception is not restricted to conditions when the customer observes lower prices being paid by other customers. Higher prices paid by other customers can also generate unfair price perceptions, analogous to the findings by Xia and Monroe [19]. Discovery from this research regarding frequency value and its squared terms suggest that, comprehensively, similar unfair perceptions can be realized by customers. This can alter the span of service subscription.
As discussed, the results of range-value coefficients are rather straightforward. A larger range value is negatively related to subscription length. To be specific, a unit increase of range value is associated with 0.995 decrease in the expected log number of renewing years. Stipulating lower maximum or lower minimum prices can shorten a customer’s subscription lifetime and vice versa. As explained earlier, the breadth of price dispersion is not directly associated with customer duration. However, one’s paid-price position among the distribution is more influential.
5. Conclusions
Several concerns were raised in the present study related to firms’ pricing strategies and promotional decisions. Various works have suggested price promotion tactics that are more profitable in the long-term. For instance, Pauwels and Weiss [63] have examined the long-term performance effects of different price promotions, finding profitability in offering short-term subscriptions. Kumar et al. [64] advise bundling service upgrades with price promotions to reacquire past customers. Here, the study suggests that when offering different prices for the same product, whether it is temporal price discrimination or price discrimination based on search cost, it is important to consider how these different prices indirectly affect choices and consumer valuations.
The study findings offer a starting point for understanding customer-price satisfaction and long-term loyalty. It is often the case that different prices become available via price promotions and price discriminations. Customers reveal their valuation of service through their paid price. However, with this exploratory research, a more profound insight into the differences of customers’ relative purchase prices and their lasting effect on subscription duration was revealed. The main realization is that customers’ subscription prices are more interdependent than dissociative. Although customers who pay a high price are generally long-term subscribers, relativity of paid price among similar customers is important. Customers paying relatively higher initial subscription price compared with others starting their service subscription at a comparable time will see faster turnover. Firms should consider and manage customers’ price dispersion when creating pricing or promotion strategies. It is not sufficient to merely plan temporal price discounts or offer price discrimination opportunities. Any customer can recognize the relative price paid for an equivalent service in comparison to other customers. This influences service satisfaction (or transaction) and subscription duration. In extreme cases, if unfair price perceptions prevail, offering uniform prices to all customers could be a solution [65]. In terms of service subscription lifetime, uniform pricing or justifiable price discriminations (e.g., quantity discounts or versioning) can be optimal, reducing service churn rates caused by unfair price dispersion perceptions.
The most notable limitation of this research using data from an online service firm is that the effects of social price comparisons can only be inferred from consumer behavior, and correlations among variables need not imply causality. Because the study does not directly inquire customers, one can only infer these relations from the behavior data. Additionally, only price dispersion of initial subscriptions is studied here. Price comparison judgments related to subscription renewal situations may also be important. Whereas contrasting the effects of new and existing customer prices might be interesting, firms’ renewal pricing policies are known to be more stable with very little dispersion. Specific subscription renewal decisions can be considered as a future research topic. One other limitation relates to non-users. From a firm’s data, only customer behavior after the initial subscription decision is observable. There is a good likelihood that users and non-users may act differently when handling price dispersion information. However, owing to data limitations, non-users are unobservable. Although the data are from a major software subscription firm, the generalizability of findings to other subscription-based services is a concern. Software subscription industry is very much online(web) dependent, thus consumers would perceive that the firm is responsible for its price dispersion. It is my expectation that for industries which show similar channel and price structures, such as newspaper subscription or contents streaming, the findings can be applicable. However, depending on industry norms, competitive environments, and customer expectations, more systematic price distributions could exist. For example, when intense competition exists for internet/TV cable services, the subscription price for that region decreases. If the correlations between price paid and other known factors exist, price dispersion information should be treated more cautiously.
Future research in this area could include quantitatively analyzing consumers’ subscription renewal decisions and exploring the impact of price discrimination or price dispersion. One very interesting study could be combining customer characteristics (demographics, usage rate, brand attitude etc.) to paid price information. Understanding the association between possible social price-sensitivity and consumer characteristics can be useful in planning targeted price promotions. Applying the basic principles adopted in this study to more diverse business situations is required to examine the robustness of these research findings. Future research could examine the relationship between diverse price discount tactics, consumer’s effort/search cost, and overall transaction utility, clarifying what sort of pricing strategy can be more profitable.
Funding
This research was funded by Ajou University.
Conflicts of Interest
The author declares no conflict of interest.
References
- Netflix 2018 Quarterly Earnings. Available online: https://www.netflixinvestor.com/financials/quarterly-earnings/default.aspx (accessed on 7 April 2019).
- Janzer, A.H. Subscription Marketing: Strategies for Nurturing Customers in a World of Churn, 2nd ed.; Cuesta Park Consulting: Mountain View, CA, USA, 2017. [Google Scholar]
- Gupta, S.; Lehmann, D.R. Customer lifetime value and firm valuation. J. Relatsh. Mark. 2006, 15, 87–110. [Google Scholar] [CrossRef]
- Burez, J.; Van den Poel, D. CRM at a Pay-TV company: Using analytical models to reduce customer attrition by targeted marketing for subscription services. Expert Syst. Appl. 2007, 32, 277–288. [Google Scholar] [CrossRef]
- Benoit, D.F.; Van den Poel, D. Benefits of quantile regression for the analysis of customer lifetime value in a contractual setting: An application in financial services. Expert Syst. Appl. 2009, 36, 10475–10484. [Google Scholar] [CrossRef]
- Rust, R.T.; Inman, J.J.; Jia, J.; Zahorik, A. What you don’t know about customer-perceived quality: The role of customer expectation distributions. Mark. Sci. 1999, 18, 77–92. [Google Scholar] [CrossRef]
- Zeithaml, V.A.; Berry, L.L.; Parasuraman, A. The behavioral consequences of service quality. J. Mark. 1996, 60, 31–46. [Google Scholar] [CrossRef]
- Bolton, R.N.; Lemon, K.N.; Bramlett, M.D. The effect of service experiences over time on a supplier’s retention of business customers. Manag. Sci. 2006, 52, 1811–1823. [Google Scholar] [CrossRef]
- Bolton, R.N. A dynamic model of the duration of the customer’s relationship with a continuous service provider: The role of satisfaction. Mark. Sci. 1998, 17, 45–65. [Google Scholar] [CrossRef]
- Bolton, R.N.; Lemon, K.N. A dynamic model of customers’ usage of services: Usage as an antecedent and consequence of satisfaction. J. Mark. Res. 1999, 36, 171–186. [Google Scholar]
- Cheng, L.L.; Monroe, K.B. An appraisal of behavioral price research (part 1): Price as a physical stimulus. AMS Rev. 2013, 3, 103–129. [Google Scholar] [CrossRef]
- Parducci, A. Category judgment: A range-frequency model. Psychol. Rev. 1965, 72, 407–418. [Google Scholar] [CrossRef]
- Xia, L.; Monroe, K.B.; Cox, J.L. The price is unfair! A conceptual framework of price fairness perceptions. J. Mark. 2004, 68, 1–5. [Google Scholar] [CrossRef]
- Huang, J.L.; Ryan, A.M.; Mujtaba, B.G. Vicarious experience of justice: When unfair treatment of one’s colleague matters. Pers. Rev. 2015, 44, 826–846. [Google Scholar] [CrossRef]
- Lee, S.H.; Fay, S. Why offer lower prices to past customers? Inducing favorable social price comparisons to enhance customer retention. Quant. Mark. Econ. 2017, 15, 123–163. [Google Scholar] [CrossRef]
- Bolton, L.E.; Warlop, L.; Alba, J.W. Consumer perceptions of price (un) fairness. J. Consum. Res. 2003, 29, 474–491. [Google Scholar] [CrossRef]
- Mazumdar, T.; Raj, S.P.; Sinha, I. Reference price research: Review and propositions. J. Mark. 2005, 69, 84–102. [Google Scholar] [CrossRef]
- Niedrich, R.W.; Weathers, D.; Hill, R.C.; Bell, D.R. Specifying price judgments with range–frequency theory in models of brand choice. J. Mark. Res. 2009, 46, 693–702. [Google Scholar] [CrossRef]
- Xia, L.; Monroe, K.B. Is a good deal always fair? Examining the concepts of transaction value and price fairness. J. Econ. Psychol. 2010, 31, 884–894. [Google Scholar] [CrossRef]
- Monroe, K.B. A Method for Determining Product Line Prices with End-Price Constraints. Unpublished Doctoral Dissertation, University of Illinois, Champaign, IL, USA, 1968. [Google Scholar]
- Monroe, K.B. Measuring price thresholds by psychophysics and latitudes of acceptance. J. Mark. Res. 1971, 8, 460–464. [Google Scholar] [CrossRef]
- Stigler, G.J. The economics of information. J. Political Econ. 1961, 69, 213–225. [Google Scholar] [CrossRef]
- Salop, S.; Stiglitz, J.E. The theory of sales: A simple model of equilibrium price dispersion with identical agents. Am. Econ. Rev. 1982, 72, 1121–1130. [Google Scholar]
- Carlson, J.A.; McAfee, R.P. Discrete equilibrium price dispersion. J. Political Econ. 1983, 91, 480–493. [Google Scholar] [CrossRef]
- Baye, M.R.; Morgan, J.; Scholten, P. Price dispersion in the small and in the large: Evidence from an internet price comparison site. J. Ind. Econ. 2004, 52, 463–496. [Google Scholar] [CrossRef]
- Bock, G.W.; Lee, S.Y.; Li, H.Y. Price comparison and price dispersion: Products and retailers at different internet maturity stages. Int. J. Electron. Commer. 2007, 11, 101–124. [Google Scholar] [CrossRef]
- Brynjolfsson, E.; Smith, M.D. Frictionless commerce? A comparison of Internet and conventional retailers. Manag. Sci. 2000, 46, 563–585. [Google Scholar] [CrossRef]
- Scholten, P.; Adam Smith, S. Price dispersion then and now: Evidence from retail and e-tail markets. In The Economics of the Internet and E-Commerce; Emerald Group Publishing Limited: West Yorkshire, UK, 2002; pp. 63–88. [Google Scholar]
- Ancarani, F.; Shankar, V. Price levels and price dispersion within and across multiple retailer types: Further evidence and extension. J. Acad. Mark. Sci. 2004, 32, 176. [Google Scholar] [CrossRef]
- Varian, H.R. A model of sales. Am. Econ. Rev. 1980, 70, 651–659. [Google Scholar]
- Wu, K.; Vassileva, J.; Noorian, Z.; Zhao, Y. How do you feel when you see a list of prices? The interplay among price dispersion, perceived risk and initial trust in Chinese C2C market. J. Retail. Consum. Ser. 2015, 25, 36–46. [Google Scholar] [CrossRef]
- Cunha, M., Jr.; Shulman, J.D. Assimilation and contrast in price evaluations. J. Consum. Res. 2010, 37, 822–835. [Google Scholar] [CrossRef]
- Briesch, R.A.; Krishnamurthi, L.; Mazumdar, T.; Raj, S.P. A comparative analysis of reference price models. J. Consum. Res. 1997, 24, 202–214. [Google Scholar] [CrossRef]
- Lattin, J.M.; Bucklin, R.E. Reference effects of price and promotion on brand choice behavior. J. Mark. Res. 1989, 26, 299–310. [Google Scholar] [CrossRef]
- Major, B.; Testa, M. Social comparison processes and judgments of entitlement and satisfaction. J. Exp. Soc. Psychol. 1989, 25, 101–120. [Google Scholar] [CrossRef]
- Major, B. From social inequality to personal entitlement: The role of social comparisons, legitimacy appraisals, and group membership. Adv. Exp. Soc. Psychol. 1994, 26, 293–355. [Google Scholar]
- Mussweiler, T. Comparison processes in social judgment: Mechanisms and consequences. Psychol. Rev. 2003, 110, 472–489. [Google Scholar] [CrossRef]
- Bougie, R.; Pieters, R.; Zeelenberg, M. Angry customers don’t come back, they get back: The experience and behavioral implications of anger and dissatisfaction in services. J. Acad. Mark. Sci. 2003, 31, 377–393. [Google Scholar] [CrossRef]
- Bechwati, N.N.; Morrin, M. Outraged consumers: Getting even at the expense of getting a good deal. J. Consum. Psychol. 2003, 13, 440–453. [Google Scholar] [CrossRef]
- Ordóñez, L.D.; Connolly, T.; Coughlan, R. Multiple reference points in satisfaction and fairness assessment. J. Behav. Decis. Mak. 2000, 13, 329–344. [Google Scholar] [CrossRef]
- Loewenstein, G.F.; Thompson, L.; Bazerman, M.H. Social utility and decision making in interpersonal contexts. J. Pers. Soc. Psychol. 1989, 57, 426–441. [Google Scholar] [CrossRef]
- Kahneman, D.; Knetsch, J.L.; Thaler, R. Fairness as a constraint on profit seeking: Entitlements in the market. Am. Econ. Rev. 1986, 728–741. [Google Scholar]
- Parducci, A. Happiness, Pleasure, and Judgment: The Contextual Theory and Its Applications; Lawrence Erlbaum Associates, Inc.: Mahwah, NJ, USA, 1995. [Google Scholar]
- Chyi, H.I. Willingness to pay for online news: An empirical study on the viability of the subscription model. J. Media Econ. 2005, 18, 131–142. [Google Scholar] [CrossRef]
- Choi, J.; Lee, S.M.; Soriano, D.R. An empirical study of user acceptance of fee-based online content. J. Comput. Inf. Syst. 2009, 49, 60–70. [Google Scholar]
- Wang, C.L.; Zhang, Y.; Ye, L.R.; Nguyen, D.D. Subscription to fee-based online services: What makes consumer pay for online content? J. Electron. Commer. Res. 2005, 6, 304–311. [Google Scholar]
- Svendsen, B.G.; Prebensen, K.N. The effect of brand on churn in the telecommunications sector. Eur. J. Mark. 2013, 47, 1177–1189. [Google Scholar] [CrossRef]
- Keaveney, S.M.; Parthasarathy, M. Customer switching behavior in online services: An exploratory study of the role of selected attitudinal, behavioral, and demographic factors. J. Acad. Mark. Sci. 2001, 29, 374–390. [Google Scholar] [CrossRef]
- Ranaweera, C.; Prabhu, J. The influence of satisfaction, trust and switching barriers on customer retention in a continuous purchasing setting. Int. J. Serv. Ind. Manag. 2003, 14, 374–395. [Google Scholar] [CrossRef]
- Ahn, J.H.; Han, S.P.; Lee, Y.S. Customer churn analysis: Churn determinants and mediation effects of partial defection in the Korean mobile telecommunications service industry. Telecommun. Policy 2006, 30, 552–568. [Google Scholar] [CrossRef]
- Li, H.; Wu, D.; Li, G.; Ke, Y.H.; Liu, W.J.; Zheng, Y.H.; Lin, X.L. Enhancing telco service quality with big data enabled churn analysis: Infrastructure, model, and deployment. J. Comput. Sci. Technol. 2015, 30, 1201–1214. [Google Scholar] [CrossRef]
- Hausman, J.; Hall, B.H.; Griliches, Z. Econometric models for count data with an application to the patents-R&D relationship. Econometrica 1984, 52, 909–938. [Google Scholar]
- Greene, W.H. Econometric Analysis, 7th ed.; Pearson Education India: Delhi, India, 2012. [Google Scholar]
- Cameron, A.C.; Trivedi, P.K. Regression Analysis of Count Data; Cambridge University Press: Cambridge, UK, 2013. [Google Scholar]
- Winkelmann, R. Econometric Analysis of Count Data; Springer Science & Business Media: Berlin, Germany, 2008. [Google Scholar]
- Menard, S. Applied Logistic Regression Analysis; Sage University Series: Thousand Oaks, CA, USA, 1995. [Google Scholar]
- Neter, J.; Wasserman, W.; Kutner, M.H. Applied Linear Regression Models; Irwin: Chicago, IL, USA, 1996. [Google Scholar]
- Kennedy, P. A Guide to Econometric Methods, 3rd ed.; The MIT Press: Cambridge, MA, USA, 2003. [Google Scholar]
- Rajendran, K.N.; Tellis, G.J. Contextual and temporal components of reference price. J. Mark. 1994, 58, 22–34. [Google Scholar] [CrossRef]
- Mazumdar, T.; Papatla, P. An investigation of reference price segments. J. Mark. Res. 2000, 37, 246–258. [Google Scholar] [CrossRef]
- Yarnold, P.R. CTA vs. not chi-square: Fear and specific recommendations do synergistically affect behavior. Optim. Data Anal. 2016, 5, 108–111. [Google Scholar]
- McNamee, R. Regression modelling and other methods to control confounding. Occup. Environ. Med. 2005, 62, 500–506. [Google Scholar] [CrossRef]
- Pauwels, K.; Weiss, A. Moving from free to fee: How online firms market to change their business model successfully. J. Mark. 2008, 72, 14–31. [Google Scholar] [CrossRef]
- Kumar, V.; Bhagwat, Y.; Zhang, X. Regaining “lost” customers: The predictive power of first-lifetime behavior, the reason for defection, and the nature of the win-back offer. J. Mark. 2015, 79, 34–55. [Google Scholar] [CrossRef]
- Chen, Y.; Cui, T.H. The benefit of uniform price for branded variants. Mark. Sci. 2013, 32, 36–50. [Google Scholar] [CrossRef]


© 2019 by the author. Licensee MDPI, Basel, Switzerland. This article is an open access article distributed under the terms and conditions of the Creative Commons Attribution (CC BY) license (http://creativecommons.org/licenses/by/4.0/).