Abstract
While extant studies on brokerage address its structural competitiveness and network performance, few studies address the fundamental question of whether all the brokerage types have identical and positive effects on network development. Extending the Gould and Fernandez’s brokerage topology, the study measures the contribution of the brokerage roles over to the network evolution. For the purpose, the Chinese technology transfer flow networks were utilized to reveal the brokerage patterns of three anchor regions—Beijing, Shanghai, and Shenzhen. The analysis outlines that Beijing and Shenzhen, as nation-wide brokerage hubs, transmit the technology across the whole regions, while Shanghai seems to be a more balanced broker region connecting the neighbour regions with the others. The longitudinal simulation analysis demonstrates that a liaison-type brokerage function, connecting the heterogeneous knowledge sources, contributes to the growth of the regional network.
1. Introduction
The importance of knowledge diffusion as a means for generating technology innovations has been emphasized for sustainable economic growth [1,2,3,4]. The dynamic processes of absorbing exogenous knowledge and assimilating it into local knowledge are of significance to keep the complex determinants contributing to the region’s capabilities for development [5,6,7,8]. The research on the regional innovation system (RIS) has focused on the innovation process in the perspective of a system, highlighting the geographical dimensions of knowledge diffusion as a central factor sustaining regional growth. From the systematic approach, the structure of a region’s knowledge network influences the efficiency to accelerate the interactions for exchanging knowledge flow [7,9,10]. The literature on social networks has recognised the role of a broker entity accounting for the structural influencer on the networks of knowledge flow [11,12,13,14,15,16]. A brokerage position controls the knowledge flow between its own network and another, bridging different knowledge sources and supporting the viability of the whole system [17]. The broker node is responsible for combining heterogeneous information sources and control the flows of information from the individual level [18,19] to the institutional level network [20,21,22,23].
The structural advantage of a brokerage node does not seem to be solely limited to the network field. The idea, however, was already acknowledged in the other context: Focal firms in an industrial district [24], technological gatekeepers [25], and global pipeline [26]. Studies of geographical clusters also emphasise the linkages within and outside their cluster, connecting with knowledge sources [27,28,29,30]. The notion of global pipelines appropriates knowledge from foreign countries and conveys it to the domestic neighbour regions, thus guiding knowledge from foreign countries into its innovation system [26]. One common notion for brokerage in these studies is that the nodes play a leading role in transferring exogenous technologies into the co-located nodes within the group. [20,23]. The brokerage metaphor, under the network framework, allows us to treat a ‘brokerage region’ like a broker node in the inter-regional knowledge flow networks. It, therefore, seems plausible that a brokerage region might play a critical role in producing and connecting exogenous knowledge within a national system of innovation [31]. In the same vein, the empirical works on the function of a region in the national innovation system have been illustrated as a knowledge hub [32] and super-regions [10].
The aim of this paper is to identify the brokerage patterns of leading regions and examine the contribution to the evolution of technology networks in China. In order to recognise the patterns, this study extended the Gould and Fernandez’s [33] brokerage typology (hereafter GF brokerage) into the spatial technology transmission across the prefecture-level regions. Then, the research measured the influence of the specific type on network development, where traditional metamorphic network analysis remained void. In response to the micro-evolutionary mechanism underlying the network dynamics, stochastic actor-oriented models (SAOM), that has attracted growing interest in social science and economic geography as well, is applied to address the longitudinal network development [21,34,35].
Given that the linkage between innovative knowledge and economic growth has been reinforced, the trace of pecuniary-motivated technology flow provides robust evidence to explore the regional innovation outcomes and economic development. In this vein, the brokerage role of knowledge diffusion has significance in the discussion of sustainable economic growth. Recognising the brokerage position as a structural influencer, the difference in mediating the knowledge and information flow culminated in the different impact on the network [36,37]. For instance, a knowledge connector that simply provides the accessibility chance and a knowledge distributor that controls the information flow does not account for the identical dynamics in the network.
The next section introduces the theoretical background of a brokerage role, then re-interprets the five GF brokerage types from the perspective of a regional technology flow. Section 3 introduces the dataset, describing the Chinese patent licensing network, three megalopoleis, and their anchor regions—Beijing, Shanghai, and Shenzhen. Section 4 identifies the patterns of the three anchor regions under the framework of GF brokerages and reports the estimation result of the contribution effects. Section 5 discusses the implications and concludes.
2. The Dynamics of Network Evolution and the Role of Anchor Regions
2.1. The Brokerage Role in the Network
One of the main concerns of the brokerage concept in social network studies is to reveal the linkage between the structural characteristics of a broker node and its interactive influences on the performance of network [22,37,38,39,40,41]. Hargadon and Sutton [41] present empirical evidence that firms exploit the combined knowledge that acquired technologies from one industry and then apply them to another sector. The competitive capacity of the gatekeeper, such as creativity and higher skills, were reinforced from the network effects [42,43]. In the same way, several empirical works corroborated the positive relationship between the importance of a brokerage role and network performance. For instance, Cross and Cummings [44] find a positive correlation between network performance and betweenness centrality amongst engineers in a petrochemical company, indicating that the structure was significant in controlling the information flows of a network. Rodan and Galunic [45] surveyed 106 middle managers in a European company to demonstrate that a manager’s innovation performance correlates with the sparseness of their network. Capello [46] also argues that knowledge is shared in the cohesive structure, such as communities of practice, implying that the structure of a network is highly likely to determine the knowledge transmission within the network.
A brokerage position combines and diffuses existing information and knowledge among unconnected nodes, generating a competitive advantage to the network by drawing on internal and external information [22]. Thus, it influences the network nodes between both internal and external nodes, producing higher innovative outcomes [33,47]. The fundamental idea underlying these empirical works is that linkages around the nodes have the structural influence on the decision-making process, thus affecting the performance of a total network system [48]. Then, the presence of a focal brokerage node is highly likely to affect the decision of other nodes that underpin the performance of the others in the network [49].
Scholars addressing the local knowledge spillover also recognised the significant role of a brokerage node as a conduit of new knowledge. Extant empirical studies use the analogy of a brokerage node to refer the inter/intra-regional channels of knowledge. Bathelt, Malmberg, and Maskell [26] argue that the presence of ‘global pipelines’ connecting the internal cluster to the external knowledge source can be beneficial in two ways: By acquiring new and valuable knowledge externally created, and by disseminating it to other firms in the cluster. Giuliani and Bell [50], based on the geographical wine cluster in Chile, argue that focal firms play a leading role in transmitting the new knowledge and provide support to co-located firms, contributing the positive externalities to the cluster network. Research on clusters focuses on the gatekeepers to accessing external knowledge [18,22,24,50]. According to the above literature, the main role of focal nodes within the network share some typical features, being characterized by conferring the chances to access the external knowledge sources.
2.2. The Types of Brokerage in the Spatial Technology Transfer
While not diminishing the importance of these brokerage roles in the geographical space, scholars have further revealed the specific types accounting for the brokerage roles, which has largely remained void [24,33,51]. Gould and Fernandez [33] suggest a formal typology of the brokerage role, attracting the attention not just from the social context [52], but also several relevant studies [30,36,53]. According to their classification, a coordinator connects the nodes that belong to the same group, so the information flows remain inside the group. A representative delegates its member nodes in order to deliver or exchange the information with the other outside members. On the contrary, a gatekeeper selectively endows the inflow of information from outside groups. A liaison, positioned outside of both groups, connects the source and receiver outside of the own group. While a consultant (itinerant) located outside transmits the information between the two nodes that are co-located within a group.
The GF brokerage concept presents a systematic description to classify the presence of a brokerage in a quantitative way. Boari, Molina-Morales, and Martínez-Cháfer [53] recently applied this concept to investigate how different types of brokerage activities affect the innovative performance of a clustered firm. They hypothesised that a liaison role has the highest innovative performance, then a gatekeeper and a representative positions in-between, while a coordination role has the lowest. Their regression model finds a positive relation between the liaison role and innovative performance, suggesting the opportunity for a broker to benefit from intermediating between different subgroups. What their analysis did not find as a significant result is the positive relationship between the other two roles (gatekeeper and representative) and innovative performance, which this research tackles. Spiro, Acton, and Butts [36] extend the GF typology to develop the dynamic approach of measuring brokerage opportunities in the evolution process, based on the inter-organisation collaboration network during Hurricane Katrina.
From the perspective of spatial knowledge spillover, it is worth noting that the notion of GF brokerage accesses the diverse roles corresponding to the structural dynamics. Thus, this research views GF as a crucial framework to account for the spatial transfer of technology across regions. The quadrant in Figure 1 clarifies the contribution of an individual broker to the neighbour regions in the megalopolis by interpreting the roles into four quadrants: A gatekeeper (upper right quadrant) imports external technology into the neighbour regions within the megalopolis (intra-megalopolis), a representative diffuses the endogenous technology to the other regions outside of the megalopolis (lower left quadrant), or intermediate combinations (remaining two quadrants). A coordinator mediates the technology between the regions within a megalopolis, which has little influence on the other regions outside of the megalopolis. In contrast, a consultant exchanges technology between regions within the same megalopolis, leaving the neighbour regions untouched. A liaison, however, involves the technology exchange between regions where two regions do not belong to the same group. For instance, Beijing transmits technology originating from Shanghai to the regions in non-super regions. From the perspective of the national innovation system, a consultant node plays a global connecting role between the regions.
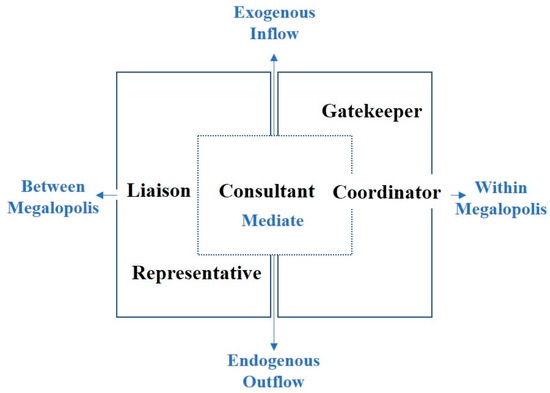
Figure 1.
Mapping the GF brokerage roles into the spatial technology flow.
A coordinator transmits technology to unconnected clusters that belong to the same subgroup. A high-tier actor of the technology production hierarchy might share technology with a middle-tier actor, which later delivers a low-tier actor. Then, the middle-tier actor plays a coordinator role in the network. On the other hand, a consultant broker belongs to a different subgroup than the clusters that it connects. In this case, a broker actor shares technology from one actor with the other actor in the same group. A gatekeeper broker is part of the same subgroup as a cluster of individual actors receiving technology. They could have the privilege of whether to accept access to this cluster from other actors, which transfers technology. For example, a gatekeeper region, as a member of a megalopolis, could determine the adoption of new technology flow from the other regions. Similar to a gatekeeper, a representative broker is part of the same subgroup. In contrast, a representative broker delivers technology to another cluster in a different subgroup. A representative region might be linked to a technology push in technology diffusion. Liaison brokers are part of their own subgroup, which links unconnected clusters that belong to different subgroups. For instance, an actor in the megalopolis might work with another actor in a different region, then distribute it to the other regions. All of which is described in Table 1.

Table 1.
The brokerage roles in the inter-regional technology flows.
In the context of the network dynamics, what has remained silent is the implicit assumption that all the brokerage roles have a positive and significant impact on the longitudinal network development. While there is surging interest in the network, there is relatively little empirical evidence on how the dynamic is established and progressed over time periods [54]. Specifically, to the best of knowledge, no empirical studies address the contribution of specific roles of a broker region in the evolution of a regional technology network. In the current analysis, given the debates on the structure effects and attribute effect, a quantitative estimation is attempted in order to examine which effects matter for the development of a network.
3. Data and Estimation Method
3.1. Network Data Construction
In order to identify the patterns of exchanging technology, the directed networks between a patent licensor and licensee from Chinese patent licensing DB provided by SIPO (State Intellectual Property Office of China) were established. The PLCRP (Patent Licensing Contract Recordal Procedures) regulation forces the contract information, including the addresses and patent number, to be submitted and examined by the authority. The collected dataset consisted of 130 nodes from 2009 to 2012, containing the 21,158 links as shown in Table 2.
Table 2.
Descriptive statistics of the longitudinal data.
The inter-regional technology flow network captures the direction of technology flows from the source (the patentee’s region) to the target (the licensee or buyer’s region), as shown in Figure 2. Then, the nodes are regions, and the edges are the direction of the technology flow constructing an adjacency matrix. The current analysis consists of four periods from 2009 to 2012. The primary reason for choosing this period is that the Chinese domestic technology market reached the matured stage, representing the dynamic structural changes of technology flows between and within regions. According to WIPO (IP Statistics Data Center: https://www3.wipo.int/ipstats/), the total amount of patent grants in 2012 was 152,097, doubled from 68,501 in 2008. The number of applications also increased sharply from 231,434 to 561,408 during the same period. In order to model the clearer effect of variables, 130 nodes (regions) were selected as a data set. Then, the region-to-region network consisted of binary directed networks, where , when a region has a license-out to a region, .
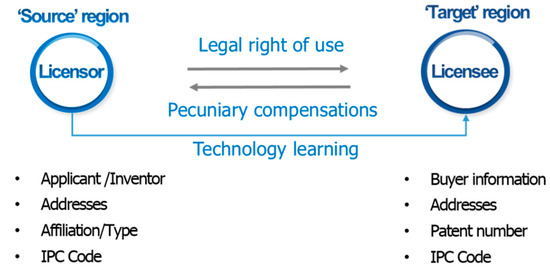
Figure 2.
Inter-regional network construction. Source: Author’s elaboration.
Prefecture-level was used as a geographical unit of analysis because, as in the U.S., Chinese providence is not an economic unit, but a political and administrative unit. Secondly, the daily activities of economic actors are not bound by province borders either. Commuting and travel behaviours are influenced by time and distance rather than by the providence boundaries. Then, for daily economic activities, the prefecture-level region or metropolitan area is more appropriate for exploring the question at hand [55]. The three super regions (BGR (Bohai Gulf Rim): Beijing, Cangzhou, Shandong, Qinhuangdao, Tangshan, Tianjin, Zhangjiakou, Langfang, Chengde, Shijiazhuang and Baoding; YRD (Yangtze River Delta): Shanghai, Changzhou, Hangzhou, Huzhou, Jiaxing, Nanjing, Nantong, Ningbo, Shaoxing, Suzhou, Taizhou, Wuxi, Yangzhou, Zhenjiang and Zhoushan; PRD (Pearl River Delta): Dongguan, Foshan, Guangzhou, Huizhou, Jiangmen, Shenzhen, Zhaoqing, Zhongshan, and Zhuhai) are classified according to [10] and [56].
3.2. Estimation Methodology of Network Evolution
This analysis applies SAOM in order to account for the issues on the temporal dataset and the relational dataset. The metamorphic network indices that specialised in the static description of the individual nodes cannot examine longitudinal datasets. The traditional econometrical statistic approach, however, is not suited to modelling the structural effect of a network, violating the fundamental assumptions of regressions [21,34,35,57]. SAOM, reconciling the temporal and network data structure, addresses the dynamic nature in that the model examines how the network structure evolves from t to the t + 1 period. Another advantage of this approach is that the change probabilities are determined by the structural choice-opportunity and the individual objective function, which are more close to the practical mechanism. This approach is widely accepted in economic geography [28,29,35,50,58,59,60]
The basic idea of SAOM stems from Markov random graphs, presuming that the probability of network evolution depends on the current state of the network. The network dynamics, the transformation from one to another state, is caused by the aggregated decision from the nodes. These micro-level decisions are based on the attribute of the individual node, which is determined by the previous network structure settings. The algorithm calculates the estimated coefficients based on the iterative Markov chain Monte Carlo model [61]. It stochastically approximates the parameters in the way of minimising the deviation between the observed and simulated networks. The parameters are adjusted to fit the observed results at each simulated step during the iterations. The estimated parameters are then evaluated for the goodness of the fit of the model to compute the standard errors in a familiar form to interpret the power of the estimated power.
If the evolution of the network is considered as a longitudinal time-series change, then let network structure be , for the number of nodes of from 1 to n. In the Markov chain , each observation is represented as a matrix set, or , whereby node has a relation with . According to the fundamental assumption of Markov chains, the evolution of the network is influenced by the current state of the network to the extent of the probability [62]. In this light, SAOM addresses the network dynamics by modelling the change process through two directions. One is the change opportunity process and the other is the change choice process, which is also referred to as the rate function and objective function, respectively. The nodes can change their relationship with others—create, maintain, or dissolve—at stochastically determined moments. These opportunities are determined by the Poisson distribution function that Steglich and Snijders [61] refer to as the rate function () for each actor, . For a formal expression, the opportunities for node to change one of the tie parameters, , happens at the probability function ().
Given the heterogeneity in the change opportunities, the individual attributes of the nodes are highly likely to affect opportunities to change relationships. Thus, under the individual attribute and degree, , the rate function is given as below:
Following on a current state (), the set of permitted new states is the product function of two model components, and , that determine the transition rate matrix of which the elements are given by:
where , in the case of , and for the digraphs, and . As the rate function process sets the frequency of opportunities to change ties, network structures with high values signify strong dynamics.
3.3. Choice Opportunities’ Modelling
Let us turn to the choice opportunity modelling. Given that a node, , has the opportunity to make a relational change, the choice for this actor is to change one of the set of relation parameters, . If there is a change in the relation parameter, , then it will lead to a new state, . The multinomial logistic regression objective function, , is applied to the choice probability of a node [61]:
When a node has the opportunity to change their tie, it chooses its partners by trying to maximize the objective function that accounts for the preferences and constraints of the node. The process is interpreted as the idea that nodes determine the change of their position, myopically maximizing their objective function. For a formal expression, the objective function is defined, as the choices are then determined by a linear function comprised of the current state (), the potential new state (), individual attributes (), and attributes at a dyadic level () as below:
The weight, , indicating the power of the different variables, , is estimated by simulations. Snijders [63] suggests an iterative Markov chain Monte Carlo algorithm as a method of the estimation method in SIENA. One of the advantages of SAOM is that the estimation value is constant to its final value, in order to evaluate the goodness of fit of the model and the standard errors so that the different parameter estimates of SAOM can be interpreted as non-standardized coefficients obtained from logistic regression analysis. Thus, the parameter estimates are a log-odds ratio, and they can be directly interpreted as how the log-odds of the link formation change with one unit change in the corresponding independent variable.
In this model, the structural effect is controlled by the density and reciprocity effect. The density effect is calculated by out-degree of longitudinal network analysis, as described in Table 3. According to Snijders et al. [64], the density effect needs to be included in the models using SIENA in order to control for the observed density of the network and to explain the general likelihood to transmit. The reciprocity effect is also included because the technology transfer network is a directed relation network. The underlying assumption is that regions will exchange technology with those from whom they already import technology, which is also considered as a basic variable in the directed network analysis. In the context of the uncertainty of pecuniary-compensated technology, reciprocity is interpreted as the path-dependent feature in that the region tends to transfer already-proven partners.
Table 3.
Description of rate function variables.
3.4. Objective Function Variables
In order to measure how regions are involved in technology activities, the individual attributes of regions include four variables: Foreign technology acquired, patents per population, technology licensing-in, and technology licensing-out. The number of foreign patents represents the exogenous inflow of technology that enhances the capacity of a region. The innovative capacity is reflected in the total number of patents normalised by the population [65]. If the estimated coefficient of a foreign patent has a positive signal, then the exogenous technology flow contributes to the evolution of the network. On the other hand, the positive effect of the patent number signals that domestic patent growth significantly determines the region’s technology flows. The licensing activities—licensing out and in—are included in the model as the attributes. The licensing-out of a patent implies that a region has enough innovative capacity and quality of technology to diffuse its technologies to the other regions. The licensing-in, however, represents how a region actively imports other regions’ patents. The descriptive statistics are presented in Table 4.
Table 4.
Descriptive statistics of objective function variables.
4. The Brokerage Patterns of Anchor Regions and the Dynamics of Network
4.1. The Brokerage Patterns of Three Anchor Regions
Table 5 reports the GF frequencies of brokerage activities of three regions—Beijing, Shanghai, and Shenzhen—representing BGR, YRD, and PRD, respectively. Beijing recorded the largest number of brokerage activities, reaching 2369 in 2010 (Table 5). As a national capital region, the presence of major public institutes and universities has highlighted Beijing as a brokerage region in the nation as well as BGR. The bifurcated roles are the liaison (43.5%) and consultant (43.4%), occupying almost 87% of the total brokerage activities. These two roles imply that Beijing mediates technologies outside of BGR, serving as a national-wide technology source. Then, the ratio is followed by a representative and gatekeeper. It is worth noting that both brokerage roles related to the neighbour regions in the megalopolis have lower significance. The comparison between the two roles is that Beijing tends to diffuse the accumulated technologies in the BGR toward the regions in the other super-regions. The ratio of a coordinator is substantially lower than the other roles. It seems to be clear that Beijing does not transmit the technologies among the neighbour regions in the BGR.
Table 5.
GF brokerage frequencies and ratios (by regions).
On the other hand, Shanghai, the anchor hub in YRD, has a more balanced brokerage pattern than Beijing has. The total frequency also marked the highest point (1718) in 2011, but sharply dropped in 2012. The highest role of Shanghai is a consultant (29.1%) followed by gatekeeper (21.9%), liaison (21.8%), and representative (20.8%). However, the dispersed distribution among these three roles imply that Shanghai serves as national and regional brokerage sources of technology. According to Huggins, Luo, and Thompson [10], YRD has a longer tradition of openness than the other megalopoleis and established a strong industrial foundation for modern technology development. The hierarchical structure of knowledge transmission consisting of highly competitive city, such as Wuxi and Suzhou, is likely to affect the balance of the brokerage roles of Shanghai. The lowest ratio of a coordinator also corroborates that Shanghai is also not involved with the intra-megalopolis technology transmission.
Last, Shenzhen seems to have an intermediary pattern between Beijing and Shanghai. Shenzhen also has bifurcated roles—consultant and liaison—however, they are not as dominant as Beijing. The most frequent role is a consultant (35.5%), followed by a liaison (34.8%), a representative (14.6%), and a gatekeeper (13.7%). Consistent with the two other regions, the ratio of coordinator is the lowest. The rank order shows that Shenzhen also tends to play the role of a nation-wide broker, while the total frequency is lower than the other two regions. Even the highest frequency (662) in 2009 is less than half of the other two regions.
4.2. The Estimation of Network Dynamics
This section estimates the dynamics of the network and the contribution of the brokerage types by applying a ‘conditional method of moments’ for a longitudinal dataset [59]. The convergence ratio value that compares the deviations between simulated values and observed values is 0.283, indicating that the goodness-of-fit of the model is appropriate for the model. Table 6 reports the four models, starting from a structure effect-only (model 1) to the full model (model 4).
Table 6.
Estimation results.
Let us turn to model (1), which includes only structural effect variables. The rate function explains the longitudinal progression of the technology transfer network. The rate refers to the expected frequencies with which regions have the opportunity to change a network tie from between to +1. The rate () plunges from 27.11 to 0.007 (); then it maintains at 0.007 at the end of the period (). The network has a substantial change from 2009 to 2010, then a sharp decrease rate of the next period (2010 to 2011) indicates that fewer opportunities exist to change relationships in the last two periods than in the previous ones. After the relationship is established, then the nodes do not seem to easily change their relationships with their partners, which is interpreted as the path-dependency in the market-mediated technology. A similar pattern is consistently found through the other three models. The density of the network has a significant, but negative value (−1.435). On the other hand, the reciprocity has a positive coefficient (1.09), which is observed widely in the other empirical works [59]. In the social network context, the higher density level is related to the higher opportunity cost in the establishment of a relation. If a node is positioned in the highly dense position, then the node is less likely to have an opportunity to change the previous relationship. Thus, given the high-density effect, the probability of changing its tie decreases and yields a negative sign of the variable. The positive and significant value of reciprocity also reflects that technology is transmitted with the partners that have already connected, denoting that those mutually-proven partners are likely to involve another transfer.
Model 2 is dedicated to explaining the longitudinal change of a network through the individual attribute of each region. The interpretation of the coefficient is as non-standardized coefficients, similar to that of the logistics regression model. Each coefficient is basically a log odds-ratio, and it indicates how the log-odds of relation formation changes with a unit change in the corresponding independent variable. The exogenous foreign technology has a positive and significant, but weak value (0.0011). The patent number of a region, however, has a negative effect (−0.083). Then, regions have the tendency to transmit technology to other regions when they have already accumulated technologies from overseas countries. At the same time, even if the region has a higher level of the domestic patent, they do not seem to be involved in exchanging technology with others. It also corroborates the idea that nodes exposed to direct relationships with foreign nodes, through formal technology agreements or informal know-how contact, are expected to gain preferential access to knowledge [66].
The next two variables examine whether a region’s previous licensing activity matters in the evolution of the network. While the observed license-in value has not gained statistical significance, license-out has a positive effect, with a significance level of 0.01 (0.0016). The result confirms that the regions prefer to transmit technology to other regions that already have previous experiences of a technology licensing-out contract, which is consistent with Belso-Martínez et al. [67]’s work in that the previous knowledge mediating experience facilitates the creation of partnerships, thus fostering brokerage. The influence of accumulated licensing-out experiences also seems to be determined by the strategic risk-aversion decisions of licensor regions. The interpretations of the contradictory significance level of two licensing variables would be that the potential licensing-in regions do not consider how many technologies are imported to the partner regions, rather they seem to consider that the licensing-out records matter more.
Model 3 captures the contribution of the GF brokerages of three regions except for a coordinator, which has a substantially low frequency. Considering the differences between the four coefficients, it confirms the idea that all the brokers have an identical effect on the network growth process. In this case, the brokerage roles played by the anchor regions influenced the network evolution in either a positive or negative way. The interesting result is the different signs of the coefficients between a gatekeeper and a representative (−0.012 and 0.025, respectively). The consultant has a small, but positive effect (0.008). Nevertheless, liaison was estimated to have a negative effect (−0.012). Reflecting the types of the brokerage on the basis of the social network theory, the brokerage role as a liaison appears to have the opportunity to benefit from intermediating between heterogeneous groups [53].
The common feature of the two positive estimation values (representative and consultant) is that an anchor region has more influence on the regions outside of its own super-region. The representative, which acquires technology knowledge from other co-located regions, acts as the technology source for other regions. As a consultant role, an anchor region connects only with regions located outside of the super-region, thus connecting other regions. Contrarily, the gatekeeper, acquiring from the regions outside of the super-region, acts as a technology source for the regions inside of its own super-regions. The liaison connects different regions in different super-regions. To sum up, the main contribution of anchor regions, in the perspective of the national innovation system, is directed to the external regions outside rather than inside of the super-regions [65].
Model 4 maintains a similar result of the rate function as the previous models. The first difference in the objective function is the negative sign of the number of patent purchases (License_In), which was already anticipated in the previous model. It is clear that, given the other variables, a region’s experiences in purchasing technology have little, but a negative effect on the evolution. The second point is that the two variables (gatekeeper and representative) that are related to the anchor regions’ megalopolis are estimated with no significance power. Nonetheless, the effect of the other two variables (consultant and liaison) turned to reverse effects. It is plausible that the two major roles have a significant effect on the evolution of a whole network, while the effects are in opposite directions. Following the idea of [53], who hypothesized the positive relation between the liaison role and innovative network, the positive coefficient of the liaison corroborates that it gains benefit from brokering between different super-regions, taking advantage of diverse technology sources. The role of a consultant, however, is estimated to be a negative effect on the evolution process. Despite its highest frequency, given the control of the other variables’ effect, the mediation of technology between the regions is in another megalopolis.
5. Conclusions
This research intended to identify the contribution of brokerage roles for the growth of a technology innovation network. To this end, the current analysis employed the GF brokerage concept to capture the technology flow patterns at the region-to-region level, demonstrating the three anchor regions’ brokerage patterns. The GF framework found that Beijing and Shenzhen tend to transmit technology as a nation-wide hub in the national innovation system, rather than a local hub in the megalopolis. Shanghai seems to serve as a more balanced broker region both as a local diffuser and a nation-wide hub. This result shows that the Chinese anchor regions have two different patterns—nationwide hub and local megalopolis hub. This finding has a practical implication for regional policy makers in that some anchor regions in the megalopolis might be evolved into national technology sources, while the other brokerage type might remain as a local hub. This issue motivates a discussion of the strategic allocation of limited resources in the sense of whether well-established brokerage regions (geographical clusters as well) are effective in enhancing the innovative capacity of a nation, calling for attention to be given to fast-growing economy countries.
While the canonical studies of a brokerage position in the network have remained constant in identifying the positive association with performance, this research contributes to this literature further by disentangling the positive and negative effect of brokerage activities. The dynamic evolution analysis reported the path-dependent tendency of the technology flow network. It also corroborates that the regions with a higher ratio of direct relationships with foreign technologies are highly likely to gain preferential access by other regions. Then, the contradictory significance level of two licensing variables implies that a potential technology purchaser seems to consider the licensing-out records of the potential partner. It is also worth noting that the quantitative analysis supports that a liaison among brokerage types contributes to the evolution of the network. The result corroborates the hypothesis that the growth of a network led by a broker benefits from intermediating two heterogeneous sources, improving the efficiency of technology flow in the system. The identification of different patterns in the analysis provides practical implications to regional policymakers in addressing innovation policy, in that the brokerage role as a liaison is more effective to economic development based on sustainable technology innovation.
This research is not exempt from some limitations. First, this research presumes that all the licensing agreements have equal value without concerning the market value of each agreement. The official regulation by the Chinese patent authority allows one to trace the license information, which provides an exceptional research opportunity for investigating market-mediated technology flow. However, the payment scheme of a licensing agreement is not a mandatorily required to be open to the public, implying that the technology flow in this research cannot clearly illustrate the market value. Second, the current inter-region flow network does not control specific aspects of the individual technology sector. A different tendency over patent activities, patent institution types, and licensing patterns across technology sectors might exist, which might not isolate the region-specific effect. Future studies conducted in multiple technology sectors and industry-level settings might highlight the validity of the theoretical positions developed in the current research.
Funding
This research received no external funding.
Acknowledgments
I am grateful to two anonymous referees for their useful comments and suggestions.
Conflicts of Interest
The author declares no conflict of interest.
References
- Sun, L.; Spekkink, W.; Cuppen, E.; Korevaar, G. Coordination of industrial symbiosis through anchoring. Sustainability 2017, 9, 549. [Google Scholar] [CrossRef]
- Simme, J. Innovation Networks and Learning Regions? Routledge: London, UK, 2004. [Google Scholar]
- Fritsch, M.; Slavtchev, V. Determinants of the Efficiency of Regional Innovation Systems. Reg. Stud. 2008, 45, 905–918. [Google Scholar] [CrossRef]
- Fritsch, M.; Stephan, A. Regionalization of innovation policy—Introduction to the special issue. Res. Policy 2005, 34, 1123–1127. [Google Scholar] [CrossRef]
- Fritsch, M.; Kauffeld-Monz, M. The impact of network structure on knowledge transfer: An application of social network analysis in the context of regional innovation networks. Ann. Reg. Sci. 2008, 44, 21–38. [Google Scholar] [CrossRef]
- Vaz, T.d.N.; Nijkamp, P. Knowledge and innovation: The strings between global and local dimensions of sustainable growth. Entrep. Reg. Dev. 2009, 21, 441–455. [Google Scholar] [CrossRef]
- Asheim, B.; Gertler, M.S. The geography of innovation: Regional innovation systems. In The Oxford Handbook of Innovation; Oxford University Press: Oxford, UK, 2005; pp. 291–317. [Google Scholar]
- Hou, J.; Chen, H.; Xu, J. External knowledge sourcing and green innovation growth with environmental and energy regulations: Evidence from manufacturing in China. Sustainability 2017, 9, 342. [Google Scholar] [CrossRef]
- Nooteboom, B.; Van Haverbeke, W.; Duysters, G.; Gilsing, V.; van den Oord, A. Optimal cognitive distance and absorptive capacity. Res. Policy 2007, 36, 1016–1034. [Google Scholar] [CrossRef]
- Huggins, R.; Luo, S.; Thompson, P. The competitiveness of China’s leading regions: Benchmarking their knowledge-based economies. Tijdschr. Econ. Soc. Geogr. 2014, 105, 241–267. [Google Scholar] [CrossRef]
- Van Oort, F.G.; Lambooy, J.G. Cities, knowledge, and innovation. In Handbook of Regional Science; Springer: Berlin/Heidelberg, Germany, 2014; pp. 475–488. [Google Scholar]
- Boschma, R.A.; Frenken, K. Why is economic geography not an evolutionary science? Towards an evolutionary economic geography. J. Econ. Geogr. 2006, 6, 273–302. [Google Scholar] [CrossRef]
- Gluckler, J. Economic geography and the evolution of networks. J. Econ. Geogr. 2007, 7, 619–634. [Google Scholar] [CrossRef]
- Breschi, S.; Lissoni, F. Knowledge Spillovers and Local Innovation Systems: A Critical Survey. Ind. Corp. Chang. 2001, 10, 975–1005. [Google Scholar] [CrossRef]
- Boschma, R. Proximity and Innovation: A Critical Assessment. Reg. Stud. 2005, 39, 61–74. [Google Scholar] [CrossRef]
- Almeida, P.; Kogut, B. Localization of knowledge and the mobility of engineers in regional networks. Manag. Sci. 1999, 45, 905–917. [Google Scholar] [CrossRef]
- Sapsed, J.; Grantham, A.; DeFillippi, R. A bridge over troubled waters: Bridging organisations and entrepreneurial opportunities in emerging sectors. Res. Policy 2007, 36, 1314–1334. [Google Scholar] [CrossRef]
- Wink, R. Integrative technologies and knowledge gatekeepers: Bridging the gap between epistemic communities in the case of stem cell science. Int. J. Learn. Chang. 2008, 3, 57–74. [Google Scholar] [CrossRef]
- Watts, D.J.; Strogatz, S.H. Collective dynamics of ‘small-world’ networks. Nature 1998, 393, 440. [Google Scholar] [CrossRef]
- Boari, C.; Lipparini, A. Networks within industrial districts: Organising knowledge creation and transfer by means of moderate hierarchies. J. Manag. Gov. 1999, 3, 339–360. [Google Scholar] [CrossRef]
- Giuliani, E. Role of Technological Gatekeepers in the Growth of Industrial Clusters: Evidence from Chile. Reg. Stud. 2011, 45, 1329–1348. [Google Scholar] [CrossRef]
- Graf, H.; Krüger, J.J. The performance of gatekeepers in innovator networks. Ind. Innov. 2011, 18, 69–88. [Google Scholar] [CrossRef]
- Morrison, A. Gatekeepers of knowledge within industrial districts: Who they are, how they interact. Reg. Stud. 2008, 42, 817–835. [Google Scholar] [CrossRef]
- Munari, F.; Sobrero, M.; Malipiero, A. Focal firms as technological gatekeepers within industrial districts: Knowledge creation and dissemination in the Italian packaging machinery industry. Ind. Corp. Chang. 2012, 21, 429–462. [Google Scholar] [CrossRef]
- Allen, T.J. Managing the Flow of Technology: Technology Transfer and the Dissemination of Technological Information within the R&D Organization; MIT Press: Cambridge, MA, USA, 1977. [Google Scholar]
- Bathelt, H.; Malmberg, A.; Maskell, P. Clusters and knowledge: Local buzz, global pipelines and the process of knowledge creation. Prog. Hum. Geogr. 2004, 28, 31–56. [Google Scholar] [CrossRef]
- Munari, F.; Sobrero, M.; Malipiero, A. Absorptive capacity and localized spillovers: Focal firms as technological gatekeepers in industrial districts. Ind. Corp. Chang. 2011, 21, 429–462. [Google Scholar] [CrossRef]
- Ter Wal, A.L.J.; Boschma, R. Co-evolution of Firms, Industries and Networks in Space. Reg. Stud. 2009, 45, 919–933. [Google Scholar] [CrossRef]
- Maggioni, M.A.; Uberti, T.E. Networks and geography in the economics of knowledge flows. Qual. Quant. 2011, 45, 1031–1051. [Google Scholar] [CrossRef]
- Boari, C.; Riboldazzi, F. How knowledge brokers emerge and evolve: The role of actors’ behaviour. Res. Policy 2014, 43, 683–695. [Google Scholar] [CrossRef]
- Seo, I.; Sonn, J.W. The persistence of inter-regional hierarchy in technology transfer networks: An analysis of Chinese patent licensing data. Growth Chang. 2019, 50, 145–163. [Google Scholar] [CrossRef]
- Mayer, H.; Cowell, M. Capital cities as knowledge hubs: The economic geography of homeland security contracting. In Hub Cities in the Knowledge Economy: Seaports, Airports, Brainports; Routledge: New York, NY, USA, 2016; pp. 223–246. [Google Scholar]
- Gould, R.V.; Fernandez, R.M. Structures of mediation: A formal approach to brokerage in transaction networks. Sociol. Methodol. 1989, 19, 89–126. [Google Scholar] [CrossRef]
- Balland, P.-A. Proximity and the Evolution of Collaboration Networks: Evidence from Research and Development Projects within the Global Navigation Satellite System (GNSS) Industry. Reg. Stud. 2012, 46, 741–756. [Google Scholar] [CrossRef]
- Broekel, T.; Balland, P.-A.; Burger, M.; van Oort, F. Modeling knowledge networks in economic geography: A discussion of four methods. Ann. Reg. Sci. 2014, 53, 423–452. [Google Scholar] [CrossRef]
- Spiro, E.S.; Acton, R.M.; Butts, C.T. Extended structures of mediation: Re-examining brokerage in dynamic networks. Soc. Netw. 2013, 35, 130–143. [Google Scholar] [CrossRef]
- Fernandez, R.M.; Gould, R.V. A dilemma of state power: Brokerage and influence in the national health policy domain. Am. J. Sociol. 1994, 99, 1455–1491. [Google Scholar] [CrossRef]
- Lazaric, N.; Longhi, C.; Thomas, C. Gatekeepers of Knowledge versus Platforms of Knowledge: From Potential to Realized Absorptive Capacity. Reg. Stud. 2008, 42, 837–852. [Google Scholar] [CrossRef]
- McEvily, B.; Zaheer, A. Bridging ties: A source of firm heterogeneity in competitive capabilities. Strateg. Manag. J. 1999, 20, 1133–1156. [Google Scholar] [CrossRef]
- Zaheer, A.; Bell, G.G. Benefiting from network position: Firm capabilities, structural holes, and performance. Strateg. Manag. J. 2005, 26, 809–825. [Google Scholar] [CrossRef]
- Hargadon, A.; Sutton, R.I. Technology brokering and innovation in a product development firm. Adm. Sci. Q. 1997, 42, 716–749. [Google Scholar] [CrossRef]
- Tushman, M.L.; Katz, R. External communication and project performance: An investigation into the role of gatekeepers. Manag. Sci. 1980, 26, 1071–1085. [Google Scholar] [CrossRef]
- Tushman, M.L.; Scanlan, T.J. Boundary spanning individuals: Their role in information transfer and their antecedents. Acad. Manag. J. 1981, 24, 289–305. [Google Scholar]
- Cross, R.; Cummings, J.N. Tie and network correlates of individual performance in knowledge-intensive work. Acad. Manag. J. 2004, 47, 928–937. [Google Scholar]
- Rodan, S.; Galunic, C. More than network structure: How knowledge heterogeneity influences managerial performance and innovativeness. Strateg. Manag. J. 2004, 25, 541–562. [Google Scholar] [CrossRef]
- Capello, R. Spatial transfer of knowledge in high technology milieux: Learning versus collective learning processes. Reg. Stud. 1999, 33, 353–365. [Google Scholar] [CrossRef]
- Burt, R.S. Brokerage and Closure: An Introduction to Social Capital; Oxford University Press: Oxford, UK, 2005. [Google Scholar]
- Sundaram, A.K.; Black, J.S. The environment and internal organization of multinational enterprises. Acad. Manag. Rev. 1992, 17, 729–757. [Google Scholar] [CrossRef]
- Zaheer, A.; Hernandez, E.; Banerjee, S. Prior Alliances with Targets and Acquisition Performance in Knowledge-Intensive Industries. Organ. Sci. 2010, 21, 1072–1091. [Google Scholar] [CrossRef]
- Giuliani, E.; Bell, M. The micro-determinants of meso-level learning and innovation: Evidence from a Chilean wine cluster. Res. Policy 2005, 34, 47–68. [Google Scholar] [CrossRef]
- Messeni Petruzzelli, A.; Albino, V.; Carbonara, N.; Rotolo, D. Leveraging learning behavior and network structure to improve knowledge gatekeepers’ performance. J. Knowl. Manag. 2010, 14, 635–658. [Google Scholar] [CrossRef]
- Neal, J.W.; Neal, Z.P.; Kornbluh, M.; Mills, K.J.; Lawlor, J.A. Brokering the Research–Practice Gap: A typology. Am. J. Community Psychol. 2015, 56, 422–435. [Google Scholar] [CrossRef]
- Boari, C.; Molina-Morales, F.X.; Martínez-Cháfer, L. Direct and interactive effects of brokerage roles on innovation in clustered firms. Growth Chang. 2017, 48, 336–358. [Google Scholar] [CrossRef]
- Giuliani, E. Network dynamics in regional clusters: Evidence from Chile. Res. Policy 2013, 42, 1406–1419. [Google Scholar] [CrossRef]
- Audretsch, B. Agglomeration and the location of innovative activity. Oxf. Rev. Econ. Policy 1998, 14, 18–29. [Google Scholar] [CrossRef]
- Zhao, S.X.; Zhang, L. Foreign direct investment and the formation of global city-regions in China. Reg. Stud. 2007, 41, 979–994. [Google Scholar] [CrossRef]
- Baltagi, B.H. Forecasting with panel data. J. Forecast. 2008, 27, 153–173. [Google Scholar] [CrossRef]
- Ter Wal, A.L. The dynamics of the inventor network in German biotechnology: Geographic proximity versus triadic closure. J. Econ. Geogr. 2013, 14, 589–620. [Google Scholar] [CrossRef]
- Vicente, J.; Balland, P.A.; Brossard, O. Getting into networks and clusters: Evidence from the Midi-Pyrenean Global Navigation Satellite Systems (GNSS) collaboration network. Reg. Stud. 2011, 45, 1059–1078. [Google Scholar] [CrossRef]
- Balland, P.-A.; Boschma, R.; Frenken, K. Proximity and Innovation: From Statics to Dynamics. Reg. Stud. 2015, 49, 907–920. [Google Scholar] [CrossRef]
- Steglich, C.; Snijders, T.A.B. Dynamic networks and behavior: Separating selection from influence. Sociol. Methodol. 2010, 40, 329–393. [Google Scholar] [CrossRef]
- Hansen, L.P.; Scheinkman, J.A. Back to the Future: Generating Moment Implications for Continuous-Time Markov Processes; National Bureau of Economic Research: Cambridge, MA, USA, 1993. [Google Scholar]
- Snijders, T.A. The statistical evaluation of social network dynamics. Sociol. Methodol. 2001, 31, 361–395. [Google Scholar] [CrossRef]
- Snijders, T.A.; Van de Bunt, G.G.; Steglich, C.E. Introduction to stochastic actor-based models for network dynamics. Soc. Netw. 2010, 32, 44–60. [Google Scholar] [CrossRef]
- Breschi, S.; Lenzi, C. Are Gatekeepers Important for the Renewal of the Local Knowledge Base? Evidence from US Cities. In Knowledge and Networks; Springer: Berlin/Heidelberg, Germany, 2017; pp. 291–313. [Google Scholar]
- Spencer, G.M. The Economic Impact of Anchor Firms and Industrial Clusters: An Analysis of Canadian and American Manufacturing Firms and Clusters; Industry Canada: Toronto, ON, Canada, 2013; pp. 1–30.
- Belso-Martínez, J.A.; Expósito-Langa, M.; Mas-Verdú, F.; Molina-Morales, F.X. Dynamics of Brokerage Positions in Clusters: Evidence from the Spanish Foodstuffs Industry. Sustainability 2017, 9, 290. [Google Scholar] [CrossRef]


© 2019 by the author. Licensee MDPI, Basel, Switzerland. This article is an open access article distributed under the terms and conditions of the Creative Commons Attribution (CC BY) license (http://creativecommons.org/licenses/by/4.0/).