Abstract
In the industrial environment, individual enterprises survive by obtaining specific resources. Niche theory uses adaptations of the organizational niche and the environment to explain the survival opportunities of generalist and specialist organizations. However, it does not explain in depth the key to the sustainable development of many enterprises with poor conditions, which have productive social relationships and can obtain the resources that are needed for sustainable development from these relationships. In this study, 106 valid questionnaires were obtained through e-mail. Taiwanese firms investing in China were taken as the enterprise groups, and SPSS statistical software was used to test the empirical relationships among niche characteristics, network relationships, and enterprise performance. The research draws the following conclusions. (1) When the external environment changes unfavorably, the financial performance of firms with a high degree of network embeddedness and large niche width is poorer than that of firms with a low degree of network embeddedness. (2) When the external environment changes unfavorably, the financial performance of firms with a low degree of network centrality and high niche specificity is better than that of firms with a high degree of network centrality. These results can provide suggestions for management theory and practice.
1. Introduction
The niche of an organization is reflected in its degree of specialization. Specialist and generalist organizations pursue different competitive strategies, have different organizational structures and capabilities, and possess different types of resources [1]. Enterprise niche research has been one of the hot topics in the field of organizational ecology and strategic management in recent years [1,2,3,4]. A niche can not only show the actual results of relationships between enterprise groups, it also is the power and reason for the occurrence and development of community characteristics, competition, and evolution among enterprises. Niche characteristic measures include niche width and niche overlap, which are based on the distribution data of enterprises in a series of resource states. However, niche theory has not fully explained how enterprises with different niche characteristics can use the conditions of their environment to obtain the resources that they need for sustainable development, which is a research issue of great concern in the field of strategic management [1]. In the theory of strategic management, it is fully emphasized that the sustainable development of an organization must be matched with the internal management system and the external competitive environment [5]. Therefore, when an enterprise formulates a strategy, it must also consider the external organizational factors of relevant stakeholder groups (include customer preferences, supplier strategies, competitor trends, etc.) beyond the organizational boundaries [6,7].
The application in strategic management is mainly focused on the relationship between enterprise niche and sustainable development [8]. As a new theory, the main problem of enterprise niche theory is the lack of a consistent analytical framework. Therefore, in strategic management, the application of an enterprise niche often ignores interactions between different factors [1]. In addition, the empirical study of enterprise niches needs more samples and complete data, which are difficult to achieve [9]. Without these, the research lacks universality and reliability regarding its conclusions. Studying the application of enterprise niches in strategic management must be based on a new viewpoint and focus on an organization’s attributes.
According to the view of ecological theory, only a range of enterprises with a variety of means to obtain the resources that they need for sustainable development can survive after experiencing great changes in the environment. However, although some enterprises focus on specific markets, they can still survive an environmental crisis. For an example, H Company, which manufactures industrial cooling machines, is attached to the supply system of machine tool manufacturers and is responsible for the production of key components required by machine tools. Although the product category is single, it can be sold to various industries. This will enable it to adapt to changes in the industrial environment and adopt appropriate practices. This cooperative and symbiotic relationship between enterprises is the natural choice of organizing individuals to take advantage of group strength when facing environmental pressure [10]. Although niche theory explains the survival opportunities of generalist and specialist organizations by adapting the organizational niche and the environment, enterprises do not exist independently in the ecosystem. They must interact with the natural environment, business environment, and other external environments in order to achieve the sustainable development of resources. Network theory provides an appropriate perspective on how an enterprise can effectively contact and interact with its members in the external environment [11,12,13,14,15]. By introducing the network perspective into the discussion of the sustainable development of enterprises in the ecosystem, it is more possible to understand the overall strategic layout of enterprises in niche selection and network relationship building. On the other hand, both organizational ecology and strategic management studies have emphasized the importance of the niche concept in understanding different aspects of competition dynamics, but have not further explored the impact of the enterprise niche on enterprise performance [16]. The factors that affect enterprise performance are the issues of most concern to enterprises and management scholars.
Therefore, this study puts forward a feasible research plan for the study of the niche strategy selection of enterprises after environmental changes and how it affects their performance, as well as the role and influence of enterprise network relationships. Based on niche theory, this study explores the niche strategy selection of Taiwanese firms investing in China, and enriches the existing research in the field of strategic management from the perspective of the organizational exterior of social network theory. This study re-examines, from the viewpoint of network theory, the niche characteristics and network relationships that will produce better performance for enterprises facing changes in the external environment. The traditional niche theory provides a good starting point for explaining the natural selection of enterprises caused by environmental changes. This study uses the investment area as the “ethnic group” division—using Taiwanese firms that invest in China or are in eastern and southern China—applies the niche theory in ecology to the discussion of the sustainable development of enterprises, and gives relevant operational suggestions to other enterprises.
2. Literature Review and Hypothesis Development
Niche theory has shown that the criteria for environmental selection tend to support generalist organizations better than specialist organizations, mainly depending on the variation patterns and duration of fluctuations in the environment. Generalist organizations with large variations in resource utilization have better performance due to their surplus capacity and resources in response to environmental changes, thus avoiding the threat of being eliminated from the environment [17,18]. For example, Dobrev et al. [17] pointed out that the competition between GM and Ford was finally won by GM, which had better product market positioning. The niche width of this study includes product, process, and technology niche width. Enterprises with a large niche width of products have multiple channels of resources that are needed for sustainable development. If a certain product market is affected by the environment, these enterprises can still make up for the impact caused by environmental fluctuations through other product markets [16,19]. The niche width of the process indicates that the integration of business activities depends on whether the value activity is related to competitive advantage, scale, confidentiality, and other factors for the enterprise. Enterprises with a wide array of value activities can obtain market information at each stage of the activity, and are more alert to market changes than enterprises that specialize in a single value activity [2,16]. Many studies use the activities of enterprises involved in technological fields as a measure of enterprise niche, pointing out that the wider the scope of the technological fields invested in research and development, the greater the chances of sustainable development [17,20,21,22]. Therefore, the research hypotheses of this inference are as follows:
Hypothesis 1 (H1).
Niche width has a positive effect on sustainable development.
Hypothesis 1a (H1a).
Firms with larger niche width have better financial performance.
Hypothesis 1b (H1b).
Firms with larger niche width have better nonfinancial performance.
The competitive relationships between organizations (or ethnic groups) cannot usually be studied through direct observation, so niche overlap can be used to explain and discuss competitive relationships by observing the utilization of resources, and can then be used to learn the dynamic growth model of organizations (or ethnic groups) under the condition of resource overlap. When the number of enterprises relying on similar resource spaces increases, the space for growth will be squeezed, leading to niche congestion, and thus intensifying competition [23,24]. In research on telephone companies, Barnett [25] found that organizations did not share the same technology niche and were responsible for implementing different parts in the technology system, which could reduce the failure rate of telephone companies. Enterprises with a special niche can create value by providing products or operating processes that are different from those of their competitors. The higher the specificity of the products or processes, the less competitive pressure they face, and the more they can avoid the pressure of price cuts, thus obtaining better economic profits [16]. Strategic management also claims that differences in enterprise performance are caused by differences in strategic positioning (customer needs, products, services provided by the enterprise). The essence of strategy is to choose activities that are different from those of competitors. Scholars have shown that a hybrid position between efficiency and differentiated strategic positioning can lead to good results [26]. Therefore, if an enterprise can occupy a unique niche, it can avoid direct price competition with competitors and produce irreplaceable value, which is conducive to improving its performance. Therefore, the inference hypotheses of this study are as follows:
Hypothesis 2 (H2).
Niche specificity has a positive effect on sustainable development.
Hypothesis 2a (H2a).
Firms with higher niche specificity have better financial performance.
Hypothesis 2b (H2b).
Firms with higher niche specificity have better nonfinancial performance.
Previous studies have pointed out that the influence of niche characteristics on enterprises must take into account contingency factors, such as market concentration [27], institutional linkages [28], interorganizational linkages [29], and network embeddedness [16]. In order to explore the relationship between niche characteristics and enterprise performance, this study regards the network relationship as a contingency factor that affects the relationship between niche characteristics and enterprise performance, indicating that the enterprise is not in a social vacuum, but rather needs to consider other manufacturers when making any decision, including what products to provide, how to implement the operation process, and the research activities in which to invest [11,30,31]. From the perspective of network groups, this study explores the influence of the degree of embeddedness and centrality of network relationships on the relationship between niche characteristics and enterprise performance. The network of relationships among manufacturers provides a channel through which valuable information and resources can be shared, and organizations can reduce the uncertainty faced by channels that obtain needed inputs from outside or sell their outputs through the network connections among manufacturers. Such network relationships provide enterprises with survival opportunities and restrictions embedded in the network ecosystem, and affect their behavior and performance [32,33].
Network relationships are double-edged. In a highly embedded network relationship, enterprises and manufacturers are closely linked to each other. Such a network structure can provide enterprises with multiple but repeated sources of information, ensure the correctness of information, let network members know one another through circular interaction, generate familiarity and trust, and prevent speculative behavior [34,35,36]. On the other hand, highly embedded network relationships will form a normative force, which will restrict the decision making and behavior of enterprises [37]. Through providing products and services to customers in a variety of target markets or industries, engaging in a variety of upstream and downstream value activities, and investing in research and development activities in a variety of technical fields, widely operating enterprises scatter their resources in various niche spaces, striving for a central market position and facing more severe tests and competition [27]. If they are embedded in a tight network relationship, they must often discuss the design of new products, the development of new technologies, and the improvement of product quality and cost with customer manufacturers. They are subject to the requirements of customers in the mainstream market for a long time, and develop the capabilities, organizational structure, and culture required by the value network. Therefore, they cannot make decisions effectively and respond to changes brought about by breakthrough innovations in the scientific and technological environment in a timely manner. On the contrary, enterprises that (i) provide products and services to customers in a single or a few target markets or industries, (ii) engage in a single value activity or a few upstream and downstream value activities, and (iii) devote themselves to research and development activities in a single field or a few technical fields obtain several operational advantages. They concentrate their resources in a single or a few niche spaces, survive in the market’s leading positions [27], are attached to a certain supply system, and are responsible for producing key components.
In order to survive, specialist organizations in which the variation of resource utilization is smaller than that of generalist organizations have to contact the core manufacturers in the ecosystem and establish external relationships to seek support and assistance [38,39]. Through being embedded in close network relationships, professional organizations enhance their importance in the supply system by regularly discussing the design of new products, developing new technologies, and improving the interaction between product quality and cost with customer vendors to meet their requirements. Highly embedded network relationships can promote the accumulation of enterprise knowledge and the exchange of important information and business technologies [40,41]. Professional organizations maintain good relationships with customer manufacturers, can jointly solve problems and obtain direct feedback, and can improve products, technologies, and services through collective discussions, thus contributing to enterprise performance [42]. Based on the above discussions, this study posits that a high degree of network embedding creates more norms than opportunities for widely operating generalist organizations, which must meet the requirements of core vendors in various niche spaces, while specialist organizations need core vendors to provide the necessary resources for sustainable development and must cooperate with the requirements of customer vendors in order to enhance their importance in the supply system. Therefore, the inference hypotheses of this study are as follows:
Hypothesis 3 (H3).
The degree of network embeddedness has a moderating effect on the relationship between niche width and sustainable development.
Hypothesis 3a (H3a).
The degree of network embeddedness is high, and niche width has a greater negative impact on financial performance; in other words, when the degree of network embeddedness is high, the financial performance of firms with larger niche width is poorer, which is more obvious than when the degree of network embeddedness is low.
Hypothesis 3b (H3b).
The degree of network embeddedness is high and the niche width has a greater negative impact on nonfinancial performance; in other words, when the degree of network embeddedness is high, the nonfinancial performance of firms with larger niche width is poorer, which is more obvious than when the degree of network embeddedness is low.
When the products and services provided by enterprises are more unique, the business activities in which they engage are different from those of their competitors, and the technical fields in which they invest in research and development are less involved. As a result, they need more special market information to assist them [16,43]. In order to improve the quality of information and obtain complex and rapidly changing information, enterprises usually use highly embedded network relationships in order to ensure the correctness of information and obtain more favorable information [44,45]. Therefore, in highly embedded network relationships, enterprises can obtain complete and reliable market information that is conducive to the development of special products and services, operating modes, technical research, and so on, thus achieving better performance. Therefore, the inference hypotheses of this study are as follows:
Hypothesis 4 (H4).
The degree of network embeddedness has a moderating effect on the relationship between niche specificity and sustainable development.
Hypothesis 4a (H4a).
The degree of network embeddedness is high and niche specificity has a greater positive impact on financial performance; in other words, when the degree of network embeddedness is high, the financial performance of firms with higher niche specificity is better, which is more obvious than when the degree of network embeddedness is low.
Hypothesis 4b (H4b).
The degree of network embeddedness is high and niche specificity has a greater positive impact on nonfinancial performance; in other words, when the degree of network embeddedness is high, the nonfinancial performance of firms with high niche specificity is better, which is more obvious than when the degree of network embeddedness is low.
Enterprises have at least three kinds of capital with regard to commercial competition. The first is financial capital, including cash, bank deposits, investment returns, and lending channels. The second is human capital, which combines its own characteristics—charm, health, intelligence, and appearance—with skills acquired through formal education and work experience to enable people to excel over others in certain jobs. The third is social capital, or relationships with other manufacturers. Generally, social capital determines the rate of return on investment of a competitive enterprise, and certain conditions in the network structure and the position of its related parties in the whole social network structure will bring some competitive advantages to obtain higher rates of return on investment [11,46,47].
Under certain other conditions, having a large and diversified network relationship can ensure, to the greatest extent, that the related parties are in a place where valuable information is transmitted. However, if the network size is increased without considering the diversity of relationships, the function of the network will be weakened. Therefore, the key to increasing the network size is to increase the number of nonredundant contacts [11]. In other words, enterprises should create more unconnected structural holes to act as bridges between small groups in order to achieve the efficiency of information flow and diffusion [48,49]. Enterprises centered in structural holes can develop new insights, especially regarding emerging opportunities and threats [50]. However, when an enterprise joins a group, it is bound by the norms of the group. The more groups that participate, the greater the impact of the constraints on their behaviors and decisions. Therefore, when it comes to different subgroups, the network will be affected by the norms of the subgroups and will be more restricted. Enterprises that play a central role instead lose the autonomy of decision-making and behavior and become the biggest victims [36,51].
Widely operated enterprises, which provide products and services to customers in a variety of target markets or industries, engage in a variety of upstream and downstream value activities and invest in research and development activities in a variety of technical fields, spreading their resources among various spaces and striving for a central position in the market [27,52]. If a generalist organization is linked to a variety of network relationships, it must meet the requirements and norms of the members of the network in order to survive. The resources of the enterprise will be excessively dispersed to the different network relationships, resulting in an inability and lack of flexibility to cope with the impact of low-order or emerging markets. In contrast, specialist enterprises that provide products and services to customers in a single or a few target markets or industries, engage in single or a few upstream and downstream value activities, and invest in research and development activities in a single or a few technical fields lack diversified market information. If multiple network relationships can be obtained, valuable heterogeneous market information can be obtained, and competitiveness can be improved [53]. Based on the above discussion, centering a generalist organization with multiple resources and information will lead to an excessive dispersion of resources, which will be further regulated and restricted by more core manufacturers. Professional organizations that lack resources and market information can improve their capabilities through the resources and information provided by different network relationships. Therefore, the inference hypotheses of this study are as follows:
Hypothesis 5 (H5).
The degree of network centrality has a moderating effect on the relationship between niche width and sustainable development.
Hypothesis 5a (H5a).
The degree of network centrality is high, and niche width has a greater negative impact on financial performance; in other words, when the degree of network centrality is high, the financial performance of firms with larger niche width is poorer, which is more obvious than when the degree of network centrality is low.
Hypothesis 5b (H5b).
The degree of network centrality is high and niche width has a greater negative impact on nonfinancial performance; in other words, when the degree of network centrality is high, the nonfinancial performance of firms with larger niche width is poorer, which is more obvious than when the degree of network centrality is low.
When the products and services of enterprises are more unique, their business activities are different from those of their competitors, and their technical fields are covered less by competitors; thus, they need the assistance of more unique market information [2,16]. Enterprises that obtain links between multiple network relationships can obtain market information with unique characteristics, heterogeneity, and high value [53], which enables them to promote the development of special industries and products, operation modes, and technological research and development. However, too many network relationships that are not connected with one another will reduce the quality of information. It is impossible to ensure the reliability of market information and obtain more knowledge through repeated inspections [44,45], which will usually affect enterprise performance in developing a special niche [2,16]. Moreover, if they participate in too many network relationships, enterprises will be constrained by members in various relationships [36,51], affecting their behavior and decisions in response to environmental changes. Their prior location can enable enterprises with a special niche to obtain multiple supports and nonrepetitive market information; help develop special products, operating processes, and technological research; and improve their business performance. However, being highly centered in different network relationships will affect the reliability of market information and reduce the business performance of enterprises in the special niche. Therefore, the inference hypotheses of this study are as follows:
Hypothesis 6 (H6).
The degree of network centrality has a moderating effect on the relationship between niche specificity and sustainable development.
Hypothesis 6a (H6a).
The degree of network centrality is high, and niche specificity has a less positive impact on financial performance; in other words, when the degree of network centrality is low, the financial performance of firms with higher niche specificity is better, which is more obvious than when the degree of network centrality is high.
Hypothesis 6b (H6b).
The degree of network centrality is high and niche specificity has less positive impact on nonfinancial performance; in other words, when the degree of network centrality is low, the nonfinancial performance of firms with high niche specificity is better, which is more obvious than when the degree of network centrality is high.
3. Research Design and Methodology
3.1. Research Variable Measurement
The explained variable in this study is enterprise performance as a proxy variable of sustainable development. Corporate sustainable development can be defined as “meeting the needs of a company’s direct and indirect stakeholders that include employees, clients, pressure groups, communities, etc.” [54]. Companies engage in sustainable development activities to conform to stakeholder norms and expectations about how their operations should be conducted, because they expect that having good relationships with their stakeholders could lead to increased financial returns by helping to develop valuable intangible assets (resources and capabilities) that can be sources of competitive advantage, because such assets can differentiate a company from its competitors [8]. Based on the purpose of investment and development in other markets or regions, including asset utilization and search, the huge domestic market in the host country, the cost advantages of low-development countries, access to key raw materials and resources, and responses to competitors, if only financial performance or another single-scale indicator is used for measurement, it may not be possible to fully understand the impact of changes in location advantages on enterprise operations. Therefore, this study adopts Venkatraman and Ramanujam [55] multiscale indicators to address the proposal that enterprise performance can be measured more comprehensively. Multiscale indicators such as financial performance, customer satisfaction, internal processes, learning-and-growth, and other factors are used to measure enterprise performance [56]. The financial indicator refers to the accounting remuneration disclosed in the financial statements. The customer indicator refers to customer satisfaction with the product. The internal process indicator refers to the ability to design new products and respond to customers. The learning-and-growth indicator refers to the satisfaction of employees. These four performance indicators can be reduced to two categories: financial performance and nonfinancial performance [57]. In addition, based on the disputes regarding subjective and objective measurements of performance, the measurements of Beal and Yasai-Ardekani [58] and Naman and Slevin [59] were adopted.
The period 2007–2008 was a time when China’s market went through changes, including the rising prices of factors of production, changes in labor market conditions, tax laws, appreciation of the RMB, etc. First, the respondents were asked to weight the degree of importance (emphasis) of each performance indicator question on a five-point Likert scale; then, they were asked to weight their degree of satisfaction on these questions before 2007 and in their current business in China. The results of both were subtracted and multiplied by the weight as a result of performance measurement before and after environmental change [58,59]. We obtained performance data through scale design and questionnaires. The measurement items for enterprise performance were as follows: sales growth, asset return, and turnover growth rates; customer (manufacturer) satisfaction with products and services and willingness to continuously purchase company products; ability to develop new customers (manufacturers); new product design; ability to quickly respond to customer (manufacturer) requirements for products and services and for product delivery time; and employee satisfaction with the overall performance of the company, self-development ability, and involuntary turnover rate.
The explanatory variables in this study are niche characteristics, which are composed of niche width and niche specificity. Niche width includes three factors: product, process, and technology. Product niche width refers to all the product combinations that an enterprise produces and supplies that have been sold on the market in order to obtain profits and meet the needs of customers. Process niche width refers to the degree of actual business value activities (or vertical integration degree). Technology niche width refers to the fields in which an enterprise invests research and development funds in new technologies or products. The concept of product niche describes the competitive position of an enterprise based on an analysis of the product mix that it provides [16]. In actual industrial observations, Freeman and Hannan [60] used survey data such as menus, business hours, seats, and employees to measure the niche of restaurants. Carroll [27] defined the niche of newspapers by the extent to which the newspaper emphasizes general entertainment in its content. Baum and Singh [61] defined the niche of day nurseries according to the age range of the children for which it was licensed to care, while Dobrev et al. [17] took the distribution of cylinder volume in all the models of automobile manufacturers as a measure of niche width. The concept of process niche is similar to the management of value activities in the industrial value chain [62]. It depicts the appearance of the enterprise’s management model [16]. The larger the width of the process niche, the more extensive the business activities in which the enterprise engages, and the higher the degree of integration of the upstream and downstream value chains. Finally, taking the technological fields invested in by enterprises in research and development as the measurement dimension of technological niche width, this paper discusses whether enterprises should focus on developing a single technological niche or expand their scope by dabbling in technological niches in other fields. In research on technology niches, Podolny et al. [63] believed that it was more appropriate to use the technology domain than other niches as an organizational niche to measure and predict organizational survival opportunities. Therefore, in research on the semiconductor industry, they used inventions for which manufacturers applied for patents as the technology niche of the defining organization. In addition, Dobrev et al. [17] discussed the survival crisis of United States (U.S.) auto makers by measuring technological niche in terms of manufacturers’ market boundaries in technological space.
The measurement items of niche width included the following: products and services are provided to customers in a variety of target markets and types, products can be applied to a variety of industries, a high proportion of components in the company’s products are produced and supplied by the company itself, and a high proportion of components required by the final products are assembled by products produced and manufactured by the company. The company is responsible not only for the manufacturing of components needed for final product assembly, but also for the sale and access of those products. H Company has the ability to develop products that meet the needs of a variety of target markets. The company’s research and development expenditures are scattered among product markets, and its research and development activities are scattered among industries. This part uses a five-point Likert scale (5, strongly agree; 1, strongly disagree) to measure the actual internal situation of the company’s business in China. Niche specificity includes three factors: product, process, and technology. Product niche refers to all the product combinations produced and supplied by an enterprise for profit and sold in the market, and the customer target that the enterprise mainly meets in terms of demand, which is different from that of its competitors. Process niche refers to the extent to which the category of the actual business value activities of an enterprise is different from its competitors. Technological niche refers to the degree to which the enterprise is different from its competitors in terms of the research and development of new technologies or products. The niche specificity of products can reflect a relationship characteristic of the degree of overlap or similarity between enterprises and competitors in customers or services [29]. The lower the degree of overlap or similarity, the higher the niche specificity. Process niche means that the innovation of enterprise management mode creates an advantage of differentiation and low cost at the same time. Therefore, the lower the degree of similarity between the scope of business activities engaged in by the enterprise and that of its competitors, the higher the degree of differentiation of enterprise management in value activities will be, and the more new customer values can be generated. For example, People Express and United Airlines competed in the aviation industry, but they had completely different value chain management models [62]. Referring to previous empirical research [17,63], it can be seen that the technology niche indicates whether competitors are equally involved in the technological field in which the enterprise is engaged.
The measurement items of niche specificity included the following: the target market of products and services, the country/region in which the products are sold, the product characteristics, the proportion of components required for products manufactured by the company to be produced and supplied by the company, the proportion of components required by the final products to be assembled by products manufactured by the company, and whether the sales and channel management mode of the final products of the company are the same as those of its competitors. The target market that H Company develops products for, the product market in which research and development is invested, and the industry in which the research and development activities invest are the same as those of its competitors. This part is a reverse question. The actual internal situation of the company’s business in China is measured by a five-point Likert scale (5, strongly agree; 1, strongly disagree).
The network relationship involves two factors: network embeddedness degree and network center degree. Network embeddedness refers to the degree of communication and interaction between enterprises and customer manufacturers. Network intermediation refers to the degree to which enterprises sell their products to different markets through customer manufacturers. Network embeddedness describes the relationship structure between enterprises and other manufacturers, especially their degree of contact and how the manufacturers are related to each other [64,65]. A high degree of network embeddedness means that the enterprise belongs to a tightly connected network. Enterprises in this network know each other through circular interaction, and mutual connections generate familiarity and trust [34]. The middle position refers to the enterprise’s ability to connect with others that are not in the network and play a mediating role [53,66]. The measurement items of network relationships included the following: discussing the design of new products, developing new products and new technologies, and discussing and communicating improvements in product quality and cost with customer manufacturers; customer manufacturers selling their products to a variety of countries/regions and target markets; and applying customer manufacturers’ product characteristics to different industries. This part uses a five-point Likert scale (5, strongly agree; 1, strongly disagree) to measure actual interactions between a company’s business in China and its customers and manufacturers.
The sample companies in this study are distributed across seven different industries. In order to control the interference of industrial characteristics on the research framework, the industries are taken as control variables, and are subdivided into three categories: motor electronics, machinery manufacturing, and other industries (including textile, footwear, automobile parts, clock manufacturing, and leisure sports equipment), which are converted into two virtual variables: ID1, the motor electronics industry, and ID2, the machinery manufacturing industry (the rest are other industries). In the nonresponse deviation test, the location of the supply chain, capital, and turnover in China reached significant levels. In order to avoid the interference of enterprise scale in China and differences in the locations of industrial supply chains on the relationship between niche characteristics and enterprise performance, the location of the supply chain, capital, and turnover in China are set as control variables. The supply chain position is converted into two virtual variables: SD1 is upstream, while SD2 is midstream (the rest is downstream). Capital and turnover in China are measured by logarithm (LOG).
3.2. Sample and Procedures
There were two main reasons why we chose Taiwanese companies invested in China as the research object. First, the Chinese market is an external market for Taiwanese companies. It is difficult for Taiwanese companies to completely replicate their successful experience in Taiwan in the Chinese market. In order to achieve sustainable development, Taiwanese companies must adapt and adjust. Second, according to a survey by Taiwan’s National Development Council, the Chinese market has the most overseas investment by Taiwanese companies. This study used Google Docs to produce a web questionnaire, which was distributed to listed Taiwanese firms and those with e-mail addresses. A total of 754 questionnaires were sent, and 26 valid questionnaires were returned. The sample recovery rate was 3.45%, and there were relatively few valid samples. Therefore, this study conducted data collection in the next stage. Due to the characteristics of the enterprise research survey, Taiwanese scholars often encounter the problem of a too-low response rate. Therefore, in the second stage, we commissioned four industry people to help collect samples and distributed a total of 80 questionnaires, with 80 valid questionnaires returned. The total number of valid questionnaires in both phases was 106. In order to avoid sampling errors caused by different sources of data collection, this study adopted a nonresponse bias to test whether the characteristics of the samples collected in the second stage were consistent. We used the Mann–Whitney U test on basic data such as industry type; supply chain location; number of years of establishment (for both head office and companies in China); capital amount, turnover, and number of employees in China; positions of interviewees, etc., to test whether the two independent samples (second-stage data collection) came from the same body. The results in Table 1 show that there was no significant difference in the basic data of the five companies collected in the second stage, including industry type, number of years of establishment, number of employees in China, and positions of interviewees (p > 0.05). The significance level of supply chain location was also not high (p > 0.01), so the two-stage sample data can be used together.

Table 1.
Nonresponse bias test.
The distribution of industries was dominated by the electrical and electronic industry (54.7%). The distribution of supply chain locations was dominated by midstream (42.5%). The distribution of the number of years since establishment (head office) was dominated by 21–30 years (28.3%). The number of years since establishment (companies in China) was mostly 6–10 years (27.4%). The distribution of investment locations was mainly in East China (Shanghai, Jiangsu, Zhejiang, Anhui, and Jiangxi; 39.4%) and South China (Guangdong, Fujian, Guangxi, and Hainan; 39.4%), accounting for the majority. The distribution of capital (RMB) in China was mostly between 2–20 million yuan (35.8%). The distribution of turnover (RMB) in China was mostly below 20–200 million yuan (45.3%). The distribution of employees in China was mostly between 50–199 (35.8%). The distribution of positions of interviewees was mostly middle-level managers (50.9%).
3.3. Reliability and Validity of Variable Measurement
In Table 2, Cronbach α values of the explanatory variables product, process, and technology niche width; product, process, and technology niche specificity; and network embeddedness and network center degree are all above 0.6, with values ranging from 0.656 to 0.914. This indicates that measurement items in the same variable have internal consistency and reach the basic threshold of reliability [67] and construction validity. In addition, the CR values of the eight explanatory variables are all above 0.6 (between 0.655–0.921, indicating that the combination of measurement variables and potential factors has composition reliability. According to Campbell and Fiske [68], convergence and differentiation should be considered when discussing construction validity. According to the factor load of the measured variables of each potential factor obtained by confirmatory factor analysis (CFA), the product niche width (minimum t-value = 7.46, p < 0.01), process niche width (minimum t-value = 3.84, p < 0.01), technical niche width (minimum t-value = 4.71, p < 0.01), product niche specificity (minimum t-value = 8.56, p < 0.01), process niche specificity (minimum t-value = 9.11, p < 0.01), technical niche specificity (minimum t-value = 10.41, p < 0.01), network embeddedness degree (minimum t-value = 9.97, p < 0.01), network center degree (minimum t-value = 9.75, p < 0.01), and other potential factors all have significant factor loads, indicating that the measured variables have convergent validity [69,70]. In addition, the average variance extracted (AVE) (0.599) of product niche width is greater than the square of the correlation coefficient with other variables (the maximum value is the correlation coefficient with technology niche width = 0.65). The AVE value (0.490) of process niche width is greater than the square of the correlation coefficient with other variables (the maximum value is the correlation coefficient with technical niche width = 0.48). The AVE value (0.394) of technical niche width is slightly lower than the square of the correlation coefficient (0.65) with product niche width and greater than the square of the correlation coefficient with other variables. The AVE value (0.730) of the niche specificity of products is greater than the square of the correlation coefficient with other variables (the maximum value is a correlation coefficient with a process niche specificity = 0.66). The AVE value (0.724) of process niche specificity is greater than the square of the correlation coefficient with other variables (the maximum value is the correlation coefficient with a product niche specificity = 0.66). The AVE value (0.796) of the technological niche specificity is greater than the square of the correlation coefficient with other variables (the maximum value is the correlation coefficient in which the product niche specificity = 0.61). The AVE value (0.714) of network embeddedness degree is greater than the square of the correlation coefficient with other variables (the maximum value is the correlation coefficient with a network center degree = 0.61). The AVE value (0.718) of network center degree is greater than the square of the correlation coefficient with other variables (the maximum value is the correlation coefficient with a network embeddedness degree = 0.61). The above results indicate that the differences among the factors are valid [70].
Table 2.
Variables and items. CR: critical ratio; AVE: average variance extracted.
The Cronbach α values of financial, customer, and learning-and-growth indicators in enterprise performance are all above 0.6, ranging from 0.610 to 0.850, which indicates that the measurement items in the same variable have internal consistency and reach the basic threshold of reliability and construct validity. However, the Cronbach α value of the internal process indicator is only 0.344, and the highest correlation value of measurement items to total items is only 0.324, which indicates that this factor lacks reliability and construction validity. One possible reason is that this and other performance indicators are highly correlated with each other and jointly affected by a higher-order factor. Therefore, this performance indicator is not deleted first; then, it is tested by using second-order confirmatory factor analysis. In addition, except for the internal process indicator (CR value = 0.410), the CR values of the other three dependent variables are all above 0.6 (between 0.633–0.854), indicating that the combination of measured variables and potential factors has composition reliability. According to the results obtained by CFA, the factor loads of potential factors—financial indicator (minimum t-value = 8.86, p < 0.01), customer indicator (minimum t-value = 3.88, p < 0.01), internal process indicator (minimum t-value = 2.23, p < 0.01), and learning-and-growth indicator (minimum t-value = 6.02, p < 0.01)—all reach significant levels, indicating that the measurement variables have convergent validity [69,70].
In addition, the AVE value (0.661) of the financial indicator is greater than the square of the correlation coefficient with other variables (the maximum value is the correlation coefficient with customer indicator = 0.39). The AVE value (0.381) of the customer indicator is greater than the square of the correlation coefficient with other variables (the maximum value is the correlation coefficient with financial indicator = 0.39). The AVE value (0.202) of the internal process indicator is greater than the square of the correlation coefficient with other variables (the maximum value is the correlation coefficient with customer indicator = 0.31). The AVE value (0.496) of the learning-and-growth indicator is greater than the square of the correlation coefficient with other variables (the maximum value is the correlation coefficient with customer indicator = 0.32). The above results indicate that the differences among the factors are valid [68].
3.4. Common Method Variance
In this study, information from respondents was collected by a self-reported questionnaire, which may lead to errors of common method variation. As a preventive measure, this study adopted a reverse item design to measure items of variables such as product, process, and technology niche specificity. The purpose is to reduce the unintentional or potential consistency motivation of respondents. In the post-detection stage, Harman’s single-factor test was further used to verify the common method variation among research variables. In this study, the measurement items of independent variables for product, process, and technology niche width; product, process, and technology niche specificity; and network embeddedness and network center degree were analyzed by principal component analysis (maximum variance orthogonal axis). The results show that the first non-axis factor only explained 30.46% of the variance. However, the factors with eigenvalues greater than one (six can be extracted) accounted for 73.82% of the variation in total, so it can be judged that the common method variation had little influence on the results of this study [71,72].
4. Analysis and Results
4.1. Descriptive Statistical Analysis
Table 3 shows the average and standard deviation of research variables for product, process, and technology niche width; product, process, and technology niche specificity; network embeddedness and network center degree; financial, customer, internal process, and learning-and-growth indicators; and the Pearson correlation matrix between variables. Product, process, and technology niche width; product, process, and technology niche specificity; and network embeddedness and network center degree are composed of the total score of the respective items. Financial, customer, internal process, and learning-and-growth indicators are the sum of scores obtained by subtracting and multiplying the weight between the satisfaction degree in the organization before each measurement item and before 2007. In the correlation matrix provided in Table 3, some correlation coefficients among product, process, and technology niche width; product, process, and technology niche specificity; and network embeddedness and network center degree are significantly correlated. In order to avoid collinearity in the subsequent regression analysis, the common method is to make the respective variables mean-centered according to their average, and then conduct a regression analysis using the scores obtained after flattening.
Table 3.
Descriptive statistics and correlation matrix.
In this study, the niche width and niche specificity obtained from the second-order confirmatory factor analysis, as well as the four independent variables of network embeddedness and network centrality degree, are normalized, and the product of niche width and network embeddedness degree, niche width and network centrality degree, niche specificity and network embeddedness degree, and niche specificity and network centrality degree is used as the interference effect of the network relationship on the overall model. The collinearity diagnosis results of hierarchical regression analysis show that the variance inflation factor (VIF) values are all less than 10, so the problem of multiple regression collinearity can be eliminated. Financial and nonfinancial performance are the main explanatory variables. Forced entry method (enter) is adopted as the regression estimation method. Variables regarding the main effect and interactive effect are sequentially put into the regression equation. Each explanatory variable can obtain eight groups of regression models.
4.2. Hierarchical Regression Analysis of Financial Performance
In the hierarchical regression of financial performance shown in Table 4, Model 1 verifies the influence of the control variables industry category, supply chain location, capital, and turnover on the financial performance; the results show that these control variables did not reach significance. Model 2 examines the main effects of niche width and niche specificity on financial performance. The results show that niche specificity has a significantly positive impact on financial performance (β = 0.530, p < 0.001), indicating that enterprises with higher niche specificity will not be adversely affected by external environmental changes, and may even perform better. Model 3 verifies the influence of network embeddedness and network centrality on financial performance. The verification results show that network embeddedness has a significantly positive influence on financial performance (β = 0.383, p < 0.01), which indicates that the performance of enterprises that interact and have close ties with customers and manufacturers in the ecosystem is less adversely affected by external environmental changes, and can even be better. Model 4 verifies the impact of niche width and niche specificity on financial performance after adding interference variables. The results show that the degree of network embeddedness has a moderating effect, resulting in a slightly decreased partial regression coefficient value of niche specificity on financial performance. Model 5 verifies the impact of the interaction between niche width and network inlay degree on financial performance. The results show that this interaction has a significantly positive impact on financial performance (β = 0.162, p < 0.1), indicating that a high degree of network inlay leads to worse financial performance for enterprises with larger niche width. Model 6 tests the impact of the interaction between niche specificity and network embeddedness degree on financial performance. The results show that this interaction has a negative but insignificant impact on financial performance. Model 7 tests the influence of the interaction between niche width and network centrality on financial performance. The results show that this interaction has a positive but insignificant influence on financial performance. Model 8 tests the impact of the interaction between niche specificity and network centrality on financial performance. The results show that this interaction has a negative and significant impact on financial performance (β = −0.216, p < 0.05), indicating that low network centrality leads to better financial performance for enterprises with higher niche specificity.
Table 4.
Hierarchical regression of financial performance.
In order to understand the interaction effect, this study draws a relationship between niche width and financial performance and the trend under the conditions of high and low degrees of network embeddedness (Figure 1). The average value of network embeddedness degree variables is used as a benchmark to divide network embeddedness into high and low degrees. As can be seen in Figure 1, a high degree of network embeddedness leads to worse financial performance for enterprises with larger niche widths (when it is low, the niche width has very little influence on financial performance). Figure 2 uses the average value of network centrality variables as a benchmark to divide network centrality into high and low network centrality, and discusses the interference effect on niche specificity and financial performance. As can be seen in Figure 2, enterprises with higher niche specificity have better financial performance, and because the slope of low network centrality is greater than that of high network centrality, when the network centrality is low, the effect of a positive relationship between niche specificity and financial performance is greater than that of high network centrality.
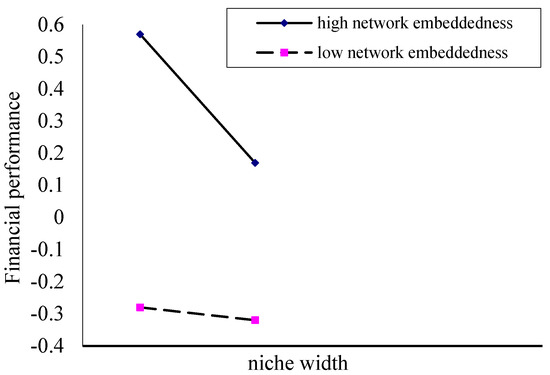
Figure 1.
Moderating effect of network embeddedness.
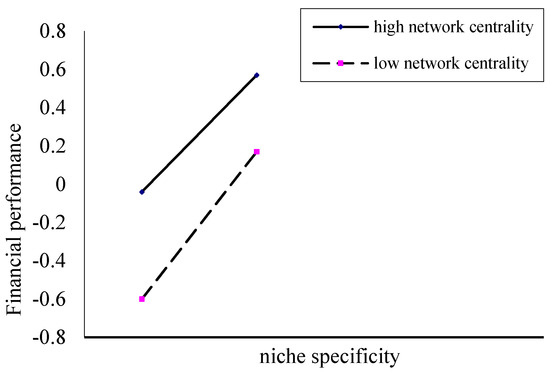
Figure 2.
Moderating effect of network centrality.
4.3. Hierarchical Regression Analysis of Nonfinancial Performance
In the hierarchical regression of nonfinancial performance in Table 5, Model 1 verifies the influence of particular control variables—industry category, supply chain location, capital, and turnover—on nonfinancial performance. The results show that the control variables do not reach significance regarding nonfinancial performance. Model 2 tests the main effects of niche width and niche specificity on nonfinancial performance. The results show that niche specificity has a significantly positive impact on nonfinancial performance (β = 0.334, p < 0.001), indicating that the nonfinancial performance of enterprises with higher niche specificity is less adversely affected by changes in the external environment, and can even be better. Model 3 verifies the influence of network embeddedness and network centrality on nonfinancial performance in network relationships. The results show that network embeddedness has a significantly positive influence on nonfinancial performance (β = 0.392, p < 0.01), which indicates that the nonfinancial performance of enterprises that interact and have closer ties with customers and manufacturers in the ecosystem is less adversely affected by external environment changes, and can even be better. Model 4 verifies the impact of niche width and niche specificity on nonfinancial performance after adding interference variables. The results show that the degree of network embeddedness has a moderating effect, resulting in a significantly reduced impact of niche specificity on nonfinancial performance.
Table 5.
Hierarchical regression of nonfinancial performance.
Model 5 examines the impact of the interaction between niche width and network embeddedness degree on nonfinancial performance. The results show that this interaction has a negative but insignificant impact. Model 6 tests the impact of the interaction between niche specificity and network embeddedness degree on nonfinancial performance; the results show that this interaction has a negative but insignificant impact. Model 7 tests the impact of the interaction between niche width and network centrality on nonfinancial performance; the results show that this interaction has a positive but insignificant impact. Model 8 tests the impact of the interaction between niche specificity and network centrality on nonfinancial performance; the results show that this interaction has a negative but insignificant impact. The results of this regression model show that the network embeddedness and network center degree in the network relationships have no interfering effect on the relationship between niche width and nonfinancial performance, nor between niche specificity and nonfinancial performance. All the test results are shown in Table 6.
Table 6.
Results of hypothesis testing.
5. Conclusions
5.1. When the External Environment Changes Unfavorably, the Financial Performance of Enterprises with a High Degree of Network Embeddedness and Large Niche Width Is Worse Than That of Enterprises with a Low Degree of Network Embeddedness
The results of the study show that the argument that widely run generalist enterprises have more abundant resources and capabilities than specialist enterprises to tolerate and adjust to the impact of environmental changes and can obtain better survival opportunities [18] was not established by the survey. Although not statistically significant, the results show that the performance of specialist enterprises is better than that of generalist enterprises. In addition to the discussion regarding the empirical results, another possible reason is that enterprises disperse their product portfolios in many different target markets, operate many kinds of value activities, disperse research expenditures in many product markets, or disperse research and development activities in many industries, which will lead to an excessive dispersion of resources and an inability to focus on the target to make the maximum investment of energy and materials. Individual product, process, and technological niches only obtain limited energy and material support of the enterprise. In the face of intense competitive pressure, overall performance is usually affected by weak individual competitiveness [10]. After adding the degree of network embedding as a regulating variable, it can be seen that when an enterprise is embedded in a network relationship in which the members are closely connected and specialize in specific product combinations, value activities, and research and development fields, and encounters adverse changes in the investment environment, its financial performance in terms of sales growth, asset return, turnover growth, etc., is still better than that of a generalist enterprise that distributes resources among various products, processes, and technology niches. This result is consistent with previous research. The influence of niche characteristics on enterprises must take into account contingency factors [16,27,28,29]. The conclusion here is that widely run enterprises that are engaged in a variety of product combinations, participate in a variety of value activities, and invest in research and development activities in a variety of technical fields disperse their internal resources in various niche spaces, strive for a central position in the market, and face more severe tests and competition [27]. If they are embedded in tight network relationships, they often have discussions with customer manufacturers regarding the design of new products, the development of new technologies, and the improvement of product quality and cost. They have long been subject to the requirements of customers in mainstream markets and have developed the capabilities, organizational structure, and culture required by the value network. As a result, this type of enterprise cannot make effectively and timely decisions and respond to changes brought about by breakthrough innovations in the scientific and technological environment, which will further impact operations and affect the overall financial performance.
On the contrary, enterprises that specialize in specific product combinations, value activities, and research and development activities concentrate their internal resources in a single or a few niche spaces, and live at the edge of the market [27]. They are attached to a certain supply system and are responsible for the production of key components. Their use of resources varies less than that of generalist organizations. In order to survive, it is necessary to contact other members of the network and establish external relationships to seek support and assistance [28,38]. Embedded in tight network relationships, professional enterprises can enhance their importance in the supply system by regularly discussing new product designs, developing new technologies, and improving product quality and cost with customer manufacturers and meeting their requirements. At the same time, enterprises can also promote the accumulation of knowledge and exchange important information and management technologies [34,40], improving their financial performance in terms of sales growth, asset return, and turnover growth.
5.2. When the External Environment Changes Unfavorably, the Financial Performance of Enterprises with a Low Degree of Network Centrality and High Niche Specificity Is Better Than That of Enterprises with a High Degree of Network Centrality
Niche theory holds that when the number of enterprises relying on similar resource spaces increases, the space for growth will be squeezed, leading to niche crowding, which will further intensify competition [24,25,29,61]. Consistent with the arguments of Echols and Tsai (2005) and Porter (1996), the results of this study show that enterprises with unique products, processes, and technological niches that are different from those of their competitors can obtain better financial performance in terms of sales growth, asset return, and turnover growth due to the difference in product mix, value activities, and technological fields invested in research and development between enterprises, facing less competitive pressure, and avoiding falling into the dilemma of price reduction competition. The overall operating performance of the company is better than that of other enterprises in the same industry, which can provide better treatment for employees and improve their learning-and-growth performance in terms of satisfaction with the company, increased self-ability, and involuntary turnover.
At the same time, the knowledge and technology that enterprises learn from their business activities are usually unique and difficult to imitate and replace, which leads them to continuously invest resources, engage in effective research and development, and adopt special technologies in order to enhance their ability to design new products, quickly respond to customer manufacturers’ requirements for products and services, and meet their requirements for delivery time, thus increasing customer satisfaction and willingness to continuously purchase the company’s products. After adding the degree of network intermediation as a regulating variable, we found that the product mix, value activities of management, and technical fields invested in the research and development of enterprises with high niche specificity are different from those of competitors. If we can contact customers that sell products to different countries or regions and target markets, and products can be applied to different industries and other faces, we can connect through these network relationships and obtain unique, heterogeneous, and valuable market information that is helpful to the special niche [53], fully apply the special product, process, and technology niche of the enterprise to various target markets, and obtain better financial performance such as sales growth, asset return, and turnover growth.
However, a low degree of network centrality leads to a more effective relationship between niche specificity and financial performance. One possible reason is that too many network relationships that are not connected with each other will reduce the quality of information, and it is impossible to ensure the reliability of market information and obtain more knowledge through repeated inspection [45]. Usually, it will affect the performance of enterprises in developing their special niche [16] and will be constrained by members of various groups. This result is consistent with the argument of structural holes, as well as with Simmel’s viewpoint [51], which indicates that the norms of members in network relationships will restrict enterprise behavior and decision-making, and will be constrained by various norms formulated by members of the network. In turn, this will lead to a failure to respond to environmental changes in a timely manner and affect the financial performance in terms of sales growth, asset return, turnover growth, etc.
5.3. Management Research and Policy Recommendations
Management research has paid more attention to interactions between enterprises and other organizations of interest in the external environment. However, the lack of a niche theory indicates that the sustainable development of many enterprises may depend on establishing cooperative and symbiotic network relationships with core vendors (customer vendors) in the ecosystem and obtaining the necessary resources from these relationships. This study combines the two viewpoints to explain that when organizations acquire external resources through network links, they can not only acquire surplus resources and capabilities (a characteristic of generalist organizations), but also cope with changes in the environment without burdening organizations when the environment is stable (a characteristic of specialist organizations). Furthermore, the existing network research is mainly based on the dual relationship or overall network structure. This research uses the subgroup–network group view of network relationships to discuss the influence of network connections on enterprises, in order to better understand their opportunities to survive and develop. A dual relationship is a relationship between two actors. This is the simplest and most basic form of a social network, and the basis for the analysis of various ties.
Understanding the determinants of business performance is important for every company. The results of this study provide a direction for managers to obtain performance benefits in their niche positioning. The results point out that niche width strategy cannot affect the performance of an enterprise alone when the external environment changes unfavorably, and the degree of interaction and embeddedness with customers and manufacturers must be examined. The results also point out that when the external environment changes unfavorably, enterprises with higher niche specificity cannot be easily replaced by other niche manufacturers. At the same time, enterprises that adopt a special niche strategy not only can obtain unique, heterogeneous, and valuable market information, but also cannot be restrained by the norms of core manufacturers if they can moderate the different network relationships. There are many Taiwanese firms in various niche forms in the investment market of China; two examples are TM Company and YCM Company, which are responsible for the professional design, integration, and assembly of machine tools. Their products can be used as processing machines for manufacturing the metal parts of mechanical equipment as well as industrial metal parts for automobiles, aerospace, national defense, machinery, molds, electronics, generators, etc. In addition, some processes or components and consumables in high-tech industries such as semiconductors and panels must be manufactured with machine tools, with very wide applications. In addition, companies such as H Company, which manufactures industrial chillers, HT Company, which manufactures paper products, and Company t, which designs and manufactures computer radiators, are specialist enterprises that are more focused on niche markets. It is generally believed that generalist enterprises will perform better than specialist enterprises in terms of competition intensity, overall efficiency, industrial profitability, and customer satisfaction. However, this type of enterprise cannot avoid the impact of market competition and environmental changes. In many cases, they are even safer than professional enterprises, and often have to reduce weight. Professional enterprises often follow the strategy adopted by generalist enterprises, but they fall into crisis because they do not have the same scale. Therefore, generalist and specialist enterprises should have their own operating rules and strategies so as not to fall into the gray zone. Porter (1996) argued that firms that succeed at multiple strategies often do so by creating separate business units for each strategy. By separating the strategies into different units with different policies and even different cultures, a company is less likely to become stuck in the middle of a combination of generic strategies.
This study suggests that enterprise managers should think more comprehensively about their company’s competitive positioning. Taiwanese firms mostly adopt the strategy of helping internationally famous brand manufacturers form contracts. It is not enough to choose a favorable niche. Competitive positioning should take into account the core manufacturers that have cooperative symbiosis and parasitic relationships with their companies. The network relationship between these manufacturers usually provides market information and knowledge that is critical to sustainable development. Therefore, the important task of enterprise managers is to understand the interaction between their companies and the core manufacturers in the ecosystem and their positioning in the network relationship. All-round enterprises usually provide a wide range of related products and services for most major market customers. They are easily subject to the requirements of mainstream market customers for a long time, develop the capabilities, organizational structure, and culture required by the value network, and are unable to make effective and timely decisions and respond to changes brought about by breakthrough innovations in the scientific and technological environment. This study suggests that generalist Taiwanese firms can set up a dedicated unit (or organization) to monitor environmental changes in various regions at any time when operating in China, and target customers in emerging product markets (not the current mainstream market) so that they can serve different customer markets at the same time. Since it is extremely difficult to compete with all-round and versatile manufacturers with (i) complete products, (ii) a high degree of integration, and (iii) diversified technologies, this study suggests that professional Taiwanese firms should find their effective areas of specialization, adopt a strategy of cross-avoidance, avoid overlapping with other competitors, stabilize special niche markets, and develop their own characteristics. At the same time, they should set up a value network system with other core manufacturers (Taiwanese firms, Chinese firms, or other manufacturers) with different functions so as to embed themselves within such a network, which can not only focus on their own core niche, but also obtain surplus capacity and resources in response to changes in the overseas environment from the network.
5.4. Limitation and Recommendation
We must acknowledge several limitations of this study. First, the study relies on single-country data, which can limit its generalizability. We consider that future research can test the main results of this study through enterprise cases in other countries, and can even conduct comparative studies in different countries or industries. Second, although our study develops a predictive measure of sustainable development that applies to firms, it relies exclusively on financial and nonfinancial performance data. We believe that we can increase the indicators of innovation performance, including product innovation, process innovation, personnel exchange, and so on. Innovation is also the key to the sustainable development of enterprises. Finally, in addition to network relationships, we consider that institutional pressures are also an important contingency factor in our model. Institutional pressure brings constraints to the strategic choice of enterprises. Future research can enrich our model by adding other contingency variables of interest.
Author Contributions
Y.-S.C. collected data performed and the data analysis, drafted the paper, and finalized the paper; H.-S.L. designed the study and revised the manuscript; W.-C.H. collected data.
Funding
This research received no external funding.
Acknowledgments
We appreciate the efforts of professors from DUT.
Conflicts of Interest
The authors declare no conflict of interest.
References
- Makarevich, A. Ties of survival: Specialization, inter-firm ties, and firm failure in the US venture capital industry. J. Bus. Res. 2018, 86, 153–165. [Google Scholar] [CrossRef]
- Claussen, J.; Essling, C.; Peukert, C. Demand variation, strategic flexibility and market entry: Evidence from the US airline industry. Strateg. Manag. J. 2018, 39, 2877–2898. [Google Scholar] [CrossRef]
- Ding, L.; Cao, D.; Ouyang, T.; Wu, J.-x. Promoting the Development of Enterprise Niche: Case Study on China’s Organizational Ambidexterity. Sustainability 2018, 10, 3806. [Google Scholar] [CrossRef]
- Haans, R.F. What’s the value of being different when everyone is? The effects of distinctiveness on performance in homogeneous versus heterogeneous categories. Strateg. Manag. J. 2019, 40, 3–27. [Google Scholar] [CrossRef]
- Venkatraman, N. Performance implications of strategic coalignment: A methodological perspective. J. Manag. Stud. 1990, 27, 19–41. [Google Scholar] [CrossRef]
- Zhu, Q.; Geng, Y.; Sarkis, J. Shifting Chinese organizational responses to evolving greening pressures. Ecol. Econ. 2016, 121, 65–74. [Google Scholar] [CrossRef]
- Zona, F.; Gomez-Mejia, L.R.; Withers, M.C. Board interlocks and firm performance: Toward a combined agency–resource dependence perspective. J. Manag. 2018, 44, 589–618. [Google Scholar] [CrossRef]
- Lourenço, I.C.; Branco, M.C.; Curto, J.D.; Eugénio, T. How does the market value corporate sustainability performance? J. Bus. Ethics 2012, 108, 417–428. [Google Scholar] [CrossRef]
- Sorenson, O.; McEvily, S.; Ren, C.R.; Roy, R. Niche width revisited: Organizational scope, behavior and performance. Strateg. Manag. J. 2006, 27, 915–936. [Google Scholar] [CrossRef]
- Iansiti, M.; Levien, R. Strategy as ecology. Harvard Bus. Rev. 2004, 82, 68–81. [Google Scholar]
- Burt, R.S. Structural Holes: The Social Structure of Competition; Harvard University Press: Cambridge, MA, USA, 2009. [Google Scholar]
- Nohria, N.; Eccles, R. Is a network perspective a useful way of studying organizations. In Leading Organizations: Perspectives for A New Era; Robinson, H.G., Ed.; Sage Publications: Thousand Oaks, CA, USA, 1998; pp. 287–301. [Google Scholar]
- Provan, K.G. Embeddedness, interdependence, and opportunism in organizational supplier-buyer networks. J. Manag. 1993, 19, 841–856. [Google Scholar] [CrossRef]
- Uzzi, B. Embeddedness in the making of financial capital: How social relations and networks benefit firms seeking financing. Am. Sociol. R 1999, 64, 481–505. [Google Scholar] [CrossRef]
- Zaheer, A.; Bell, G.G. Benefiting from network position: Firm capabilities, structural holes, and performance. Strateg. Manag. J. 2005, 26, 809–825. [Google Scholar] [CrossRef]
- Echols, A.; Tsai, W. Niche and performance: The moderating role of network embeddedness. Strateg. Manag. J. 2005, 26, 219–238. [Google Scholar] [CrossRef]
- Dobrev, S.D.; Kim, T.-Y.; Carroll, G.R. The evolution of organizational niches: US automobile manufacturers, 1885–1981. Adm. Sci. Q. 2002, 47, 233–264. [Google Scholar] [CrossRef]
- Hannan, M.T.; Freeman, J. The population ecology of organizations. Am. J. Sociol. 1977, 82, 929–964. [Google Scholar] [CrossRef]
- Rhee, M.; Kim, Y.-C.; Han, J. Confidence in imitation: Niche-width strategy in the UK automobile industry. Manag. Sci. 2006, 52, 501–513. [Google Scholar] [CrossRef]
- Bogaert, S.; Boone, C.; Negro, G.; van Witteloostuijn, A. Organizational form emergence: A meta-analysis of the ecological theory of legitimation. J. Manag. 2016, 42, 1344–1373. [Google Scholar] [CrossRef]
- Fosfuri, A.; Giarratana, M.S.; Sebrek, S.S. Resource partitioning and strategies in markets for technology. Strateg. Organ. 2018, 1–24. [Google Scholar] [CrossRef]
- Kivimaa, P.; Kern, F. Creative destruction or mere niche support? Innovation policy mixes for sustainability transitions. Res. Pol. 2016, 45, 205–217. [Google Scholar] [CrossRef]
- Carnes, C.M.; Chirico, F.; Hitt, M.A.; Huh, D.W.; Pisano, V. Resource orchestration for innovation: Structuring and bundling resources in growth-and maturity-stage firms. Long Range Plan. 2017, 50, 472–486. [Google Scholar] [CrossRef]
- Dobrev, S.D.; Kim, T.-Y.; Carroll, G.R. Shifting gears, shifting niches: Organizational inertia and change in the evolution of the US automobile industry, 1885–1981. Organ. Sci. 2003, 14, 264–282. [Google Scholar] [CrossRef]
- Barnett, W.P. The organizational ecology of a technological system. Adm. Sci. Q. 1990, 35, 31–60. [Google Scholar] [CrossRef]
- Porter, M.E. What is Strategy. Harvard Bus. Rev. 1996, 74, 61–78. [Google Scholar]
- Carroll, G.R. Concentration and specialization: Dynamics of niche width in populations of organizations. Am. J. Sociol. 1985, 90, 1262–1283. [Google Scholar] [CrossRef]
- Baum, J.A.; Oliver, C. Institutional linkages and organizational mortality. Adm. Sci. Q. 1991, 36, 187–218. [Google Scholar] [CrossRef]
- Wholey, D.R.; Huonker, J.W. Effects of generalism and niche overlap on network linkages among youth service agencies. Acad. Manag. J. 1993, 36, 349–371. [Google Scholar]
- Granovetter, M. Economic action and social structure: The problem of embeddedness. Am. J. Sociol. 1985, 91, 481–510. [Google Scholar] [CrossRef]
- Zellweger, T.M.; Chrisman, J.J.; Chua, J.H.; Steier, L.P. Social Structures, Social Relationships, and Family Firms; Sage Publications Sage CA: Los Angeles, CA, USA, 2019. [Google Scholar]
- Almeida, P.; Dokko, G.; Rosenkopf, L. Startup size and the mechanisms of external learning: Increasing opportunity and decreasing ability? Res. Pol. 2003, 32, 301–315. [Google Scholar] [CrossRef]
- Baum, J.A.; Shipilov, A.V.; Rowley, T.J. Where do small worlds come from? Ind. Corp. Chang. 2003, 12, 697–725. [Google Scholar] [CrossRef]
- Gulati, R.; Nohria, N.; Zaheer, A. Strategic networks. Strateg. Manag. J. 2000, 21, 203–215. [Google Scholar] [CrossRef]
- Han, J.; Shipilov, A.V.; Greve, H.R. Unequal bedfellows: Gender role-based deference in multiplex ties between Korean business groups. Acad. Manag. J. 2017, 60, 1531–1553. [Google Scholar] [CrossRef]
- Hayter, C.S. Constraining entrepreneurial development: A knowledge-based view of social networks among academic entrepreneurs. Res. Pol. 2016, 45, 475–490. [Google Scholar] [CrossRef]
- Rowley, T.J.; Greve, H.R.; Rao, H.; Baum, J.A.; Shipilov, A.V. Time to break up: Social and instrumental antecedents of firm exits from exchange cliques. Acad. Manag. J. 2005, 48, 499–520. [Google Scholar] [CrossRef]
- Hitt, M.A.; Ireland, R.D.; Camp, S.M.; Sexton, D.L. Strategic entrepreneurship: Entrepreneurial strategies for wealth creation. Strateg. Manag. J. 2001, 22, 479–491. [Google Scholar] [CrossRef]
- Shepherd, D.A.; Mcmullen, J.S.; Ocasio, W. Is that an opportunity? An attention model of top managers’ opportunity beliefs for strategic action. Strateg. Manag. J. 2017, 38, 626–644. [Google Scholar] [CrossRef]
- Larson, A. Network dyads in entrepreneurial settings: A study of the governance of exchange relationships. Adm. Sci. Q. 1992, 37, 76–104. [Google Scholar] [CrossRef]
- Jones, T.M.; Harrison, J.S.; Felps, W. How applying instrumental stakeholder theory can provide sustainable competitive advantage. Acad. Manag. Rev. 2018, 43, 371–391. [Google Scholar] [CrossRef]
- Lorenzoni, G.; Lipparini, A. The leveraging of interfirm relationships as a distinctive organizational capability: A longitudinal study. Strateg. Manag. J. 1999, 20, 317–338. [Google Scholar] [CrossRef]
- Bertoni, F.; Colombo, M.G.; Quas, A. The role of governmental venture capital in the venture capital ecosystem: An organizational ecology perspective. Entrep. Theory Pract. 2017, 1–19. [Google Scholar] [CrossRef]
- Cooper, A.C. Networks, alliances, and entrepreneurship. Strateg. Entrep. Creat. A New Mindset 2017, 201–222. [Google Scholar] [CrossRef]
- Rowley, T.; Behrens, D.; Krackhardt, D. Redundant governance structures: An analysis of structural and relational embeddedness in the steel and semiconductor industries. Strateg. Manag. J. 2000, 21, 369–386. [Google Scholar] [CrossRef]
- Ozdemir, S.Z.; Moran, P.; Zhong, X.; Bliemel, M.J. Reaching and acquiring valuable resources: The entrepreneur’s use of brokerage, cohesion, and embeddedness. Entrep. Theory Pract. 2016, 40, 49–79. [Google Scholar] [CrossRef]
- Perry-Smith, J.E.; Mannucci, P.V. From creativity to innovation: The social network drivers of the four phases of the idea journey. Acad. Manag. Rev. 2017, 42, 53–79. [Google Scholar] [CrossRef]
- Hubbard, T.D.; Pollock, T.G.; Pfarrer, M.D.; Rindova, V.P. Safe bets or hot hands? How status and celebrity influence strategic alliance formations by newly public firms. Acad. Manag. J. 2018, 61, 1976–1999. [Google Scholar] [CrossRef]
- Stuart, T.E.; Hoang, H.; Hybels, R.C. Interorganizational endorsements and the performance of entrepreneurial ventures. Adm. Sci. Q. 1999, 44, 315–349. [Google Scholar] [CrossRef]
- Gnyawali, D.R.; Madhavan, R. Cooperative networks and competitive dynamics: A structural embeddedness perspective. Acad. Manag. Rev. 2001, 26, 431–445. [Google Scholar] [CrossRef]
- Krackhardt, D. The ties that torture: Simmelian tie analysis in organizations. Res. Sociol. Organ. 1999, 16, 183–210. [Google Scholar]
- Abbott, K.W.; Green, J.F.; Keohane, R.O. Organizational ecology and institutional change in global governance. Int. Organ. 2016, 70, 247–277. [Google Scholar] [CrossRef]
- Shipilov, A.V. Firm scope experience, historic multimarket contact with partners, centrality, and the relationship between structural holes and performance. Organ. Sci. 2009, 20, 85–106. [Google Scholar] [CrossRef]
- Dyllick, T.; Hockerts, K. Beyond the business case for corporate sustainability. Bus. Strateg. Environ. 2002, 11, 130–141. [Google Scholar] [CrossRef]
- Venkatraman, N.; Ramanujam, V. Measurement of business performance in strategy research: A comparison of approaches. Acad. Manag. Rev. 1986, 11, 801–814. [Google Scholar] [CrossRef]
- Daft, R.L. Organization Theory and Design; South-Western Pub: Nashville, TN, USA, 2004. [Google Scholar]
- Delaney, J.T.; Huselid, M.A. The impact of human resource management practices on perceptions of organizational performance. Acad. Manag. J. 1996, 39, 949–969. [Google Scholar]
- Beal, R.M.; Yasai-Ardekani, M. Performance implications of aligning CEO functional experiences with competitive strategies. J. Manag. 2000, 26, 733–762. [Google Scholar] [CrossRef]
- Naman, J.L.; Slevin, D.P. Entrepreneurship and the concept of fit: A model and empirical tests. Strateg. Manag. J. 1993, 14, 137–153. [Google Scholar] [CrossRef]
- Freeman, J.; Hannan, M.T. Niche width and the dynamics of organizational populations. Am. J. Sociol. 1983, 88, 1116–1145. [Google Scholar] [CrossRef]
- Baum, J.A.; Singh, J.V. Organizational niches and the dynamics of organizational founding. Organ. Sci. 1994, 5, 483–501. [Google Scholar] [CrossRef]
- Porter, M.E. Competitive Advantage; Free Press: New York, NY, USA, 1985. [Google Scholar]
- Podolny, J.M.; Stuart, T.E.; Hannan, M.T. Networks, knowledge, and niches: Competition in the worldwide semiconductor industry, 1984–1991. Am. J. Sociol. 1996, 102, 659–689. [Google Scholar] [CrossRef]
- Granovetter, M. Problems of explanation in economic sociology. In Networks and Organizations: Structure, Form, and Action; Nohria, N., Eccles, R.G., Eds.; Harvard Business School Press: Boston, MA, USA, 1992; pp. 25–56. [Google Scholar]
- Nahapiet, J.; Ghoshal, S. Social capital, intellectual capital, and the organizational advantage. Acad. Manag. Rev. 1998, 23, 242–266. [Google Scholar] [CrossRef]
- Shipilov, A.V.; Li, S.X. Can you have your cake and eat it too? Structural holes’ influence on status accumulation and market performance in collaborative networks. Adm. Sci. Q. 2008, 53, 73–108. [Google Scholar] [CrossRef]
- Henson, R.K. Understanding internal consistency reliability estimates: A conceptual primer on coefficient alpha.(Methods, plainly speaking). Meas. Eval. Couns. Dev. 2001, 34, 177–190. [Google Scholar]
- Campbell, D.T.; Fiske, D.W. Convergent and discriminant validation by the multitrait-multimethod matrix. PsyB 1959, 56, 81–105. [Google Scholar] [CrossRef]
- Anderson, J.C.; Gerbing, D.W. Structural equation modeling in practice: A review and recommended two-step approach. PsyB 1988, 103, 411–423. [Google Scholar] [CrossRef]
- Fornell, C.; Larcker, D.F. Structural Equation Models with Unobservable Variables and Measurement Error: Algebra and Statistics; SAGE Publications Sage CA: Los Angeles, CA, USA, 1981. [Google Scholar]
- Podsakoff, P.M.; MacKenzie, S.B.; Lee, J.-Y.; Podsakoff, N.P. Common method biases in behavioral research: A critical review of the literature and recommended remedies. J. Appl. Psychol. 2003, 88, 879–903. [Google Scholar] [CrossRef]
- Podsakoff, P.M.; Organ, D.W. Self-reports in organizational research: Problems and prospects. J. Manag. 1986, 12, 531–544. [Google Scholar] [CrossRef]


© 2019 by the authors. Licensee MDPI, Basel, Switzerland. This article is an open access article distributed under the terms and conditions of the Creative Commons Attribution (CC BY) license (http://creativecommons.org/licenses/by/4.0/).