Abstract
Given the transitive challenges in the labor market, education can provide a sustainable developmental map for worldwide economic prosperity. Deep understanding of the dynamics of human capital, reflecting earnings aspirations in the labor market, indicates the need for policy makers to monitor and modify pedagogical curricula to meet the supply/demand of markets based on scientific evidence. In this study, we propose a methodology based on a household integrated economic survey (HIES) and, using different models, assess the impact of attained education and returns on the practical utility of skills within the context of a transitive labor market. We observe that effort levels are snowballing and rejection rates are declining for people with higher education (HE), whereas wage offers decline for people with low education (LE). Our results reveal significant differences in the supply/demand factors of both the public and private markets’ one-shot and continual affiliations. We conclude the impact of sheepskin effects and the implication of our findings.
1. Introduction
Over the past six decades, education has received considerable attention in the literature. School produces cognitive, human capital (knowledge)-based skills [1,2,3], which is captured in the phrase, “plant a seed and reap a hundred harvests”. Contemporary scholars have a similar mindset [4], reporting the importance of educational investment. Similarly, investing in years of education, like investing in the accumulation of productive skills, improves people’s abilities as demanded by the labor market [5]. Economists consider that resources should be expended on physical capital, as investment that yields a future return, rather than on consumption; expenditure on human capital must be considered analogous to physical capital [6,7]. The government of Pakistan consistently emphasized human capital development as a potential engine for developing a knowledge-based economy [8]. Budgetary allocations for human capital development in the educational sector has increased every fiscal year, and a sum of RS 20.5 billion or 21% was allocated in the 2015–2016 budget for the Higher Education Commission (HEC) of Pakistan.
The affiliation between the labor market earnings of individuals and their completed level of education has been adequately established [9]. Human capital schooling is the standardized practice for promoting this affiliation, considering the correlation of “labor market experience with earmark controls” as being consistent with their view that high earnings improve worker productivity due to the intensification of each subsequent schooling level [10]. However, individuals with higher education (HE) are comparatively associated with professional designations in the labor market [11]. Similarly, ecumenical education is considered to play an imperative role in the prospect of employment, where more educated candidates are not exclusively more disposed to procure employment than less educated candidates, but they are more likely to acquire employment of a superior quality [12].
Consulting economic theory, workers are compensated according to their marginal productivity. This is called anticipatory wage—the mechanism associated with people’s education and skill-based productivity [13]. However, workers’ authentic productivity is laborious to observe, and employers often rely on surrogates when making decisions about wages. For instance, from the perspective of screening, one of the most visible indicators of productivity is the curriculum vitae [14,15] and human capital [16,17], and studies indicate that individuals accumulate skills and knowledge while at school, where their productivity improves. Empirical studies have shown positive and significant returns from education [18,19].
Educational institutions are positively correlated with labor markets, and a well-trained workforce that possess supplementary education is generally understood as a significant precondition for economic development. However, all workers with HEs do not inevitably induce high economic growth. Although the productive value of education is not only dependent on the level of education, but also on the quality of the pedagogy and the knowledge and skills imparted to students [20]. So to answering the questions, what is the demand of education in transitive labor market and how it is supplied from the institute’s side? What is the tendency of individual’s education?
The structure of this paper is as follows. Section 2 provides a literature review. Section 3 provides the background of the supply/demand transition in the labor market. Section 4 offers research-related details on the relationships between the data and the scope of the study and outlines the empirical methodology. Section 5 provides the results in centile groupings. Finally, Section 6 provides a discussion and conclusions.
2. Literature Review
The sheepskin effect is an applied economic theory related to people’s academic degree, which is offered by institutions after completing a schooling period. According to previous studies, returns from education are associated with certificates of qualification and sheepskin effects, which are less clear [21]. Likewise, most of the analyses related to the earnings function have been affected by the nonexistence of the diploma or sheepskin effect [22,23]. Dissimilar from previous studies, including in Pakistan [24], scholars calculated the educational returns by using Pakistan Social and Living Standard Measurement Survey (PSLM) data from 1979, though it was old fashioned and inappropriate data. In the literature, gender-based inequality in employment remains in the focus area [25,26,27], and we think that the labor market seeks committed productivity and the distribution of individuals’ incomes into specific grade levels, neither of which vary according to gender-based returns [28]. Although it is very difficult to judge the ability of an employee, the sheepskin “certificate or acquisition of a receipt after the completion of schooling” is a helpful tool for screening, based on a projection of the future production of the employee.
Being globally focused on personal investment into education and its outputs, we also focused on the variation in outcomes associated with different education levels and, related to the duality theory, the input of the supplied education and the demand in the market. The trend of the supply/demand factor in the transitive labor market has seldom been studied [29]. For instance, the sustainable development of any country relies on the Gross Enrolment Index (GEI), or Gross Enrolment Ratio (GER), of educational enrolments in school at different levels, along with a qualification from those particular grade levels. The GER can exceed 100% equal to the entire population of a whole country and would indicate the eradication of poverty.
The findings of this study contribute to the expansion of our understanding in two ways. First, we synchronize the tendency of educational returns at certain levels of completed qualified certificates to the education sectors from 2005/2006 to 2010/2011. Second, we investigated the trend in the educational supply/demand factor in the economic sectors, which requires careful consideration because this has not been adequately addressed in the literature to date. This study provides hypothetical information for policymakers regarding the efficiency of different types of qualifications and ascertains the supply of labor and demand conditions in Pakistan’s labor market. Because the supply/demand of skills contrasts across all economic sectors, this suggests that the frequency of educational levels may differ a lot across rural/urban over time. We are using city data from 27 cities in Pakistan, which shall help to fill the gap of educational weakness, like the existing studies for Pakistan [30], Hong Kong, USA [31], and Taiwan [32].
3. Supply/Demand Transition in the Labor Market
Several countries have accountable modification pauses for the protection of certain workers from contrary effects. Educating the population requires investment in human capital, such as educational amenities, alongside updated technology-related pedagogical curricula, which must be monitored. Particularly in the case of Pakistan’s culture and damaged labor markets, previous studies [33,34,35] reported numerous factors that increase the likelihood of instantaneous consequences related to an increase in the number of graduate contestants in the labor market, for instance, an increase in unemployment along with a lack of productive skills and increasing age over that required by employment standards. Table 1 and Table 2 present our findings regarding youth attainment of education and labor market transition, respectively.

Table 1.
Educational attainment of youth cumulative (%).
Table 2.
Transitive labor market cumulative (%).
Every level of education has an increasing enrolment ratio in rural and urban areas. Over the last three years, a significant increment was found in enrolment, averaging 8% at BS/BE and 1.7% at MS/ME levels. This is a significantly diminished ratio of enrolment compared to the first baseline levels. Table 2 displays the trend of individuals to transition from agricultural professions to industry services employment. The abundant availability of graduates and oversupply of nonprofessional skills prepares them for careers other than administrative careers and decreases their employability. Gradually, many modifications appeared depending on several aspects of sustainable job search, including funds, information about the degree, the job that the candidates seek and employers possess, graduates’ wage expectations, and how the labor market may alter in the short- and long-term. In competitive labor markets, overall schooling involves new practices alongside the development of cognitive skills.
The above considerations provide a loose theoretical framework that suggests a testable hypothesis, for the analysis of largest increasing HE effects from the Pakistan’s labor market. Figure 1 presents the chain of educational inputs. Individuals complete their schooling and obtain knowledge, earn skills after the completion of schooling, and, in the end, institutes offer them degrees. It is the degree (sheepskin effect) that functions as a signaling device for entering into the labor market for employment, which implies that the employer needs to provide production skills and make wage discriminations.
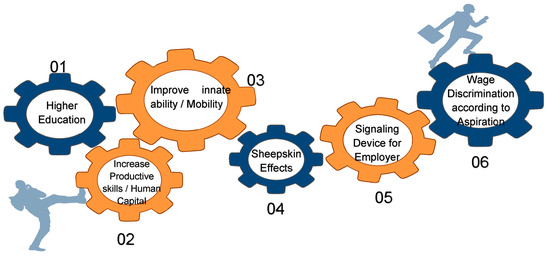
Figure 1.
Sustainable developmental key factors indication toward educational relation to aspire wage discrimination.
4. Materials and Methods
4.1. Data Resources
We used Pakistan’s administrative annual household integrated economic survey (HIES) dataset to estimate the variation over 4 years of sample data from 2004/2005 to 2010/2011, connected with information regarding the current condition of the rapid secular transition supply/demand for educated workforce in public and private markets. Every year the Pakistan Bureau of Statistics (PBS) conducts the HIES survey, which is one of the most all-encompassing studies of the earnings equilibrium of individuals in Pakistan. It was an appropriate source of data for the study, since it enables an analysis of the characteristics of the educational tendency and transition of supply/demand in the labor market. The transition could be seen in the next five years (2024) as a result of the implementation of the skilled development project. Thus, this will not only be beneficial for supposed individuals’ selection who rely on their level of qualifications, but also for other individuals in Pakistan’s economy. The latest HIES also provides the government with valuable information for assessing the efficiency of public investment into education, especially in relation to solving the problem of educational mismatches (over- or undereducation) in the Pakistan labor market. Both aspects may redirect inadequacies in the allocation of resources.
Certain features are considered for the data sample selection. From 2004/2005 to 2010/2011, 106,008 respondents from households were randomly selected for the HIES survey. First, employee respondents had to be between the ages of 15 and 64 years. Second, individuals were excluded if they had not attended school (either they had not completed education (dropouts) or had no formal education), as well as those who are currently undertaking education alongside their job and are self-employed, which is consistent with the process followed in the literature. Those who were currently enrolled in school were migrant workers or had qualifications that were not recognized by the educational system of Pakistan’s Ministry of Education (MoE) were also excluded. The reason for the exclusion of self-employed people is that it is difficult to measure their income. Similarly, workers who work without salary, pensioners, unpaid family members, and housewives were excluded. Unpaid family workers may also qualify as self-employed. The selection standard was based on 46,008 respondents and the individuals with the highest level of education certificates were chosen as mentioned in Table 3.
Table 3.
Descriptive statistics.
4.2. Research Method
This section outlines the practical methodology used for testing our hypothesis using the random effects model, fixed effects model, Hausman test, and the stretched Jacob Mincer [36] to investigate the returns on education in Pakistan’s public and private sectors. This describes the sheepskin effect influencing earnings, apart from education, experience, and years of schooling. We use the model in Equation (1) to test the hypothesis:
where α is a constant term, I is the index of individuals (I = 1, …, N), T is the period of indexes (T = 2004/2005, 2005/2006, 2007/2008, or 2010/2011), K represents the direction of the occupation-related services sector, and ln is the place holder for the natural log of individuals’ yearly earnings. Education is considered the attainment of a specified level of education from a school, college, or university. The criteria are university-based certificates (postgraduate, graduate), college certificates (diploma, HSc: Higher secondary certificate; school certificates, SSc: Secondary school certificate; middle, primary), or primary school certificates. A chain of dummy variables is included in the expressive education types (levels). The primary level is used to classify the group captured in the finding of the demand and supply of educational skills among the occupation-related services sectors and the variations in returns on education for other certificates. The alteration of educational returns for other certificates of qualification was compared to primary school education, and EXP is the potential experience (age − schooling years − 5), following the specification supplied by Psacharopoulos [37]. The assumption is that children commence schooling at 5 years of age and are employed promptly after the completion of schooling. This aligns with the compulsory schooling policy for children of six years of age in Pakistan. Exp2 is the quadratic of experience, measuring the capture concavity of an experience–earnings profile. λ is a predictor variable for estimating the earning effects among the occupations. A series of dummy (binary form) variables are included to represent the types of professions. There are nine occupational groups, as stated in the HIES.
Our study indicates the occupational variables as control variables, since the professions are associated with acquired skills and different levels of qualification may have different rates of returns from education. By including industrial controls, the performance of overeducated workers can be determined [38]. Likewise, in the present study, earnings are significantly affected, but small. The standard practice in the literature is to determine the private average rates of return to education (ri) to measure each low and high level of qualification for comparison [39]. These are calculated using the estimated coefficients: rI = (βI − βI-1)/(ESI − ESI-1), where H is the highest certificate obtained. For instance, the rates of return to qualification are designed as r (Higher Degree) = (βMS-degree − βBS-degree)/(S18 − S16). In the present study, we used log-linear regressions to analyze the rates of return from high levels to low levels of qualification in the public and private labor markets. With the robust option, the point estimate of the coefficients is exactly the same as in the ordinary least squares (OLS), but the standard errors consider issues concerning heterogeneity and the lack of normality, as well as observations within districts being dependent. Robust standard errors easily deal with the heteroscedasticity problem because we usually do not know the structure of heteroscedasticity (especially in our case where the sample size is large), as suggested by White [40]. The application of the log-linear regression estimations also aids in the interpretation of the results of this study by using dummy variables to analyze the curvature of educational returns between 2004/2005 and 2010/2011. This methodology analysis provides a preliminary picture of the various educational standards in the Pakistan labor market.
5. Results
5.1. Educational Tendency
The results are shown in Table 4. First, we assumed that the workers who completed additional years of education received a premium over the nondiscriminatory wage structure, the exception being that this monotonic increase in HEs applies to those who acquire a postgraduate degree, associated with a cohort that terminates studies after obtaining a university degree. Second, shifting attention to control variable results revealed that higher earnings are related to employees who possess higher qualified degrees and better cognitive skills, and who expected that wage discrimination increases with experience. For instance, from the analysis, we found that those people who attained HE had high-ranking occupations, whereas those who possessed less education due to a lack of resources, with an orientation toward the accomplishment of skills, remained unemployed, self-employed, or made compromises with their nondiscrimination wage. However, human capital and the sheepskin effect were found to influence the distribution of wages among the occupations. For instance, the top four professions enjoy a higher premium in each sector because they require the possession of higher qualifications along with an abundance of years of experience, and the remaining professions are considered to have low wage distribution according to their level of educational status and skills. However, wage was constant in each occupation, whether in the public or private sector. Many elementary educated occupants were found to have had a similar experience to directors and managers, but they failed to earn higher wages because of the difference in their educational qualifications.
Table 4.
Estimated results in the education investment and labor market wage discriminations.
Table 4 shows that the expected mean value of Y, when all X = 0, with each column showing that the counterfactual thinking related to increasing earnings including additional levels of schooling and credentials does not mean that a greater ability related with human capital is conferred only by finishing school. Globally, the sheepskin effect is the first tool that helps people enter into the market by helping them successfully navigate recruitment and employer screening of their intellectual capability, as well as meet the firm’s expected productivity.
University dropouts can gain an advantage over the low-level education (LLE) by attainment of more schooling years, which deprive the rights of LLE obtained people. Our results reveal that lower educational skills are negatively related with wage. Table 5 presents the marginal earning difference between each level of schooling.
Table 5.
Total and the average rate of returns to the level of education (%).
In short, the trend in wage disparity among the distinct levels of educational attainment is considered the baseline column 5, subtracted from column 2, obtaining results that support the change in the economic value of sheepskins. First, the primary-level–SSc-level enrolment ratio increased with the implementation of government policies that provide free of cost primary to HSc education, regardless of whether or not the policy is sufficient to support work-places with respect to standard designations. As Table 5 presents, people with the last three education ranks enjoy higher wages because they invest more years in education. Our estimated results support the human capital theory, a higher productivity and higher salary belong to people with HEs, along with sheepskins [41,42,43].
Figure 2 shows that the reforms had a complex effect on educational enrolment, and in terms of the impact of reform on the educational trend, there was a consistently diminishing ratio of enrolment in education from the low to the high level. At the primary to the higher secondary school levels, gross enrolment rates are higher every year. The most surprising aspect in the analysis was that the vocational education ratio was continuously weak and that the BS level recovered its attention. Hence, we think that a greater investment into years of schooling and then university is responsible for the refinement of the skills of individuals and their accreditation. The experiential learning obtained from this education is required for entering into the labor market, and this is directly related to the supply/demand factor. For example, instead of having only an HSc-level schooling job in the labor market and spending more years to gain experience to wait for a wage increase, the wage will not be equal to the university level schooling wage discrimination [44]. The acquisition of skills and knowledge is an investment in human capital, which is similar to physical capital resources, as an investment that yields a future return rather than consumption. We think that most of the impressive increases in the wages of the workforce were found in developed countries, owing to their investment in tertiary education for the growth of the economy, and this indicates a limiting factor in the advance of poor developing countries, such as Pakistan.
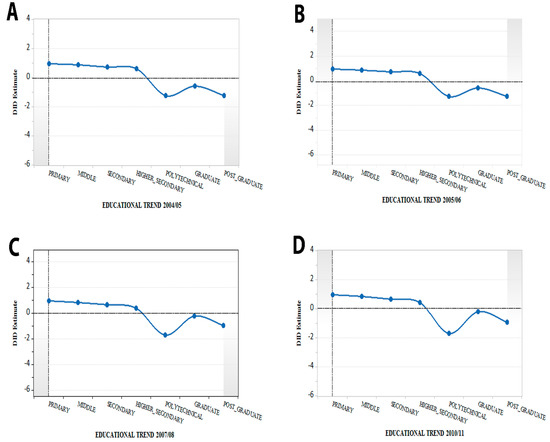
Figure 2.
Data source: Pakistan Bureau of Statistics (PBS). Educational enrolment trend of each year difference in difference estimates, the vertical line targets low-level (primary) to high-level standards (postgraduate).
In Figure 3, the zigzag blue line represents the trend in the occupational ratio of the low-level grade jobs, which are related to low-level investment into education on the right-hand side, crossing over the horizontal baseline, whereas the higher-wage occupations require tertiary education. On average, the high-ranking enrolment ratio increased in the labor market, as low-level education tended toward tertiary education but lacked financial support, still remaining behind the ratios in developed nations. Sheepskins and human capital together played a uniform role that is directly related to wage discrimination.
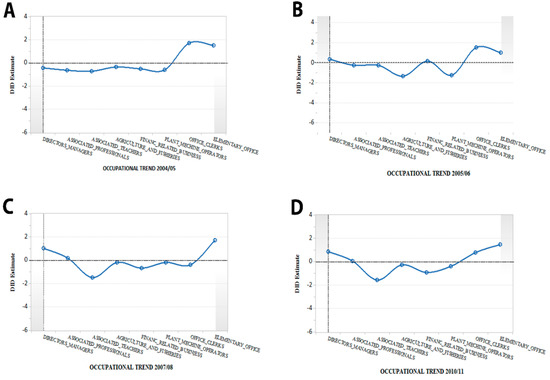
Figure 3.
Data source: PBS. Occupational trend of each year difference in difference estimates, the vertical line targets high rank job (director and manager) to low level standards (elementary office).
5.2. Labor Market Specification
A range of political and economic factors have had opposite effects on Pakistan’s economy in recent years, including low levels of investment and a deteriorating quality of education. Assuming high illiteracy rates, strategies emphasizing increasing access to education and evolutional studies related to educational fields in developing countries focused on entrance, particularly into primary and secondary education [45,46].
A straightforward but comparatively new tactic concerning the pathway toward the advancement of education among economic sectors over time involves comparing the rates of returns in these clusters to the inclusivity of the labor market [47]. The youth face more disadvantages, including limited job search expertise, a mismatch of educational skills and jobs, a lack of mobility, along with the high aspirations and expectations of employers. Unpredictably, some scholars [43,48,49,50] reported that higher earnings are exclusively due to HE. In the economic sector, employers screen employees by the sheepskin effect as an indicator of productivity for the firm, and decide rewards according to the level of education.
Different regions have different features regarding wage discrimination and the supply compared to the demand for levels of schooling in labor markets. To better understand wage disparities, we grouped all 27 cities by acummulated years of data, as presented in Table 6. We assumed that all the cities have the same wage, and we applied other methods, such as random effects and fixed effects models, allowing for heterogeneity among cities. The results suggest that investment in each level of schooling has a positive relationship in every location. Comparing the results of both models, the coefficients in the model are different than zero and another thing, there R2 are quite resemble. We applied hausman test to be more clear that which model is an appropriate. We found that null hypothesis rejected, means that wage has relationship with education.
Table 6.
Estimated results in the education investment and labor market wage discriminations.
Table 7 presents the estimated coefficient results from the randomly sampled Pakistan Bureau of Statistics (PBS), demonstrating the difference between the public and private sectors corresponding to all the reporting wage earning relationships and the supply of educational skills. Controlling for the length of experience and development along with increasing log wages seems to provide some support for the strong sheepskin hypothesis. A number of results are worth reviewing from Table 7. First, the f-statistics are more flexible and are superior in terms of fit over the prototypical mincer model regarding all specifications. Second, we found that the rate of returns on education are correlated with the level of schooling, for instance, a 3.4% increase in wages in the public or private sector. Third, larger and significant sheepskin effects appeared for extra years in tertiary education, when observing that plant machine operators in elementary jobs possess insufficient education. Earnings are constant but inversely proportional to wage discrimination, whether from top-ranking positions, directors, managers, or supervisors who possess positive and higher sheepskins. This is why they enjoy high wages in both the public and private sectors.
Table 7.
Estimates the occupational coefficient wage differences in public and private markets.
By interpreting the occupational differences between the public and private sectors as indicative of discrimination, our results suggest that the public sector is better paid compared to the private sector considering the difference in endowments. The sheepskins are almost the same for each public and private sector job, and more experience is required in the private sector. However, job security and other incentives, for example, learning during working in the shape of training and promotions, due to a scarcity of resources, requires more time to obtain more experience until the fixed age of retirement and pensioning provided by the public sector. Regarding screening theory, the private sector prioritizes highly experienced employees with HE and negotiates regarding the fixation of wages and policies. We also found from the survey of the data that many over-aged (retired from the public sector) employees are found in the private sector only because they have experience. This is why education cannot be presumed nor can it end. More investment into education, with an increased budget, alongside monitoring the maintenance of the pedagogical system with updated technology, are the nation’s key assets for future development.
6. Discussion and Conclusions
The aim of this study was to evaluate the context of the higher education in Pakistan and its relationship with labor markets regarding the supply/demand by applying the fixed effects method and the mincer model with respect to wage discrimination using the PBS survey from 2004/2005 to 2010/2011. First, the results suggest that little variation occurred in R2, although we used different methods. Second, the results for the predictor variables illustrate that higher returns exist with white collar jobs due to the accumulation of HE (postgraduate). These people easily find employment compared to blue-collar individuals who possess LE, which causes difficulty in job searches according to their expected wage. However, the oversupply of higher secondary level schooling and graduates with nonprofessional skills prepares them for little more than administrative careers and reduces their employability. The dearth of career counseling services at schools and universities leads to students choosing professions based on limited knowledge about career options. A degree’s weak link to the labor market is a factor in the lack of the career acquisition of skills. The results indicate that more investment after graduate over postgraduate education is helpful for meeting the demand for standard jobs. LE is losing its strength to even ensure low-wage jobs in the public or private labor markets. Education is not only associated with the personal benefits of individuals, although it has a strong relationship with socioeconomic and national developments. As a consequence of the growing population rate and global ineconomic rate, the demand for a highly skilled workforce in the market has created a competitive environment. Educational institutions, with the cooperation of market job skills, boost candidates to acquire more education and make them assets to national development. This could be possible to minimize the litracy rate all over the world, if the teachers in educational institutes, take a part to enhance the mobility among students for future high earnings, with updated technology based syllabus as applied in the transitive labor market.
Our study has various limitations. Our analysis is not based on a specific representative area of Pakistan. The Householed Integrated Economic Survey (HIES) conducted every year in all over the Pakistan. Our data selection samples was based on 27 renowned cities of Pakistan, who were enjoying their premium with the respect of high-skills and obtained more education. We cannot rule out the social impact on high education, which may reveal different results. This can be achieved with future research in this area.
Policy Recommendations
The government needs to pay attention to the growth in public expenditure on the education sector and the burgeoning well-organized budget in relation to the source of productivity to upgrade the pedagogical curriculum for the maintenance of a quality assurance framework of HE, with the collaboration of global market development. Pakistan’s government should attempt to become a learning center for educational excellence and, to address the deteriorating rates of return to workforce from LE to HE upgrade policies, provide merit-based scholarships, and update learning tools related to markets. Further study is required to evaluate the effects of the innovative potential objective clusters of entrants with HE and to enrich the discussion about the methods and mechanisms of governance, especially in a country like Pakistan, where education stems from a privilege to a factually successful life and employment. This research will be continually updated in accordance with the census providing new HE data.
Author Contributions
A.A.M wrote the original draft supervised by L.Z.
Funding
On trends and strategies of global student mobility in Higher Education, China Education International Talent Exchange Association (Project No. CEITEA RP 2016-007).
Conflicts of Interest
The authors declare no conflicts of interest.
References
- Castelló, A.; Doménech, R. Human capital inequality and economic growth: Some new evidence. Econ. J. 2002, 112, C187–C200. [Google Scholar] [CrossRef]
- Hanushek, E.A.; Woessmann, L. Schooling, Cognitive Skills, and the Latin American Growth Puzzle; National Bureau of Economic Research: New York, NY, USA, 2009. [Google Scholar]
- Hanushek, E.A.; Woessmann, L. The High Cost of Low Educational Performance: The Long-Run Economic Impact of Improving PISA Outcomes; Organization for Economic Cooperation and Development: Paris, France, 2010. [Google Scholar]
- Schultz, T.W. Capital formation by education. J. Polit. Econ. 1960, 68, 571–583. [Google Scholar] [CrossRef]
- Busemeyer, M.R.; Garritzmann, J.L.; Neimanns, E.; Nezi, R. Investing in education in Europe: Evidence from a new survey of public opinion. J. Eur. Soc. Policy 2018, 28, 34–54. [Google Scholar] [CrossRef]
- Storey, V.A.; Gill, M.G. Investing in the Future: Developing Education Lifelong Learning Tracks. In Advocacy in Academia and the Role of Teacher Preparation Programs; IGI Global: Hershey, PA, USA, 2018; pp. 288–301. [Google Scholar]
- Burgess, M. Investing in the future of farmworkers’ children. Farmer’s Wkly. 2018, 2018, 30–32. [Google Scholar]
- Butt, B.Z.; ur Rehman, K. A study examining the students satisfaction in higher education. Procedia Soc. Behav. Sci. 2010, 2, 5446–5450. [Google Scholar] [CrossRef]
- Verwiebe, R.; Reinprecht, C.; Haindorfer, R.; Wiesboeck, L. How to succeed in a transnational labor market: Job search and wages among Hungarian, Slovak, and Czech commuters in Austria. Int. Migr. Rev. 2017, 51, 251–286. [Google Scholar] [CrossRef]
- Chevalier, A.; Harmon, C.; Walker, I.; Zhu, Y. Does education raise productivity, or just reflect it? Econ. J. 2004, 114, F499–F517. [Google Scholar] [CrossRef]
- Beblavy, M.; Teteryatnikova, M.; Thum, A.E. Expansion of Higher Education and Declining Quality of Degrees. SSRN Electron. J. 2013. [Google Scholar] [CrossRef]
- Cellini, S.R.; Chaudhary, L. The labor market returns to a for-profit college education. Econ. Educ. Rev. 2014, 43, 125–140. [Google Scholar] [CrossRef]
- Kelly, E.; McGuinness, S. A Study of Sub-Minimum Wage Rates for Young People; ESRI and the Low Pay Commission: Dublin, Germany, 2017. [Google Scholar]
- Arrow, K. The theory of discrimination. Discrim. Labor Mark. 1973, 3, 3–33. [Google Scholar]
- Spence, A.M. Market Signaling: Informational Transfer in Hiring and Related Screening Processes; Harvard University Press: Cambridge, MA, USA, 1974. [Google Scholar]
- Becker, G.S. Human Capital Theory; Columbia: New York, NY, USA, 1964. [Google Scholar]
- Mincer, J.; Polachek, S. Family investments in human capital: Earnings of women. J. Political Econ. 1974, 82, S76–S108. [Google Scholar] [CrossRef]
- Psacharopoulos, G.; Patrinos, H.A. Returns to investment in education: A further update. Educ. Econ. 2004, 12, 111–134. [Google Scholar] [CrossRef]
- Peet, R.; Hartwick, E. Theories of Development: Contentions, Arguments, Alternatives; Guilford Press: New York, NY, USA, 2015. [Google Scholar]
- Becker, G.S.; Chiswick, B.R. Education and the Distribution of Earnings. Am. Econ. Rev. 1966, 56, 358–369. [Google Scholar]
- Trostel, P.A. Nonlinearity in the return to education. J. Appl. Econ. 2005, 8, 191–202. [Google Scholar] [CrossRef][Green Version]
- Park, J.H. Estimation of sheepskin effects using the old and the new measures of educational attainment in the Current Population Survey. Econ. Lett. 1999, 62, 237–240. [Google Scholar] [CrossRef]
- Antelius, J. Sheepskin Effects in the Returns to Education: Evidence on Swedish Data; Working Paper Series 158; Trade Union Institute for Economic Research: Stockholm, Sweden, 2000. [Google Scholar]
- Shabbir, T. Sheepskin effects in the returns to education in a developing country. Pak. Dev. Rev. 1991, 30, 1–19. [Google Scholar] [CrossRef]
- Gao, Y.; He, Q.; Liu, Y.; Zhang, L.; Wang, H.; Cai, E. Imbalance in spatial accessibility to primary and secondary schools in china: Guidance for education sustainability. Sustainability 2016, 8, 1236. [Google Scholar] [CrossRef]
- Scarborough, W.J.; Lambouths, D., III; Holbrook, A.L. Support of workplace diversity policies: The role of race, gender, and beliefs about inequality. Soc. Sci. Res. 2019, 79, 194–210. [Google Scholar] [CrossRef]
- Abukhait, R.M.; Bani-Melhem, S.; Zeffane, R. Empowerment, Knowledge Sharing And Innovative Behaviours: Exploring Gender Differences. Int. J. Innov. Manag. 2019, 23, 1950006. [Google Scholar] [CrossRef]
- Oreopoulos, P. The compelling effects of compulsory schooling: Evidence from Canada. Can. J. Econ./Rev. Can. Écon. 2006, 39, 22–52. [Google Scholar] [CrossRef]
- Muehlemann, S.; Pfann, G.A.; Pfeifer, H.; Dietrich, H.W. The Effects of Supply Shocks in the Market for Apprenticeships: Evidence from a German High School Reform; IZA—Institute of Labor Economics: Bonn, Germany, 2018. [Google Scholar]
- Abbas, Q. Over-education and under-education and their effects on earnings: Evidence from Pakistan, 1998–2004. Saarc J. Hum. Resour. Dev. 2008, 4, 109–125. [Google Scholar]
- Cohn, E.; Johnson, E.; Chu Ng, Y. The incidence of overschooling and underschooling and its effect on earnings in the United States and Hong Kong. In Research in Labor Economics; Emerald Group Publishing Limited: Bingley, UK, 2000; pp. 29–61. [Google Scholar]
- Hung, C.-Y. Overeducation and undereducation in Taiwan. J. Asian Econ. 2008, 19, 125–137. [Google Scholar] [CrossRef]
- Liu, Y. Labor market matching and unemployment in urban China. China Econ. Rev. 2013, 24, 108–128. [Google Scholar] [CrossRef]
- Knight, J.; Song, L. China’s emerging urban wage structure, 1995–2002. Inequal. Public Policy China 2008, 221–242. [Google Scholar] [CrossRef]
- Knight, J.; Deng, Q.; Li, S. China’s expansion of higher education: The labour market consequences of a supply shock. China Econ. Rev. 2017, 43, 127–141. [Google Scholar] [CrossRef]
- Mincer, J. Schooling, Experience, and Earnings; National Bureau of Economic Research, Inc.: New York, NY, USA, 1974. [Google Scholar]
- Psacharopoulos, G.; Layard, R. Human capital and earnings: British evidence and a critique. Rev. Econ. Stud. 1979, 46, 485–503. [Google Scholar] [CrossRef]
- Reece, I.; Walker, S. Teaching, Training and Learning: A Practical Guide; Business Education Publishers Ltd.: Sunderland, UK, 2016. [Google Scholar]
- Kenayathulla, H.B. Higher levels of education for higher private returns: New evidence from Malaysia. Int. J. Educ. Dev. 2013, 33, 380–393. [Google Scholar] [CrossRef]
- White, H. A heteroskedasticity-consistent covariance matrix estimator and a direct test for heteroskedasticity. Econom. J. Econom. Soc. 1980, 48, 817–838. [Google Scholar] [CrossRef]
- Becker, G.S. Front matter, human capital: A theoretical and empirical analysis, with special reference to education. In Human Capital: A Theoretical and Empirical Analysis, with Special Reference to Education, 2nd ed.; NBER: New York, NY, USA, 1975. [Google Scholar]
- Pyatt, G. Human Capital: A Theoretical and Empirical Analysis, with Special Reference to Education; JSTOR: New York, NY, USA, 1966. [Google Scholar]
- Stanley, B.G. Human Capital: A Theoretical and Empirical Analysis, with Special Reference to Education; University of Chicago Press: Chicago, IL, USA, 1983. [Google Scholar]
- Cherkesova, E.Y.; Breusova, E.A.; Savchishkina, E.P.; Demidova, N.E. Competitiveness of the human capital as strategic resource of innovational economy functioning. J. Adv. Res. Law Econ. 2016, 7, 1662–1667. [Google Scholar]
- Bertrand, M.; Duflo, E.; Mullainathan, S. How much should we trust differences-in-differences estimates? Q. J. Econ. 2004, 119, 249–275. [Google Scholar] [CrossRef]
- Sutherland, D.; Price, R.; Joumard, I.; Nicq, C. Performance Indicators for Public Spending Efficiency in Primary and Secondary Education; OECD Publishing: Paris, France, 2007. [Google Scholar]
- Boccanfuso, D.; Larouche, A.; Trandafir, M. Quality of higher education and the labor market in developing countries: Evidence from an education reform in Senegal. World Dev. 2015, 74, 412–424. [Google Scholar] [CrossRef]
- Bacolod, M.P.; Tobias, J.L. Schools, school quality and achievement growth: Evidence from the Philippines. Econ. Educ. Rev. 2006, 25, 619–632. [Google Scholar] [CrossRef]
- Hannum, E.; Behrman, J.; Wang, M.; Liu, J. Education in the reform era. China’s Great Econ. Transform. 2008, 215–249. Available online: http://kczx.xhu.edu.cn/G2S/eWebEditor/uploadfile/20120427135908_684449439144.pdf (accessed on 6 May 2019).
- Handa, S.; Simler, K.R. Quality or Quantity? The Supply-side Determinants of Primary Schooling in a Poor Rural Economy. J. Afr. Econ. 2006, 15, 59–90. [Google Scholar] [CrossRef]


© 2019 by the authors. Licensee MDPI, Basel, Switzerland. This article is an open access article distributed under the terms and conditions of the Creative Commons Attribution (CC BY) license (http://creativecommons.org/licenses/by/4.0/).