Determination of Monitoring Parameters for Fatigue Behavior of Steel-Concrete Composite Bridge Girders with Welded Full Depth Transverse Stiffeners


Abstract
:1. Introduction
2. Materials and Methods
2.1. Material Properties
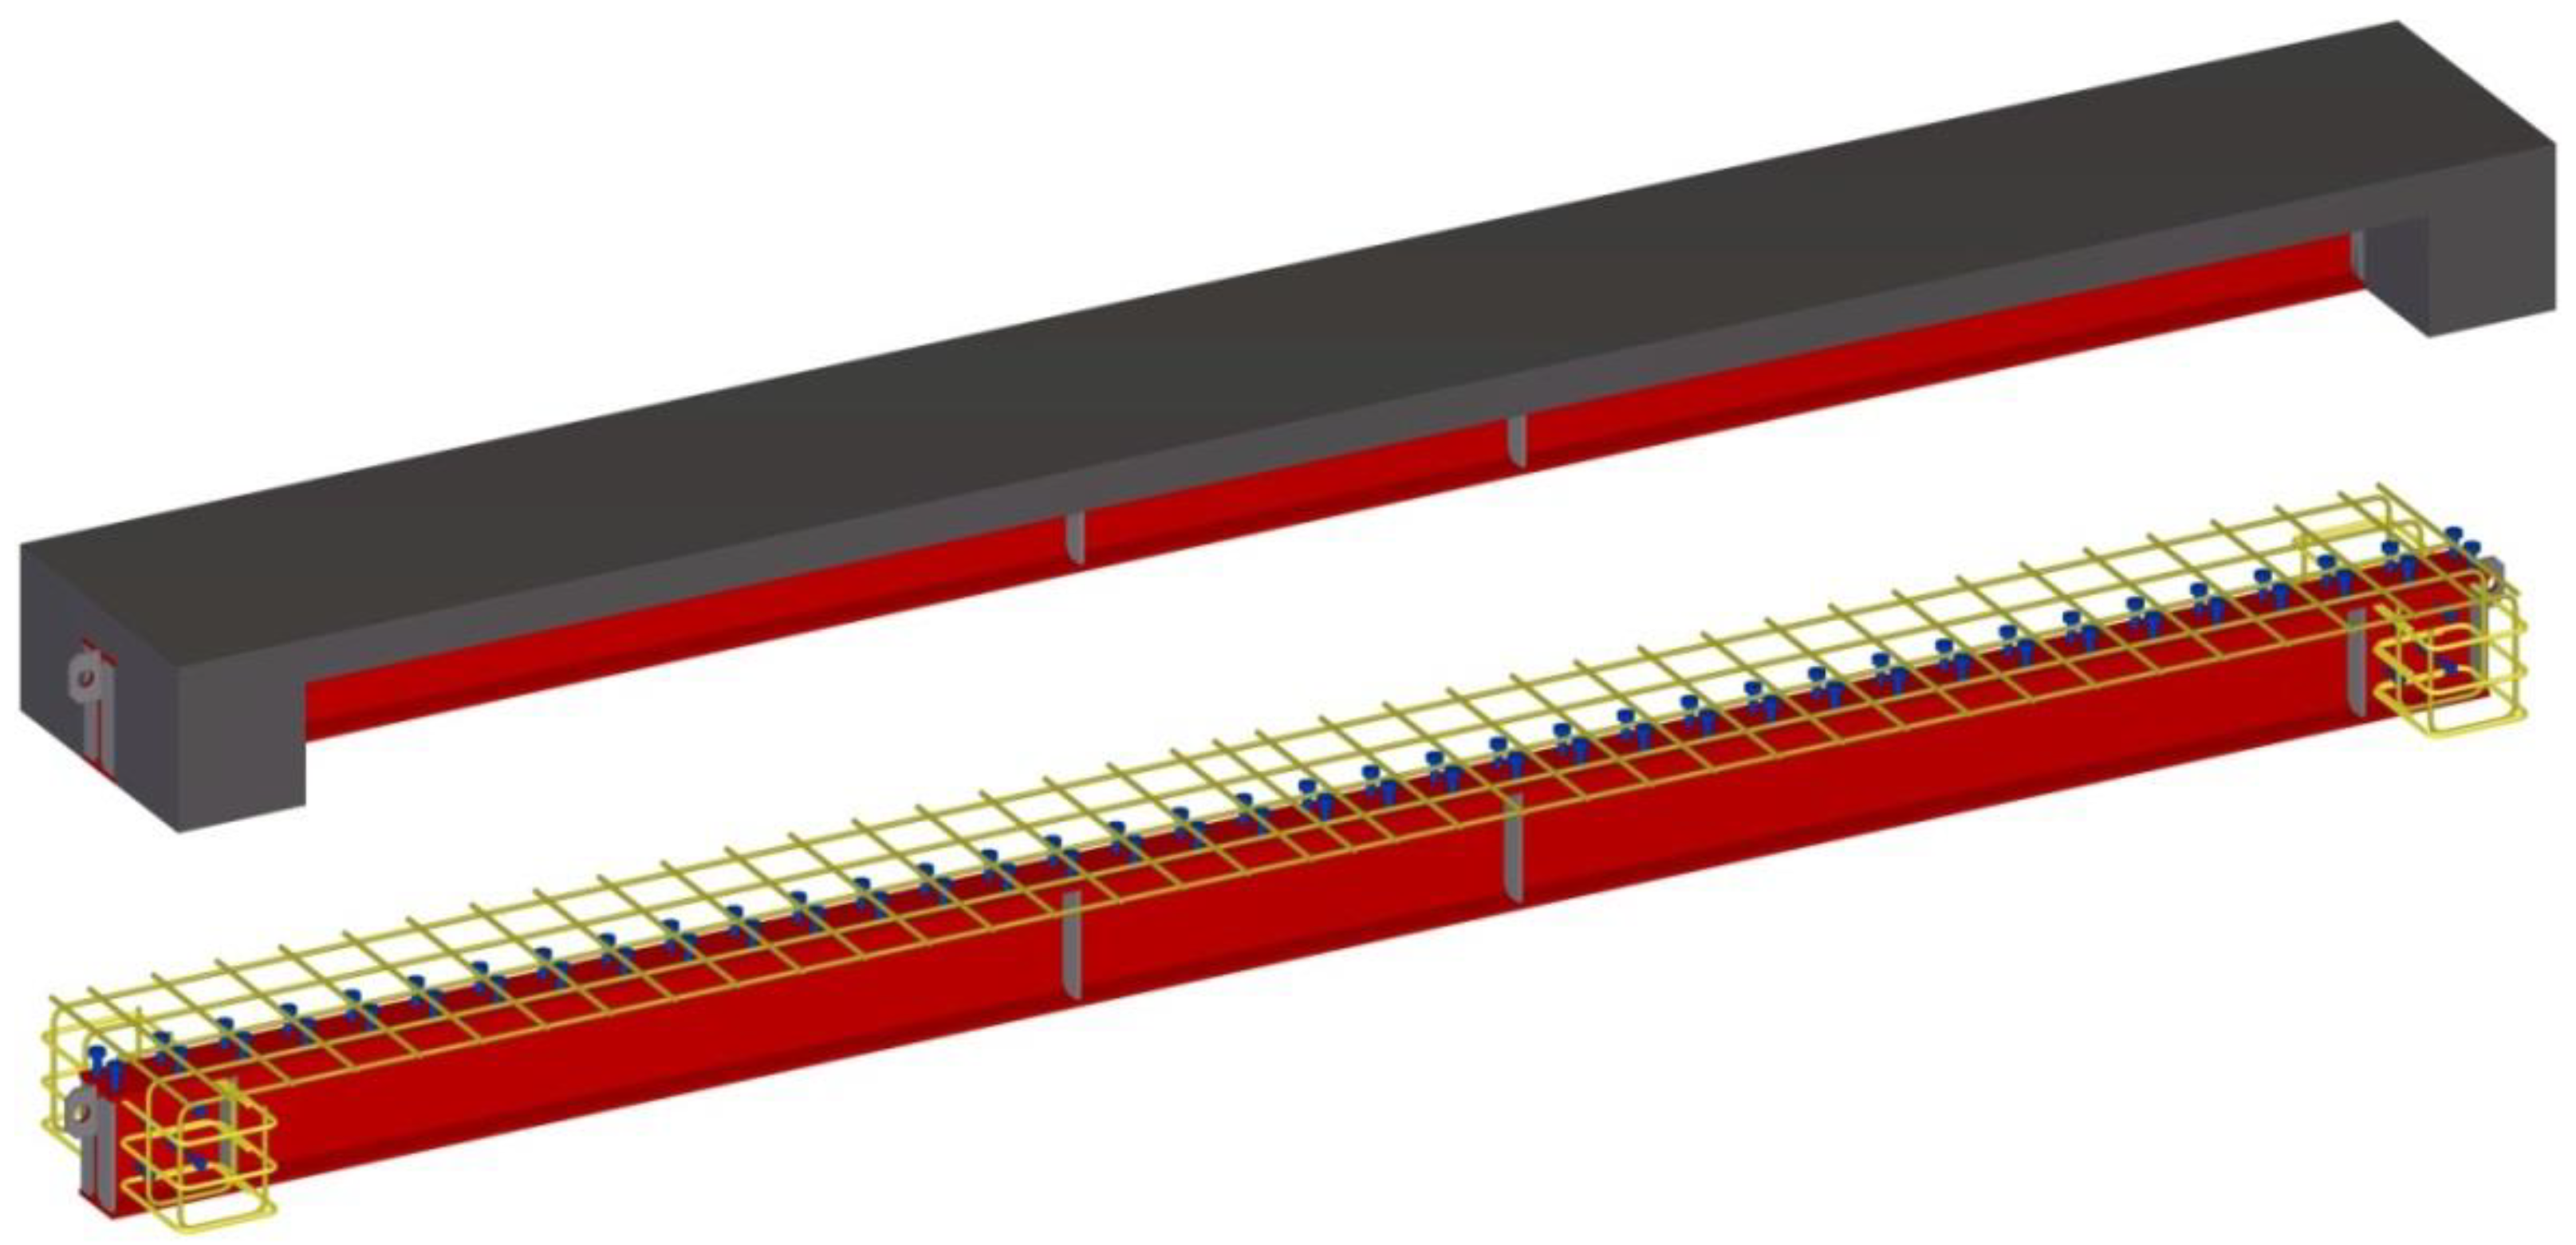
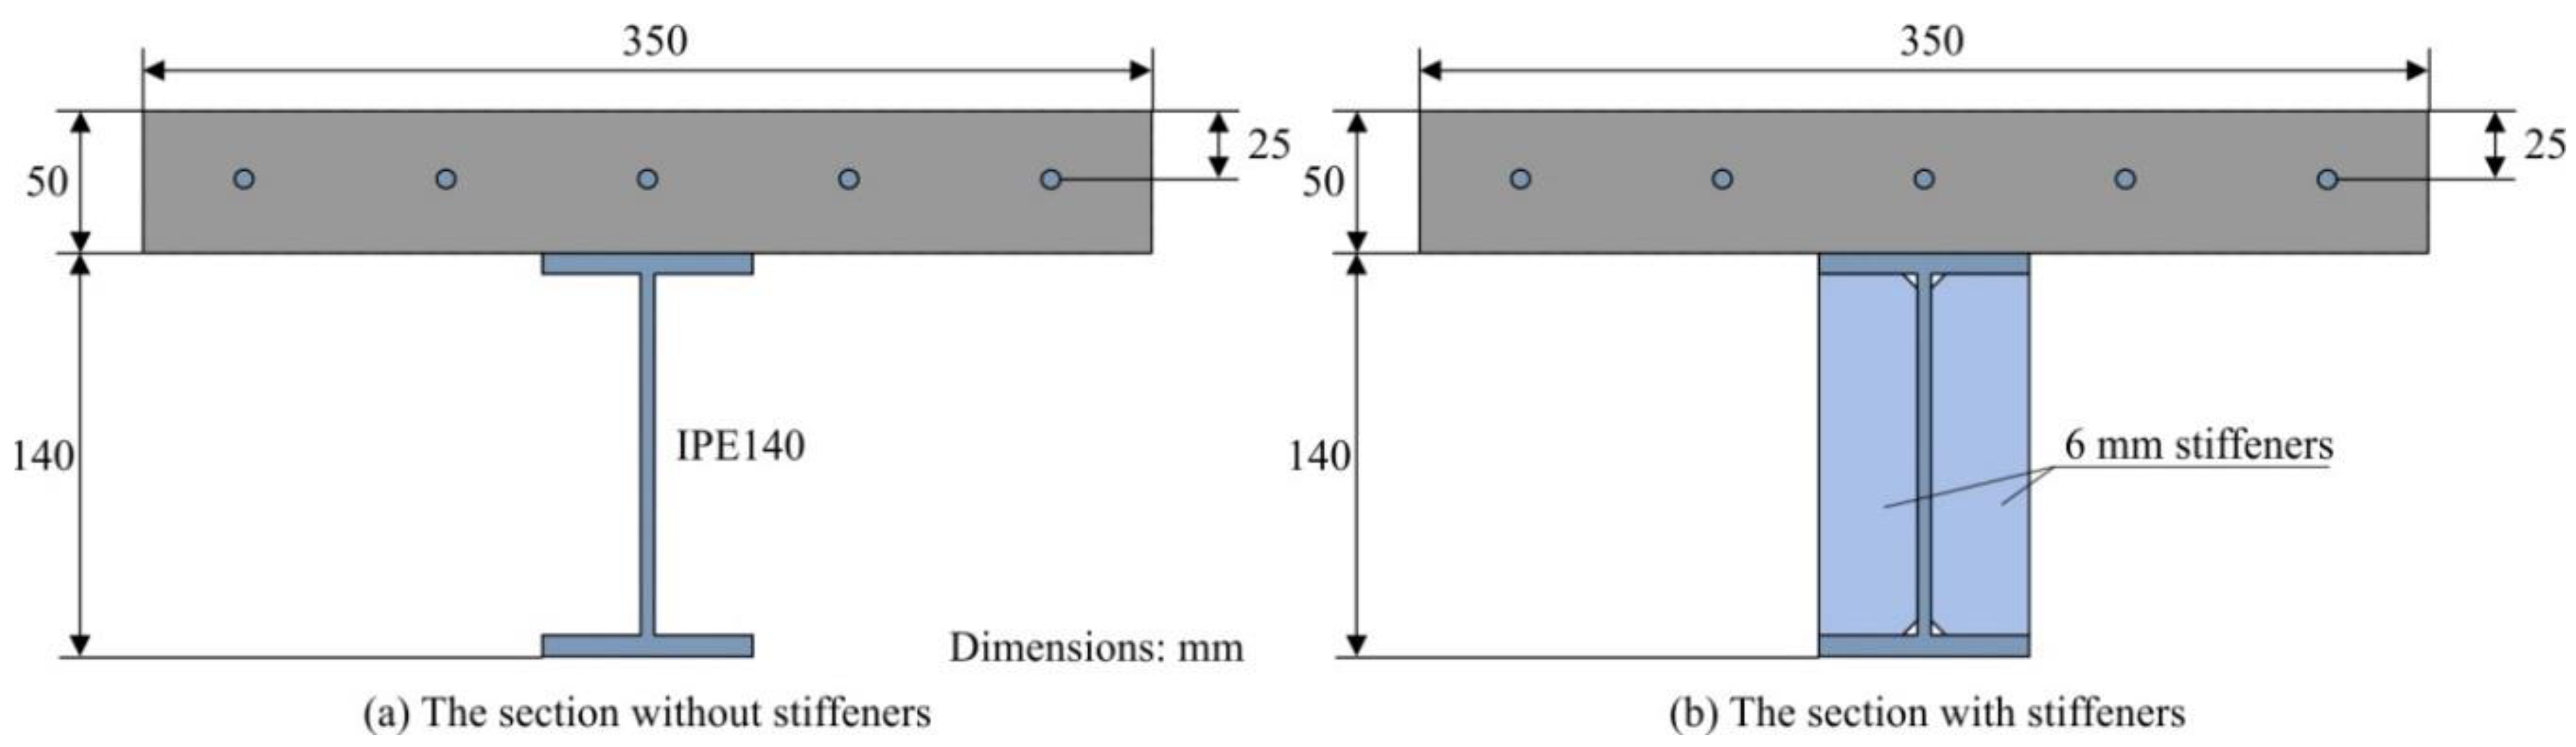
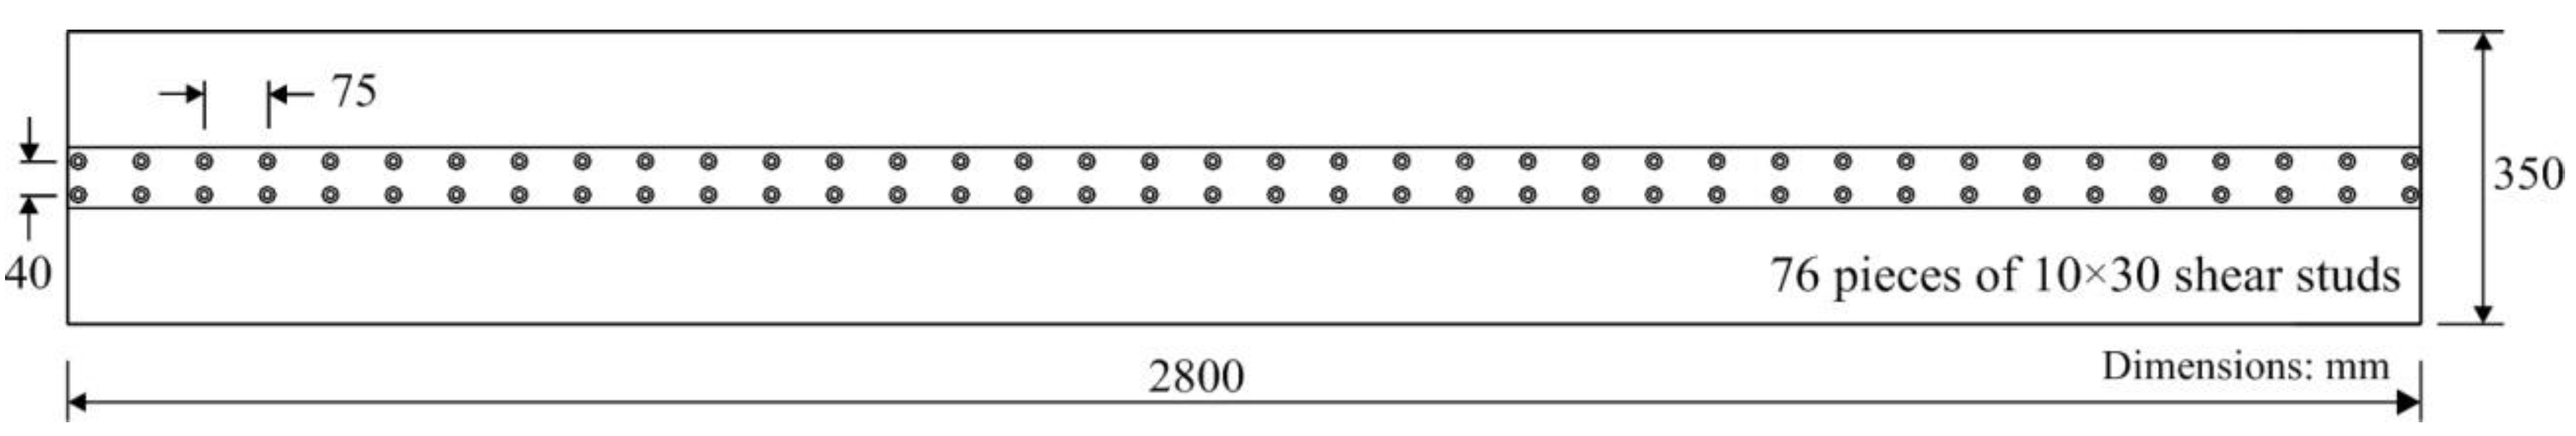
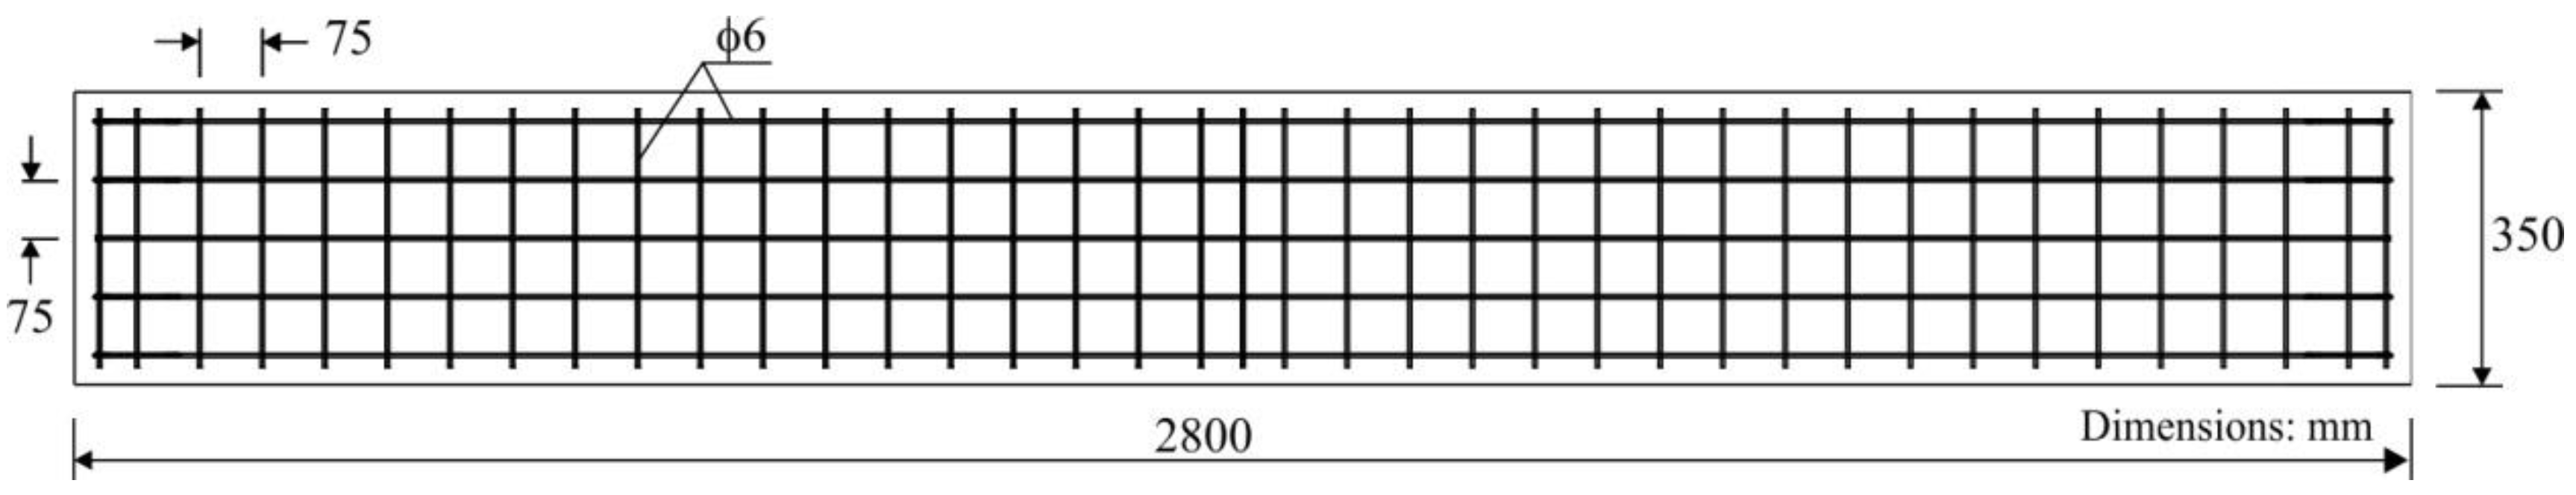
2.2. Specimen Design
2.3. Fabrication
2.4. Test Setup and Instrumentation
2.5. Testing Configuration
3. Results
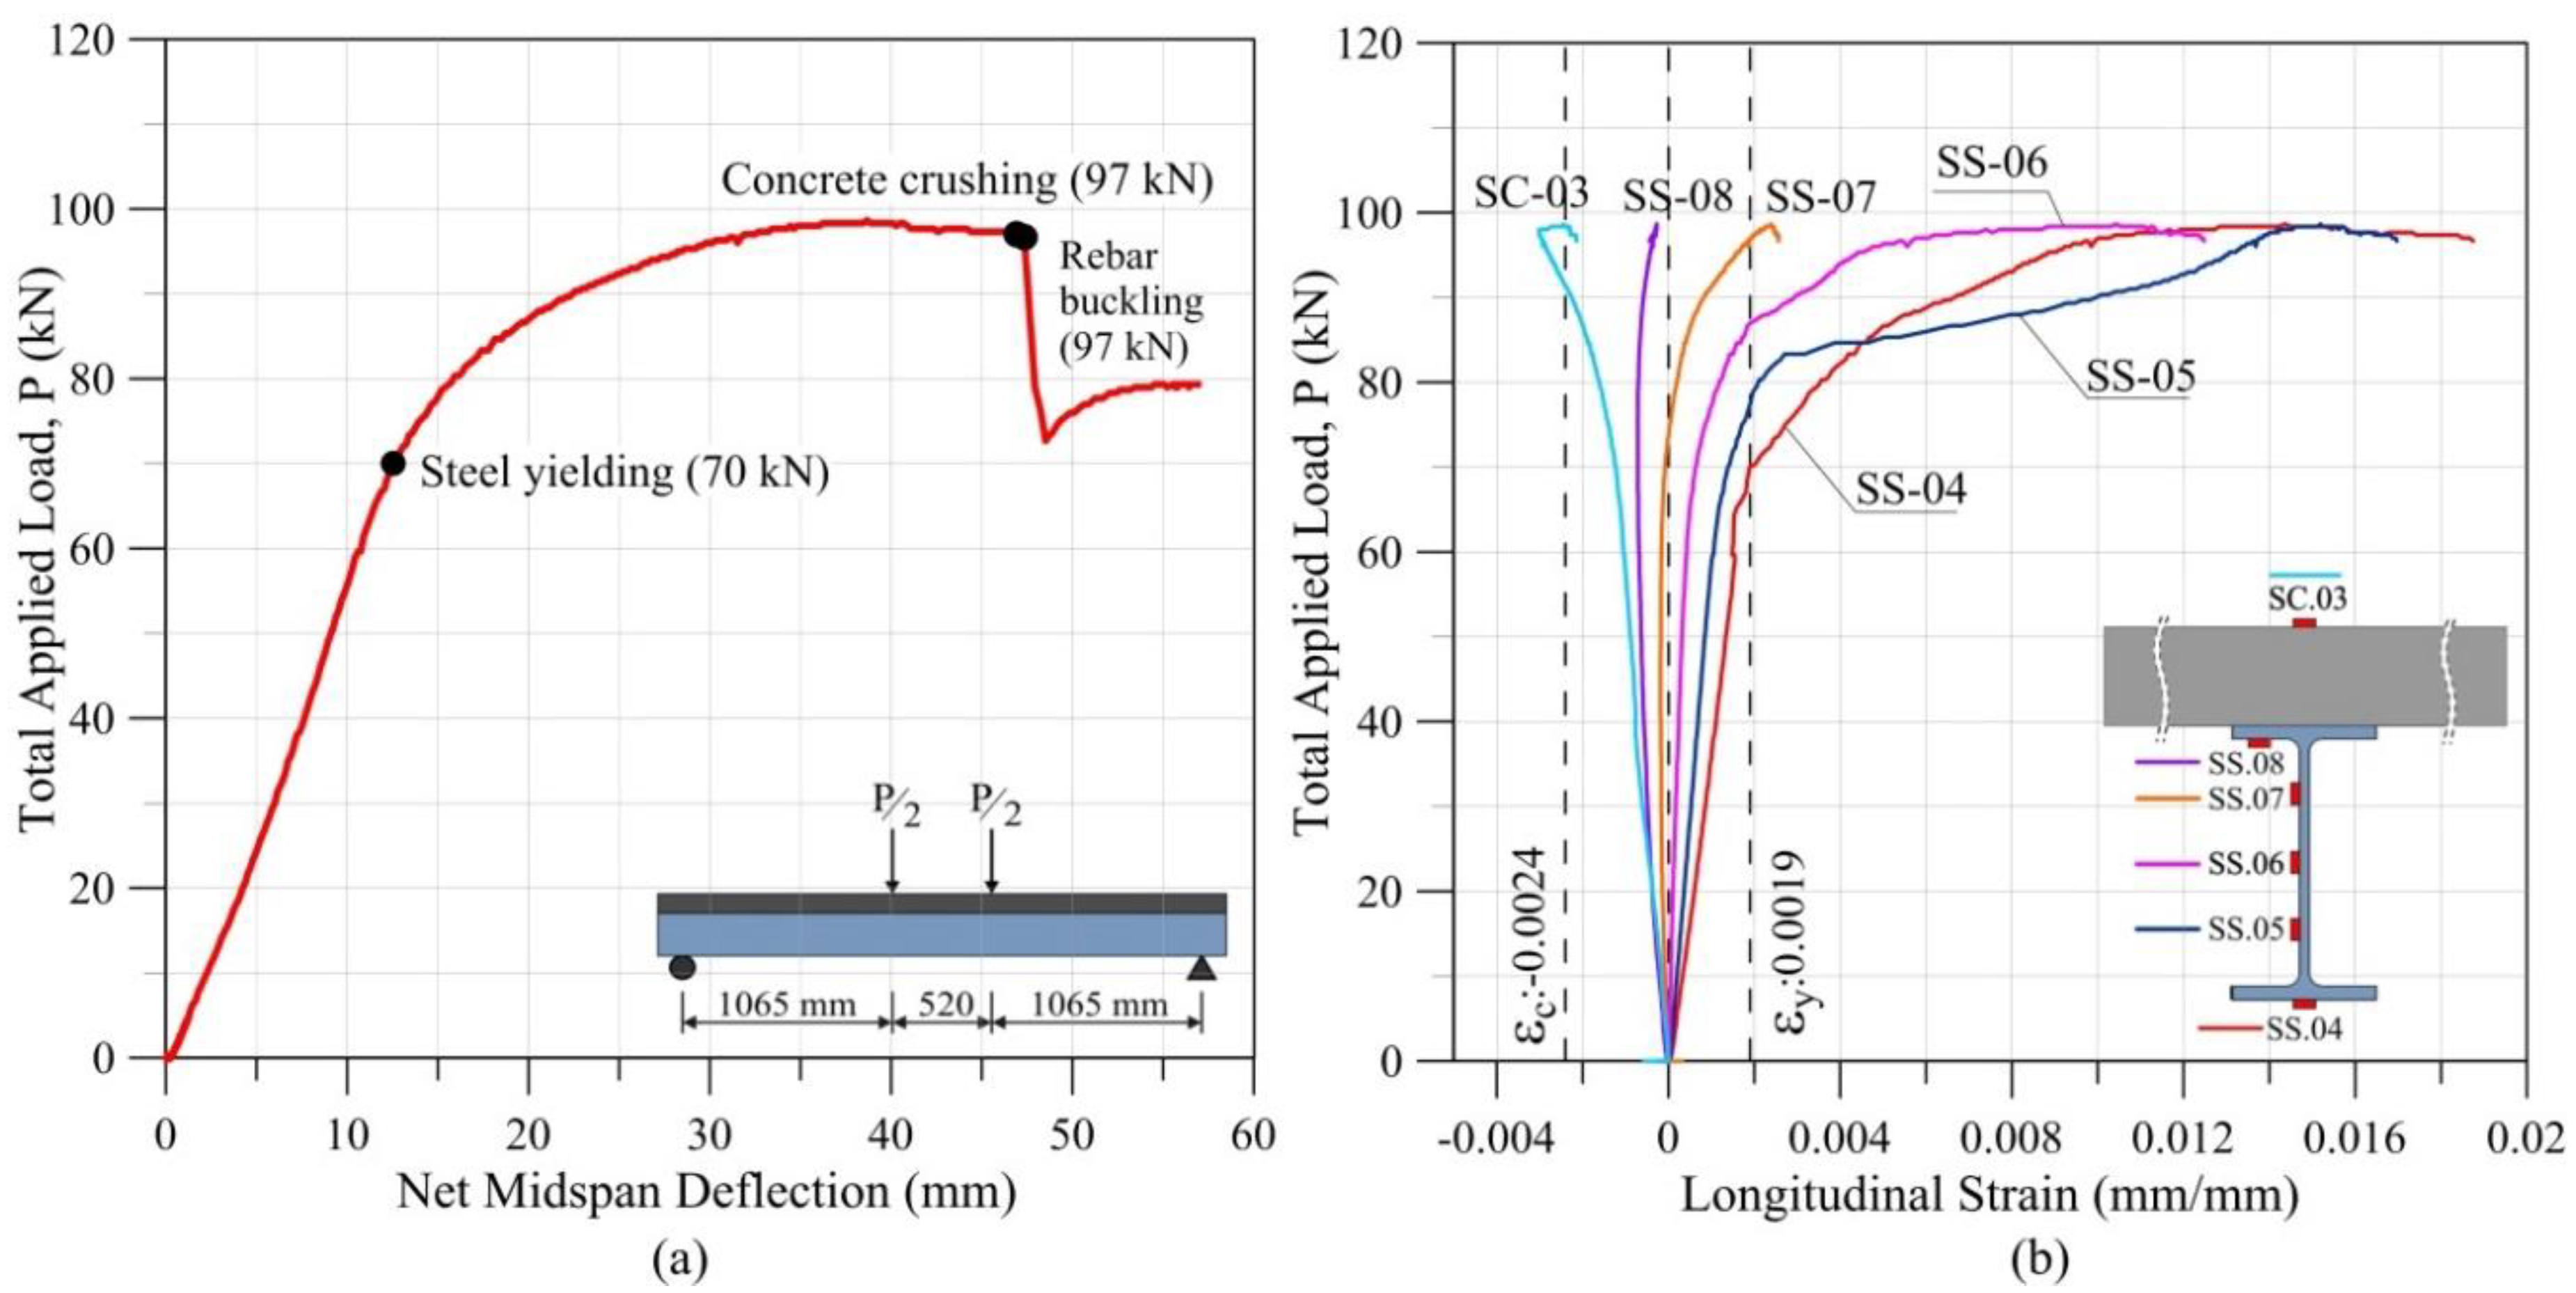
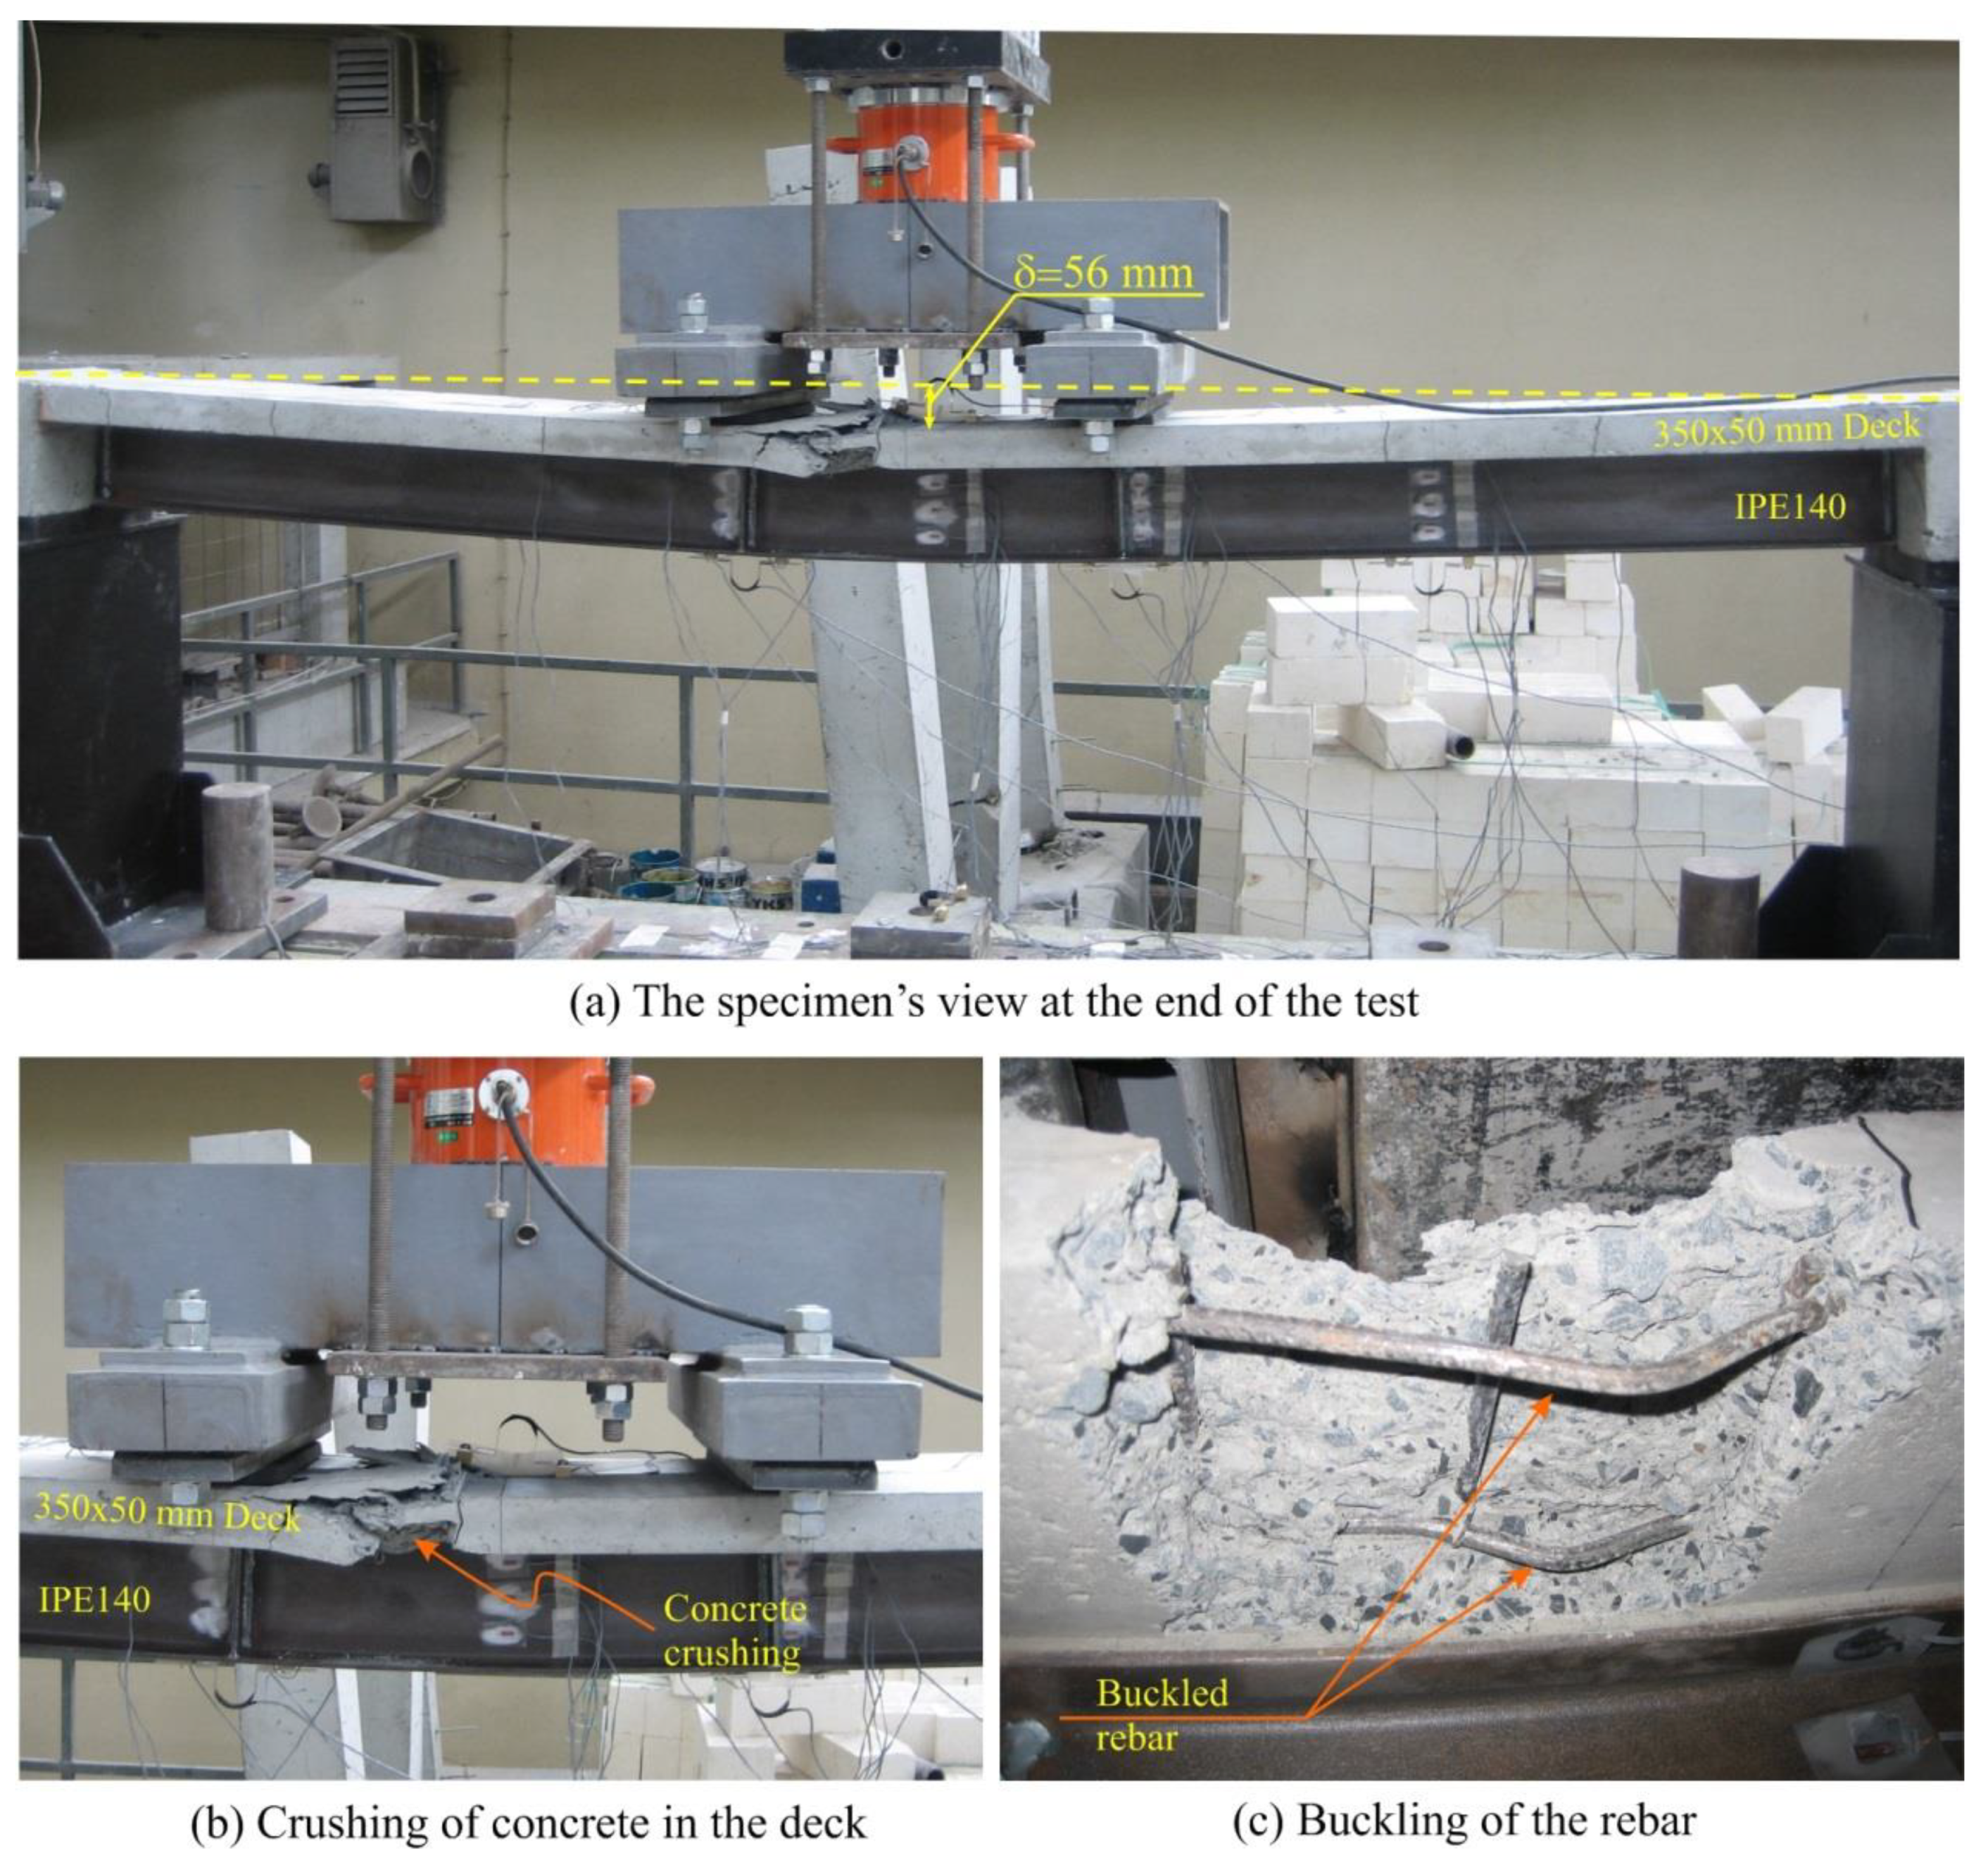
3.1. Specimen GS
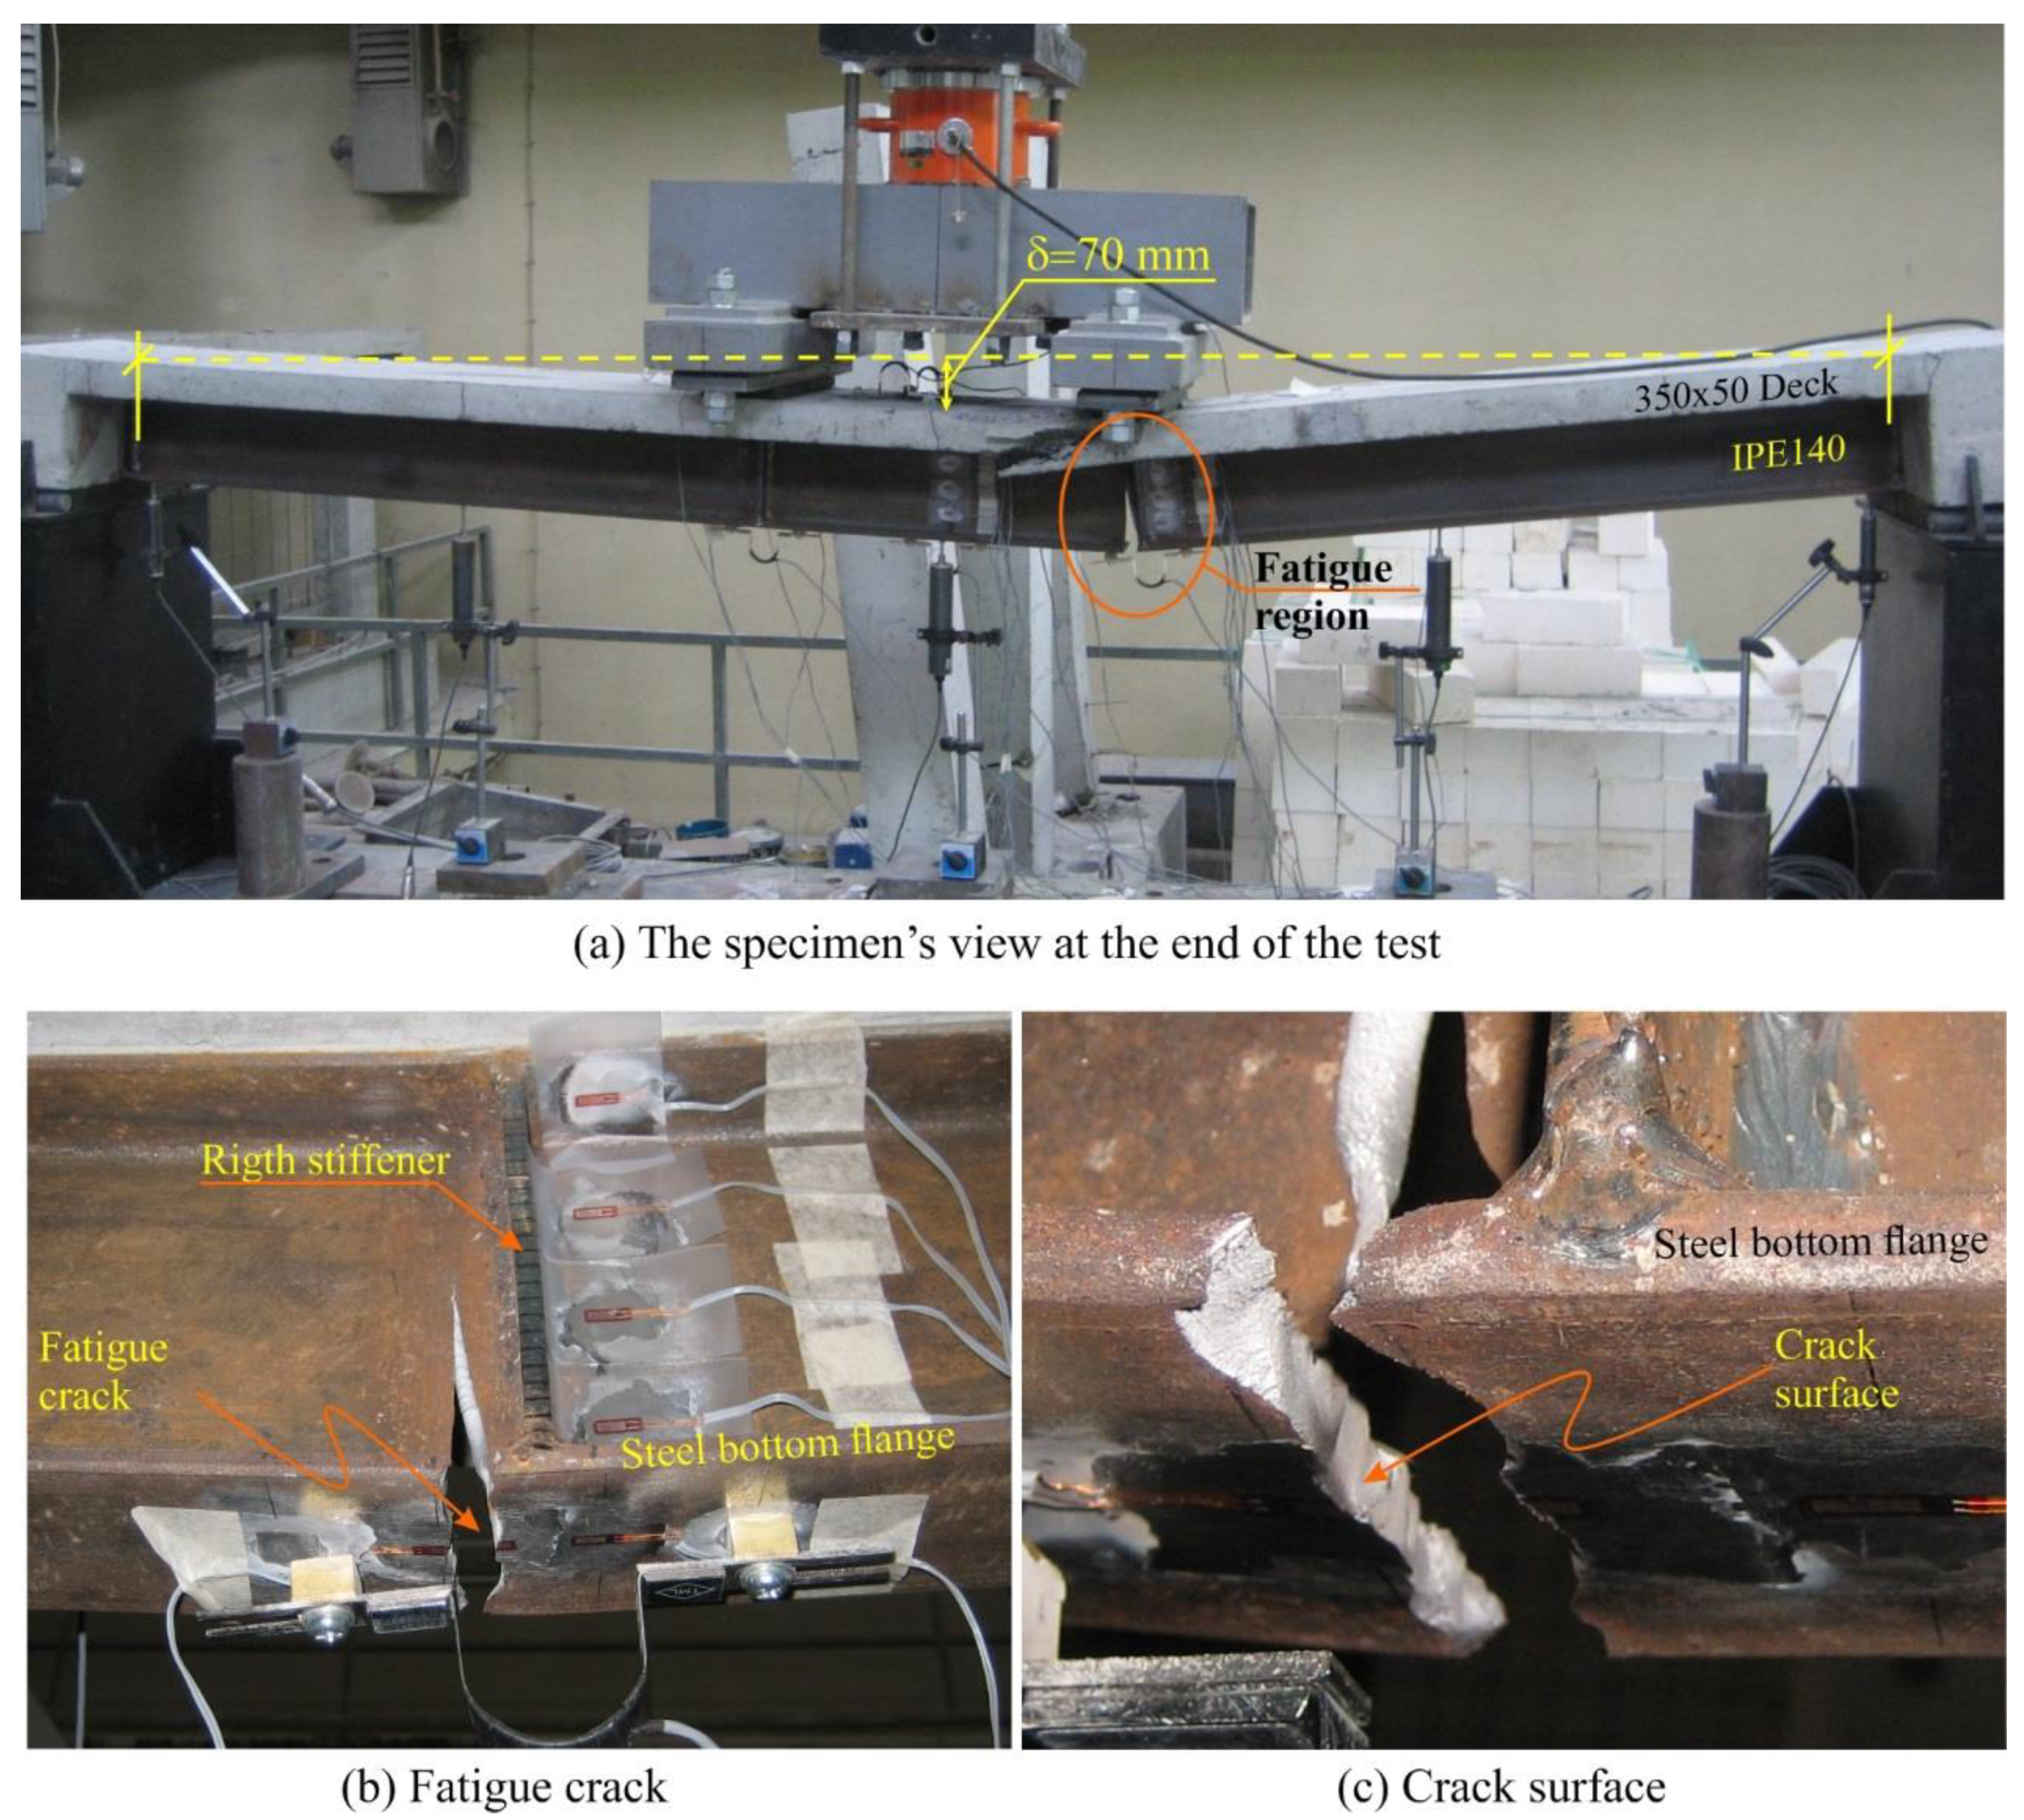
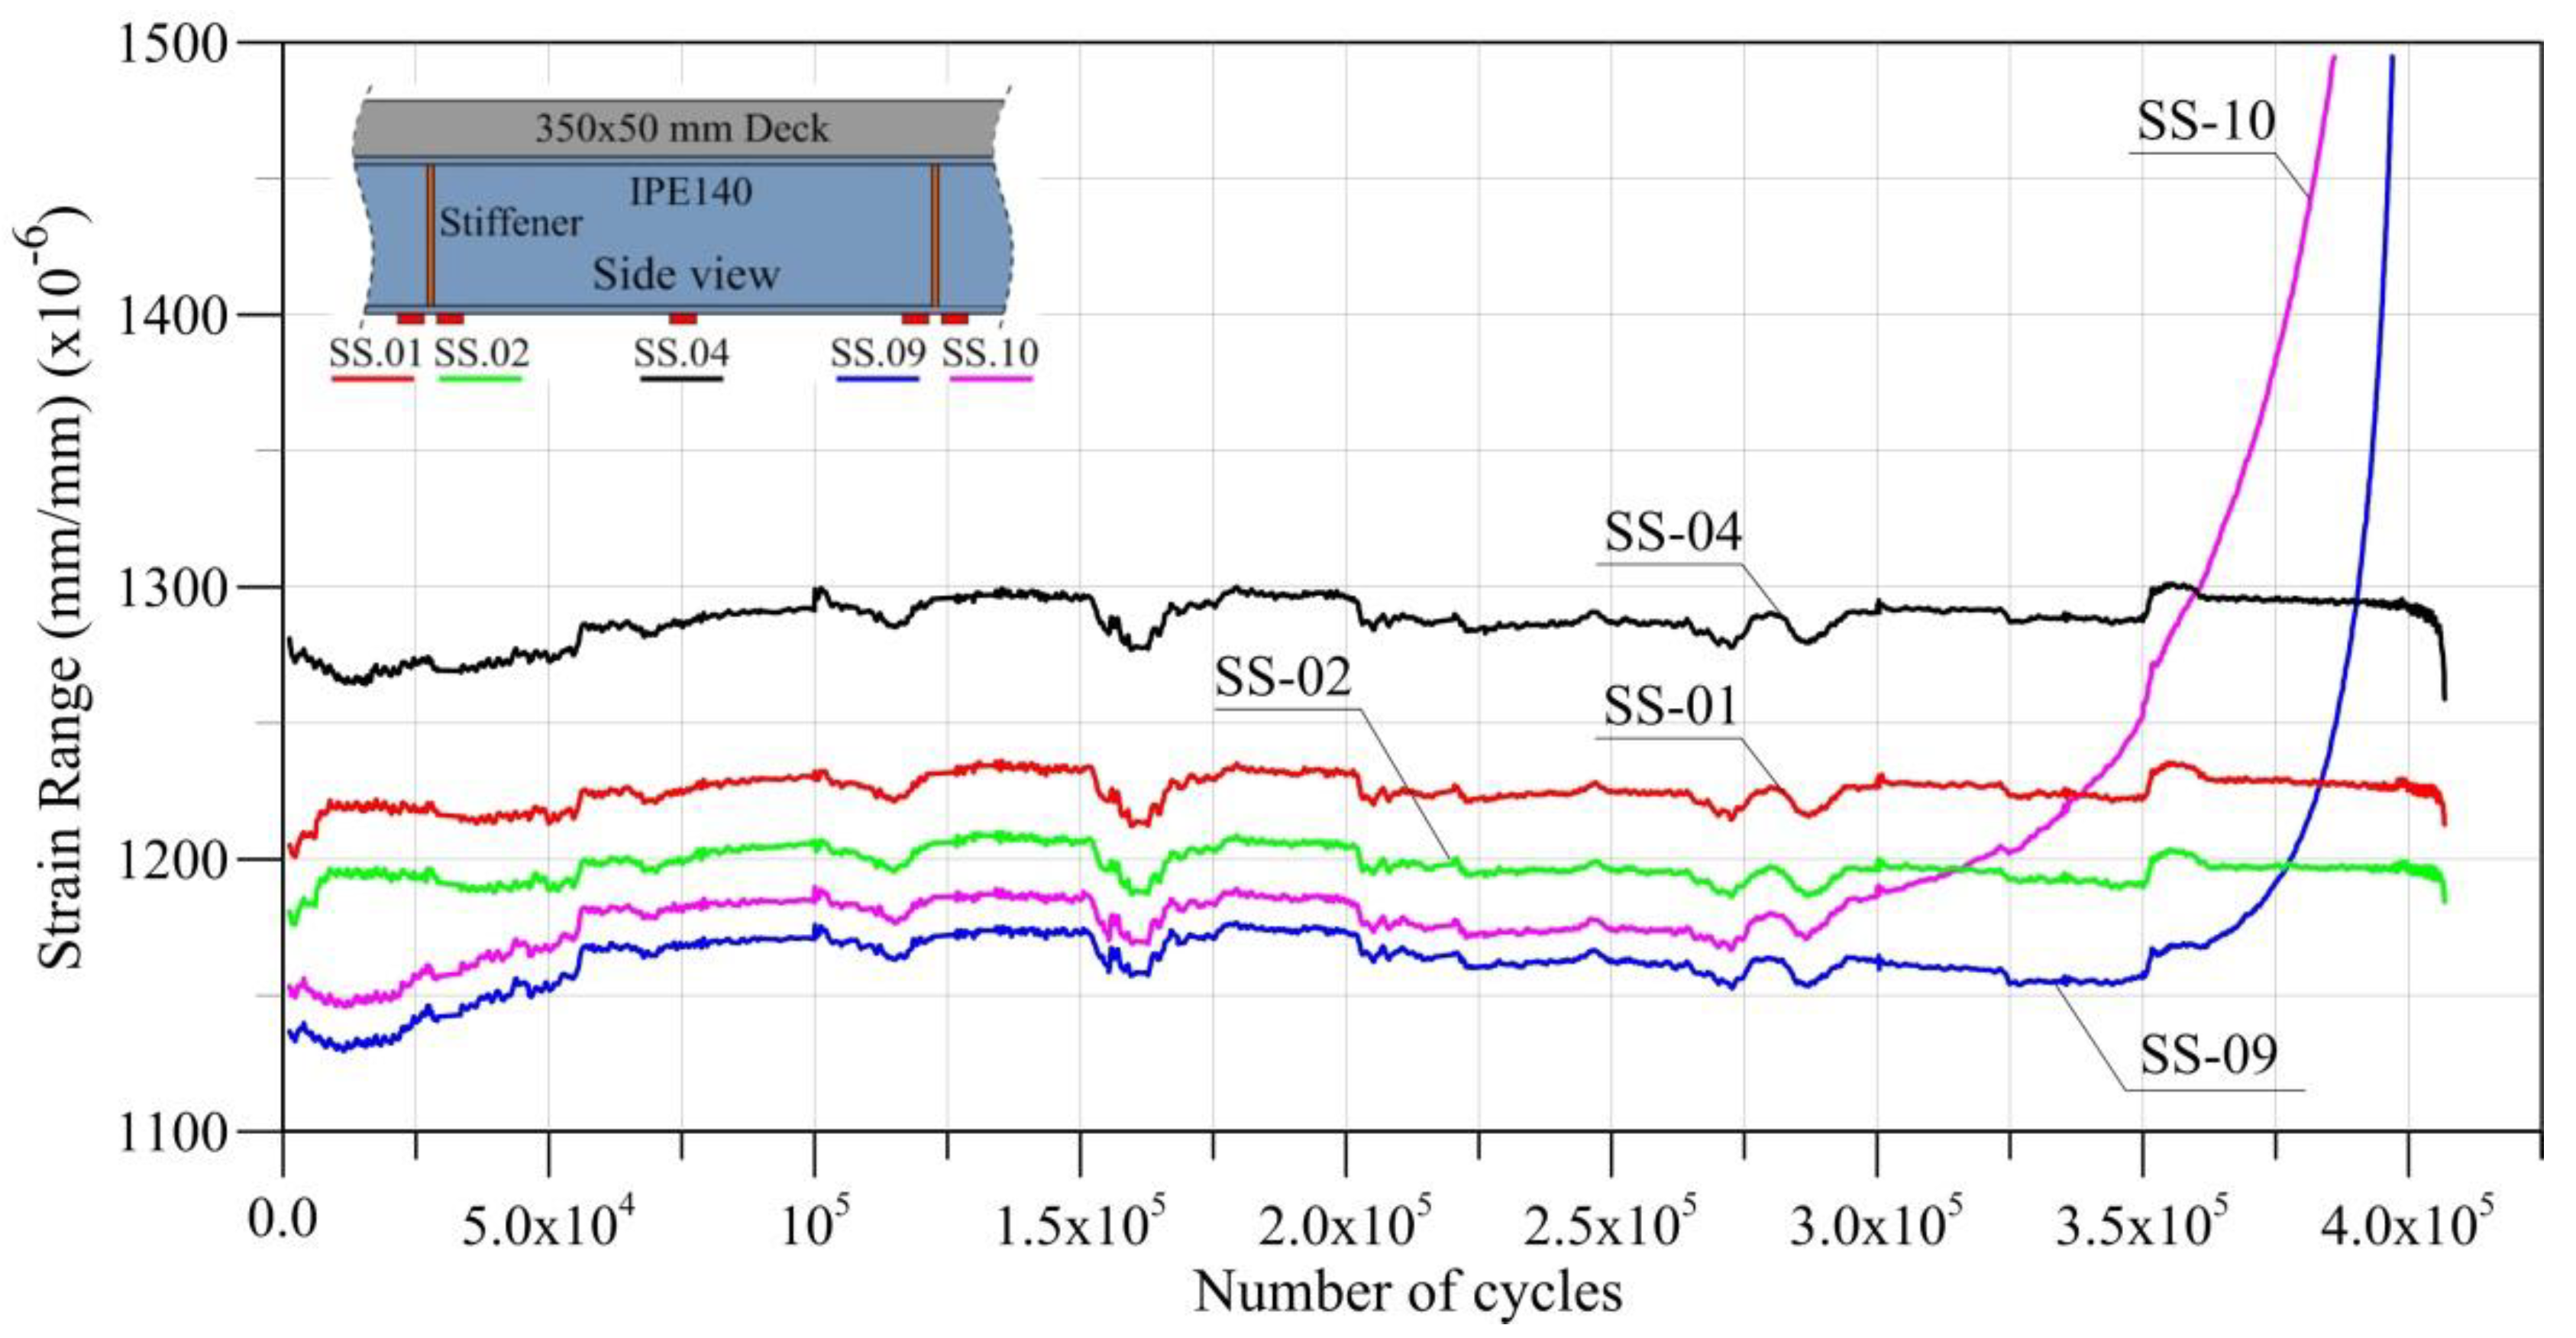
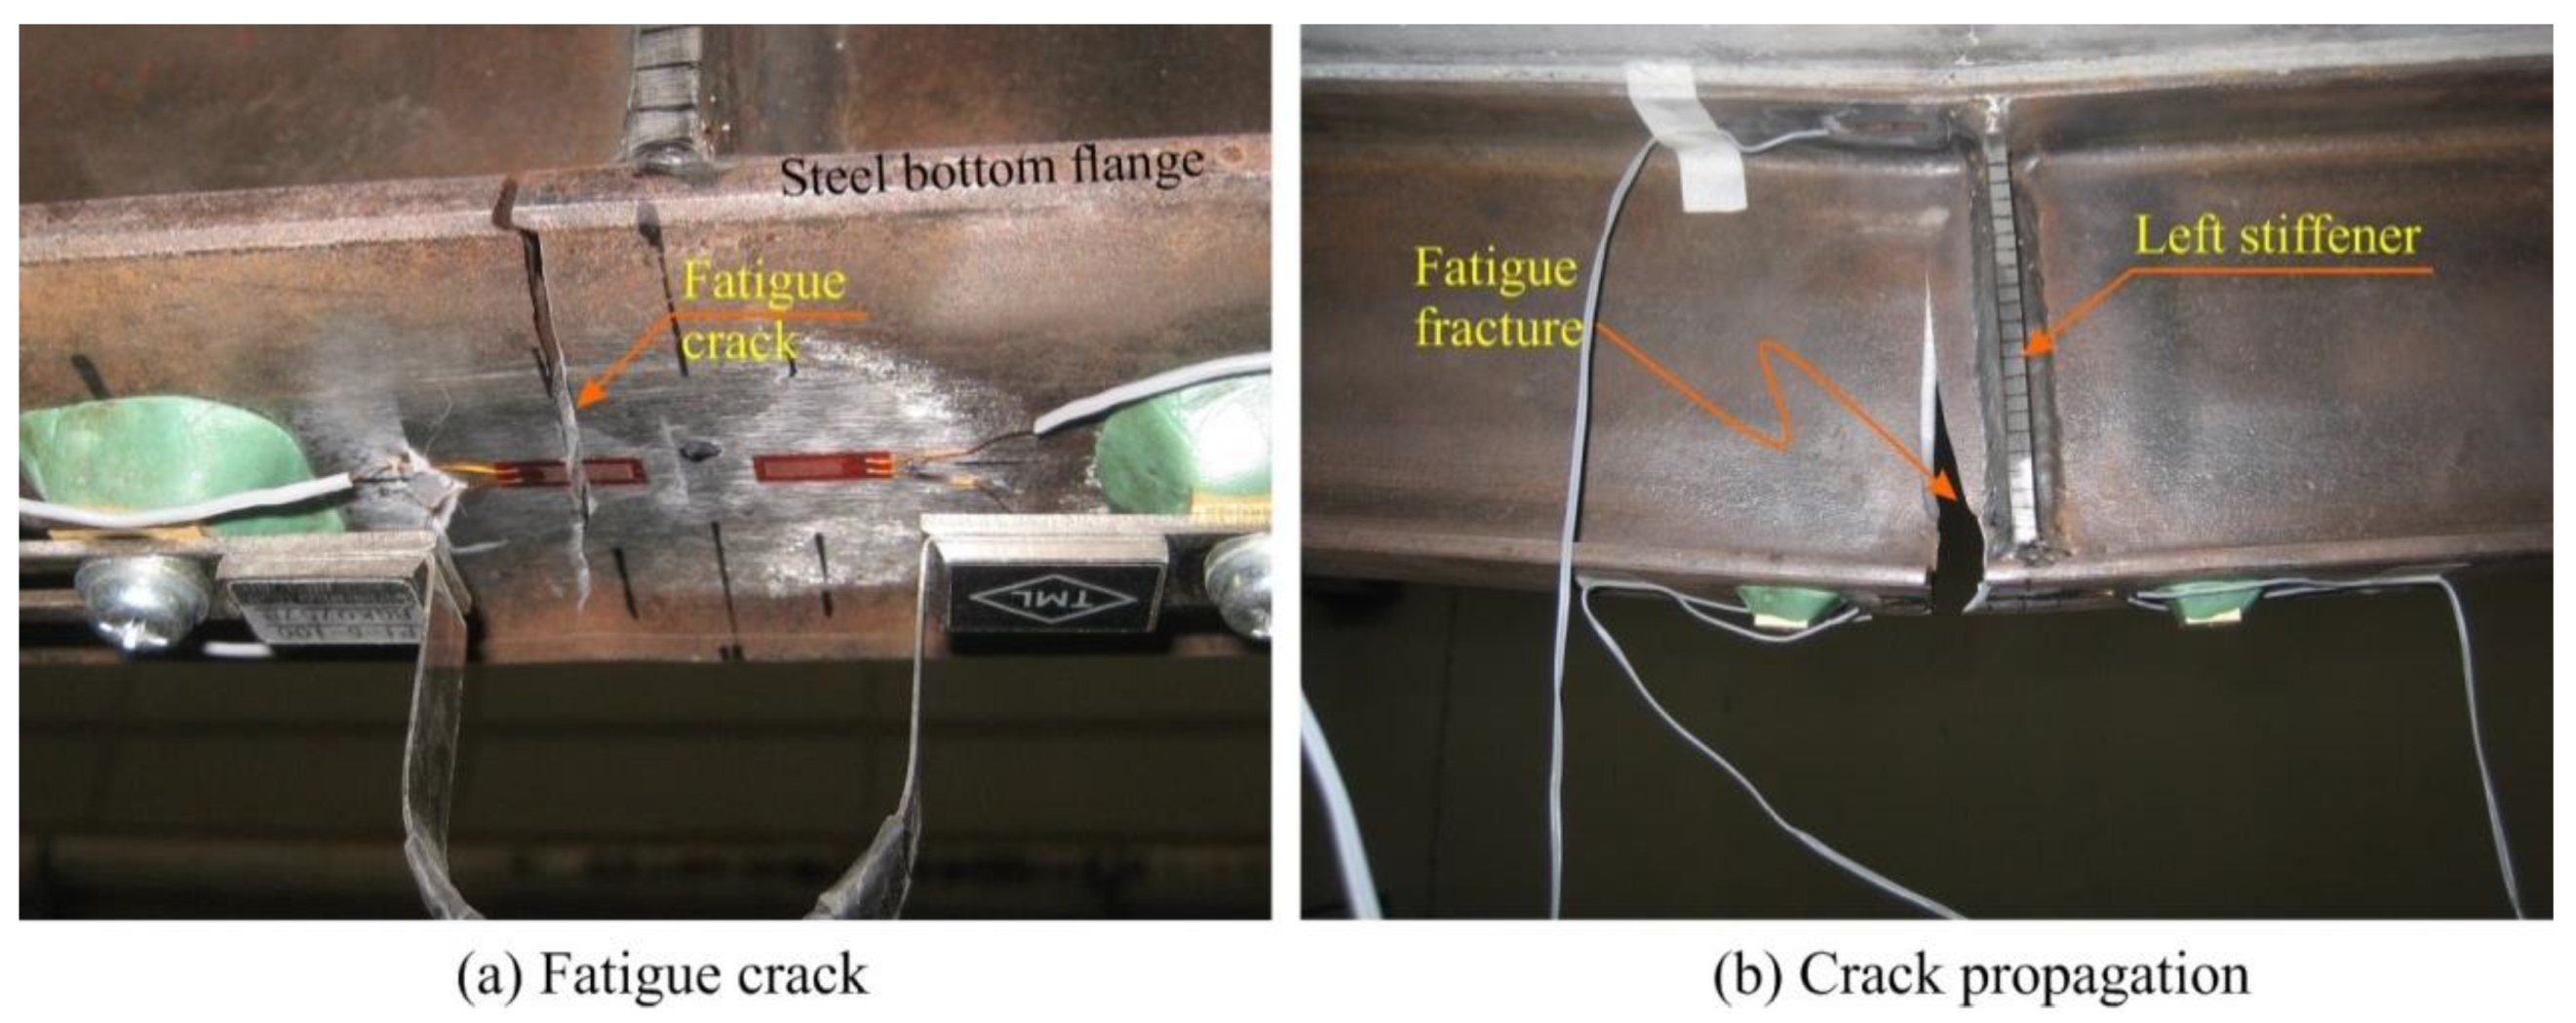
3.2. Specimen GF1
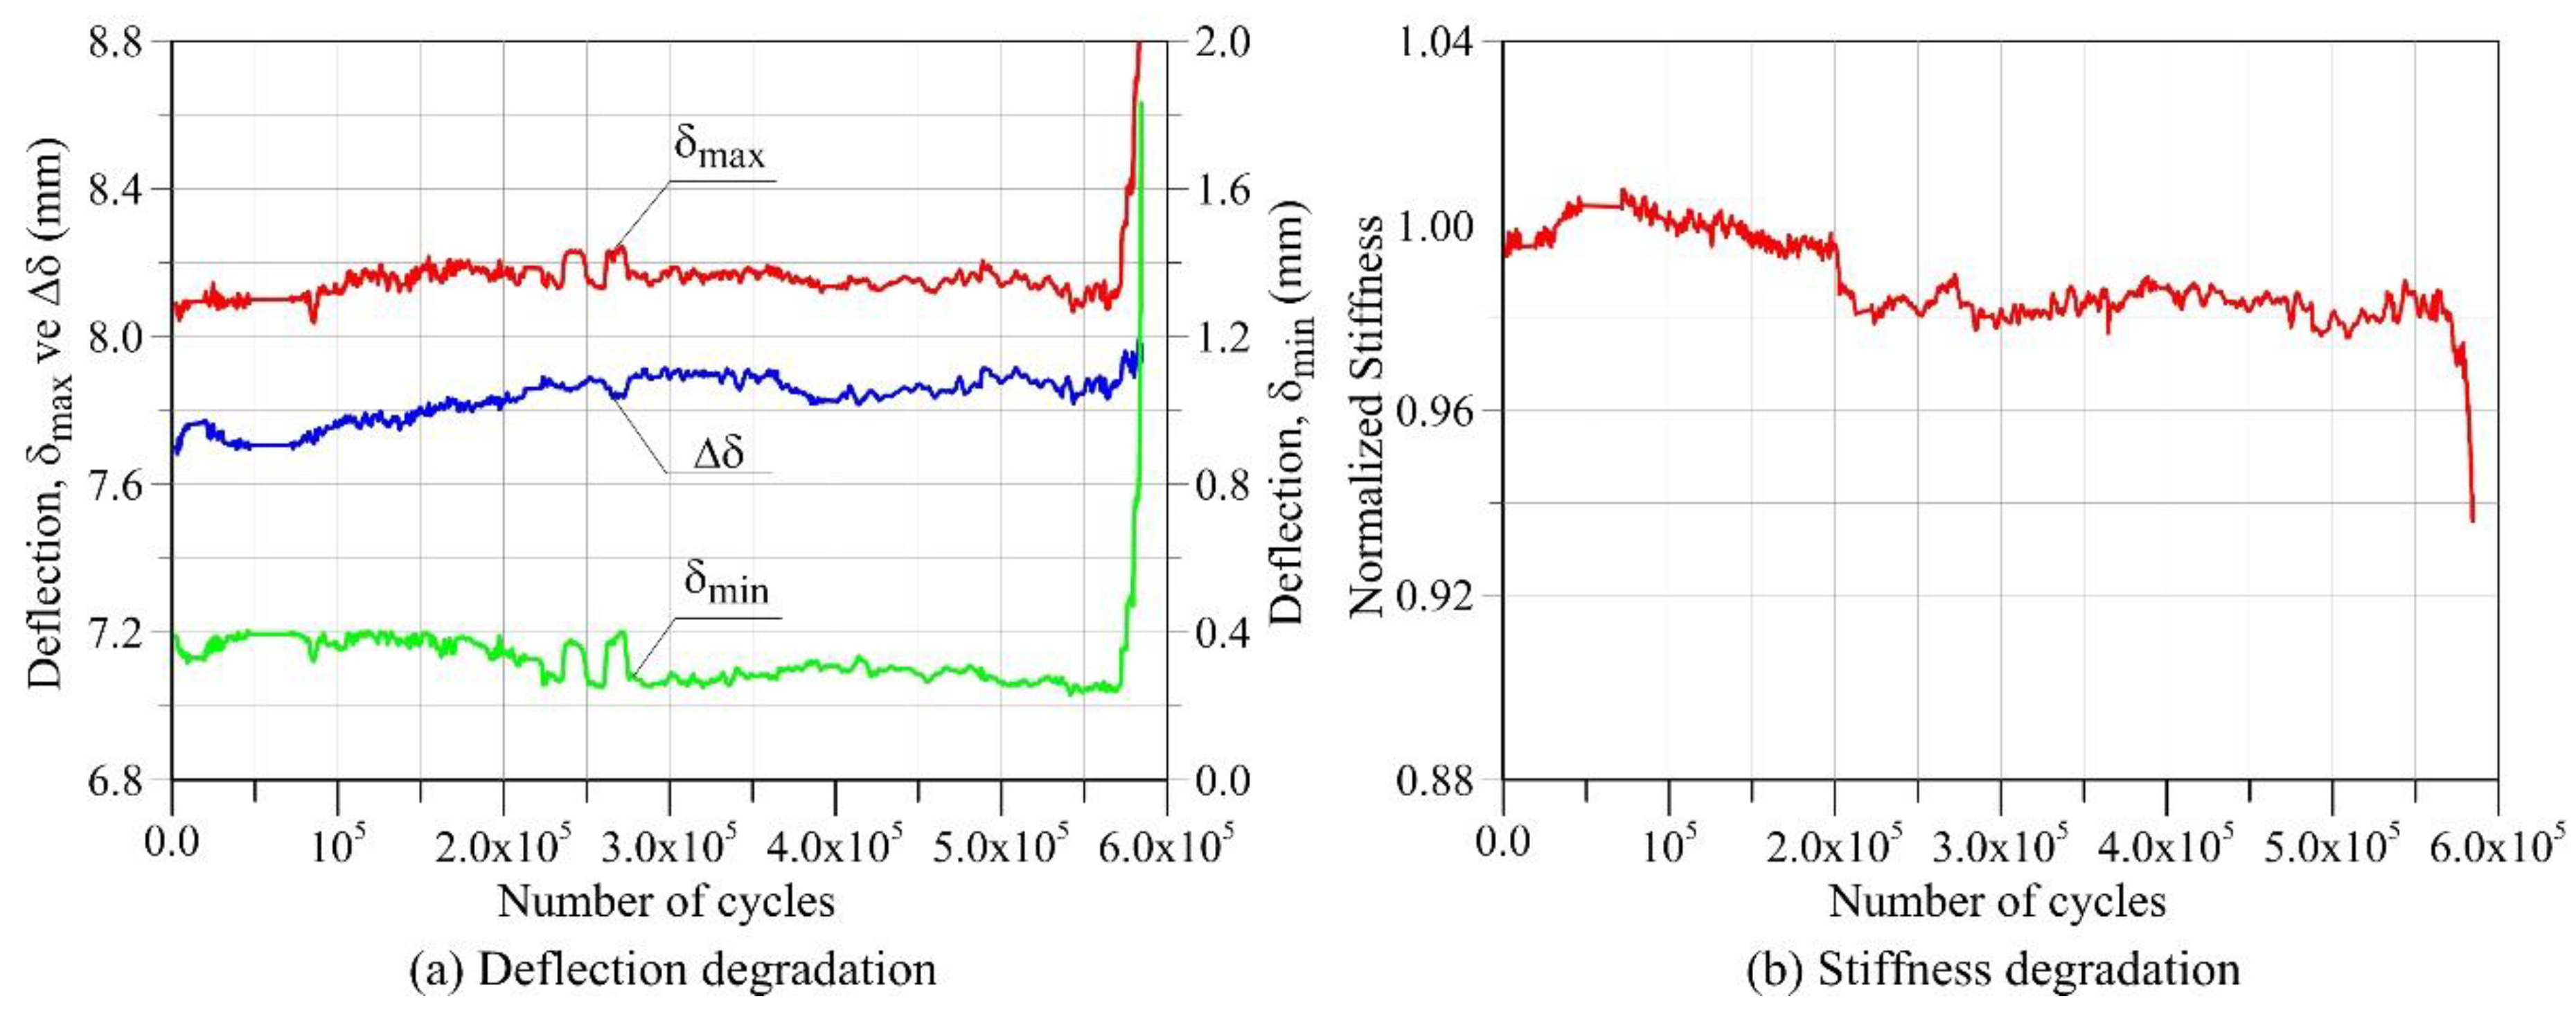
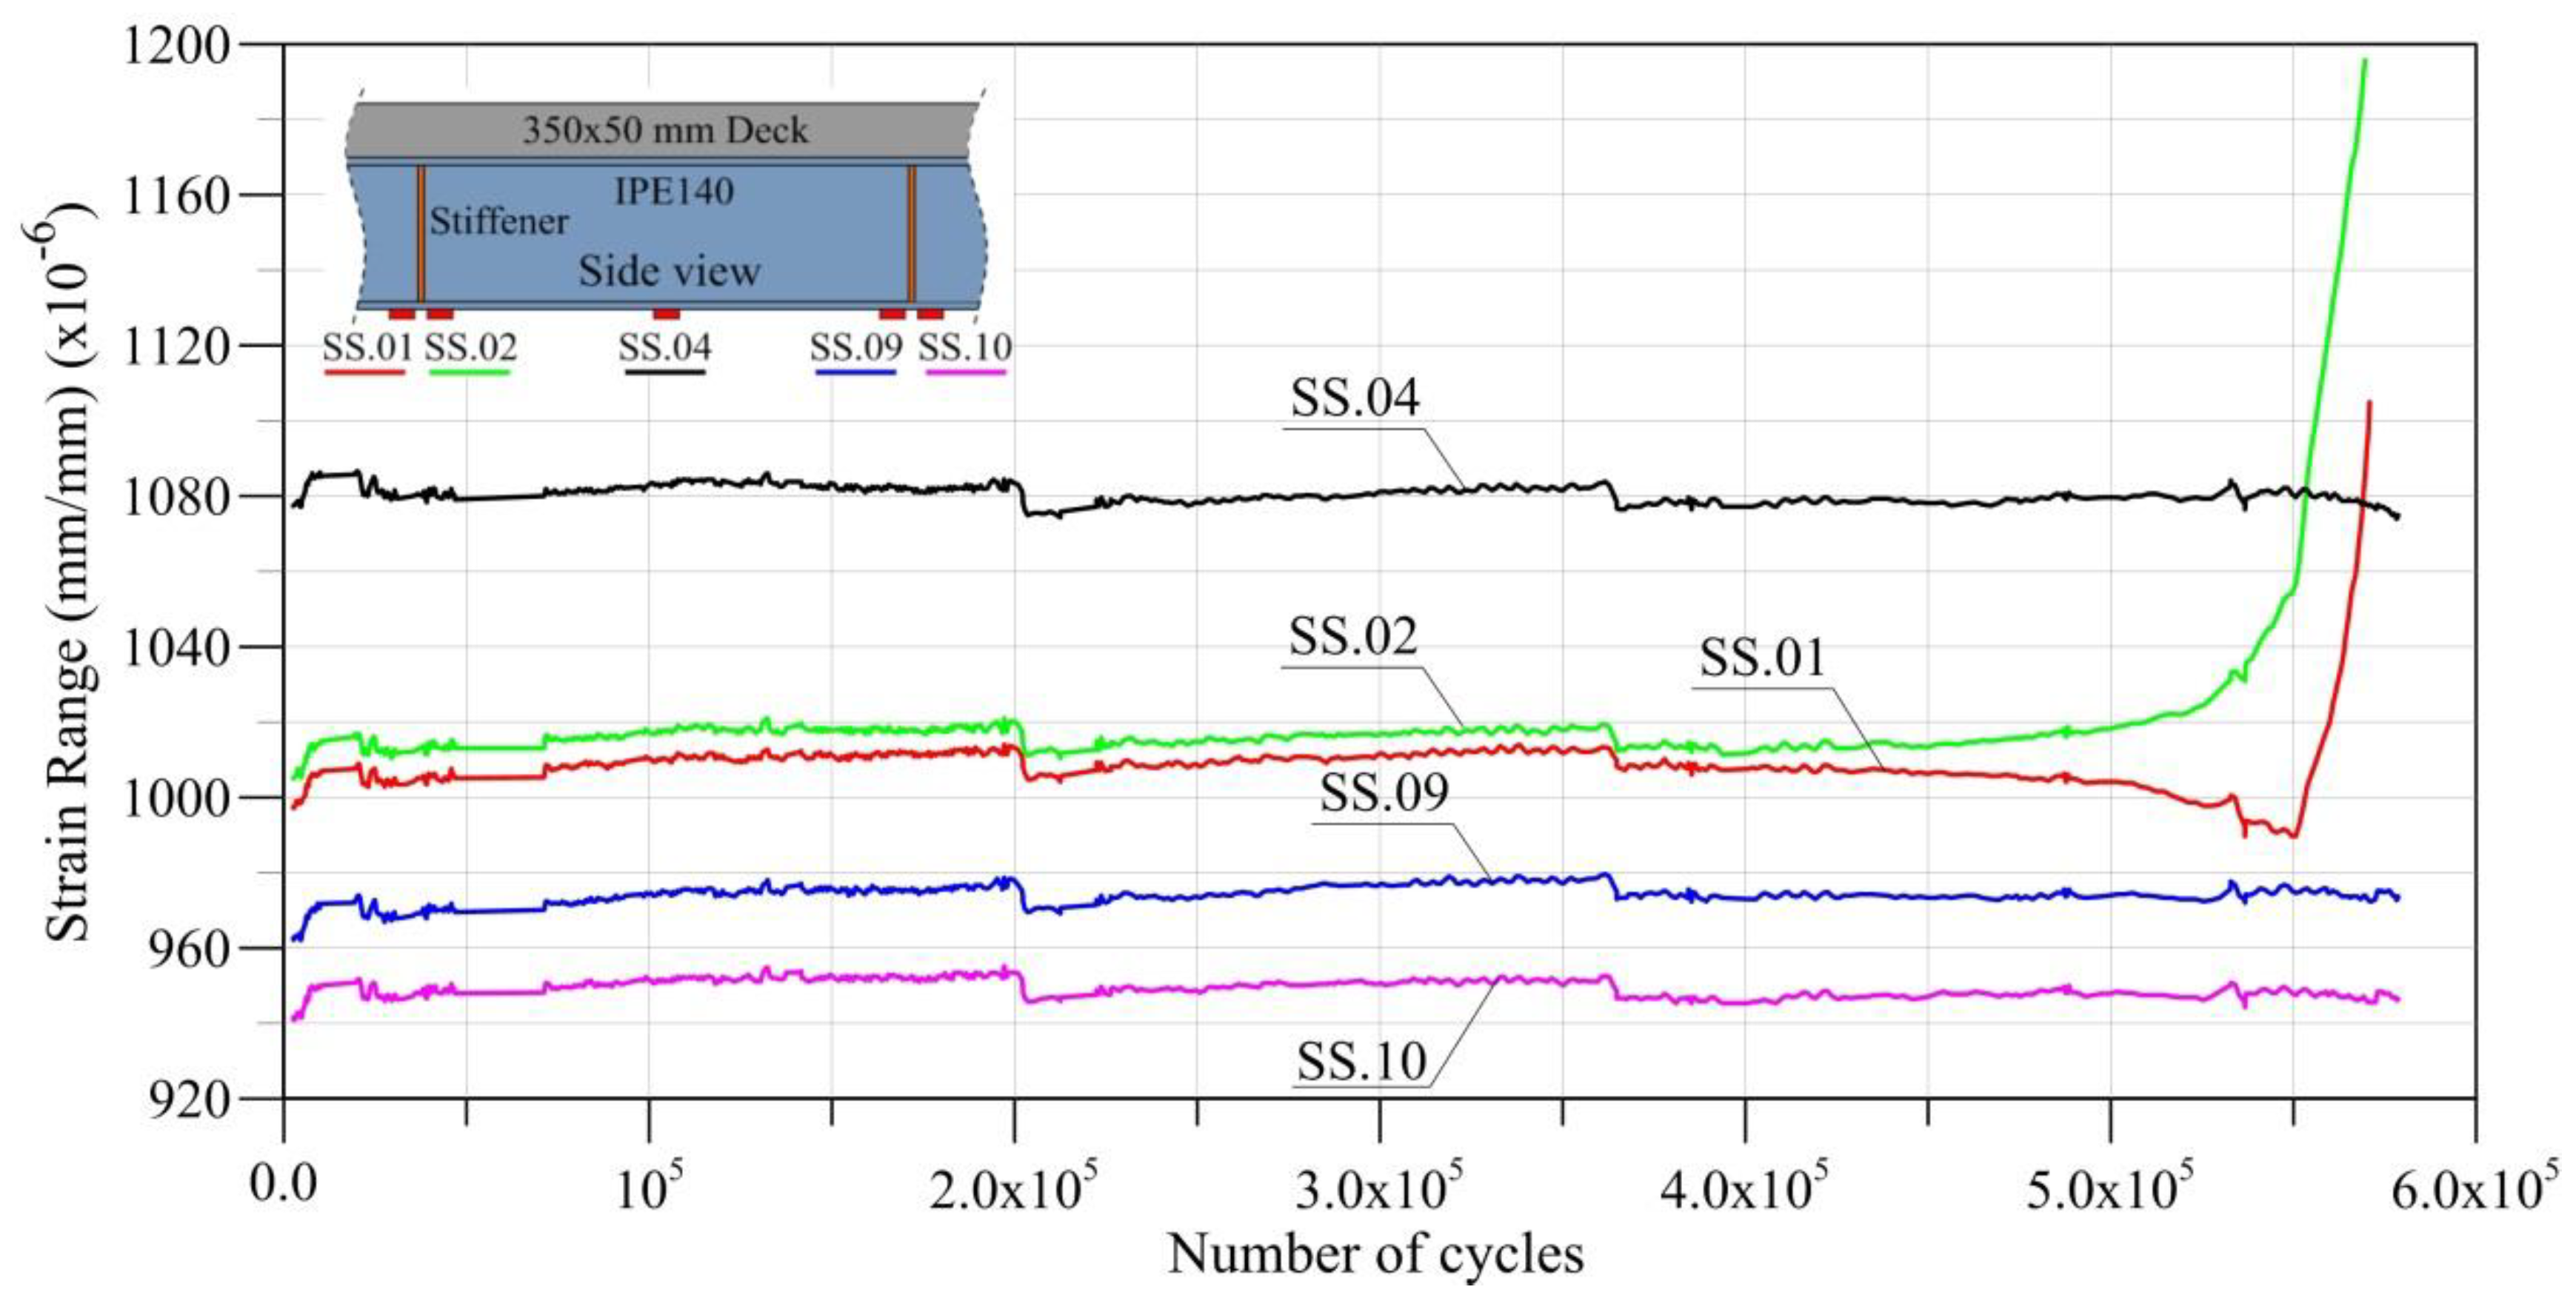
3.3. Specimen GF2
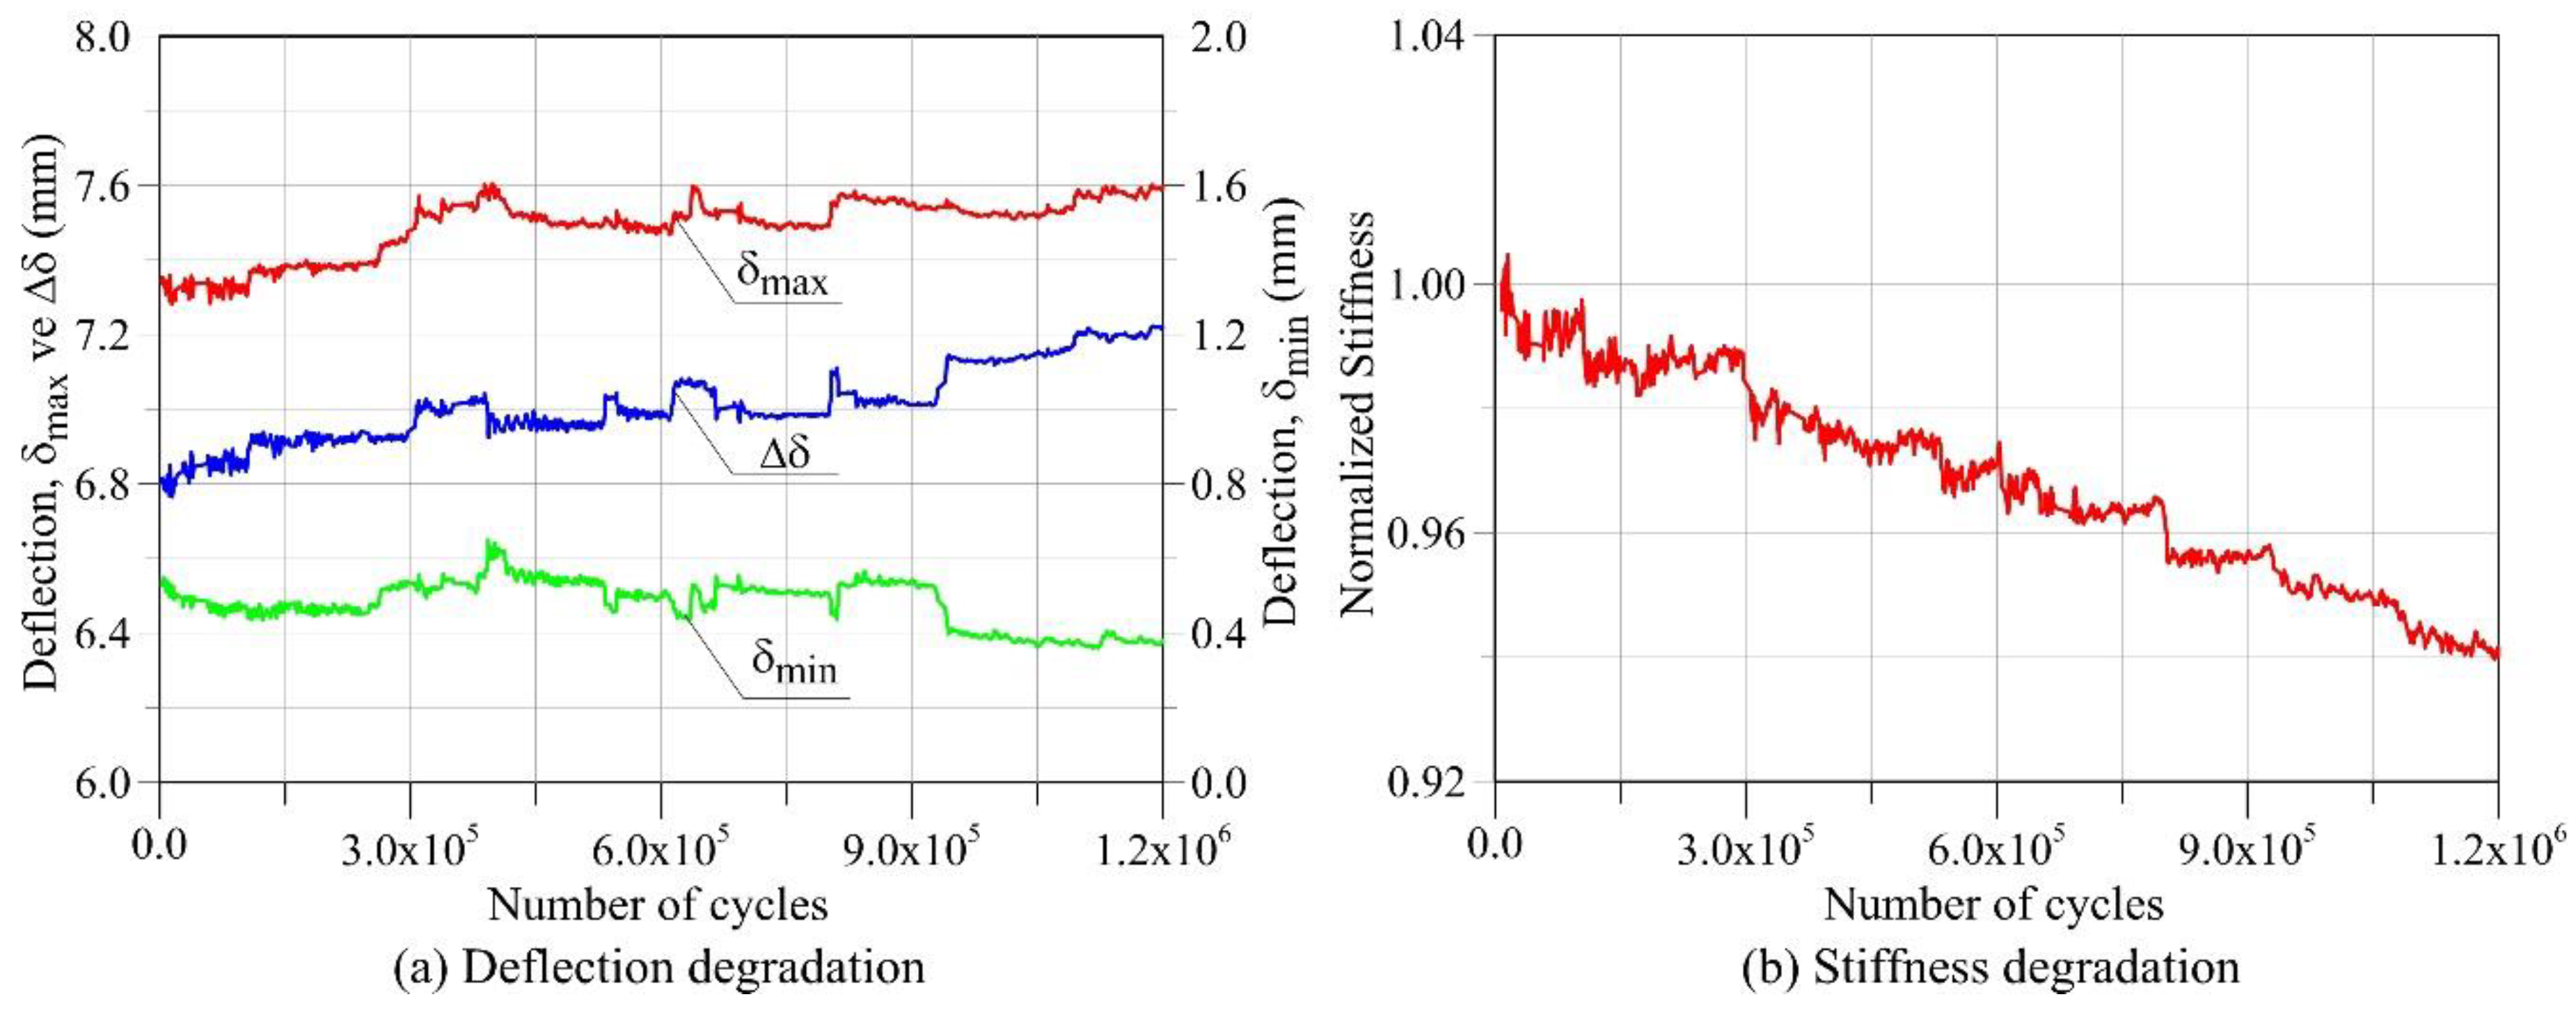
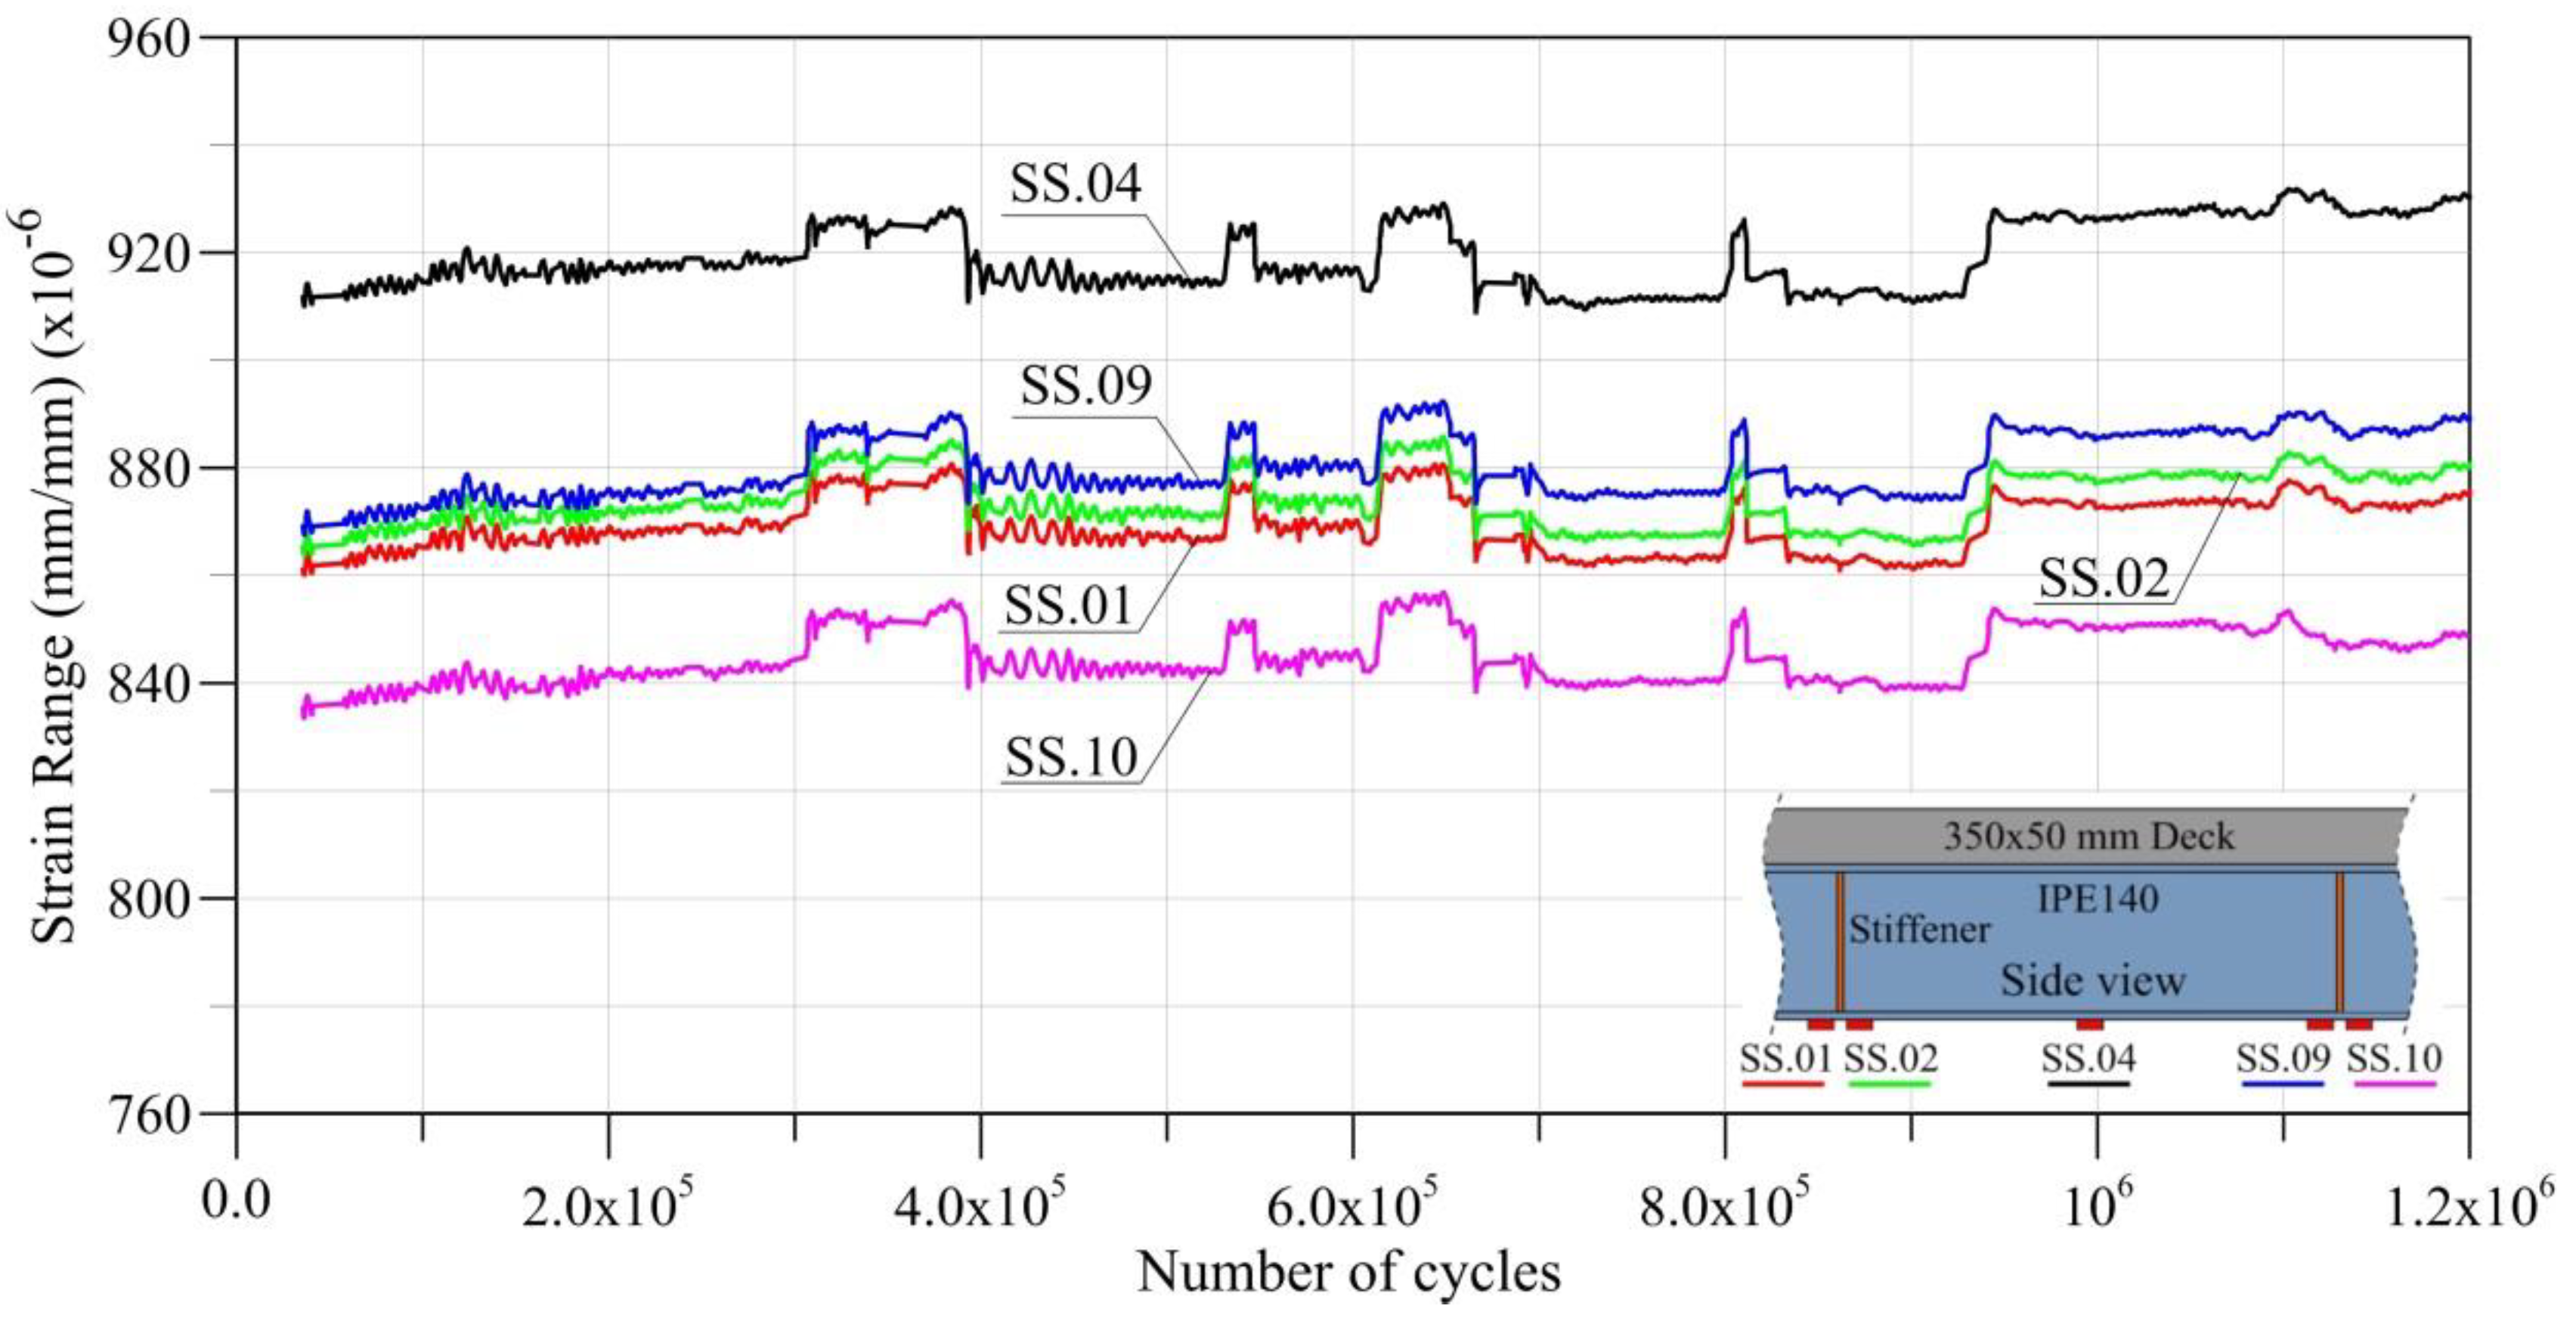
3.4. Specimen GF3a
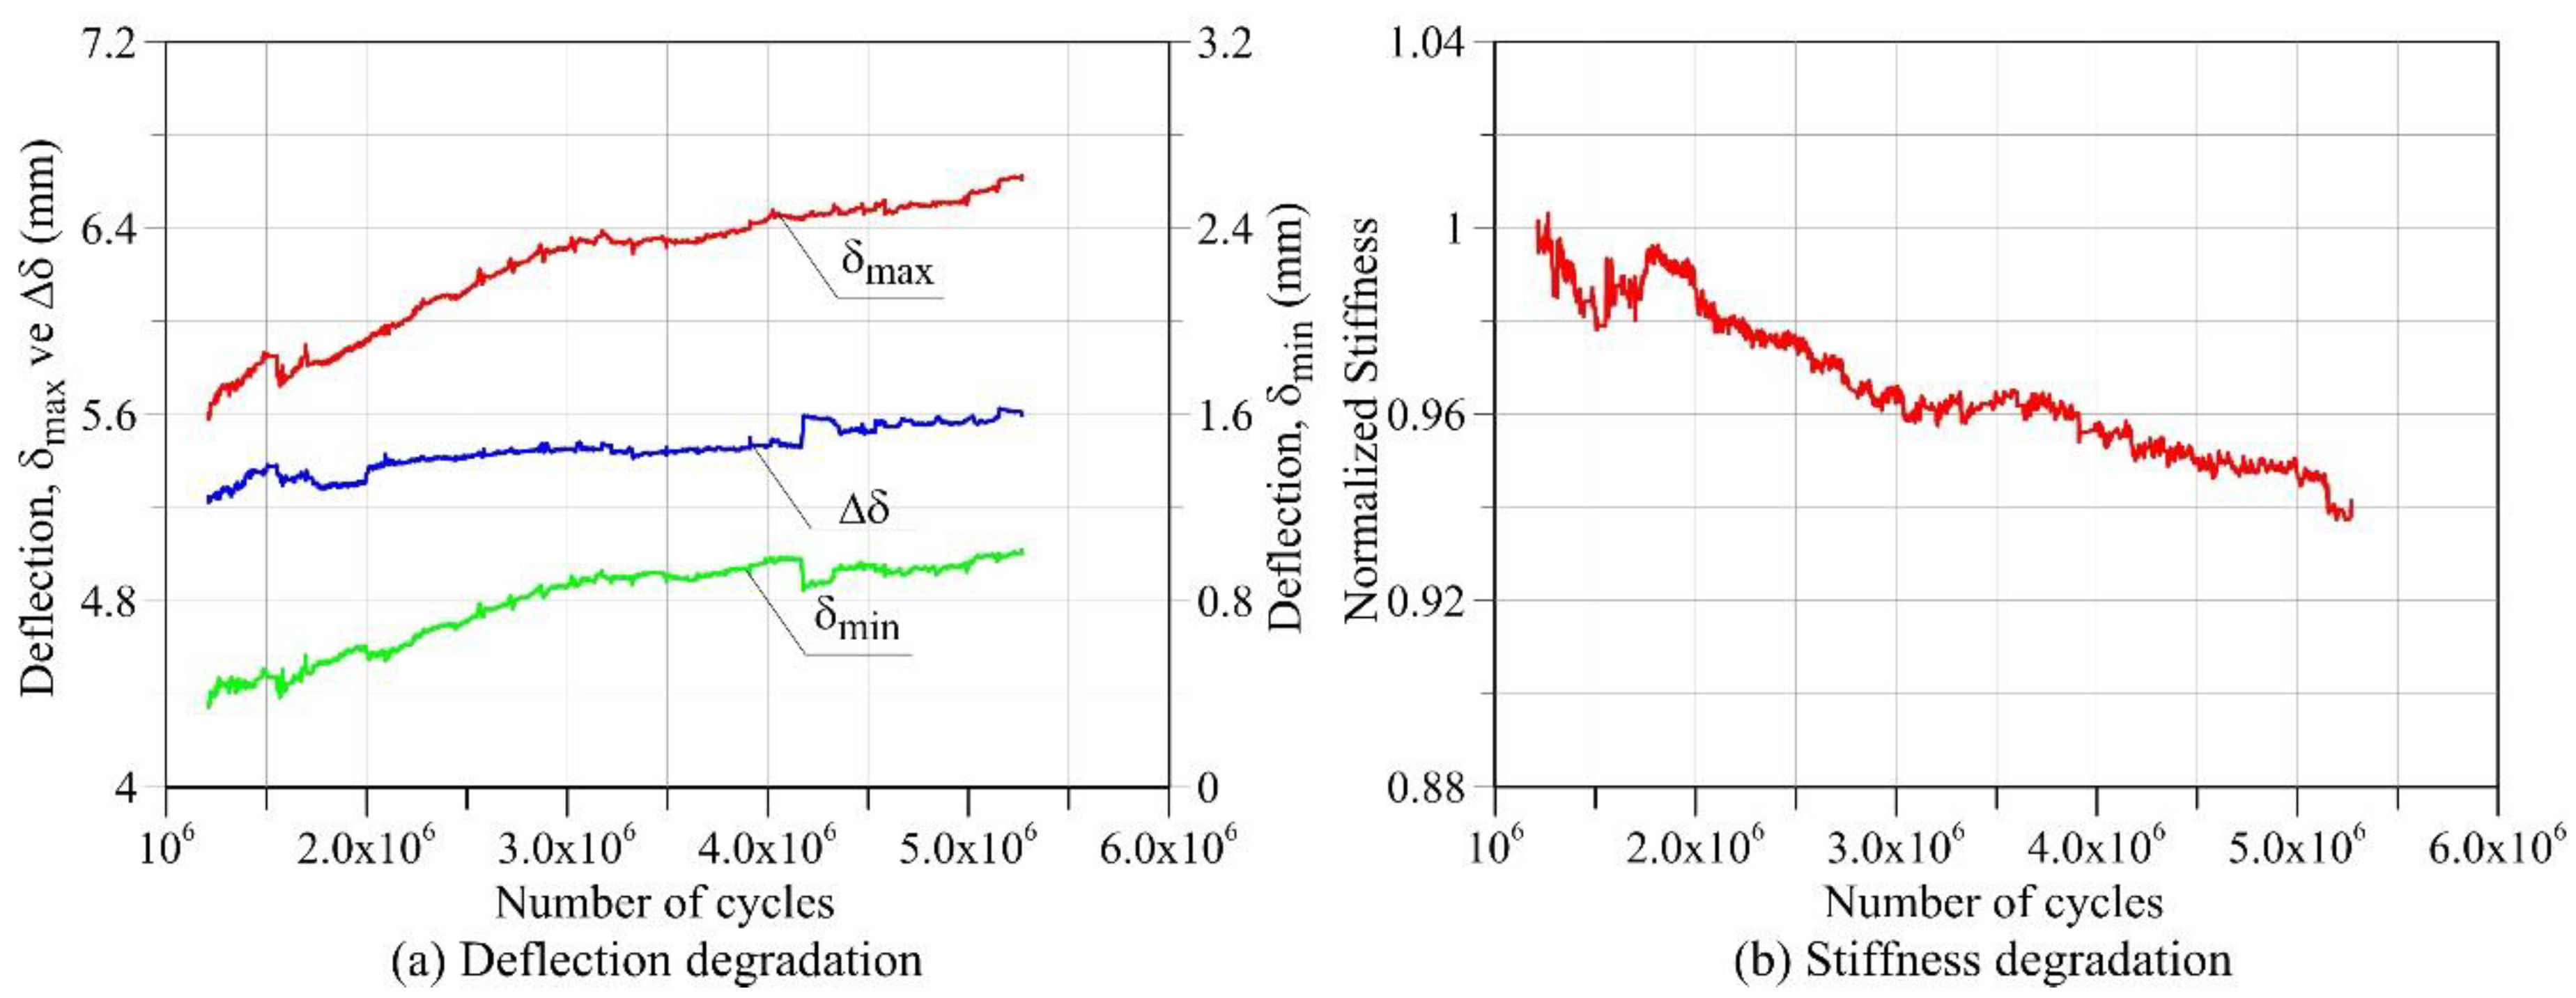
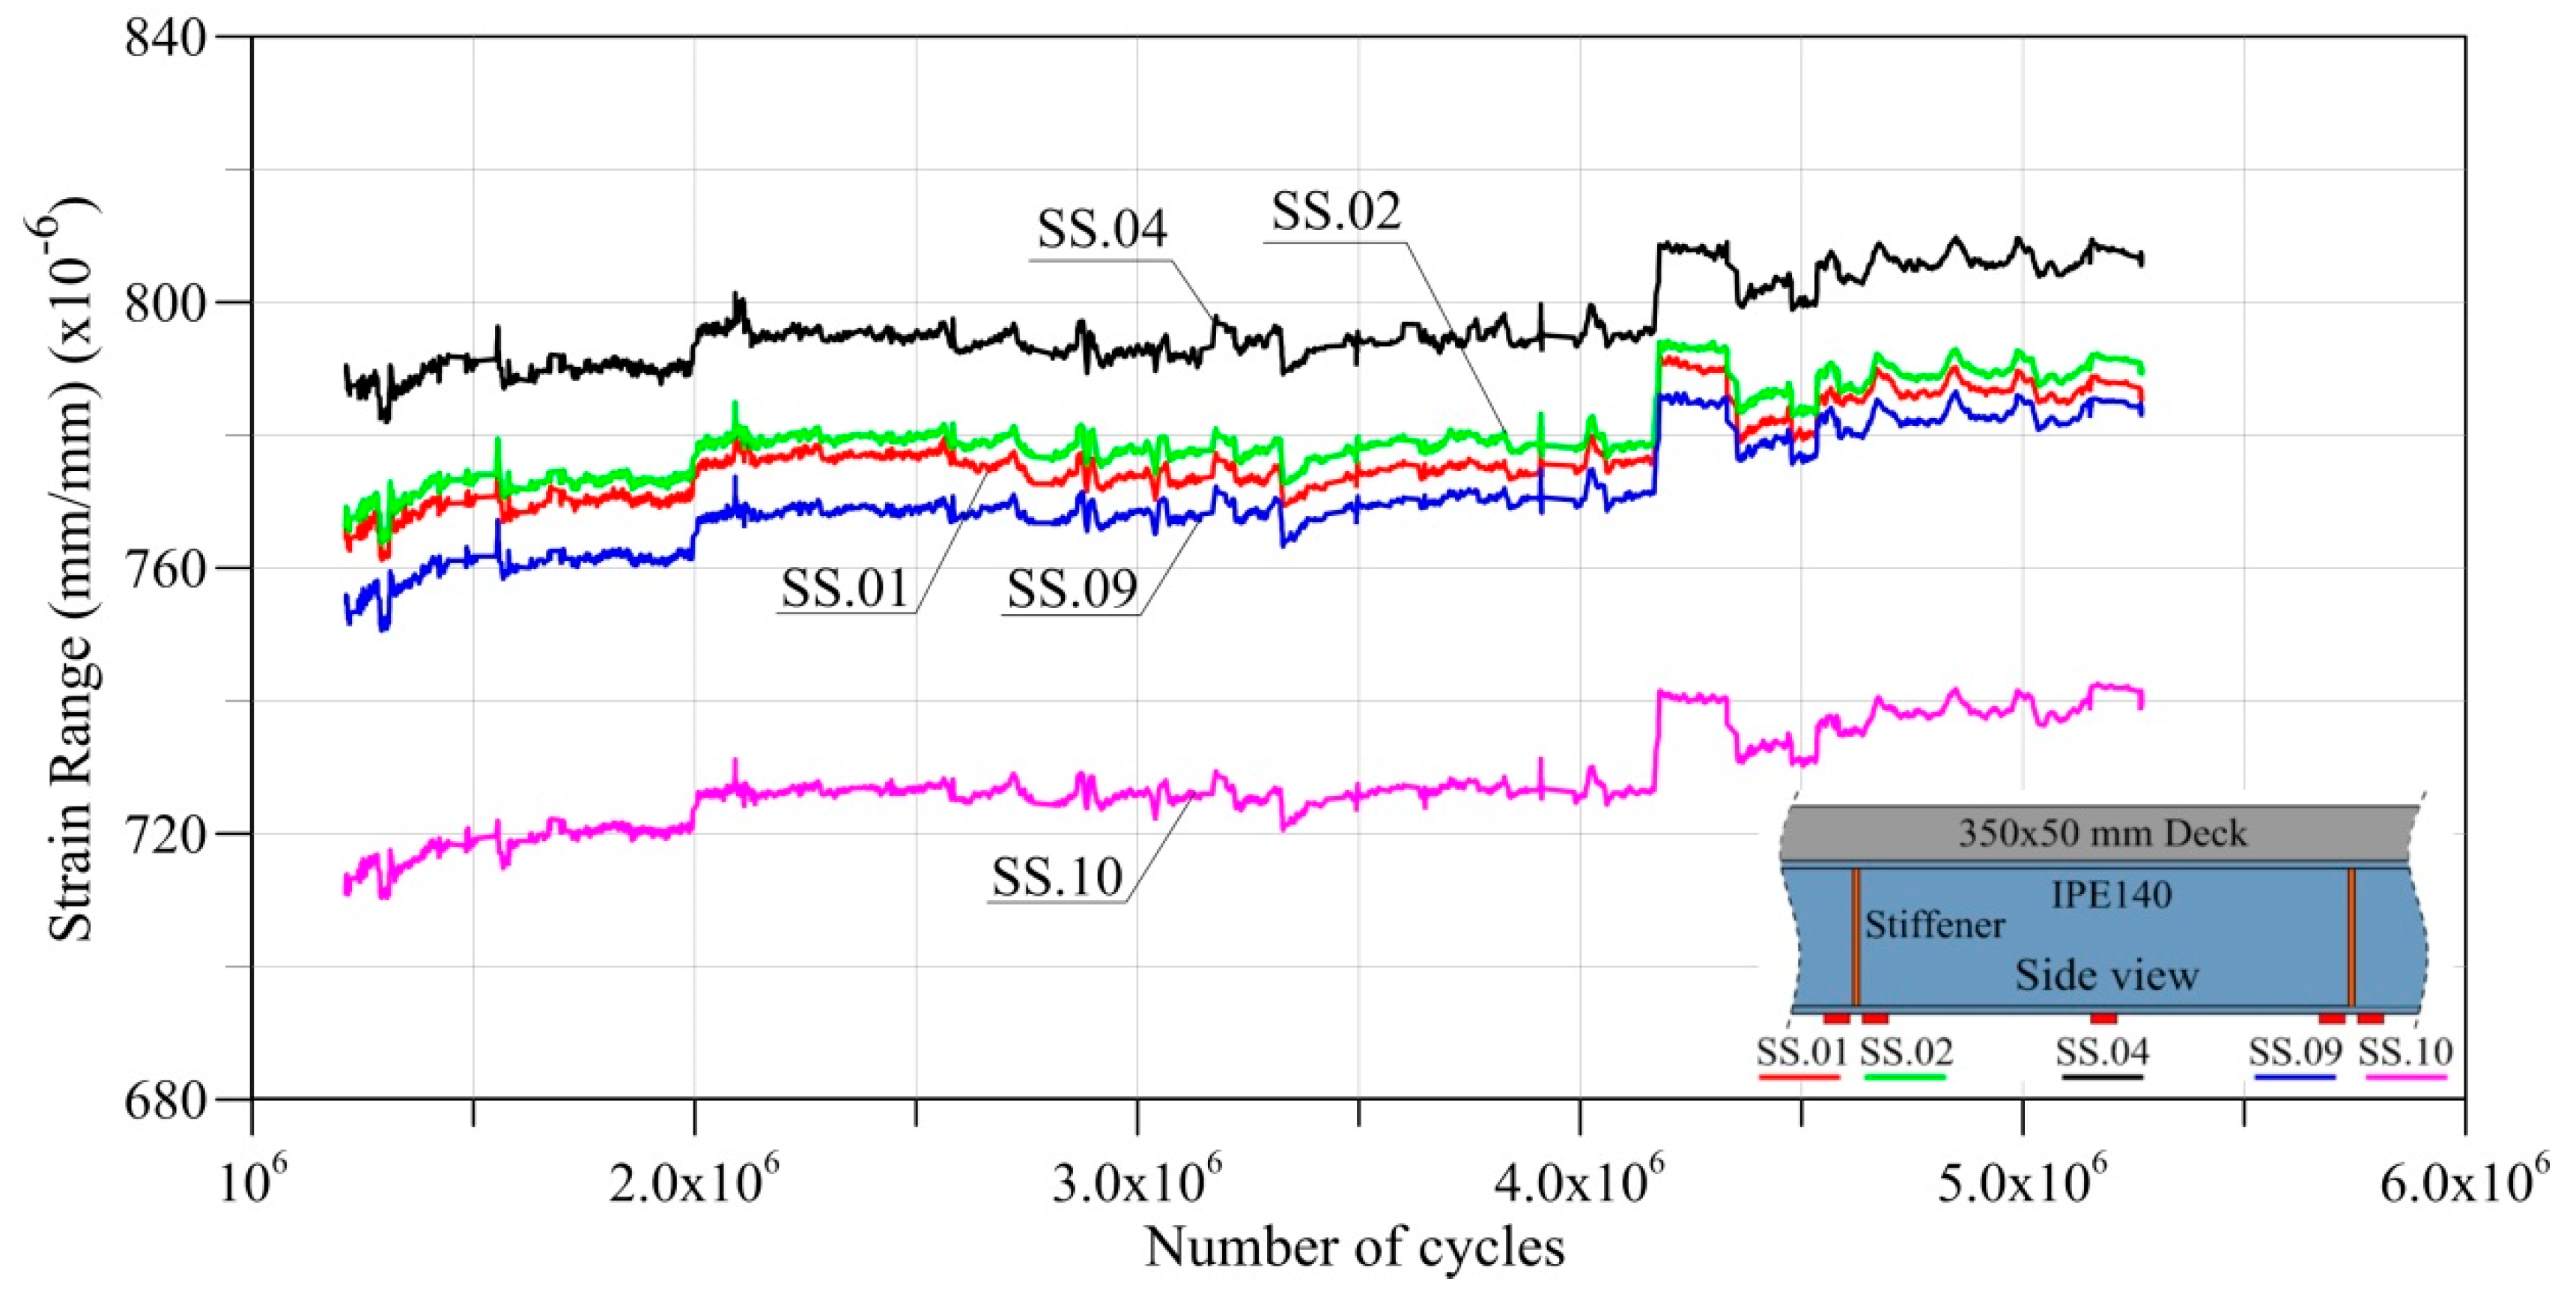
3.5. Specimen GF3b
3.6. Specimen GF4
4. Discussion
5. Conclusions
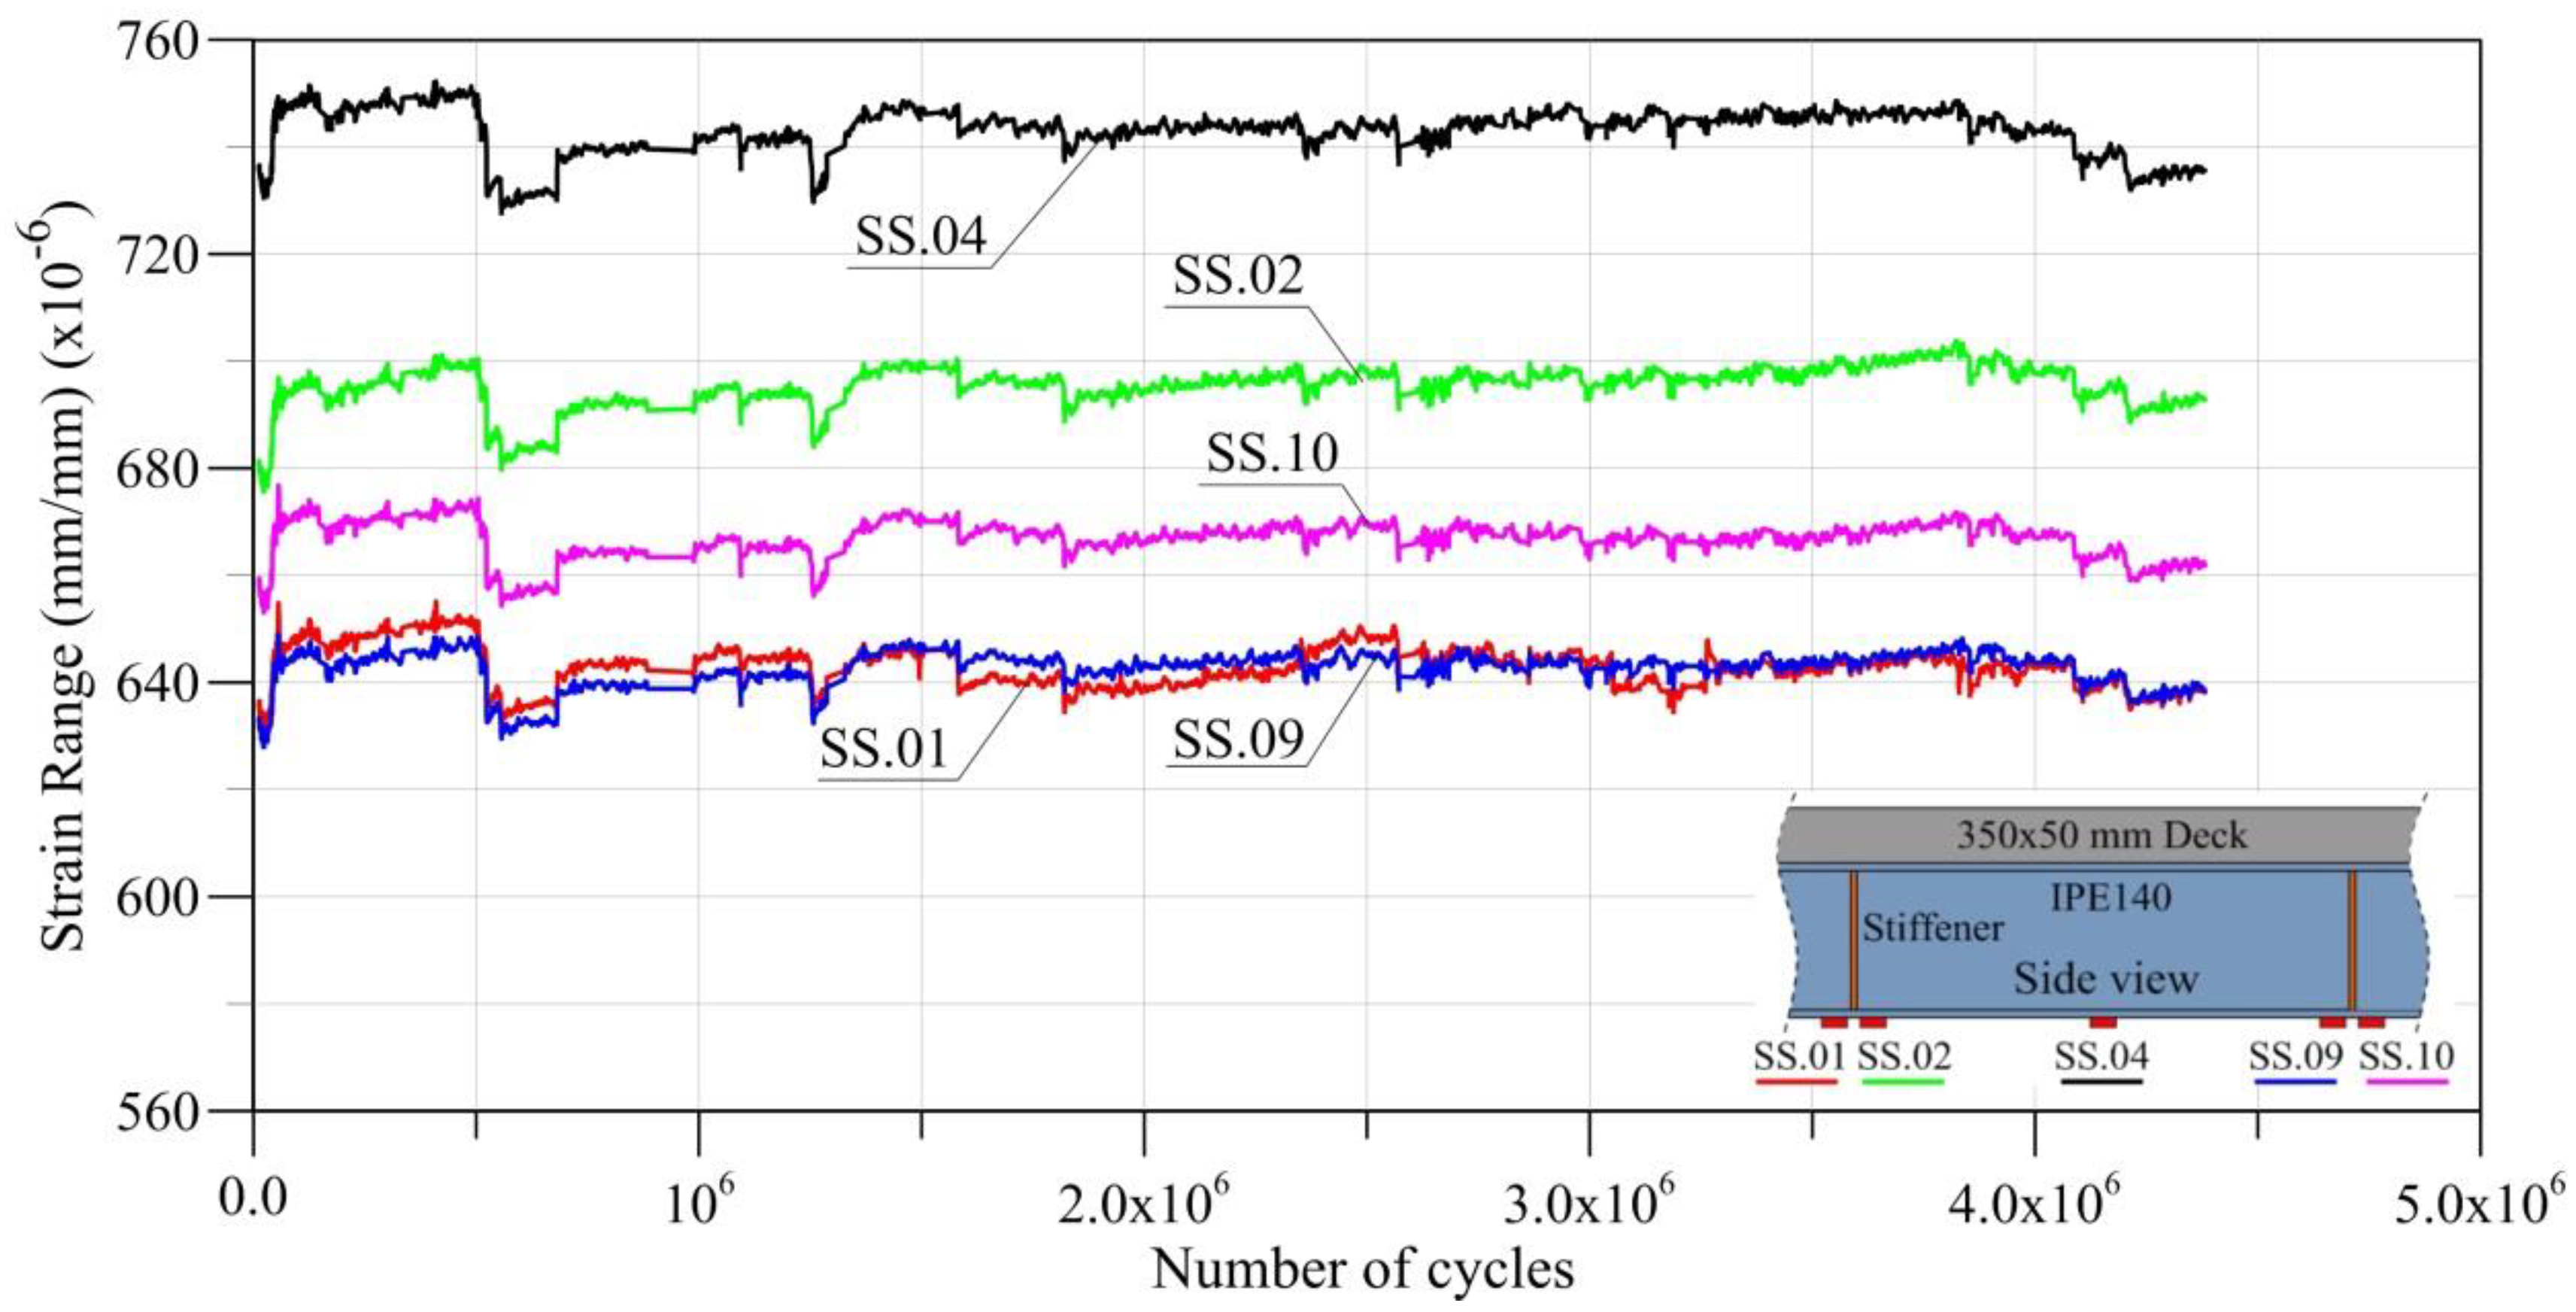
- The critical fatigue details of steel-concrete composite girder bridges that have reached or are at the end of their design life should be closely scrutinized. The structural safety and state of these bridges in terms of fatigue should be determined by strain-based measurements. The strains in the fatigue critical details should be monitored at regular intervals to check whether the onset of fatigue exists or not. Any increase in the strain range of one of these details different than the others indicates the onset of fatigue.
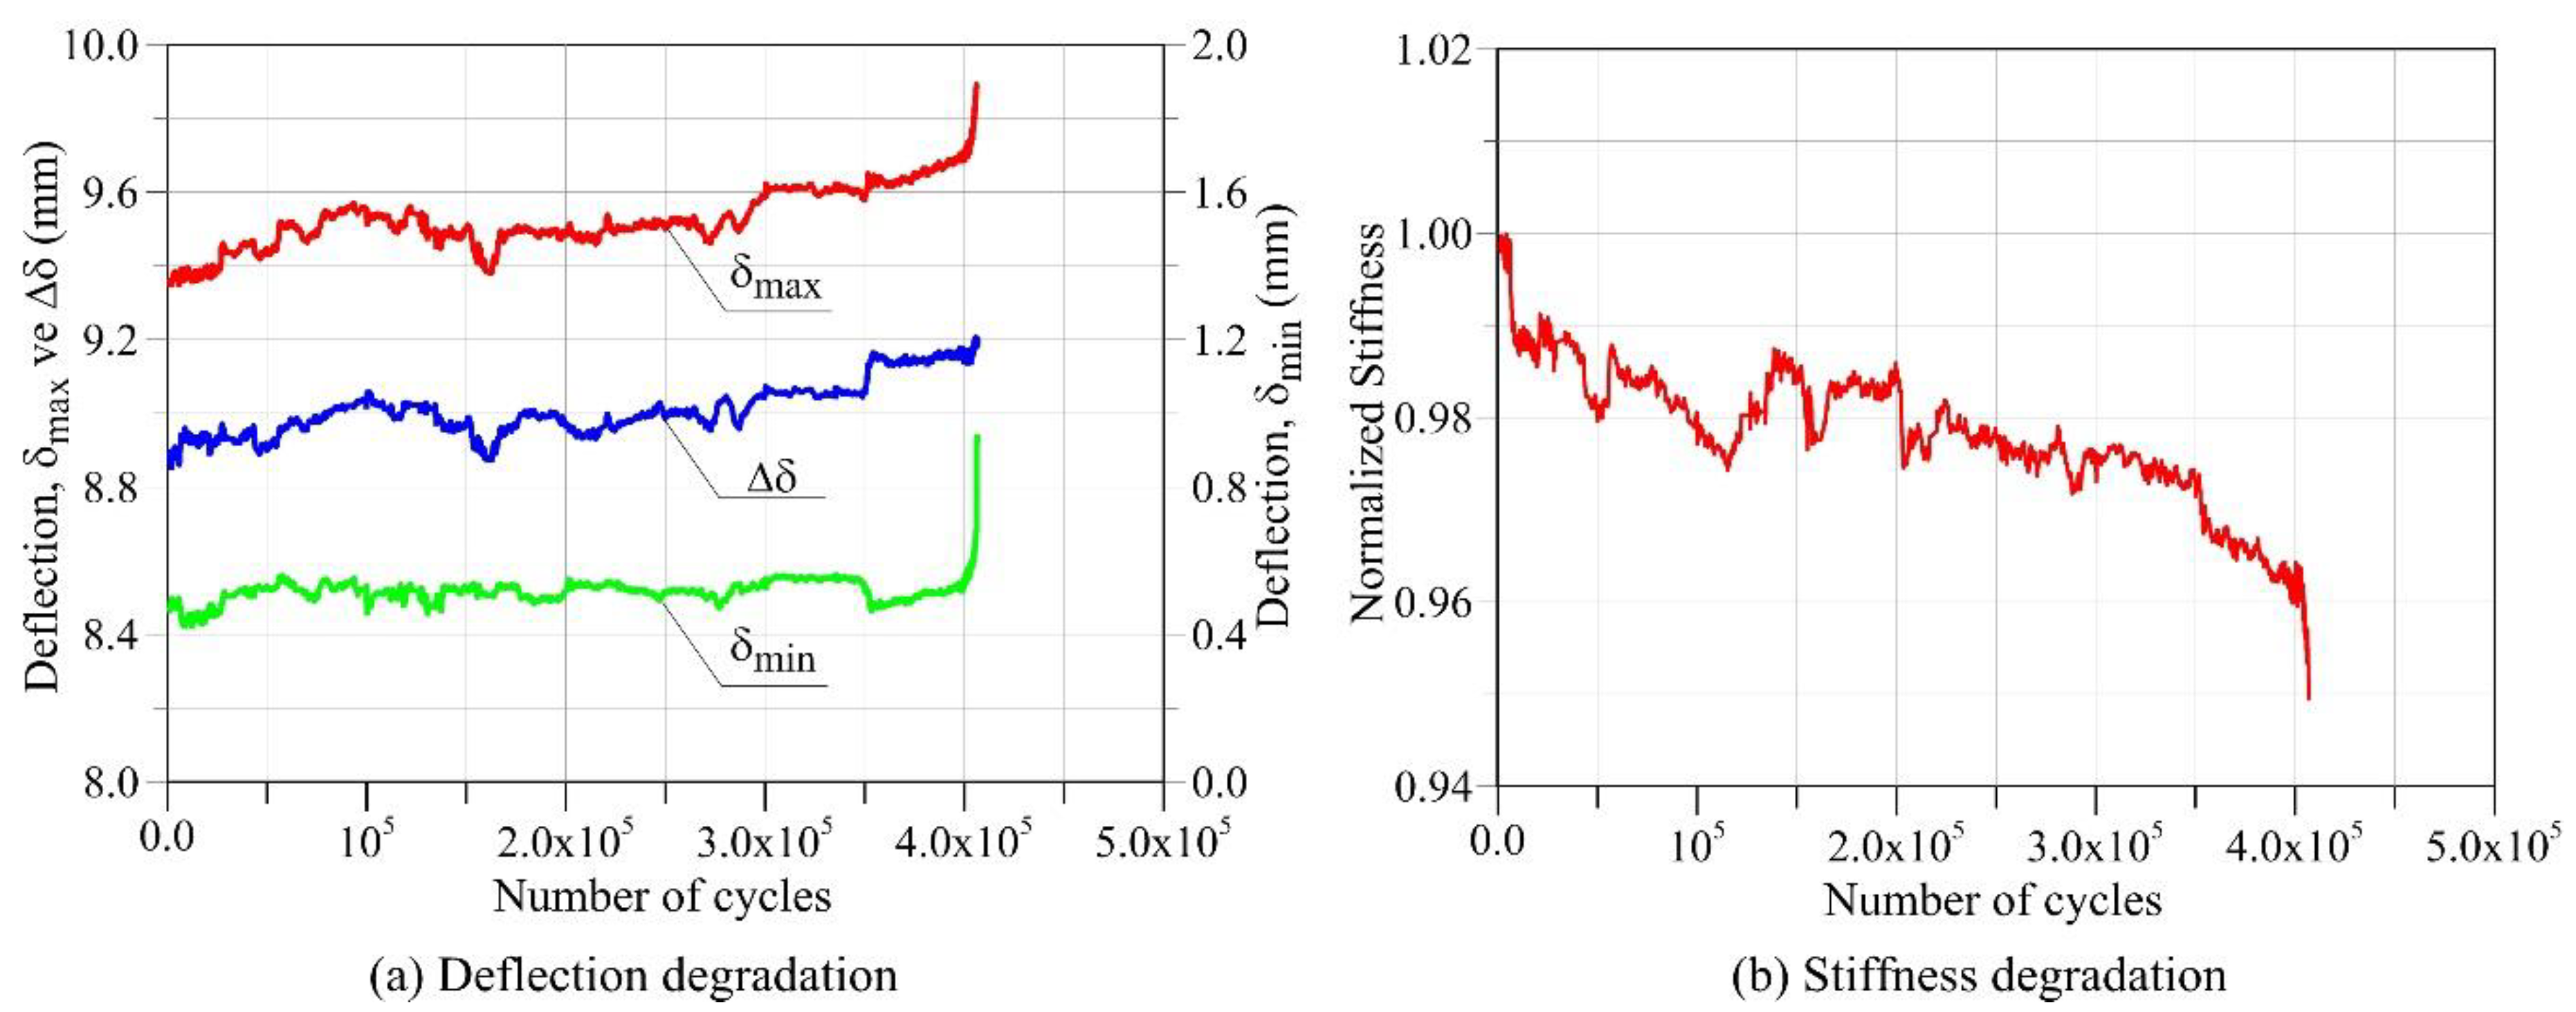
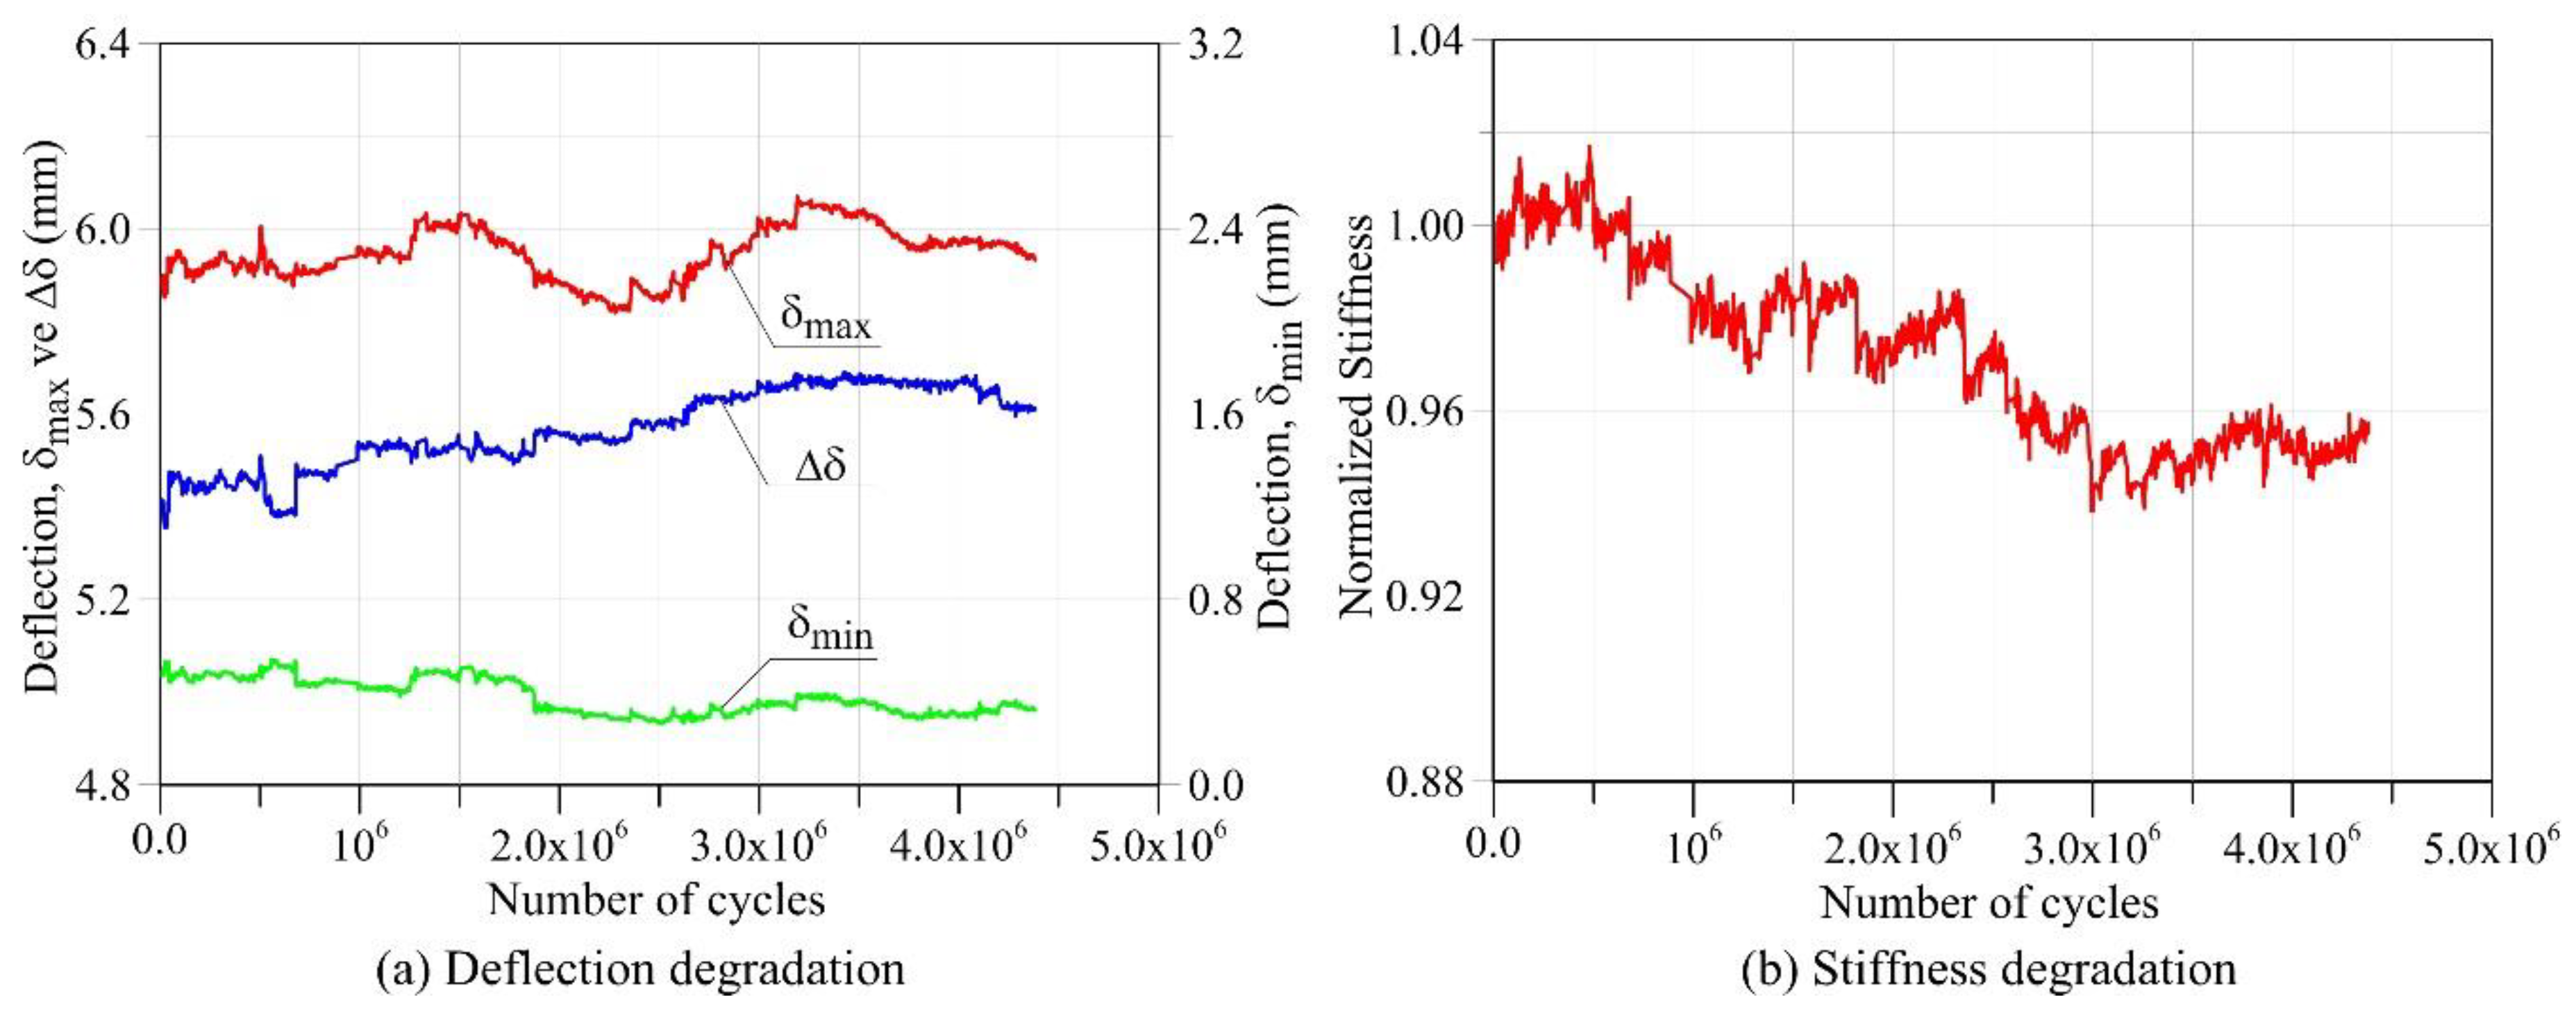
- The changes in deflection and stiffness are not sufficient parameters for the determination of fatigue life. The change in stiffness will be less effective if the systems with a higher degree of indeterminacy are considered. There is no significant reduction in stiffness and strength of beams which do not exhibit fatigue behavior after cyclic loading.
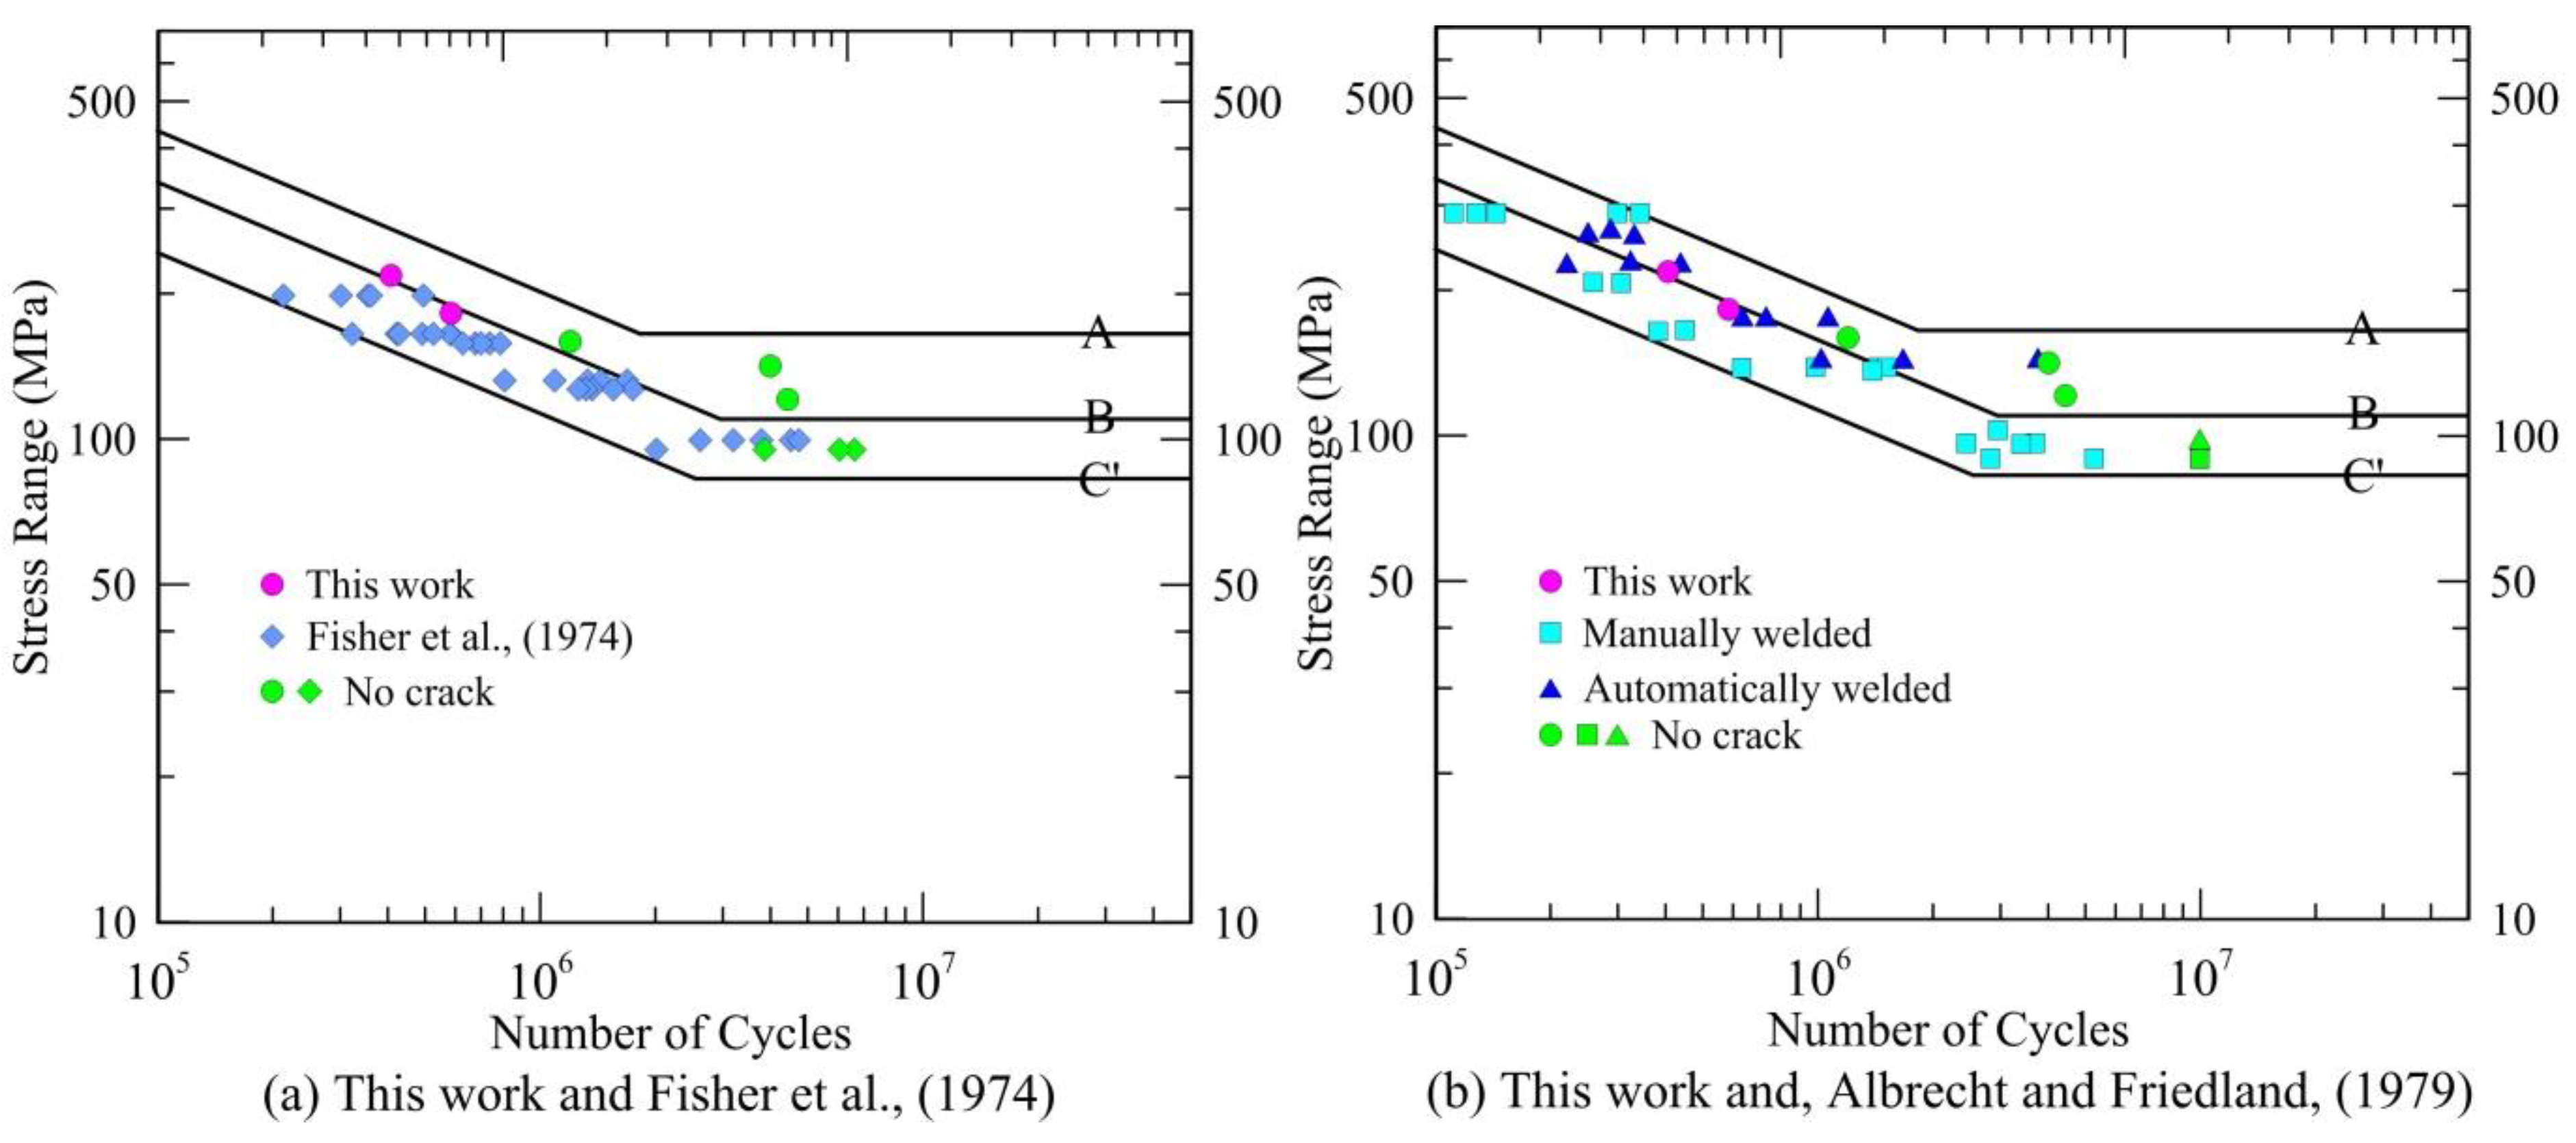
- S-N data obtained from the specimens are above the limits defined for category C’ in AASHTO LRFD [8]. This is an expected situation. The most unfavorable cases of the fatigue tests of the details are considered in defining the fatigue categories according to AASHTO LRFD [8]. In this respect, the code considers a conservative safety margin and remains on the safe side. The S-N data of the specimens are consistent with those of other studies in the literature.
- The vibration-based monitoring techniques, which are frequently used to determine the damage state of existing structures, are not sufficient to detect fatigue damages. In this study, it is found that the change in strain in fatigue critical details is determinant of fatigue behavior rather than the change in the stiffness. Thus, the fatigue details with the maximum stress range should be determined by calculations, and these points should be monitored using strain-based methods in steel bridges with critical fatigue details specified in AASHTO LRFD [8].
Author Contributions
Funding
Acknowledgments
Conflicts of Interest
References
- Wöhler, A. August Wöhler. 1850. Available online: http://en.wikipedia.org/wiki/August_W%C3%B6hler (accessed on 13 December 2019).
- Stephens, R.I.; Fatemi, A.; Stephens, R.R.; Fuchs, H.O. Metal Fatigue in Engineering, 2nd ed.; John Wiley & Sons: New York, NY, USA, 2001. [Google Scholar]
- Fisher, J.W. Fatigue and Fracture in Steel Bridges: Case Studies; Wiley Interscience: London, UK, 1984. [Google Scholar]
- Fisher, J.W.; Kulak, G.L.; Smith, I.F.C. A Fatigue Primer for Structural Engineers; National Steel Bridge Alliance: Chicago, IL, USA, 1998. [Google Scholar]
- Kazuhiro, N.; Jun, M.; Takayuki, M. Study on the fatigue of steel highway bridges in Japan. Constr. Build. Mater. 1998, 12, 133–141. [Google Scholar]
- Al-Emrani, M.; Nilsson, M.; Lukic, M. Bridge Fatigue Guidance—A European Research Project; European Commission, Research Fund for Coal and Steel: Luxembourg, 2011. [Google Scholar]
- Josi, G. Reliability-Based Management of Fatigue Failures. Ph.D. Thesis, University of Alberta, Edmonton, AB, Canada, 2010. [Google Scholar]
- AASHTO LRFD. AASHTO LRFD Bridge Design Specifications, 8th ed.; American Association of State Highway and Transportation Officials: Washington, DC, USA, 2017. [Google Scholar]
- Fisher, J.W.; Albrecht, P.A.; Yen, B.T.; Klingerman, D.J.; McNamee, B.M. Fatigue Strength of Steel Beams with Welded Stiffeners and Attachments; Transportation Research Board; National Research Council: Washington, DC, USA, 1974. [Google Scholar]
- Pass, J.D.; Frank, K.H.; Yura, J.A. Fatigue Behavior of Longitudinal Transverse Stiffener Intersection; U.S. Department of Transportation Federal Highway Administration: Washington, DC, USA, 1983.
- Klippstein, K.H.; Schilling, C.G. Pilot study on the constant and variable amplitude behavior of transverse stiffener welds. J. Constr. Steel Res. 1989, 12, 229–252. [Google Scholar] [CrossRef]
- Fisher, J.W.; Nussbaumer, A.; Keating, P.B.; Yen, B.T. Resistance of Welded Details under Variable Amplitude Long-Life Fatigue Loading; Transportation Research Board; National Research Council: Washington, DC, USA, 1993. [Google Scholar]
- Wright, W.J. Long-life fatigue behavior of welded steel-bridge girder details. In Proceedings of the ASCE Structures Congress, Irvine, CA, USA, 19–21 April 1993. [Google Scholar]
- Sakano, M.; Wahab, M.A. Fatigue strength of welded transverse stiffener joints under variable amplitude loading. Int. J. Press. Vessel. Pip. 1998, 75, 1037–1045. [Google Scholar] [CrossRef]
- Woo, S.I.; Jung, K.S.; Albrech, P. Fatigue behavior of transverse stiffener subjected to variable amplitude loading. KSCE J. Civ. Eng. 2002, 6, 151–160. [Google Scholar] [CrossRef]
- Jang, B.S.; Ito, H.; Kim, K.S.; Suh, Y.S.; Jeon, H.T.; Ha, Y.S. A study of fatigue crack propagation at a web stiffener on a longitudinal stiffener. J. Mar. Sci. Technol. 2010, 15, 176–189. [Google Scholar] [CrossRef]
- Triamlumlerd, W.; Lenwari, A. Analysis of fatigue crack propagation in steel I-beams with welded transverse stiffeners subjected to in-plane loadings. Eng. J. 2017, 21, 307–324. [Google Scholar] [CrossRef] [Green Version]
- Endeshaw, H.B.; Osire, S.E.; Alemayehu, F.M. Evaluation of Fatigue Crack Propagation of Gears Considering Uncertainties in Loading and Material Properties. Sustainability 2017, 9, 2200. [Google Scholar] [CrossRef] [Green Version]
- Fisher, J.W.; Frank, K.H.; Hirt, M.A.; McName, B.M. Effect of Weldments on the Fatigue Strength of Steel Beams; Transportation Research Board; National Research Council: Washington, DC, USA, 1970. [Google Scholar]
- Schilling, C.G.; Klippstein, K.H.; Barsom, J.M.; Blake, G.T. Fatigue of Welded Steel Bridge Members under Variable Amplitude Loadings; Transportation Research Board, National Research Council: Washington, DC, USA, 1978. [Google Scholar]
- Slutter, R.G.; Fisher, J.W. Fatigue Strength of Shear Connectors. 1967. Available online: http://digital.lib.lehigh.edu/fritz/pdf/316_2.pdf (accessed on 13 December 2019).
- Taplin, G.; Grundy, P. Steel-concrete composite beams under repeated load. In Proceedings of the Composite Construction in Steel and Concrete IV, Banff, AB, Canada, 28 May–2 June 2000; pp. 37–50. [Google Scholar] [CrossRef]
- Hanswille, G.; Porsch, M.; Ustundag, C. Resistance of headed studs subjected to fatigue loading: Part I: Experimental study. J. Constr. Steel Res. 2007, 63, 475–484. [Google Scholar] [CrossRef]
- Wang, Y.H.; Nie, J.G.; Li, J.J. Study on fatigue property of steel–concrete composite beams and studs. J. Constr. Steel Res. 2014, 94, 1–10. [Google Scholar] [CrossRef]
- Ovuoba, B.; Prinz, G.S. Fatigue capacity of headed shear studs in composite bridge girders. J. Bridge Eng. 2016, 21, 04016094. [Google Scholar] [CrossRef] [Green Version]
- Sjaarda, M.; Porter, T.; West, J.S.; Walbridge, S. Fatigue behavior of welded shear studs in precast composite beams. J. Bridge Eng. 2017, 22, 04017089. [Google Scholar] [CrossRef]
- Wang, B.; Huang, Q.; Liu, X.; Li, W. Experimental investigation of steel-concrete composite beams with different degrees of shear connection under monotonic and fatigue loads. Adv. Struct. Eng. 2017, 21, 227–240. [Google Scholar] [CrossRef]
- El-Zohairy, A.; Salim, S.; Saucier, A. Fatigue tests on steel–concrete composite beams subjected to sagging moments. J. Struct. Eng. 2019, 145, 04019029. [Google Scholar] [CrossRef]
- Albrecht, P.; Lenwari, A. Fatigue strength of repaired prestressed composite beams. J. Bridge Eng. 2008, 13, 409–417. [Google Scholar] [CrossRef]
- El-Zohairy, A.; Salim, H.; Saucier, A. Steel–Concrete Composite Beams Strengthened with Externally Post-Tensioned Tendons under Fatigue. J. Bridge Eng. 2019, 24, 04019027. [Google Scholar] [CrossRef]
- Dawood, M.; Rizkalla, S.; Sumner, E. Fatigue and overloading behavior of steel–concrete composite flexural members strengthened with high modulus CFRP materials. J. Compos. Constr. 2007, 11, 659–666. [Google Scholar] [CrossRef] [Green Version]
- Lin, W.; Yoda, T.; Taniguchi, N. Fatigue tests on straight steel–concrete composite beams subjected to hogging moment. J. Constr. Steel Res. 2013, 80, 42–56. [Google Scholar] [CrossRef]
- Yen, J.Y.R.; Lin, Y.; Lai, M.T. Composite beams subjected to static and fatigue Loads. J. Struct. Eng. 1997, 123, 765–771. [Google Scholar] [CrossRef]
- Pnevmatikos, N.G.; Blachowski, B.; Hatzigeorgiou, G.D.; Swiercz, A. Wavelet analysis based damage localization in steel frames with bolted connections. Smart Struct. Syst. 2016, 18, 1189–1202. [Google Scholar] [CrossRef]
- Pnevmatikos, N.G.; Hatzigeorgiou, G.D. Damage detection of framed structures subjected to earthquake excitation using discrete wavelet analysis. Bull. Earthq. Eng. 2016, 15. [Google Scholar] [CrossRef]
- Pnevmatikos, N.G.; Papagiannopoulos, G.A.; Hatzigeorgiou, G. Fatigue assessment of a steel frame subjected to a number of earthquake excitations. Procedia Struct. Integr. 2018, 10, 195–202. [Google Scholar] [CrossRef]
- Modares, M.; Waksmanski, N. Overview of structural health monitoring for steel bridges. Pract. Period. Struct. Des. Constr. 2013, 18, 187–191. [Google Scholar] [CrossRef]
- Hao, S. I-35W bridge collapse. J. Bridge Eng. 2010, 15, 608–614. [Google Scholar] [CrossRef]
- Abdel-Ghaff, A.M.; Scanlan, R.H. Ambient vibration studies of golden gate bridge: I suspended structure. J. Eng. Mech. 1985, 111, 463–482. [Google Scholar] [CrossRef]
- Brownjohn, J.M.W.; Magalhaes, F.; Caetano, E.; Cunha, A.; Au, I.; Lam, P. Dynamic testing of the Humber Suspension Bridge. In Proceedings of the International Conference of Experimental Vibration Analysis for Civil Engineering Structures, Wroclaw, Poland, 14–16 October 2009. [Google Scholar]
- Conte, J.P.; He, X.; Moaveni, B.; Masri, S.F.; Caffrey, J.P.; Wahbeh, M.; Tasbihgoo, F.; Whang, D.H.; Elgamal, A. Dynamic testing of Alfred Zampa Memorial Bridge. J. Struct. Eng. 2008, 134, 1006–1015. [Google Scholar] [CrossRef] [Green Version]
- Ko, J.M.; Sun, Z.G.; Ni, Y.Q. Multi-stage identificationcheme for detecting damage in cable-stayed Kap Shui Mun Bridge. Eng. Struct. 2002, 24, 857–868. [Google Scholar] [CrossRef]
- Pakzad, S.N.; Fenves, G.L. Statistical analysis of vibration modes of a suspension bridge using spatially densewireless sensor network. J. Struct. Eng. 2009, 135, 863–872. [Google Scholar] [CrossRef] [Green Version]
- Peeters, B.; Roeck, G.D. One-year monitoring of the Z24-Bridge: Environmental effects versus damage events. Earthq. Eng. Struct. Dyn. 2001, 30, 149–171. [Google Scholar] [CrossRef]
- Siringoringo, D.M.; Fujino, Y. System identification of suspension bridge from ambient vibration response. Eng. Struct. 2008, 30, 462–477. [Google Scholar] [CrossRef]
- Zhang, J.; Prader, J.; Moon, F.; Grimmelsman, K.A.; Aktan, E.; Sayama, A. Experimental vibration analysis for structural identification of a long span suspension bridge. ASCE J. Eng. Mech. 2013, 139, 748–759. [Google Scholar] [CrossRef]
- Zhang, J.; Hong, W.; Tang, Y.; Yang, C.; Wu, G.; Wu, Z. Structural health monitoring of a steel stringer bridge with area sensing. Struct. Infrastruct. Eng. 2014, 10, 1049–1058. [Google Scholar] [CrossRef]
- Mao, J.; Wang, H.; Li, J. Strain monitoring case study: Sutong Cable-stayed Bridge. J. Bridge Eng. 2019, 24, 1–14. [Google Scholar] [CrossRef]
- Spencer, B.F.; Ruiz-Sandoval, M.E.; Kurata, N. Smart sensing technology: Opportunities and challenges. Struct. Control Health Monit. 2004, 11, 349–368. [Google Scholar] [CrossRef]
- Ko, J.M.; Ni, Y.Q. Technology developments in structural health monitoring of large-scale bridges. Eng. Struct. 2005, 27, 1715–1725. [Google Scholar] [CrossRef]
- Wang, H.; Li, A.; Niu, J.; Zong, Z.; Li, J. Long-termmonitoring of wind characteristics at Sutong Bridge site. J. Wind Eng. Ind. Aerodyn. 2013, 115, 39–47. [Google Scholar] [CrossRef]
- Nagarajaiah, S.; Erazo, K. Structural monitoring and identification of civil infrastructure in the United States. Struct. Monit. Maint. 2016, 3, 51–59. [Google Scholar] [CrossRef]
- Wang, H.; Mao, X.; Huang, J.H.; Li, A.Q. Modal identification of Sutong cable-stayed bridge under typhoon Haikui using wavelet transform method. J. Perform. Constr. Facil. 2016, 30, 04016001. [Google Scholar] [CrossRef]
- Mao, J.X.; Wang, H.; Xun, Z.X.; Zou, Z.Q. Variability analysis on modal parameters of Runyang Bridge during typhoon Masta. Smart Struct. Syst. 2017, 19, 653–663. [Google Scholar]
- Ni, Y.Q.; Ye, X.W.; Ko, J.M. Monitoring-based fatigue reliability assessment of steel bridges: Analytical model and application. J. Struct. Eng. 2010, 136, 1563–1573. [Google Scholar] [CrossRef]
- Connor, R.J.; Mahmoud, H.N.; Bowman, C.A. Results of the Fatigue Evaluation and Field Monitoring of the I-39 Northbound Bridge over the Wisconsin River; ATLSS Rep. 05-04; Lehigh University: Bethlehem, PA, USA, 2005. [Google Scholar]
- Deng, Y.; Liu, Y.; Feng, D.M.; Li, A.Q. Investigation of fatigue performance of welded details in long-span steel bridges using long term monitoring strain data. Struct. Control Health Monit. 2015, 22, 1343–1358. [Google Scholar] [CrossRef]
- Frangopol, D.M.; Strauss, A.; Kim, S. Bridge reliability assessment based on monitoring. J. Bridge Eng. 2008, 13, 258–270. [Google Scholar] [CrossRef]
- Gunes, B. Fatigue Behaviour of Steel-Concrete Composite Beams Strengthened with Carbon Fiber Reinforced Polymers (CFRP). Ph.D. Thesis, İstanbul University, Engineering Faculty, Civil Engineering Department, İstanbul, Turkey, 2013. [Google Scholar]
- TS EN 12390-3. Testing Hardened Concrete—Part 3: Compressive Strength of Test Specimens; TSE: Ankara, Turkey, 2003. [Google Scholar]
- TS EN ISO 6892-1. Metallic Materials—Tensile Testing—Part 1: Method of Test at Room Temperature; TSE: Ankara, Turkey, 2010. [Google Scholar]
- Gunes, B.; Ilki, A.; Oztorun, N.K. The effects of pitting corrosion and CFRP repair on the behaviour of steel-concrete composite beams. J. Compos. Constr. 2019. under review. [Google Scholar]
- Albrecht, P.; Friedland, I.M. Fatigue-limit effect on variable amplitude fatigue of stiffeners. J. Struct. Div. 1979, 105, 2657–2675. [Google Scholar]


| Properties | Concrete | Flange of Steel Section | Web of Steel Section | Rebar |
|---|---|---|---|---|
| Concrete strength, | 24.19 | - | - | - |
| Yield strength, | - | 378 | 360 | 588 |
| Ultimate strength, | - | 521 | 519 | 634 |
| Modulus of elasticity, | 20,328 | 200,000 | 200,000 | 195,000 |
| Specimen | Loading Type | Number of Cycles | Fatigue Crack | Strain Range (MSR) | Average Strain Range (FCR) |
|---|---|---|---|---|---|
| GS | Monotonic | - | - | - | - |
| GF1 | Cyclic | 407,000 | Yes | 0.68εy | 0.57εy |
| GF2 | Cyclic | 584,800 | Yes | 0.57εy | 0.48εy |
| GF3a 1 | Cyclic | 1,200,000 | No | 0.48εy | 0.42εy |
| GF3b 1 | Cyclic | 4,000,000 | No | 0.42εy | 0.37εy |
| GF4 | Cyclic | 4,438,000 | No | 0.39εy | 0.32εy |
| Specimen | Loading Rate (Hz) | Loading Range (kN) | Strain Range (SS.04) (με) | Strain Range/Yield Strain (%) | Stress Range (MPa) |
|---|---|---|---|---|---|
| GF1 | 0.9 | 49.96 | 1283 | 68 | 257 |
| GF2 | 1.2 | 41.20 | 1078 | 57 | 216 |
| GF3a 1 | 1.8 | 34.40 | 910 | 48 | 182 |
| GF3b 1 | 1.8 | 33.87 | 792 | 42 | 158 |
| GF4 | 2.5 | 26.00 | 734 | 39 | 147 |
| Specimen | Strain Range (με) | Average Strain Range (με) | Average Strain Range/Yield Strain (%) | Average Stress Range (MPa) | |||||
|---|---|---|---|---|---|---|---|---|---|
| SS.01 | SS.02 | SS.03 | SS.09 | SS.10 | SS.14 | FCR | FCR | FCR | |
| GF1 | 1206 | 1182 | 571 | 1138 | 1153 | 581 | 1090 | 57 | 218 |
| GF2 | 998 | 1006 | 479 | 964 | 943 | 460 | 912 | 48 | 182 |
| GF3a 1 | 860 | 863 | 460 | 869 | 833 | 456 | 796 | 42 | 159 |
| GF3b 1 | 767 | 769 | 212 | 754 | 713 | 181 | 708 | 37 | 142 |
| GF4 | 635 | 680 | 375 | 630 | 658 | 321 | 605 | 32 | 121 |
| Specimen | Average Strain Range/Yield Strain (FCR) (%) | Average Stress Range (FCR) (MPa) | Number of Cycles | Fatigue Crack | Fatigue Beginning | Crack Beginning | Fatigue Fracture |
|---|---|---|---|---|---|---|---|
| GF1 | 57 | 218 | 407,000 | Yes | 275,000 | 403,000 | 407,000 |
| GF2 | 48 | 182 | 584,800 | Yes | 400,000 | 572,400 | 584,800 |
| GF3a 1 | 42 | 159 | 1,200,000 | No | - | - | - |
| GF3b 1 | 37 | 142 | 4,000,000 | No | - | - | - |
| GF4 | 32 | 121 | 4,438,000 | No | - | - | - |
© 2019 by the authors. Licensee MDPI, Basel, Switzerland. This article is an open access article distributed under the terms and conditions of the Creative Commons Attribution (CC BY) license (http://creativecommons.org/licenses/by/4.0/).
Share and Cite
Gunes, B.; Ilki, A.; Oztorun, N.K. Determination of Monitoring Parameters for Fatigue Behavior of Steel-Concrete Composite Bridge Girders with Welded Full Depth Transverse Stiffeners. Sustainability 2020, 12, 283. https://doi.org/10.3390/su12010283
Gunes B, Ilki A, Oztorun NK. Determination of Monitoring Parameters for Fatigue Behavior of Steel-Concrete Composite Bridge Girders with Welded Full Depth Transverse Stiffeners. Sustainability. 2020; 12(1):283. https://doi.org/10.3390/su12010283
Chicago/Turabian StyleGunes, Baris, Alper Ilki, and Namik Kemal Oztorun. 2020. "Determination of Monitoring Parameters for Fatigue Behavior of Steel-Concrete Composite Bridge Girders with Welded Full Depth Transverse Stiffeners" Sustainability 12, no. 1: 283. https://doi.org/10.3390/su12010283