The effects of near trapping on the wave-power extraction are investigated in this section. The total power and power fluctuation of a WEC array are mainly concerned in the most previous studies. However, the actual performance of each device may differ greatly from the potential of the power generation, due to the mass production and installation of WEC devices in the array. As a result, not only the total power but the power distribution in the array are taken into account in this section. There are two criteria used for judging the efficiency of the array layout. Firstly, the mean power of the array is greater than or close to the optimal power of the single isolated WEC in open water. Secondly, the power distribution among the WECs is supposed to be uniform, and each WEC plays the full role, i.e., the single interaction factor of each WEC larger or close to 1.0.
3.2.1. Incident Wavelength
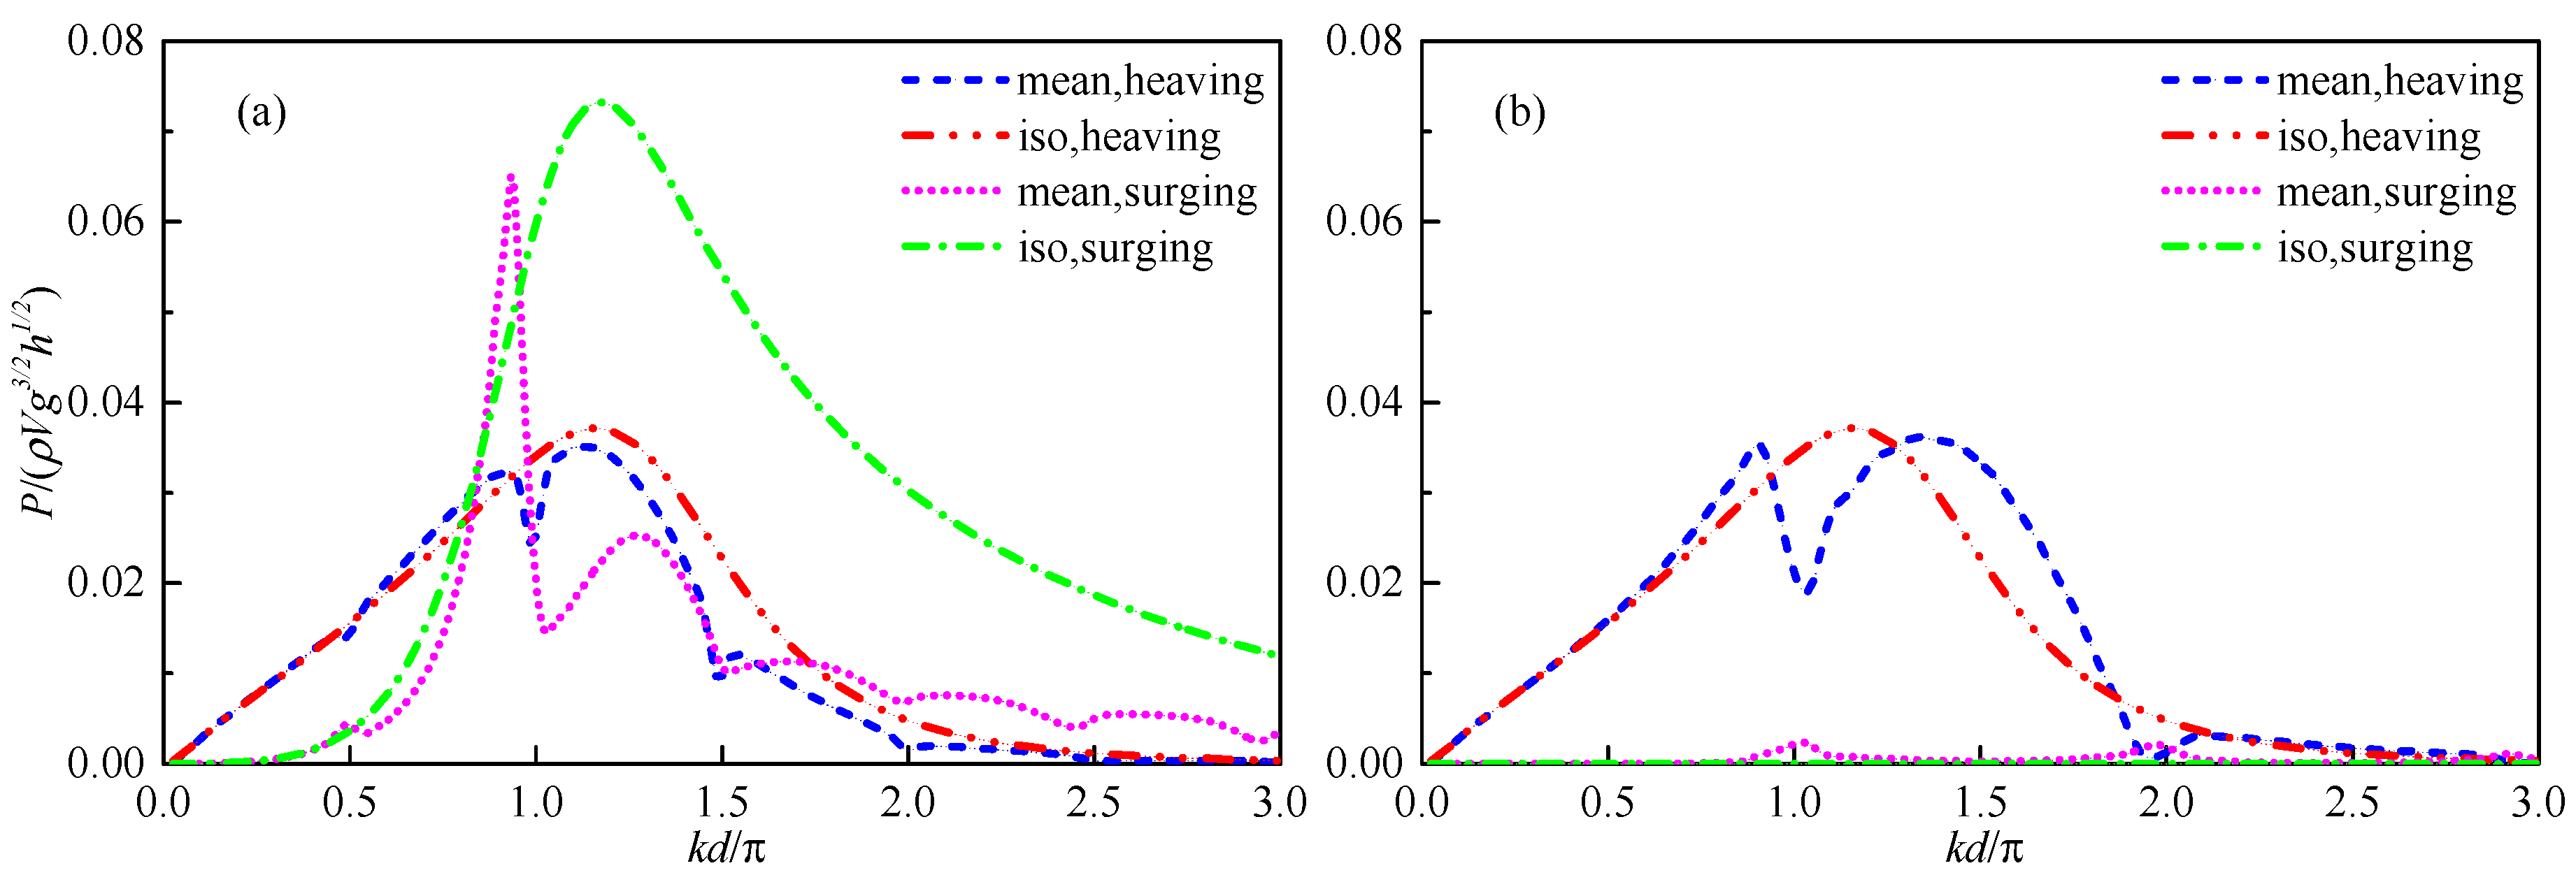
Figure 8 shows the comparison of mean power extracted by the surging and heaving arrays with the power of the single isolated WEC under the incident direction
β = 0° and
β = 90°. From
Figure 8a, it can be seen that the mean power of the array appears to have an extreme value at
kd/π ≈
n/2, in a heaving or surging array. The mean power is affected by Neumann-type and Dirichlet-type near trapping at
kd/π ≈
n/2 and
kd/π ≈
n (
n = 1, 2, …), respectively. At
kd/π ≈ 1.0 and 1.5, the mean power of surging array is reduced by about 75% and 80% in comparison with the single isolated one, respectively. At the same time, the relating reductions of mean power in the heaving array are 30% and 55%, respectively. This shows that when the near trapping phenomenon occurs, the total power of the array decreases significantly and the effect of near trapping on the surging array is more dramatic than that on the heaving array. Moreover, for the long wavelength, there is basically no difference between the mean power and the power absorbed by the single isolated absorber and the array. However, for the short wavelength, the absorbed power changes significantly because the interference between the array and wave becomes more remarkable. As shown in
Figure 8b, the mean power of the array is only affected by Dirichlet-type near trapping at
kd/π ≈
n, where Dirichlet boundary condition is satisfied. The mean power of the surging array is basically near to 0, because the original PTO damping (parallel to the x-axis and 0-degree incident direction) is orthogonal to the incident wave direction at this time.
For the single isolated absorber in open water, the power captured in surge mode is twice as much as that in heave mode, and the frequency adaptability of power is better for the single isolated absorber in surge mode. However, when the surging absorbers are arranged into the linear array, the incident wave frequency and direction adaptability of total power are quite poor. In contrast, the frequency and direction adaptability of the power extracted by the heaving array have little change compared with that of the single isolated heaving absorber.
As a result, the absorbers oscillating in the surge mode are not suitable in the array system, because interaction effects have a quite negative impact on their performance. Therefore, the heaving arrays should be chosen according to the economy of resource utilization and adaptability to sea conditions.
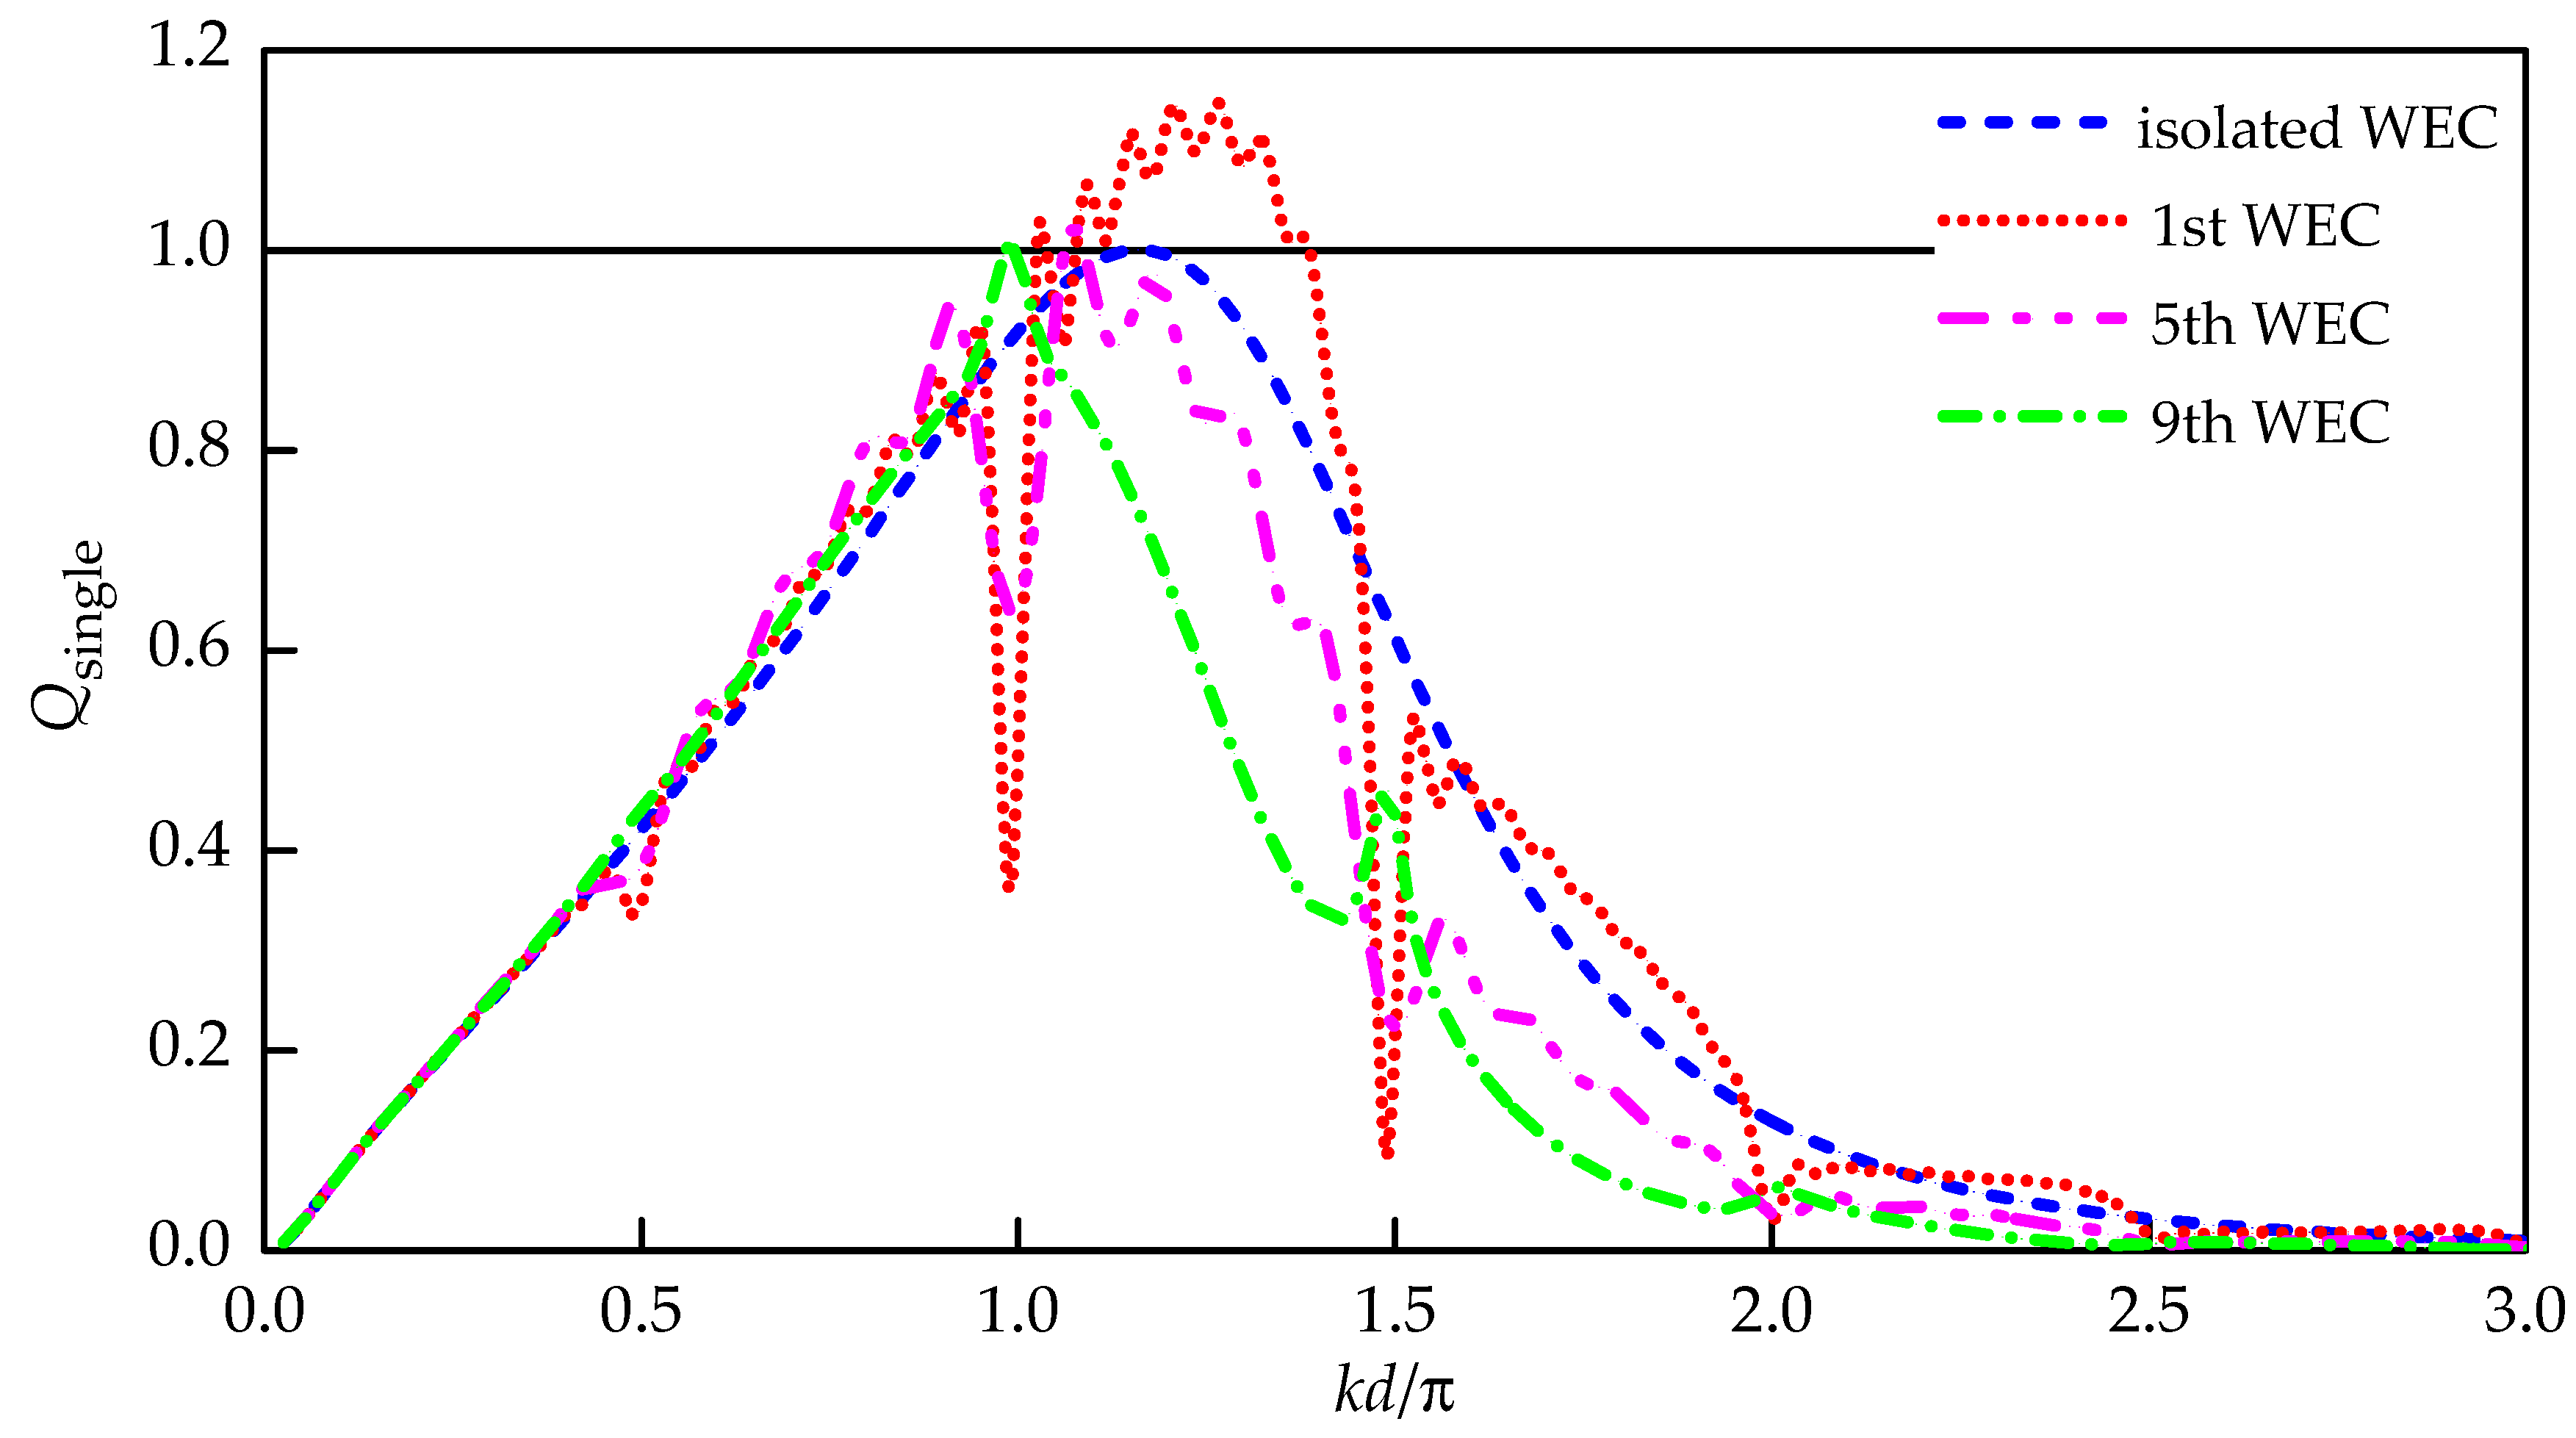
The single interaction factors of three representative WECs in the array and comparison with the single isolated WEC in open water are shown in
Figure 9. A series of significant changes can be found at the critical wave numbers at which the near trapping conditions (i.e.,
kd/π ≈
n/2,
n = 1, 2, …) are satisfied. In the long wave, the difference of power captured by all absorbers in the array is very small because of the strong diffraction of the incident energy along the array. Even when Neumann trapping mode occurs (
kd/π ≈ 0.5), the power differences among absorbers in the array and that of the single isolated absorber are not very significant. However, when
kd/π ≈ 1.0 and 1.5, the effect of near trapping is quite obvious. When
kd/π ≈ 1.0, although the power absorbed by the first WEC decreases significantly, the power absorbed by the downstream WECs along the array increases gradually, and the power of 9th WEC is close to the optimal power of the single isolated one in open water. When
kd/π > 1.0 and far from the critical wave numbers at which the near trapping occurs, the single interaction factor of each absorber along the array decreases gradually, and the power absorbed by the first WEC is the largest. This is mainly due to the reflection from the downstream absorber, which can make the upstream absorber extract more power. Meanwhile, the power extracted by the downstream absorber is obviously lower than the power extracted by the single isolated absorber in open water due to the absorption and dissipation of the incident energy by the upstream absorber.
In other words, as the near trapping occurs, the incident energy is affected by the array and transformed to the array downstream and the power extraction increases along the array distribution. For the cases without near trapping, the power extracted by the upstream WECs is large.
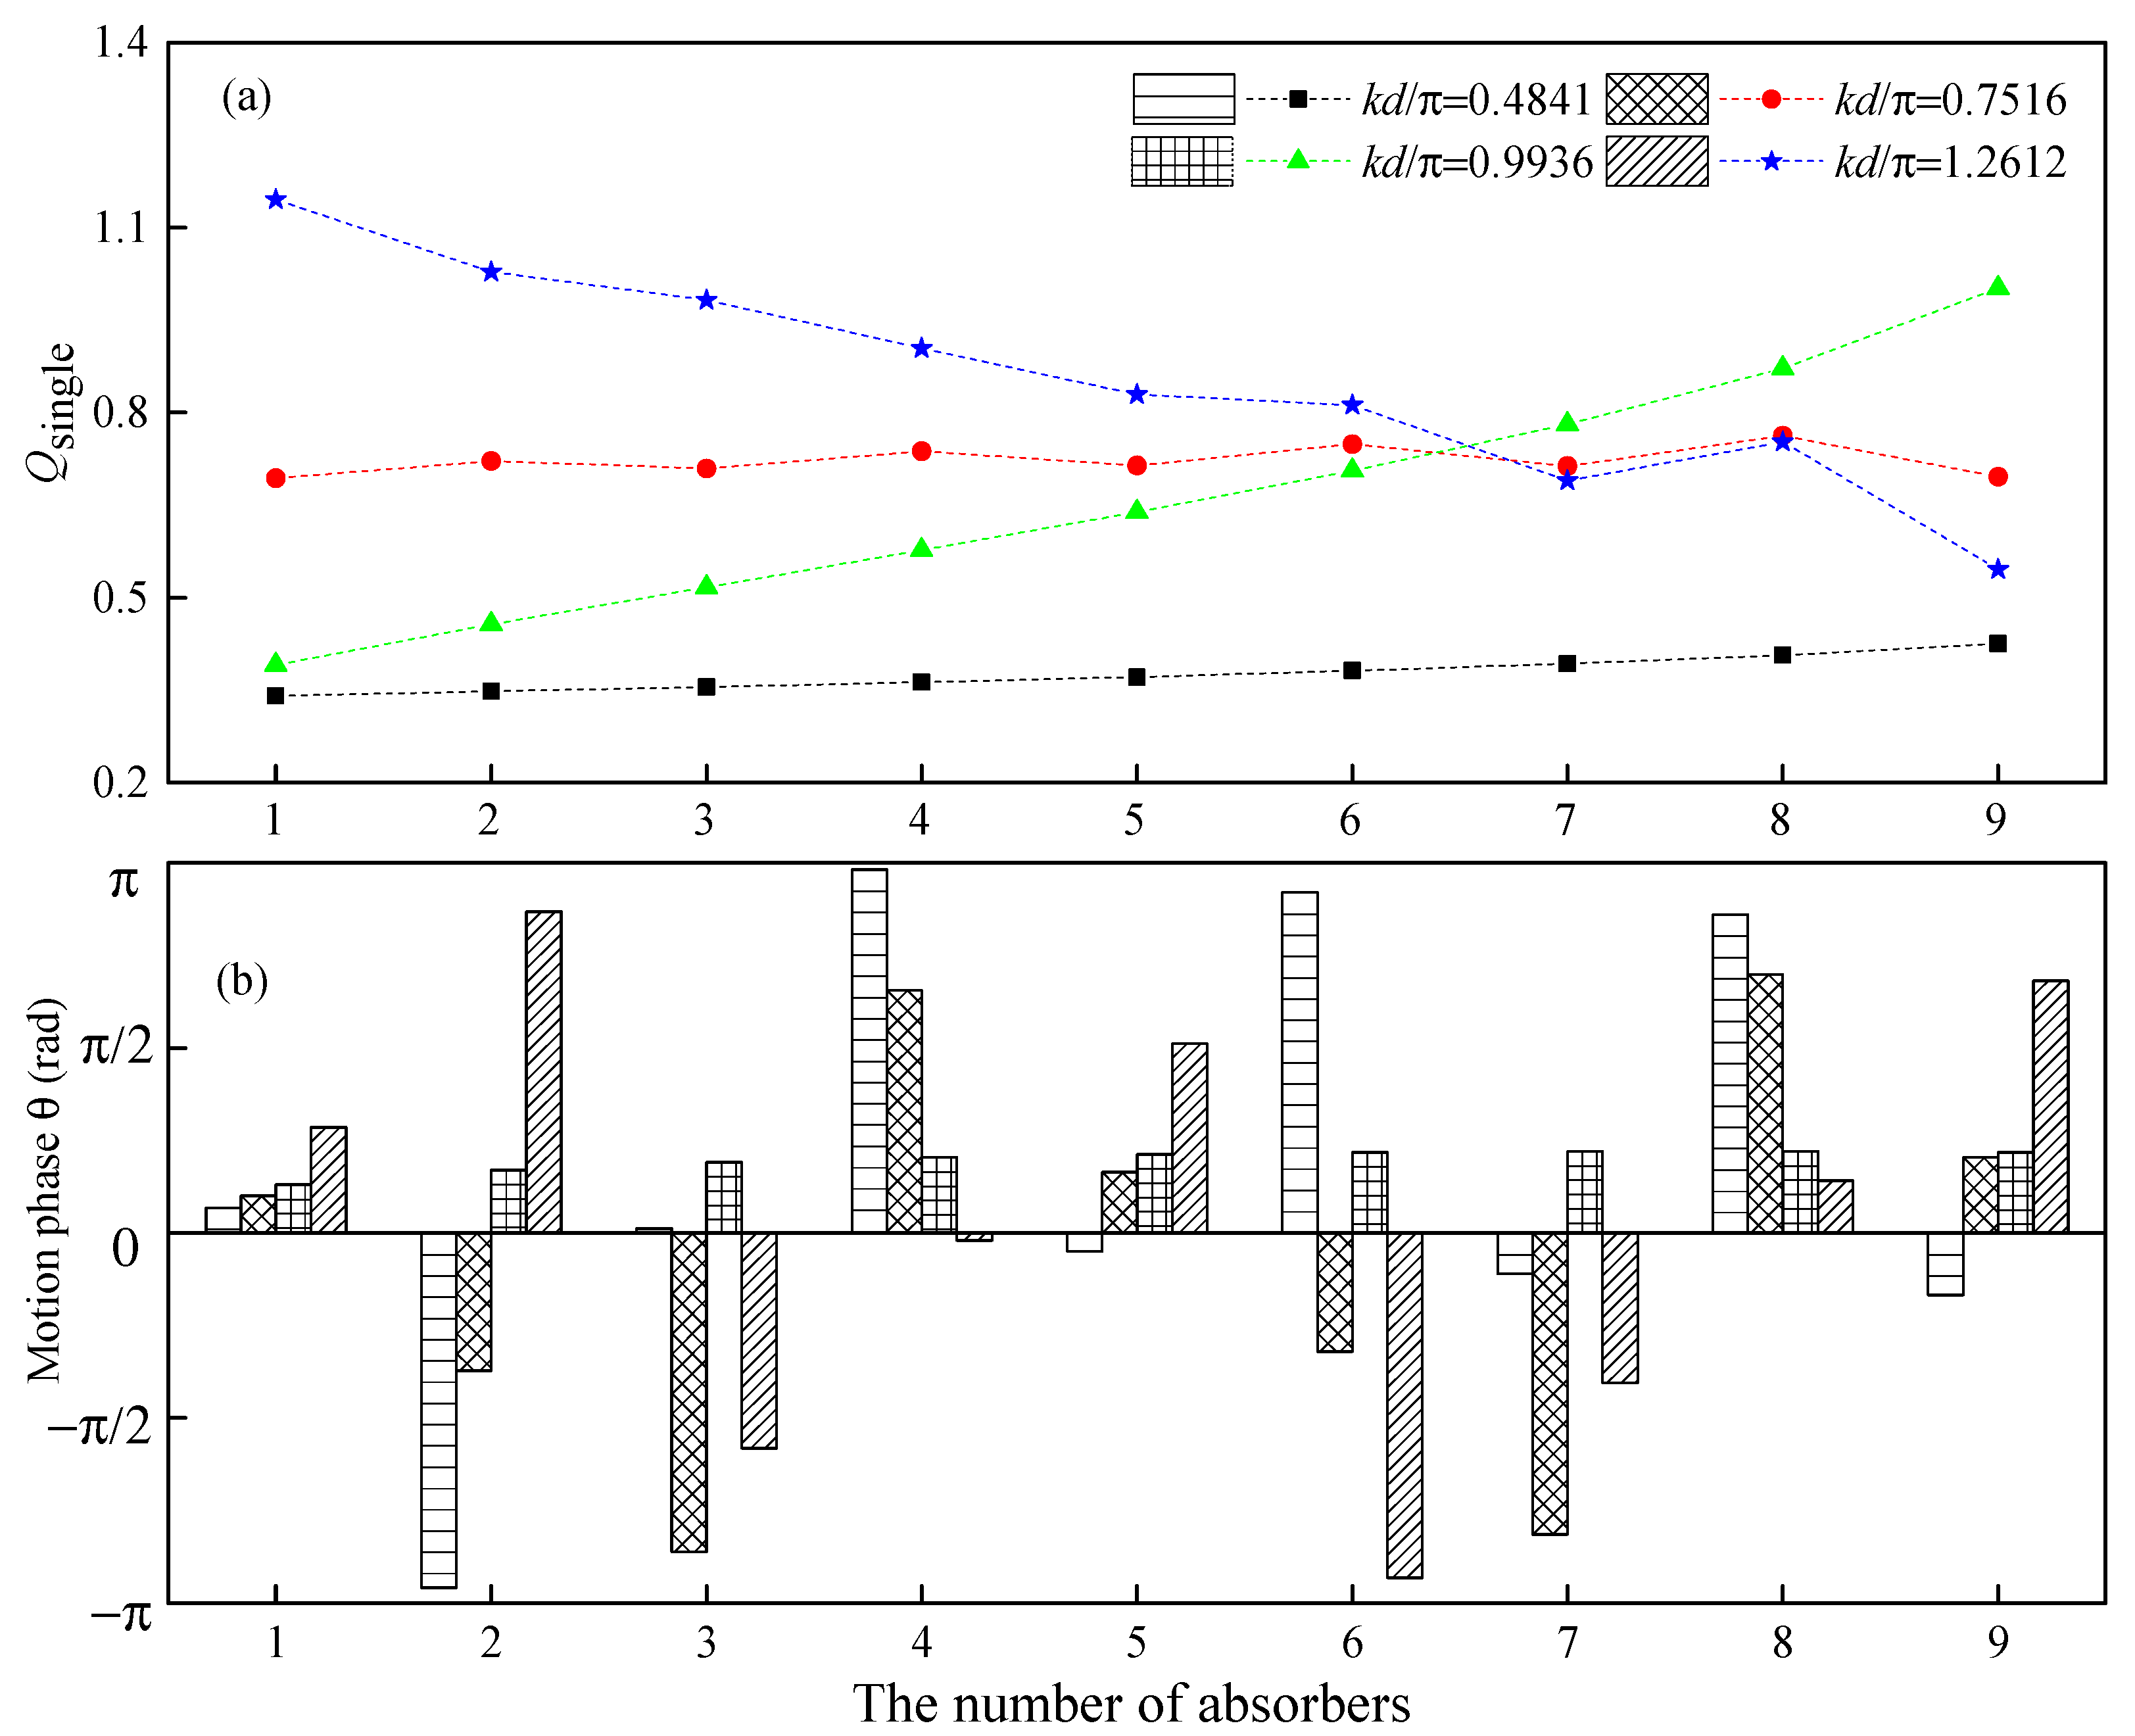
Figure 10 shows the distribution of the single interaction factor and motion phases of nine heaving absorbers in the head seas, under four incident wave conditions, which were selected according to the results in
Figure 9, including the critical frequencies of Neumann-type and Dirichlet-type near trapping. The other two cases are
kd/π = 0.7516 and
kd/π = 1.2612.
Unsurprisingly, when the spacing between absorbers remains fixed, the motion and power absorbed by each absorber in the array are closely related to the wavelength. In the first case of
kd/π = 0.4841, due to the influence of Neumann trapping and strong wave diffraction, the incident energy is refracted to the interior of the array, and the single interaction factor along the array increases slightly. Moreover, it can be seen from
Figure 10b that the motion on the adjacent absorbers has the opposite phase. In the second case of
kd/π = 0.7516, where the spacing is three times the quarter-wavelength, the power is basically consistent along the array, and slightly larger in the middle, which should be caused by the reflection effects of the downstream absorbers. The phase difference of the adjacent absorbers is about ±π/2. In the third case of
kd/π = 0.9936, where the wavelength is approximately equal with the spacing, the Dirichlet boundary condition can be satisfied. Therefore, the motion phase of each absorber is basically the same. Just like Neumann trapping, the incident energy is refracted into the interior of array. Due to the redistribution of the incident energy by trapping, the single interaction factors along the array are markedly increased, and the power extracted by the last absorber approaches that of the single isolated absorber. In the case of
kd/π = 1.2612, the diffraction effects are weakened and the sheltering effects are strengthened because the absorber scale relative to the wavelength is larger. Thus the single interaction factor decreases along the array. The motion phase difference of the adjacent absorbers is the same as
kd/π = 0.7516.
From these four cases, it can be seen that the ratio of the spacing and the wavelength has a significant effect on the whole performance of the array. The wave energy distribution can change due to the action of the array. Therefore, it is necessary to discuss the effect of the relative spacing on the array performance in detail.
3.2.2. Spacing between Absorbers
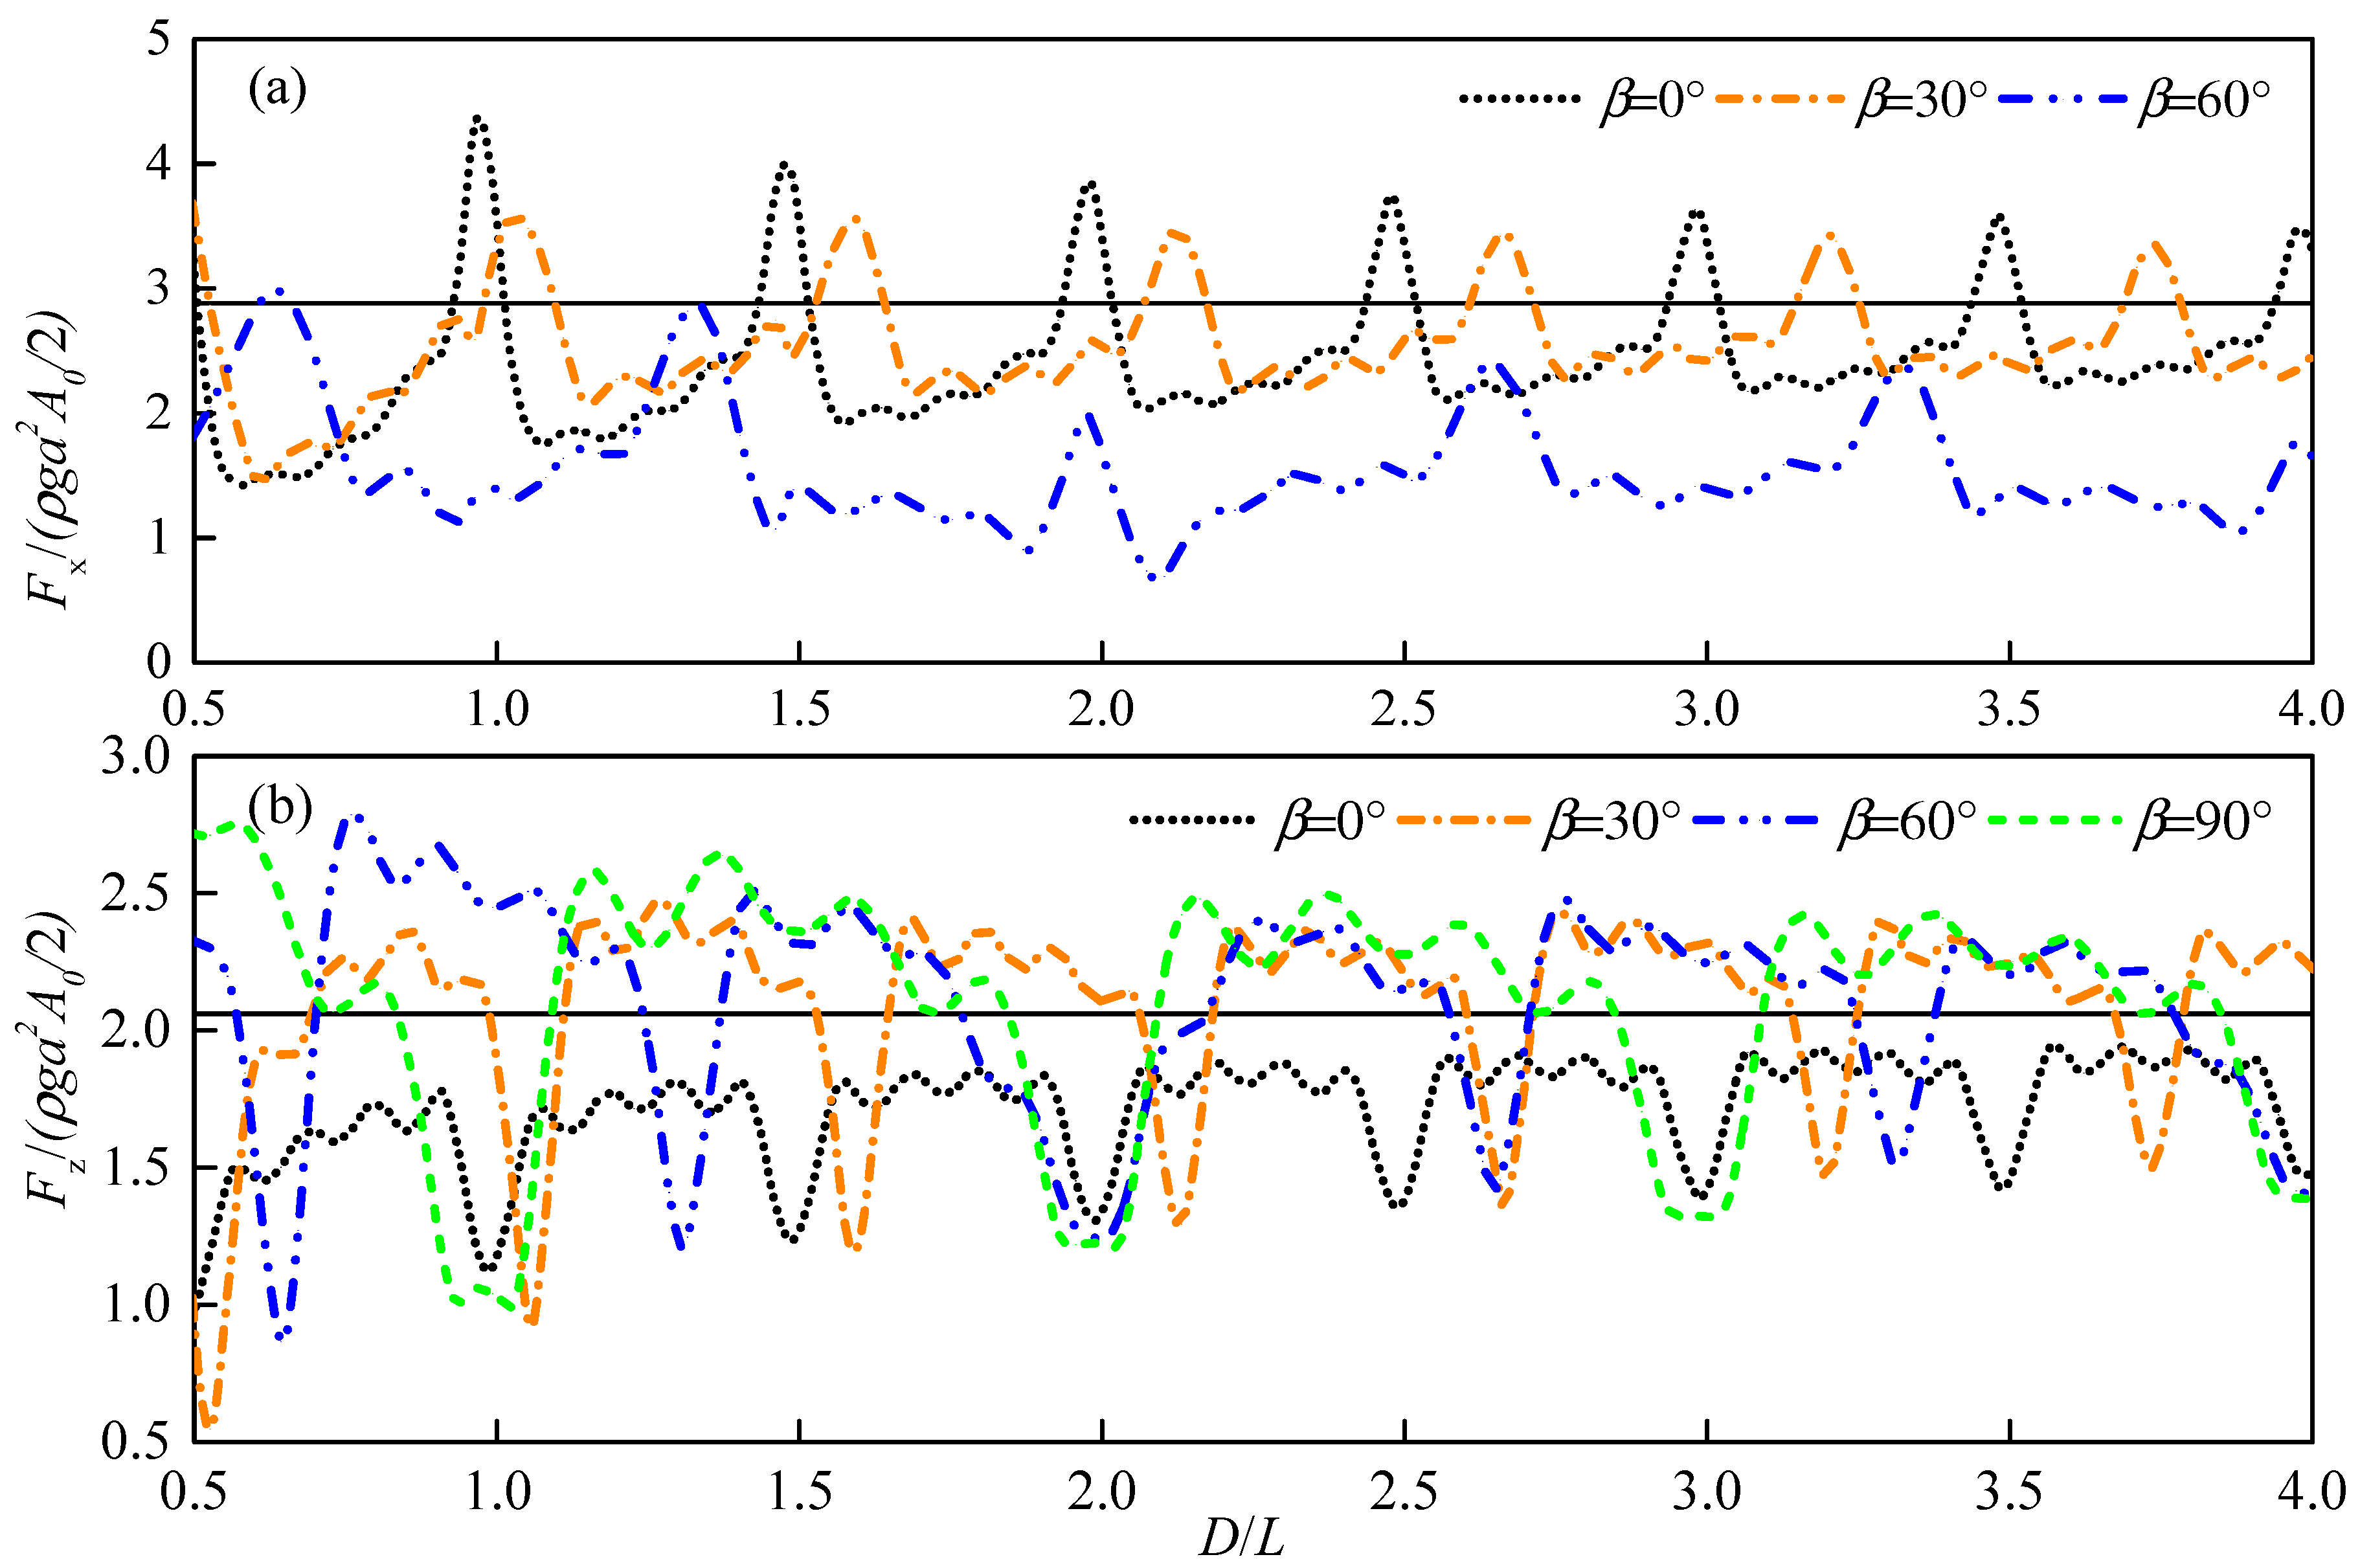
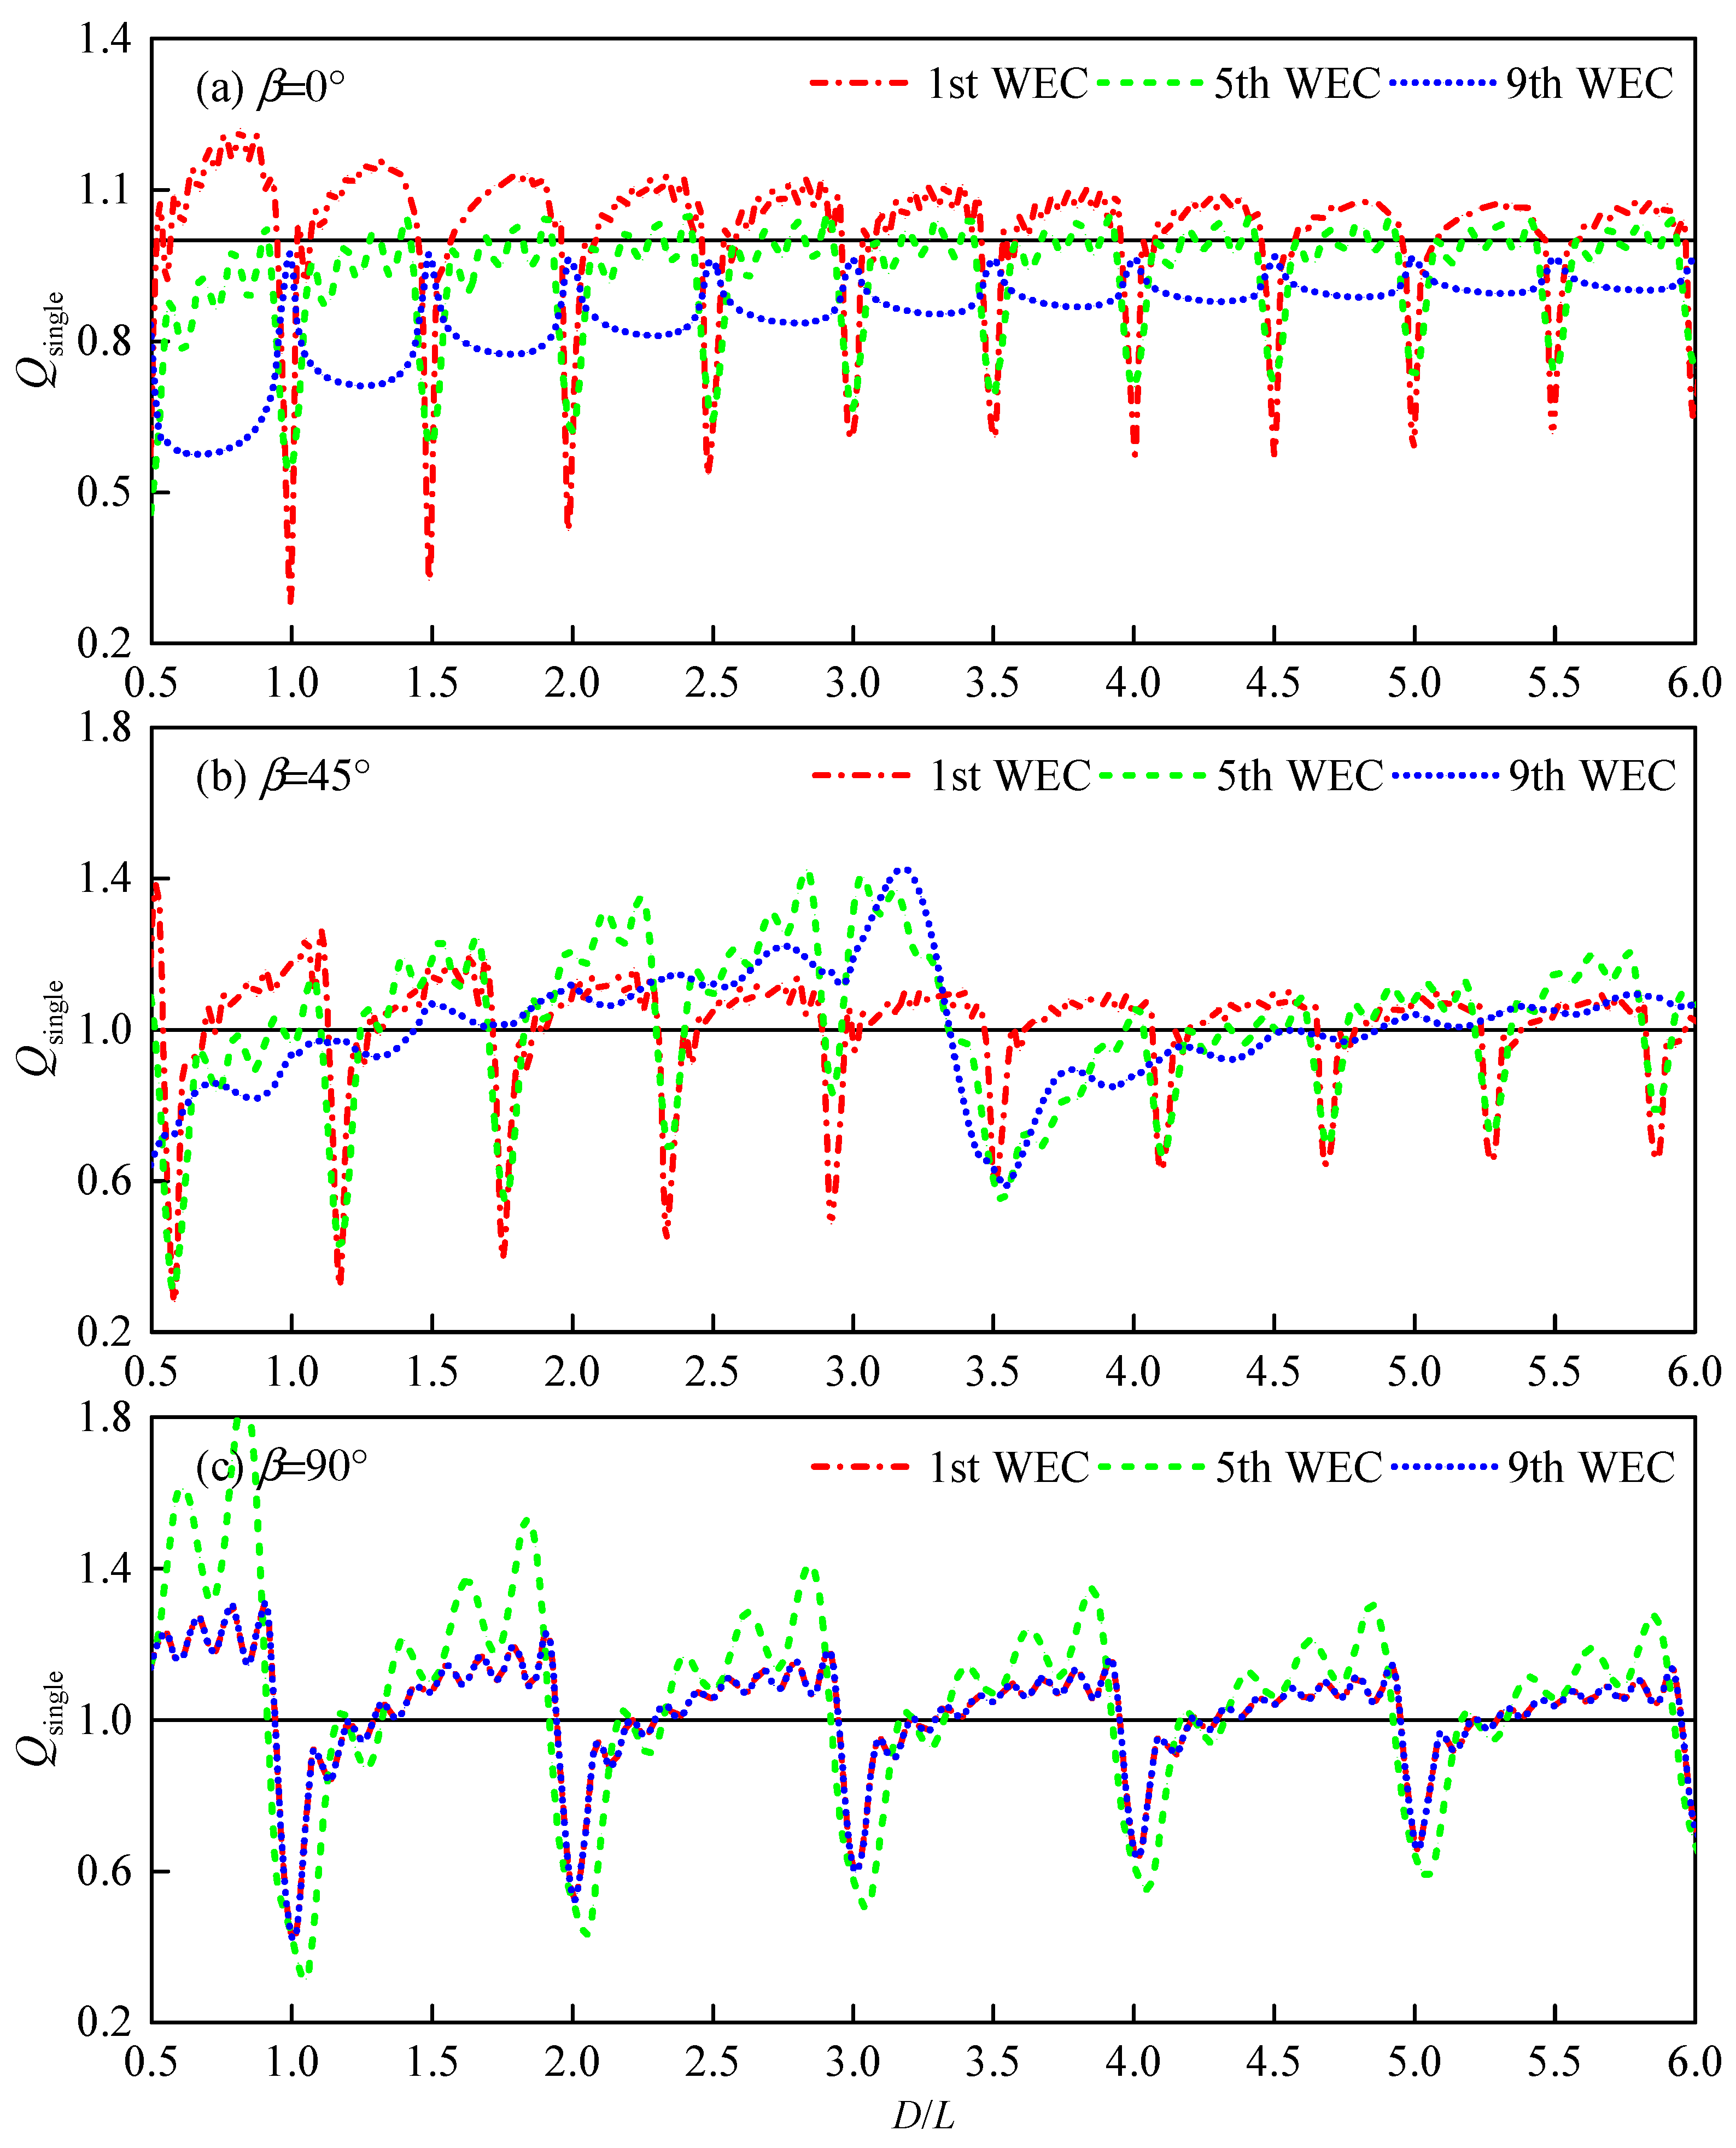
In this section, the influence of the spacing between the adjacent absorbers on the power distribution in the array under different incident wave directions is studied, as shown in
Figure 11, where the horizontal solid line represents the single interaction factor of the single isolated absorber in open water. The influence of the ratio of spacing to wavelength on the absorbed power is considered and the wavelength is kept as
L = 6.85 m, at which time the power absorbed by the single isolated absorber in open water is optimal.
From
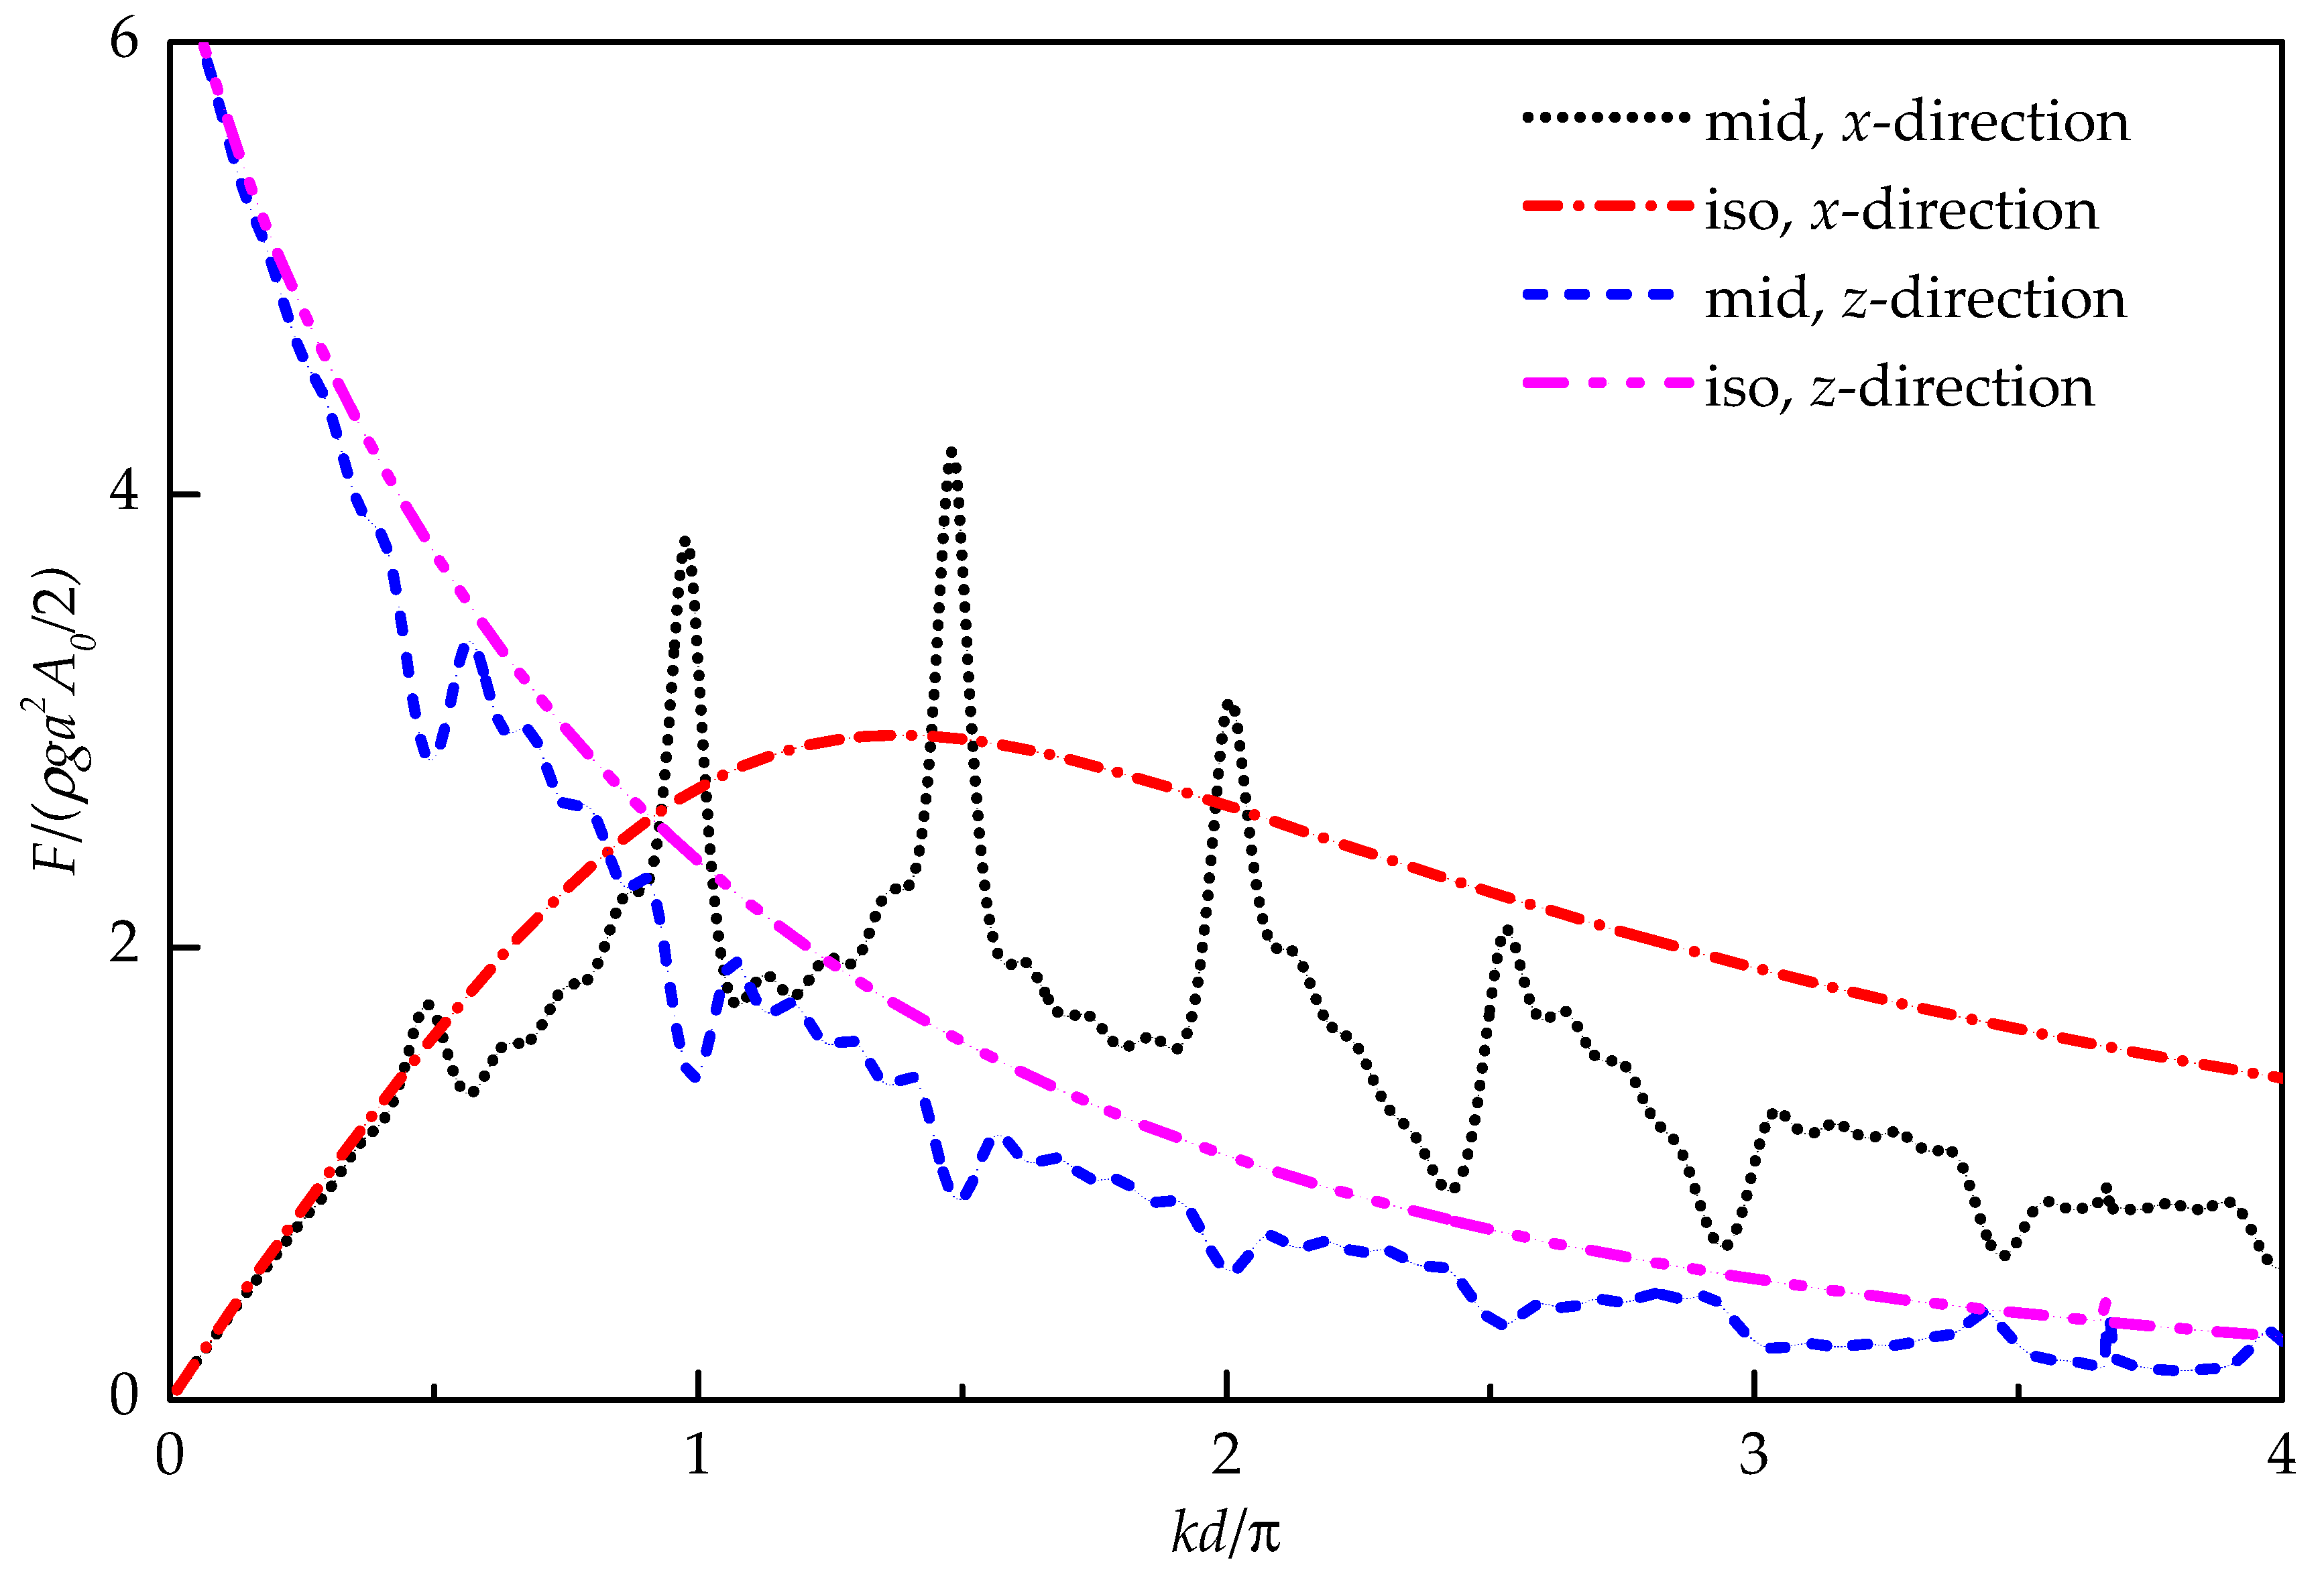
Figure 11, it can be seen that the periodicity of the power extracted by the absorbers with respect to spacing is the same with that of the excitation force acting on the absorbers (
Figure 7). According to the characteristics of the single interaction factors shown in
Figure 11, the facing wave direction and layout spacing of the array can be adjusted to reduce the power difference among absorbers and improve the total power.
At
β = 0° in
Figure 11a, the power absorbed by the first WEC in the array is smaller than that absorbed by the last WEC when the relative spacing satisfies the certain condition (
D/
L =
n/2,
n = 1, 2, …), i.e., near trapping condition, at which the captured power increases along the incident wave direction. However, the absorbed power of each absorber decreases along the incident wave direction at the none near trapping condition. The power absorbed by each WEC in the array is quite different and the power distribution is uneven, which indicates that the array layout is not desirable.
At
β = 90° in
Figure 11c, the near trapping occurs when the spacing is equal to the integral times of the wavelength (i.e.,
D/
L =
n,
n = 1, 2, …), at which the single interaction factor of each WEC decreases significantly. In the absence of near trapping, the overall trend of the power absorbed by each WEC is basically the same. Moreover, the single interaction factor of the middle WEC is slightly higher than that of other WECs, and the single interaction factors of all WECs may be above 1.0. The array layout is more reasonable with this status. Therefore, the total power absorbed by the array is the least and the performance is the worst when the arrangement spacing is equal to the integer times the wavelength. In contrast, when the spacing is far from these separation spacings inducing the near trapping, the single interaction factor of each WEC may be more than 1.0, and the performance could be greatly improved due to the beneficial interaction.
At
β = 45° in
Figure 11b, the near trapping occurs at
D/
L ≈ 0.6
n (
n = 1, 2, …). In addition, the uniformity of power distribution along array is between
β = 0° and
β = 90°. Beyond the separation spacings inducing the near trapping, the interaction factor of the upstream absorber decreases with the spacing, while those of the middle and downstream absorbers increase in the spacing range from 0.5
L to 3.5
L and from 3.5
L to 6.0
L. These two spacing ranges can be regarded as two large envelopes, during which there exists a certain periodicity. The periodicity of this large envelope depends on the incident direction, and the details are described in the
Section 3.2.4.
3.2.3. Number of Devices
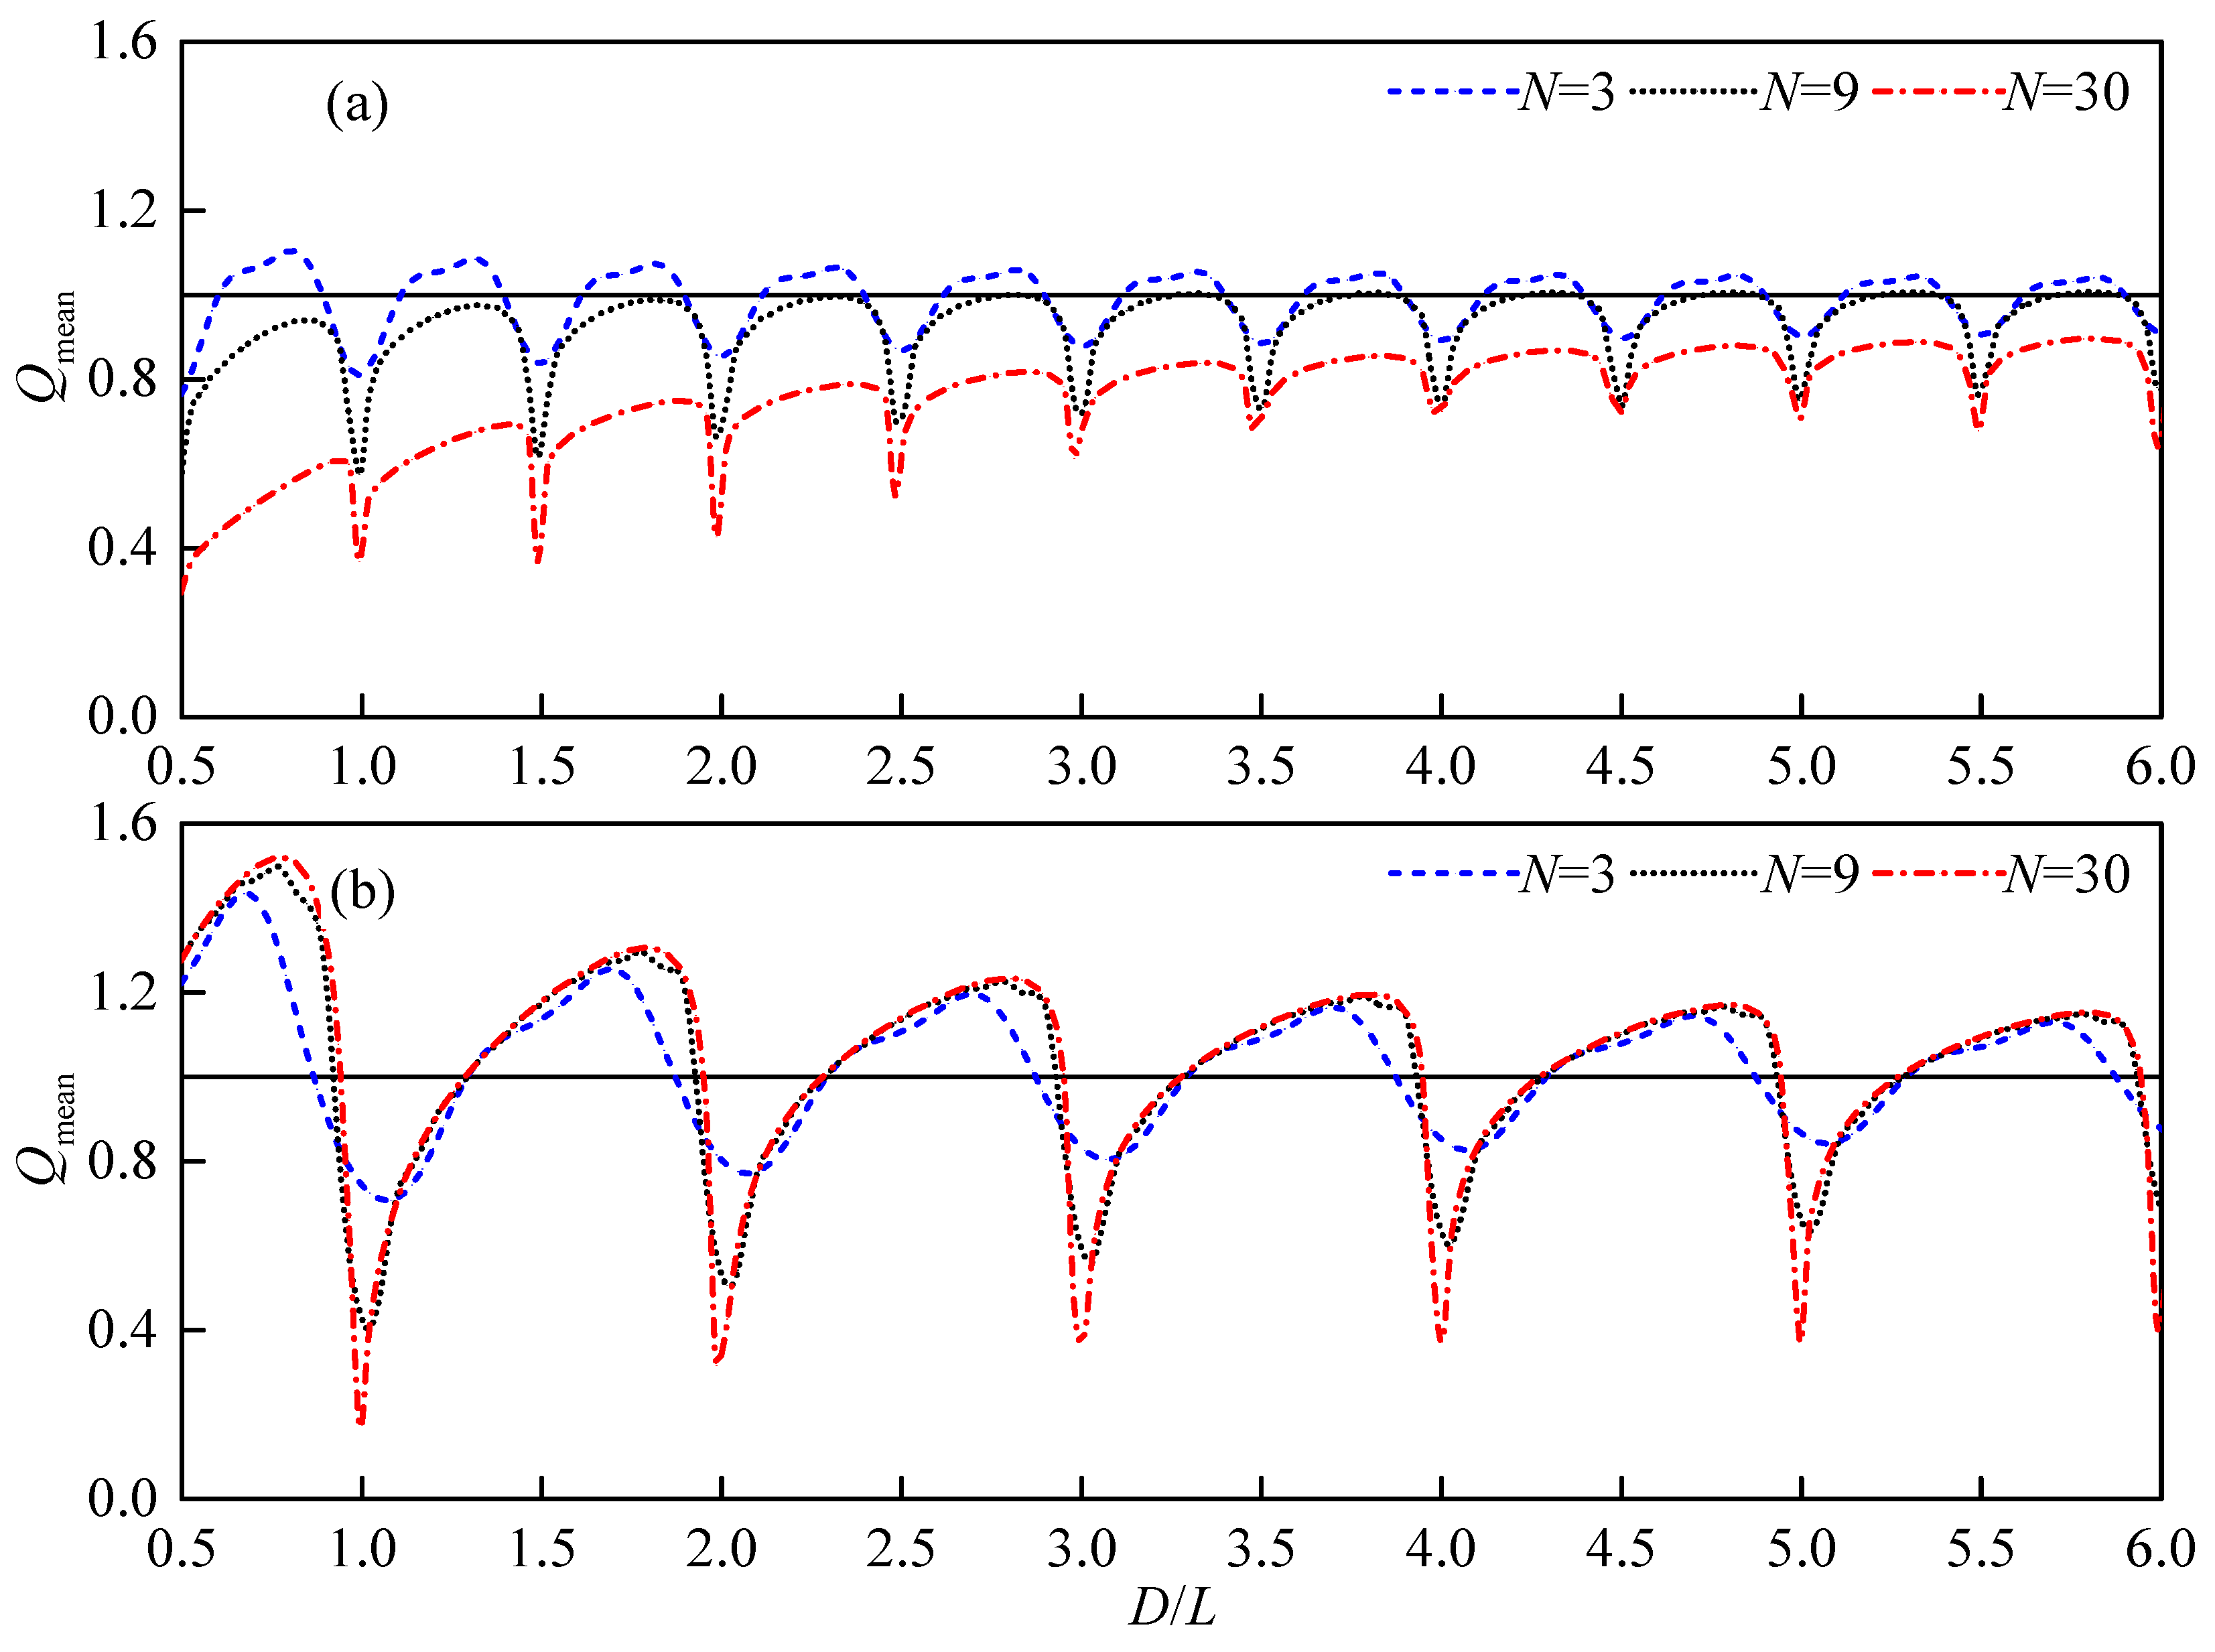
The above results are the analysis of the influence of the near trapping on the array performance based on the single interaction factor. The effects of the number of WECs on the mean interaction factor in the array is studied in this section. The relating results are shown in
Figure 12.
For all the arrays studied, at the near trapping conditions, i.e., D/L = 0.5n (β = 0°) and D/L = n (β = 90°), the mean interaction factor significantly decreases to the trough, which further indicates that the near trapping phenomenon can reduce the total power of the array. And near these special spacings, the mean interaction factor decreases with the increase of the number of WECs, indicating that the near trapping is closer to the ideal trapping phenomenon.
The mean interaction factor of the array is constructive at most of the none near-trapping spacing for
β = 0° and
N = 3, which indicates that the interaction can increase the power extracted by the array. With the number of WECs increasing, the mean interaction factor decreases gradually. Therefore, it is not appropriate to arrange more WECs along the incoming wave direction, which is in agreement with earlier studies [
5]. However, for the case of
β = 90°, the interaction between arrays increases the power extracted by the array for both the smaller and larger arrays. With the number of absorbers increasing, the advantageous spacing range is broadened slightly and the constructive interaction factor increases slightly before the near trapping occurs, as shown in
Figure 12b.
For larger arrays, the reduction of the total power due to the near trapping is greater. Thus the array spacing should be designed to avoid the range where near trapping may occur. In addition, for more absorbers arranged along the incidence wave direction, the shadowing effect implies the reduction of the total power absorbed by the array.
3.2.4. Incident wave Direction
The above discussion shows that the incident wave direction affects the hydrodynamic performance of the array, that is, not only does the spacing of the near trapping change, but also a periodic large envelope occurs. The influence of the wave direction is described in this section.
In
Figure 13, the mean interaction factor is given as the function of the relative spacing between the adjacent absorbers for the incident wave direction varied from
β = 15° to
β = 75°, and the angle step is 15°. It can be found that the spacing where the near trapping occurs increases with the incident angle. Therefore, at the same spacing, the array performance of different incident directions may vary greatly. For instance, when the spacing is equal to the wavelength (
D =
L), the mean interaction factors of the array at
β = 60° and 75° are more than 1.2 times that of the single isolated absorber, while the mean interaction factors at
β = 0°, 15°, 30° and 90° are obviously less than 1.0.
Combined with the cases of
N = 9 in
Figure 12, there are only several periodic separation spacings satisfying
Qmean > 1 after
D > 3
L in head seas, and the interaction effects are always constructive except for the spacing range (
D/
L = 0.93 +
n − 1.29 +
n,
n = 1, 2, …) inducing the near trapping in beam seas. The near trapping can reduce the power production by more than 40% (for head seas) and 60% (for beam seas) in comparison with the single isolated absorber at the spacing
D =
L. For the incident directions other than
β = 0° and
β = 90°, the periodic envelopes appear on the curves of interaction factors related to the spacing. The maximum amplitude of this envelope decreases as the spacing increases, and the envelope period decreases with the increase of the incident wave angle.
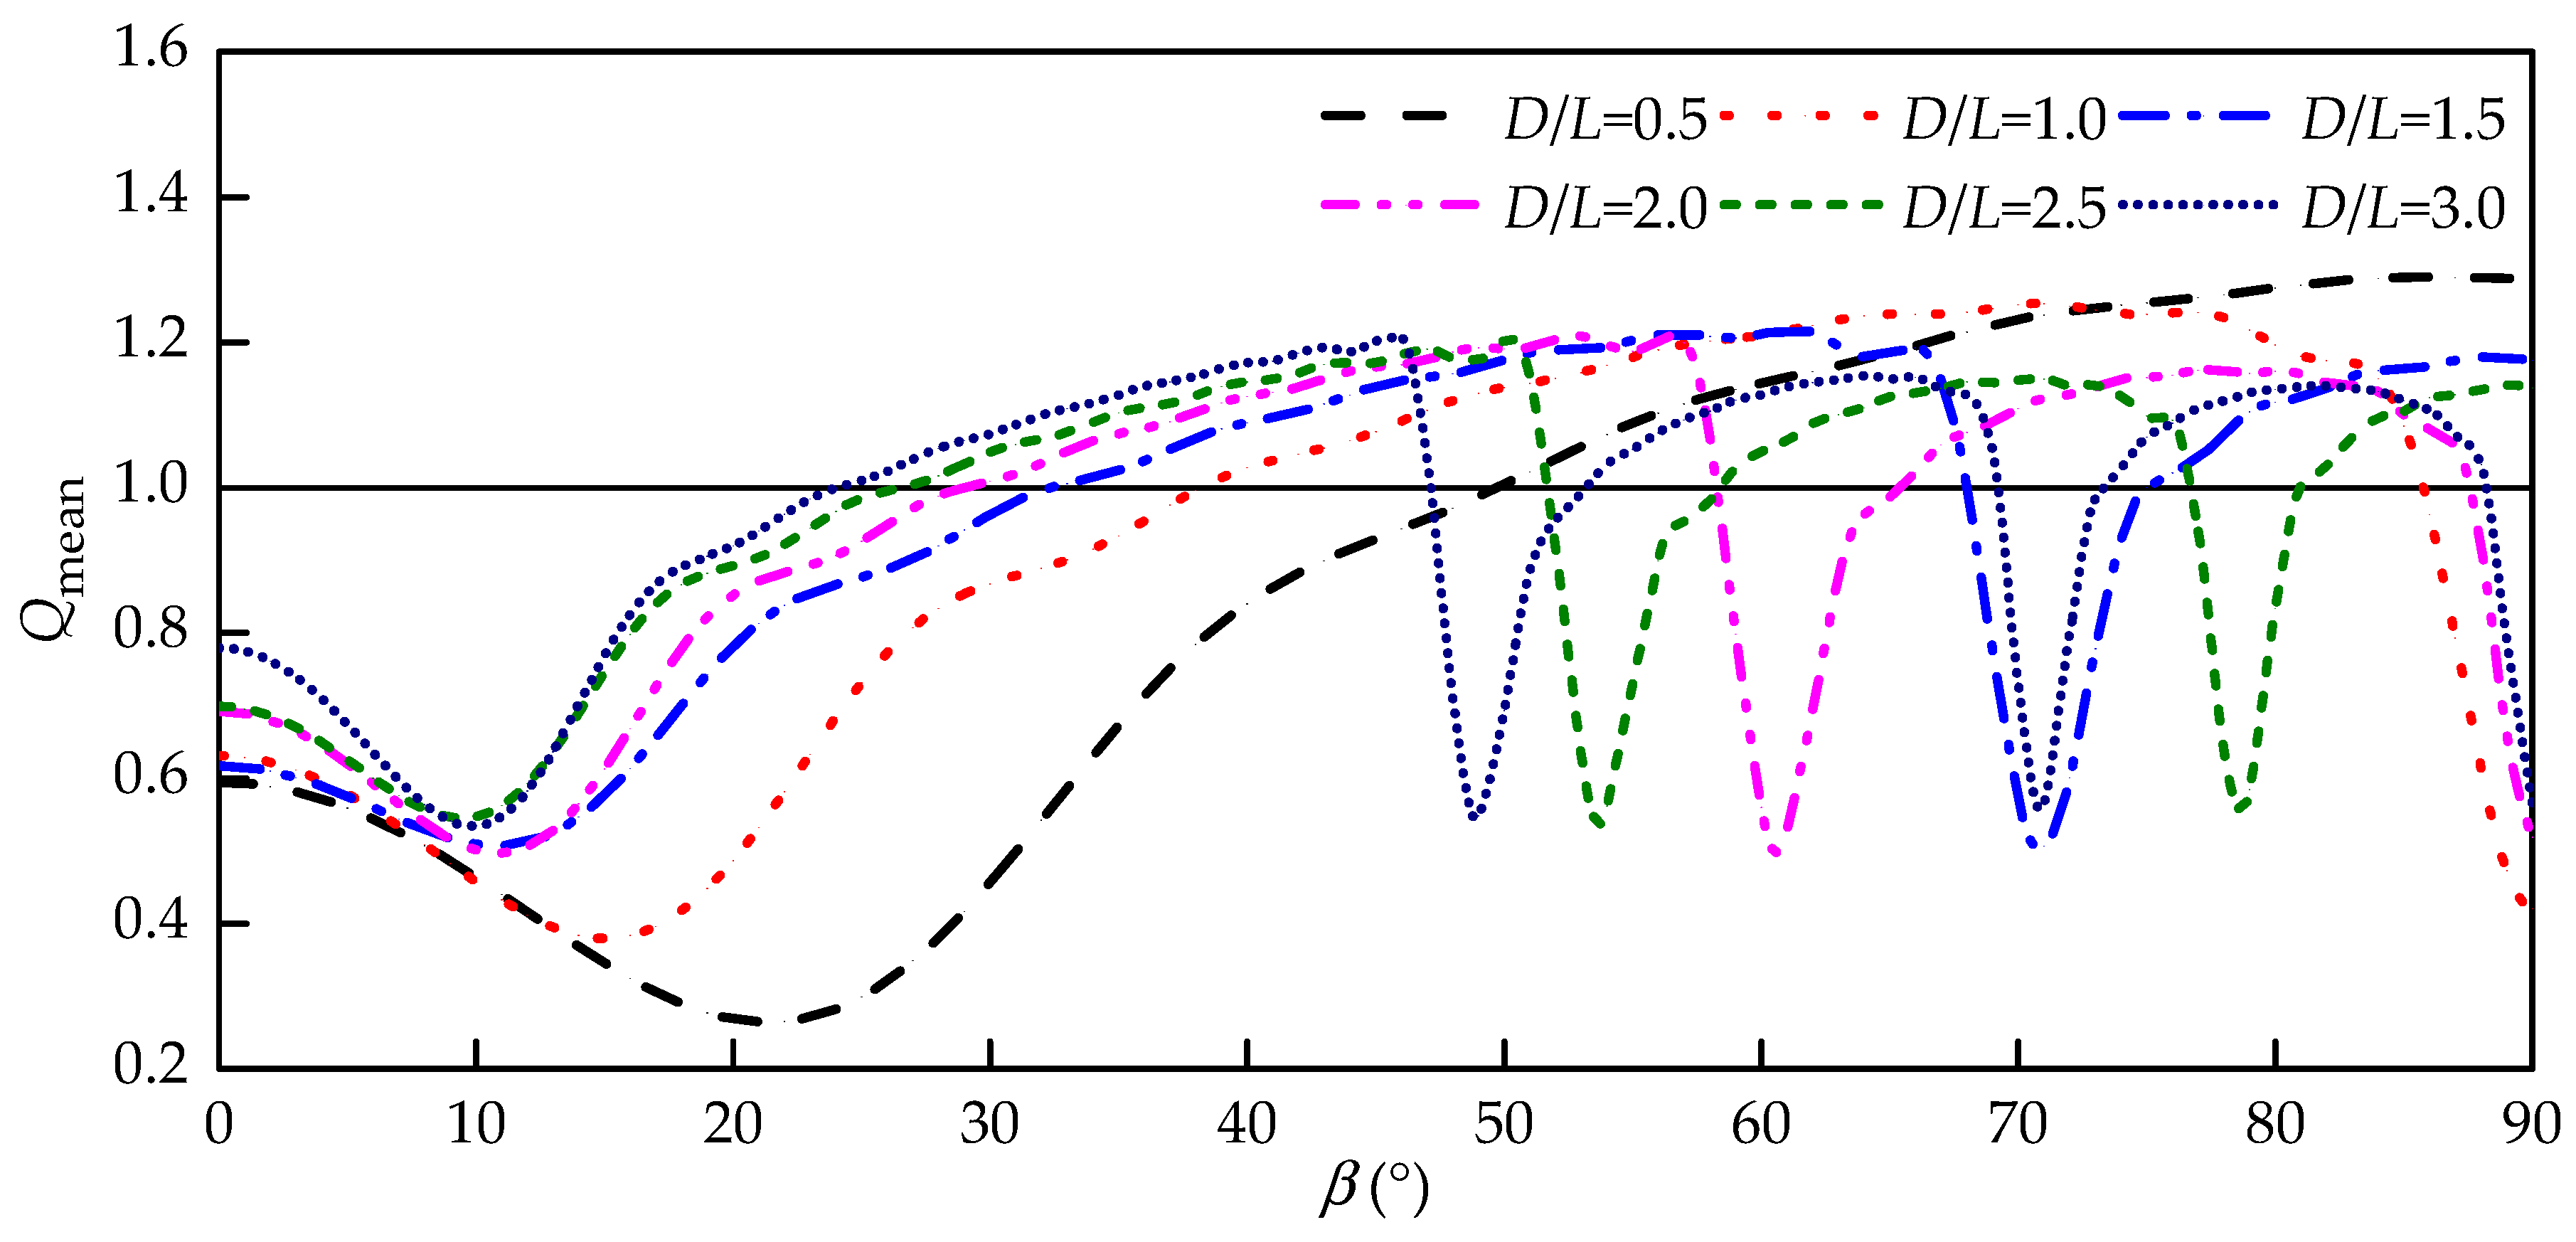
From
Figure 14, it can be seen that if the relative spacing remains constant, the array performance varies with the incident angle. By taking
D/
L = 0.5 as an example, the minimum value of the mean interaction factor appears near
β = 22°, while the mean interaction factor is greater than 1.0 for
β ≥ 52°. For the case of
D/
L = 1.0, the mean interaction factor has minimum value at
β = 15°and 90°, while the mean interaction factor is greater than 1.0 for
β = 40°–85°. Generally, a small incident angle is not constructive for the total power extraction, especially for the array layout with small spacing, which is expected due to shadowing effects. A large incident direction angle is therefore beneficial to the array performance, except for those inducing the near trapping.
As shown in
Figure 14, there is only one direction angle inducing the near trapping at
D/
L = 1.5, while there are three directional angles causing the near trapping at
D/
L = 3.0. With the increase of the separation spacing, the number of incident direction angles inducing the near trapping increases. For larger spacing, the first incident direction angle inducing the near trapping grows smaller, which is related to the occurrence of envelope. In other words, with the spacing increasing, the direction angle at which the mean power of the array is equal to the power of the single isolated WEC in open water becomes smaller.
Figure 14 shows that the first sudden change occurs at
β = 60° for
D/
L = 2.0. Combined with
Figure 13,
D = 2
L is the period of large envelope in this incident direction. So for
β = 60°, there are three such envelopes appearing in the range of spacing studied, and the maximum amplitude of envelope decreases because of the weakened interaction. For
β = 45°, the period of envelope is
D = 3.5
L as shown in
Figure 13, which corresponds to the first direction angle inducing the near trapping at
D/
L = 3.5 according to
Figure 14.
It can be seen that, once the array layout and incident condition are constant, the direction angle of the array layout relative to the incident wave can also be adjusted to improve the performance of the array. The effect of the direction, therefore, provides an opportunity to uniformly distribute power in the array and improve power characteristics.


