Abstract
The biomass estimation, nutrient stock, and stoichiometric characteristics are critical for understanding forest productivity and quality. To date, there is not enough comprehensive research on nutrient stock and stoichiometric characteristics of each tissue among different tree species in the semi-arid region on the Loess Plateau. So, six dominant tree species were selected to estimate the forest biomass by allometric equation and to analyze the effects of tissue and species on biomass allocation and nutrient stock by variance analysis in our study. Results showed that forest biomass, nutrient concentration, nutrient stock, and stoichiometric characteristics varied with tissue and species. Betula platyphylla and Pinus tabulaeformis had high total biomass while Populus davidiana had the least total biomass, and the biomass allocation of each tissue generally followed the order of stem > branch > root > foliage. The weighted mean concentrations of carbon (C), nitrogen (N), and phosphorus (P) changed from 432.67 g·kg−1 to 481.43 g·kg−1, from 6.15 to 8.30 g·kg−1, and from 0.43 to 0.74 g·kg−1, respectively. The relatively high nutrient stocks were observed in Pinus tabulaeformis and Betula platyphylla across organs and in stem across species. The C:N and C:P ratios were higher in stem and root than those in branch and foliage for each species, while the effects of tissue on N:P varied with species. Overall, the N:P ranged from 7.92 for stem (Larix principis-rupprechtii) to 22.18 for foliage (Populus davidiana). Therefore, Pinus tabulaeformis and Betula platyphylla can increase effectively nutrient fixation capacity in the semi-arid region on the Loess Plateau. Also, N or P limitation of tree growth in this region varied with species.
1. Introduction
The Loess Plateau is one of the most seriously eroded regions in the world with a fragile ecological environment and human deforestation and overgrazing [1,2]. Thus, the Natural Forest Protection Program and the Grain-to-Green Program have been implemented to improve environments and foster sustainability of ecosystem services [3,4,5]. With the application of these programs, soil erosion and land degradation have been significantly controlled, and the forest vegetation cover has greatly improved [4,6]. An assessment, however, of biomass in forests restored from farmlands in the Loess Plateau is still lacking, thus limiting our ability of evaluating forest ecosystem productivity and services. Indeed, tree biomass is an important indicator to evaluate forest carbon sequestration [7] and soil erosion controls [3]. Nutrient contents (including carbon (C), nitrogen (N), and phosphorus (P)) play a major, irreplaceable role in plant growth and a variety of physiological activities [8], which provide the basis for assessing forest productivity and services [9]. Therefore, forest biomass, nutrient concentration, and stoichiometric characteristics of C, N, and P [10,11] have increasingly become the current research hotspots.
The allometric method has been widely used to estimate forest biomass through building up regression equations between biomass and plant morphology variable (e.g., diameter at breast height or height), due to high efficiency and less destruction [12]. Compared with other plant morphology variables (e.g., height), estimation of the diameter at breast height (DBH) is more accurate and less time consuming; thus DBH becomes the most common predictor in all biomass allometric models [13]. To date, the allometric biomass equations between biomass and DBH have been developed for numerous tree species in different regions to estimate biomass at the individual tree level or the plot level [13,14,15]. The biomass allometric equations, however, for dominant tree species have not been developed in the semi-arid region on the Loess Plateau. In fact, equation coefficients were influenced to some extent by geographical factors and species composition [16,17]. Thus, the allometric biomass equations developed in other regions could not be applied on the Loess Plateau, thereby preventing our ability of biomass estimation.
Previous studies have shown that C constitutes a large proportion in plant dry mass, and N and P are the most limiting factors to forest productivity [18,19]. As for forest C accumulation, C concentration of 50% is widely regarded as the constant factor for conversion of biomass to carbon pool [20]. Nevertheless, some other studies showed that the mean C concentration of various tissues among different tree species was underestimated or overestimated using 50% carbon concentration to estimate nutrient stock [21]. Moreover, N and P play important roles in many important physiological processes (e.g., photosynthesis, cell growth, and division) [22]. Many studies focused on N and P concentration variation and their impact factors, but the research on N and P stock of various tissues among different tree species was still not enough. Studies on stoichiometric characteristics have mainly focused on leaf, varying with mean annual precipitation, latitude, and mean annual temperature [23,24,25]. But far less is known about stoichiometric characteristics of other tissues (i.e., stem or root) among various tree species.
Now, although the biomass estimation (including allometric equations) and stoichiometric characteristics of each organ among different species have been well documented in northeast China [13], little is known in the key area (i.e., Ningxia Hui Autonomous Region) of the forest ecological project of returning farmland to forest on the Loess Plateau. Acquiring such knowledge would help in assessing the functional difference among the plant community and forest ecosystem productivity and services. We hypothesized that: (1) Previous allometric equations could not be used to estimate biomass accurately and carbon concentration is lower than 50%; (2) the total nutrient stock varies with species and accumulates in the stem; and (3) stoichiometric characteristics also vary with tissue and species. To test our hypotheses, we analyzed dry biomass and nutrient elements (C, N, P) of dominant species (i.e., Betula platyphylla (BP), Quercus wutaishanica (QW), Populus davidiana (PD), Pinus armandii (PA), Larix principis-rupprechtii (LP), and Pinus tabulaeformis (PT)) at individual tree and plot level in order to: (1) Establish the biomass equations and estimate the tree biomass and partitioning of different tissues among six species and (2) compare the nutrient variation of different tissues among various tree species.
2. Materials and Methods
2.1. Study Region
Our study was conducted in the Ningxia Hui Autonomous Region, which was involved in the Natural Forest Protection Program and the Grain-to-Green Program. This region has a typical continental semi-arid climate with average annual temperature ranging from 5 °C to 9 °C. The average annual precipitation is approximately 400 mm and most of the annual rainfall concentrates from June to September. The main soil types are grey-cinnamon soil and aridic soil, according to World Reference Base for Soil Resource (WRB) 2014–2015. Six dominant tree species, Betula platyphylla, Quercus wutaishanica, Populus davidiana, Pinus armandii, Larix principis-rupprechtii, and Pinus tabulaeformis, with middle-aged stand, were selected in this study. The elevation of the selected six dominant forest types ranged from 1747 m to 2339 m. The canopy density changed from 41.34% to 89.41%. There existed weak or no human activity and animal activity in the study site. The geographical location of the study region and sampling sites is presented in Figure 1.
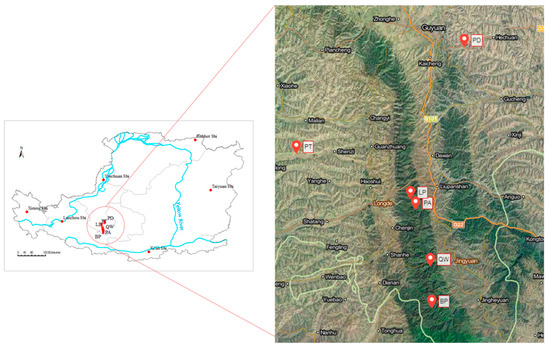
Figure 1.
Geographical location of the study region and sampling sites. BP is short for Betula platyphylla, PA for Pinus armandii, LP for Larix principis-rupprechtii, QW for Quercus wutaishanica, PT for Pinus tabulaeformis, PD for Populus davidiana, respectively (the same as below).
2.2. Field Sampling and Sample Preparation/Establishment of Sampling Plots
The six co-occurring forest sites with similar age and landscape conditions were selected based on access to the forests (landowners’ willingness to support research), landowners’ knowledge of the forest age, and an appropriate distribution and representativeness of ages [26]. In each site, three 1000 m2 rectangular sampling plots were established and each plot include ten 10 m × 10 m subplots to measure diameter breast high (DBH) of each tree (every individual) to estimate forest biomass. The stem, branch, root, and leaf of about 6 to 7 sample trees for each tree species in each plot were separated and weighted. About 30 samples of each tissue for each species were collected to determine carbon, nitrogen, and phosphorus.
2.3. Biomass Estimation
For this study, firstly, the dominant or principal trees were determined according to stock of forest inventory data. The stem, branch, root, and leaf of about 20 sample trees were harvested to fresh weight and DBH of each tree species was recorded. Then, some samples of stem, branch, root, and leaf were taken to weight after oven drying. In this method, we could calculate the total biomass of stem, branch, root, and leaf at the individual tree level.
Secondly, tree biomass (B) was calculated through the selection of a single tree allometric equation. Because adding height (H) cannot improve the accuracy of biomass, we chose DBH as the only parameter to set up the equation as follows [27]:
Finally, all woody plants with a diameter at breast height (DBH) ≥ 2.5 cm were measured in each sampling plot. The biomass in the sampling plot was estimated using allometric equations of sample trees and DBH of all the trees.
2.4. Nutrient Analysis
The samples of stem, branch, root, and leaves were oven-dried to a constant weight at 65 ± 2 °C, ground through 0.2 mm powder for the measurement of carbon and nutrient. Total C and N concentrations were determined on 5–6 mg of the homogeneously ground material of each sample using a VARIO EL III CHON analyzer (Elementar Analysensysteme, Langenselbold, Germany) at the Testing and Analysis Center of Northwest University, Xi’an, China. Total P was measured by acid digestion and determination of phosphate by molybdate reduction using an ultraviolet spectrophotometer [28].
2.5. Statistical Analyses
2.5.1. Nutrient Concentration
To exclude the effect of biomass allocation on interspecific comparisons of different nutrient, a weighted mean nutrient concentration () was calculated for each species as follows [21]:
where [Ni] is the C, N, P measured for the ith tissue, Ai is the allocation ratio of the mass of ith tissue to the total biomass, and n is the number of biomass tissues. The WMCC is short for weighted mean carbon concentration, WMNC for weighted mean nitrogen concentration, WMPC for weighted mean phosphorus concentration, respectively.
The C:N, C:P, and N:P of a whole plant were also calculated by weighted mean methods to exclude the difference of nutrient concentrations of each tissue.
2.5.2. Nutrient Stock
We can calculate different organs’ biomass of each tree and the whole plant biomass using the allometric equation, mentioned above in Section 2.3. According to the nutrient content of different components and Equation (2), individual plant nutrient content (kg·tree−1) of all the species can be estimated. So, nutrient stock (Mg·ha−1) of different forest types was estimated on a plot basis through multiplying biomass by nutrient content.
The general linear models (GLM) procedure with least significant difference (LSD) test in SPSS software version 22.0 was applied to examine intra- and interspecific variations in the C, N, P among species and biomass tissues. Regression analysis was used to establish the allometric equation. Two-factor analysis of variance was used to analyze the effects of tree species and tissue on forest biomass, nutrient concentrations, and nutrient stocks.
3. Results
3.1. Biomass Estimation
Equation (1) could well fit the relationship between biomass of different tissues and diameter at breast height (Table 1). Except for the root biomass of Quercus wutaishanica and Larix principis-rupprechtii, the foliage of Populus davidiana, and the branch of Pinus armandii, the b values were almost greater than 1, showing that growth rate of the organ was faster than that of the whole plant. The scaling exponent b changed between 1.123 and 2.565, while the values of the scaling coefficient a across six species varied from −0.792 to 1.370.

Table 1.
Allometric equations relating B (kg) to DBH (cm) by tree species. B and DBH represent tree biomass and diameter at breast height, respectively.
Biomass partitioning of each tissue among six species (Figure 2) showed that tree biomass mainly accumulated in the stem. Except for Larix principis-rupprechtii, the percentage of each tissue for other tree species ranked the order of stem > branch > root > foliage (Figure 2). For example, the percentage of stem biomass to total biomass ranged from 38.41% (Pinus armandii) to 62.61% (Quercus wutaishanica), while the percentage of branch ranged from 19.97% (Larix principis-rupprechtii) to 33.41% (Pinus armandii). Root also constituted a large percentage of total tree biomass, varying from 12.15% to 31.13%. Regarding segregation of foliage, the percentages of all the six species were less than 10%, with Quercus wutaishanica having the least proportion.
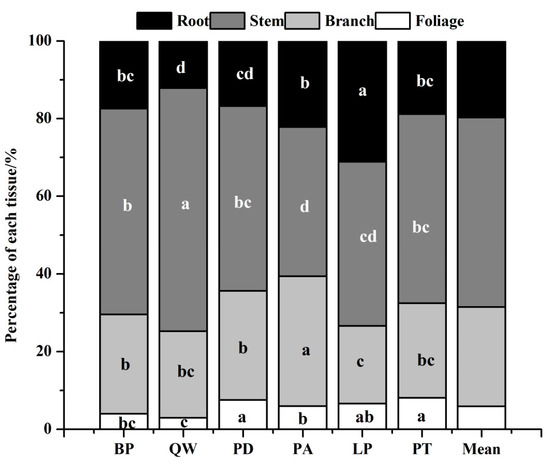
Figure 2.
Biomass partitioning of each tissue among six tree species. Different letters in a line mean significant difference among species at p = 0.05.
The estimation of the biomass varied significantly with species and tissues. Pinus tabulaeformis and Betula platyphylla had high total biomass while Populus davidiana had the least total biomass (48.46 Mg·ha−1) (shown in Figure 3 and Table S1). Meanwhile, the biomass estimation of each tissue among different tree species also followed an order of stem > branch > root > foliage. The stem biomass of Betula platyphylla, Quercus wutaishanica, Populus davidiana, Pinus armandii, Larix principis-rupprechtii, and Pinus tabulaeformis were 41.75 Mg·ha−1, 53.27 Mg·ha−1, 20.47 Mg·ha−1, 20.53 Mg·ha−1, 34.74 Mg·ha−1, and 68.43 Mg·ha−1, respectively.
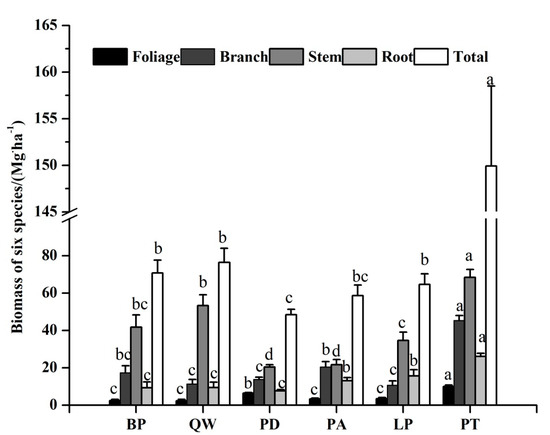
Figure 3.
Biomass of each tissue among six tree species. Different letters in a line mean significant difference among tree species at p = 0.05. Error bars are the standard error of the mean.
3.2. Nutrient Content
The C, N, and P concentrations were affected markedly among tissues across all species (Table 2 and Table S1). Except for Betula platyphylla and Larix principis-rupprechtii, the C concentration primarily ranked as foliage > branch > stem > root. The mean concentrations of C in foliage, branch, stem, and root across six species were 466.31, 467.42, 456.73, and 425.28 g·kg−1, respectively. Except for Populus davidiana, the N and P concentrations followed an order of foliage > branch > root > stem, ranging from 3.68 g·kg−1 (Populus davidiana, root) to 28.54 g·kg−1 (Quercus wutaishanica, foliage) for N concentration and from 0.26 g·kg−1 (Populus davidiana, root) to 2.32 g·kg−1 (Larix principis-rupprechtii, foliage for P concentration), respectively.
Table 2.
C, N, and P concentrations of each tissue among six tree species. Different letters in a line mean significant difference among tree species at p = 0.05. The WMCC is short for weighted mean carbon concentration, WMNC for weighted mean nitrogen concentration, WMPC for weighted mean phosphorus concentration, respectively.
For a given tissue, the nutrient concentration exhibited different variation tendencies among species. For example, the Pinus armandii had the highest C concentration in all tissues while the Quercus wutaishanica had the least C concentration in stems and roots. Yet, the Larix principis-rupprechtii and Populus davidiana had the least C concentration in foliage and branches, respectively. Furthermore, the WMCC, WMNC, and WMPC changed from 432.67 g·kg−1 (Quercus wutaishanica) to 481.43 g·kg−1 (Pinus armandii), 6.15 g·kg−1 (Populus davidiana) to 8.30 g·kg−1 for (Quercus wutaishanica), and 0.40 g·kg−1 for (Pinus tabulaeformis) to 0.74 g·kg−1 for (Larix principis-rupprechtii), respectively.
The mean stocks of C, N, and P across all the species overall followed the order of stem > branch > root > foliage, with remarkable difference of tree tissues across species (Figure 4). As for C stock, except for Pinus armandii and Larix principis-rupprechtii, the carbon stock of different tree tissues among the other four forest types showed the same trend as the mean stock. The tissue nitrogen stock of Populus davidiana ranked the order of foliage > branch > stem > root. The highest stem P stock was in Betula platyphylla (48.54 kg·ha−1), but lowest in Populus davidiana (2.02 kg·ha−1).
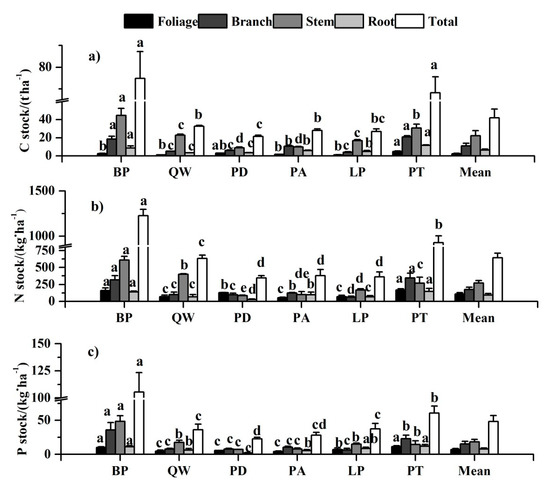
Figure 4.
Nutrient stocks of each tissue among six tree species. Different letters in a line mean significant difference among tree species at p = 0.05. Error bars are the standard error of the mean. (a), (b), and (c) were C stock, N stock, and P stock of each tissue among six tree species, respectively.
For a specific tissue, the nutrient stock varied significantly with species (Supplementary Table S1 and Figure 4). Pinus tabulaeformis had the greatest nutrient accumulation in foliage. Quercus wutaishanica had the least C stock while Pinus armandii had the least N and P stock in foliage. Pinus tabulaeformis had the greatest C and N accumulation and Betula platyphylla had the greatest P stock in branch, but Larix principis-rupprechtii had the least nutrient stock in branch. Populus davidiana had the least nutrient accumulation in stem and root, while Betula platyphylla had the greatest in stem, and Pinus tabulaeformis had the highest in root. As for the total plant, Betula platyphylla and Pinus tabulaeformis had higher nutrient stocks (including C, N, and P) than those in Larix principis-rupprechtii, Quercus wutaishanica, Pinus armandii, and Populus davidiana. Meanwhile, the mean values of C stock, N stock, and P stock for total plant among six tree species were 42.16 t·ha−1, 644.85 kg·ha−1, and 48.26 kg·ha−1, respectively.
3.3. Stoichiometry Variation Characteristics
The C:N, C:P, and N:P ratios varied significantly with tissues for six occurring species (Table 3). The C:N and C:P ratios overall ranked an order of stem > root > branch > foliage. The C:N and C:P ratios for foliage varied from 16.12 to 32.35 and from 202.22 to 423.05, respectively. The C:N and C:P ratios for stem ranged from 59.30 to 121.59 and from 925.40 to 2324.64, respectively. Nevertheless, the N:P ratio performed different variations across various tissues for six species, but ranging from 7.92 for stem (Larix principis-rupprechtii) to 22.18 for foliage (Populus davidiana).
Table 3.
C:N, C:P, and N:P of each tissue among six tree species. Different letters in a line mean significant difference among tree species at p = 0.05.
Additionally, the weighted mean values of the C:N and C:P ratios changed from 55.89 (Quercus wutaishanica) to 92.77 (Pinus tabulaeformis) and from 751.09 (Larix principis-rupprechtii) to 1585.84 (Pinus tabulaeformis), respectively. The weighed mean values of N:P exhibited a relatively narrow range from 9.11 to 18.44, ranking an order of Quercus wutaishanica > Pinus tabulaeformis > Pinus armandii > Populus davidiana > Betula platyphylla > Larix principis-rupprechtii. The mean values of weighted mean for C:N, C:P, and N:P among six tree species were 78.73, 1070.70, and 13.99, respectively.
4. Discussion
4.1. Biomass Estimation of Different Species
The allometric method was adopted to estimate the total and tissue weight of a tree [16], using the generalized regression equations between biomass and DBH. The scaling coefficient a and the scaling exponent b of allometric equations were generally known to vary from −3 to −1 [17] and from 2 to 3 [29], respectively. In our study, as for total biomass, only the Pinus tabulaeformis had the values of a and b within the range of previously reported results. The scaling exponent b was higher than 1, lower than those of occurring species in northeast China [13]. This may be due to the fact that various biotic factors (e.g., wood density, stand age) as well as abiotic factors (e.g., latitude, longitude) significantly affect the growth and development process, and thus caused the marked difference of parameters [9,30,31]. The scaling exponent b also indicated that the growth speed of tree tissues was faster than diameter at breast height.
The total biomass stock varied significantly with species in our study, declining gradually with the increasing of longitude and latitude [32]. Compared with the national average level of forest biomass [33], Pinus tabulaeformis, Betula platyphylla, Populus davidiana, and Pinus armandii had much higher biomass. The results of total biomass indicated that Pinus tabulaeformis, Betula platyphylla, and Populus davidiana might have high forestry production. Pinus tabulaeformis (149.95 ± 8.54 Mg·ha−1) in the semi-arid region was similar to the result of Zhao [34] and Zhou [35], who found that the biomass density of Pinus tabulaeformis was 146.05 Mg·ha−1. On the contrary, the total biomass of Larix principis-rupprechtii and Quercus wutaishanica in the semi-arid region was relatively lower than that of the national average level, possibly due to different abiotic and biotic factors.
The biomass partitioning differed significantly with species [36,37], following an overall order of stem > branch > root > foliage, consistent with the result of Peichl and Arain [14]. As the main part of the whole tree, the mean percentage of stem varied from 38.41% to 62.61% across species. The aim of analyzing the biomass allocation in our research was to estimate the weighted mean nutrient concentration and eliminate the intra-specific error of different tissues. Thus, we did not further study the impact factors of the biomass partitioning, e.g., stand age and DBH.
4.2. Nutrients Variation Characteristic Among Different Species
4.2.1. Effects of Species and Tissues on Nutrient Concentration at the Individual Tree Level
The distribution of nutrient concentration in the same plant varied with different nutrient elements and tissues [25]. The chemical composition of woody tissues observed in our study varied significantly with species and showed the declining trend of C > N > P [38], with coniferous species overall higher than broad-leaved species. For six species, the C concentration for each tissue was similar to that reported by several authors [20,26], following an order of: Foliage > branch > stem > root. The C concentration was lower than 50%, supporting our hypothesis. However, the N and P concentration tissue ranked the order of foliage > branch > root > stem, similar to the findings of Mo [39].
Many previous studies have been carried out to analyze foliar nutrient features because foliage could synthesize organic compounds through photosynthesis [40,41]. The mean foliage C (466.31 ± 20.23 g·kg−1) and P (1.65 ± 0.61 g·kg−1) concentration of six species in the semi-arid region on the Loess Plateau were close to the global mean C (461.6 ± 72.2 g·kg−1) and P (1.6 ± 1.1 g·kg−1) concentration [42], respectively, but lower than that for 102 dominant species along the North–South Transect of East China [43]. Nevertheless, the mean foliage N concentration (22.463 ± 5.409 g·kg−1) was higher than that of the mean level in East China (18.3 ± 5.0 g·kg−1) [43], the national level (20.2 ± 8.41 g·kg−1) [25], and the global mean level (20.1 ± 8.7 g·kg−1) [42].
Meanwhile, woody tissues or non-photosynthetic structures, including stems, branches, and coarse roots [44], accounted for the major biomass stock and net primary production in forest ecosystems. In fact, many studies have studied woody nutrient contents [38,45,46]. Except for Betula platyphylla and Pinus tabulaeformis, the C concentration of woody tissues was significantly affected by species and varied from 380.2 g·kg−1 in the roots of Quercus wutaishanica to 499.0 g·kg−1 in the stems of Pinus armandii, lower than the carbon content in eastern China [47]. The P concentrations of woody tissues were much less than that of foliage [28,45], with significant difference among six species. However, compared with foliage, the N concentration among woody tissues had no significant discrepancy and changed from 3.68 g·kg−1 of roots for Populus davidiana to 8.78 g·kg−1 of branches for Quercus wutaishanica, higher than that in southeastern Brazil [28].
Our study also showed that the weighted mean carbon concentration in the transition region between semi-arid and sub-humid areas on the Loess Plateau varied from 432.67 g·kg−1 for Quercus wutaishanica to 481.43 g·kg−1 for Pinus armandii, a narrower range than that for 10 species in northeastern China [20]. Yet, few measurements were made to study the weighted mean nitrogen or phosphorus concentration. In the semi-arid region on the Loess Plateau, the average values of the weighted mean nitrogen and phosphorus concentration were 6.90 g·kg−1 and 0.53 g·kg−1, respectively. Therefore, the weighted mean nutrient concentration could be used as the tree nutrient contents to reduce the difference of tissues.
4.2.2. Effects of Species and Tissues on Nutrient Stock at the Plot Level
The nutrient stock was significantly affected by different species and tissues (Figure 4), with carbon accumulation much higher than nitrogen and phosphorus. For six species, the nutrient stock showed various change trends among different tissues and overall followed the order of stem > branch > root > foliage, which differed from the variation characteristic of young trees [45].
As for foliage, the least carbon accumulation was usually observed in other studies dealing with nutrient allocation in various tree species because of the least biomass, varying from 1.09 Mg·ha−1 for Quercus wutaishanica to 4.80 Mg·ha−1 for Pinus tabulaeformis. The nitrogen and phosphorous stock of foliage in our study were 107.54 ± 26.60 kg·ha−1 and 7.16 ± 1.21 kg·ha−1, respectively, which were both much higher than that for Gmelina arborea in central India [48] and three species in the dry tropics of Cameroon due to young age class [45].
Although with low nutrient concentration, the woody tissues prevailed over the total nutrient stock, owing to large biomass. Because stem occupied most of the total plant biomass [38,46], the nutrient contents of stem were generally higher than that of other tissues, especially for carbon accumulation [49,50]. Except for the stem carbon stock, the nitrogen and phosphorus stock of woody tissues were significantly affected with tissues across various species, owing to different nutrient concentration and biomass [51]. Meanwhile, the least and most stock of carbon, nitrogen, and phosphorus were both in root of Populus davidiana and stem of Betula platyphylla, respectively.
The average values for carbon,nitrogen, and phosphorus stocks of total tissues were 42.16 ± 11.89 t·ha−1, 644.85 ± 158.59 kg·ha−1, and 48.26 ± 8.61 kg·ha−1, respectively, greater than nutrient stocks for trees in a young plantation [45,48]. As expected, the total nutrient stock was variable among species [28,52]. For six dominant species in the semi-arid and sub-humid area, the carbon and nutrient stocks for total tissues both ranked the order of Betula platyphylla > Pinus tabulaeformis > Quercus wutaishanica > Larix principis-rupprechtii > Populus davidiana > Populus davidiana. The results indicated that Betula platyphylla and Pinus tabulaeformis had high capacity to fix carbon and nutrient, which could be widely planted to increase the ecological functions of forest ecosystem.
4.3. Stoichiometry Characteristics among Different Species
As expected, the C:N and C:P ratios were related with the plant growth rate [46,53]. N:P, affected by abiotic factors and biotic factors, is a useful indictor to reflect nutrient limitations [54]. Our findings support the idea of C:P ratio over C:N and N:P ratios, with significant difference among various tissues and species [55]. The C:N and C:P ratios overall ranked an order of stem > root > branch > foliage while N:P did not show a similar pattern among different species [46].
Compared to plants in Beijing and its periphery of the humid area [22], the foliage with relatively higher C:N and C:P ratios in the semi-arid area on the Loess Plateau changed obviously. The results favored the current notion that C:N and C:P ratios increase with warming and drought in warm-dry and temperate-dry terrestrial ecosystems because of an increase in nutrient use efficiency or an increase in resistance to drought [24]. The ranges of C:N and C:P ratios among six species were lower than those for the dominant species in the North–South Transect of East China [43] and the global mean level [56]. Moreover, the mean N:P ratio (15.200) was lower than national value (18.0) [25], but greater than that for East China (11.5) and the global level (13.8) [43,56], which suggested that N and P together limited the plants growth [57].
Our research differed from previous analysis of terrestrial plants’ C:N:P ratio variation because we further illustrated the characteristics of various woody tissues. Because of woody tissues with lower N and P concentration when compared to foliage, woody tissues overall displayed higher C:N and C:P than that for foliage, with stem having the greatest value for Pinus tabulaeformis. Besides, the mean values of C:P and N:P ratios for root among dominant species were relatively lower while C:N ratio was higher, compared to the plant fine-root at a global scale [58]. Due to the difficulty of measuring root biomass and distinguishing live root, relatively few findings were carried out to analyze the underground biomass and ecological properties [59]. Currently, it is less clear on stoichiometric characteristics of a total individual tree at a large scale. Our study tried to calculate the total C:N, C:P, and N:P ratios in the transition area between the semi-arid region on the Loess Plateau using the weighted mean method. The C:N and C:P ratios in the conifer trees were overall higher than the broad-leaved trees. According to the former analysis of the woody tissues’ N concentration < 20 g·kg−1 and P concentration < 1 g·kg−1 [60], the N:P ratios of Pinus armandii and Pinus tabulaeformis >16 indicated P limitation. Nevertheless, other species were limited by N element. The possible reason might be that different tree species have different demand and absorption capacity for nitrogen and phosphorus.
5. Conclusions
The study provided a comprehensive evaluation of intra- and interspecific variations in biomass, nutrient content, and stoichiometric characteristics across various tissues among dominant tree species in the semi-arid region on the Loess Plateau. Pinus tabulaeformis, Betula platyphylla, Populus davidiana, and Pinus armandii had much higher biomass than those of the national average level, while Larix principis-rupprechtii and Quercus wutaishanica had a little lower biomass than that of the national average level, overall following an order of stem > branch > root > foliage. The nutrient concentrations of foliage and branch were higher than those of stems and roots, thus the weighted mean concentration can reduce the differences of various tissues. The total nutrient stock varied with species. The total carbon and nutrient stock both ranked the order of Betula platyphylla > Pinus tabulaeformis > Quercus wutaishanica > Larix principis-rupprechtii > Populus davidiana > Populus davidiana. Meanwhile, the C:N and C:P ratios overall ranked an order of stem > root > branch > foliage while N:P did not show a similar pattern among different species. Therefore, we conclude that the weighted mean method could be used to try to analyze the nutrient concentration for the whole plant. Betula platyphylla and Pinus tabulaeformis, having high nutrient accumulation, can effectively increase nutrient fixation capacity in the transition region between semi-humid and semi-arid. N or P limitation varied with species and tissues in the semi-arid region on the Loess Plateau.
Supplementary Materials
The following are available online at https://www.mdpi.com/2071-1050/12/1/339/s1. Table S1: Analysis of variance results for all the variables.
Author Contributions
Conceptualization, G.J.; methodology, T.H.; investigation, G.J. and J.L.; resources, J.C.; writing, original draft preparation, G.J.; writing, review and editing, G.J. and T.H.; supervision, W.L.; funding acquisition, W.L. All authors have read and agreed to the published version of the manuscript.
Funding
This research was funded by “National Natural Science Foundation of China (Grant number: 41601586” and “National Key Research Program of China (Grant number: 2016YFC0500700)”.
Acknowledgments
We are grateful for editor and anonymous reviewers for their constructive comments and suggestions. We also thank Wang (from University of California, Irvine) for improving the English language.
Conflicts of Interest
The authors declare no conflict of interest.
References
- Yansui, L.; Xiaoping, Z.; Xianwen, L.; Gao, J. Mechanism and regulation of land degradation in Yulin district. J. Geogr. Sci. 2003, 13, 217–224. [Google Scholar] [CrossRef]
- Yuan, Z.Q.; Yu, K.L.; Wang, B.X.; Zhang, W.Y.; Zhang, X.L.; Siddique, K.H.; Stefanova, K.; Turner, N.C.; Li, F.M. Cutting improves the productivity of lucerne-rich stands used in the revegetation of degraded arable land in a semi-arid environment. Sci. Rep. 2015, 5, 12130. [Google Scholar] [CrossRef] [PubMed]
- Yuan, Z.Q.; Yu, K.L.; Epstein, H.; Fang, C.; Li, J.T.; Liu, Q.Q.; Liu, X.W.; Gao, W.J.; Li, F.M. Effects of legume species introduction on vegetation and soil nutrient development on abandoned croplands in a semi-arid environment on the Loess Plateau, China. Sci. Total Environ. 2016, 541, 692–700. [Google Scholar] [CrossRef] [PubMed]
- Fu, G.; Uchida, E.; Shah, M.; Deng, X. Impact of the Grain for Green program on forest cover in China. J. Environ. Econ. Policy 2019, 8, 231–249. [Google Scholar] [CrossRef]
- Wang, Y.; Feng, Q.; Chen, L.; Yu, T. Significance and effect of ecological rehabilitation project in inland river basins in northwest China. Environ. Manag. 2013, 52, 209–220. [Google Scholar] [CrossRef] [PubMed]
- Lü, Y.; Fu, B.; Feng, X.; Zeng, Y.; Liu, Y.; Chang, R.; Sun, G.; Wu, B. A policy-driven large scale ecological restoration: Quantifying ecosystem services changes in the Loess Plateau of China. PLoS ONE 2012, 7, e31782. [Google Scholar] [CrossRef]
- Nowak, D.J.; Greenfield, E.J.; Hoehn, R.E.; Lapoint, E. Carbon storage and sequestration by trees in urban and community areas of the United States. Environ. Pollut. 2013, 178, 229–236. [Google Scholar] [CrossRef]
- Reich, P.B.; Tjoelker, M.G.; Machado, J.L.; Oleksyn, J. Universal scaling of respiratory metabolism, size and nitrogen in plants. Nature 2006, 439, 457–461. [Google Scholar] [CrossRef]
- Dai, L.; Jia, J.; Yu, D.; Lewis, B.J.; Zhou, L.; Zhou, W.; Zhao, W.; Jiang, L. Effects of climate change on biomass carbon sequestration in old-growth forest ecosystems on Changbai Mountain in Northeast China. For. Ecol. Manag. 2013, 300, 106–116. [Google Scholar] [CrossRef]
- Venterink, H.O.; Güsewell, S. Competitive interactions between two meadow grasses under nitrogen and phosphorus limitation. Funct. Ecol. 2010, 24, 877–886. [Google Scholar] [CrossRef]
- Zhang, W.; Liu, W.; Xu, M.; Deng, J.; Han, X.; Yang, G.; Feng, Y.; Ren, G. Response of forest growth to C: N: P stoichiometry in plants and soils during Robinia pseudoacacia afforestation on the Loess Plateau, China. Geoderma 2019, 337, 280–289. [Google Scholar] [CrossRef]
- McClaran, M.; McMurtry, C.; Archer, S. A tool for estimating impacts of woody encroachment in arid grasslands: Allometric equations for biomass, carbon and nitrogen content in Prosopis velutina. J. Arid Environ. 2013, 88, 39–42. [Google Scholar] [CrossRef]
- Wang, C. Biomass allometric equations for 10 co-occurring tree species in Chinese temperate forests. For. Ecol. Manag. 2006, 222, 9–16. [Google Scholar] [CrossRef]
- Peichl, M.; Arain, M.A. Allometry and partitioning of above-and belowground tree biomass in an age-sequence of white pine forests. For. Ecol. Manag. 2007, 253, 68–80. [Google Scholar] [CrossRef]
- Návar, J. Biomass component equations for Latin American species and groups of species. Ann. For. Sci. 2009, 66, 1–21. [Google Scholar] [CrossRef]
- Komiyama, A.; Ong, J.E.; Poungparn, S. Allometry, biomass, and productivity of mangrove forests: A review. Aquat. Bot. 2008, 89, 128–137. [Google Scholar] [CrossRef]
- Zapata-Cuartas, M.; Sierra, C.A.; Alleman, L. Probability distribution of allometric coefficients and Bayesian estimation of aboveground tree biomass. For. Ecol. Manag. 2012, 277, 173–179. [Google Scholar] [CrossRef]
- Manlay, R.J.; Kairé, M.; Masse, D.; Chotte, J.L.; Ciornei, G.; Floret, C. Carbon, nitrogen and phosphorus allocation in agro-ecosystems of a West African savanna: I. The plant component under semi-permanent cultivation. Agric. Ecosyst. Environ. 2002, 88, 215–232. [Google Scholar] [CrossRef]
- Zhang, H.; Shi, L.; Wen, D.; Yu, K. Soil potential labile but not occluded phosphorus forms increase with forest succession. Biol. Fertil. Soils 2016, 52, 41–51. [Google Scholar] [CrossRef]
- Zhang, Q.; Wang, C.; Wang, X.; Quan, X. Carbon concentration variability of 10 Chinese temperate tree species. For. Ecol. Manag. 2009, 258, 722–727. [Google Scholar] [CrossRef]
- Bert, D.; Danjon, F. Carbon concentration variations in the roots, stem and crown of mature Pinus pinaster (Ait.). For. Ecol. Manag. 2006, 222, 279–295. [Google Scholar] [CrossRef]
- Han, W.X.; Wu, Y.; Tang, L.Y.; Chen, Y.H.; Li, L.P.; He, J.S.; Fang, J.Y. Leaf carbon, nitrogen and phosphorus stoichiometry across plant species in Beijing and its periphery. Acta Sci. Nat. Univ. Pekin. 2009, 45, 855–860. [Google Scholar]
- Santiago, L.S.; Kitajima, K.; Wright, S.J.; Mulkey, S.S. Coordinated changes in photosynthesis, water relations and leaf nutritional traits of canopy trees along a precipitation gradient in lowland tropical forest. Oecologia 2004, 139, 495–502. [Google Scholar] [CrossRef] [PubMed]
- Sardans, J.; Rivas-Ubach, A.; Peñuelas, J. The C: N: P stoichiometry of organisms and ecosystems in a changing world: A review and perspectives. Perspect. Plant Ecol. Evol. Syst. 2012, 14, 33–47. [Google Scholar] [CrossRef]
- Han, W.; Fang, J.; Guo, D.; Zhang, Y. Leaf nitrogen and phosphorus stoichiometry across 753 terrestrial plant species in China. New Phytol. 2005, 168, 377–385. [Google Scholar] [CrossRef]
- Fonseca, W.; Benayas, J.M.R.; Alice, F.E. Carbon accumulation in the biomass and soil of different aged secondary forests in the humid tropics of Costa Rica. For. Ecol. Manag. 2011, 262, 1400–1408. [Google Scholar] [CrossRef]
- Nogueira, E.M.; Fearnside, P.M.; Nelson, B.W.; Barbosa, R.I.; Keizer, E.W. Estimates of forest biomass in the Brazilian Amazon: New allometric equations and adjustments to biomass from wood-volume inventories. For. Ecol. Manag. 2008, 256, 1853–1867. [Google Scholar] [CrossRef]
- Harrison, R.B.; Reis, G.G.; Reis, M.D.; Bernardo, A.L.; Firme, D.J. Effect of spacing and age on nitrogen and phosphorus distribution in biomass of Eucalyptus camaldulensis, Eucalyptus pellita and Eucalyptus urophylla plantations in southeastern Brazil. For. Ecol. Manag. 2000, 133, 167–177. [Google Scholar] [CrossRef]
- Zianis, D.; Mencuccini, M. On simplifying allometric analyses of forest biomass. For. Ecol. Manag. 2004, 187, 311–332. [Google Scholar] [CrossRef]
- Weiner, J. Allocation, plasticity and allometry in plants. Perspect. Plant Ecol. Evol. Syst. 2004, 6, 207–215. [Google Scholar] [CrossRef]
- Verónica, G.; Luis, P.P.; Gerardo, R. Allometric relations for biomass partitioning of Nothofagus antarctica trees of different crown classes over a site quality gradient. For. Ecol. Manag. 2010, 259, 1118–1126. [Google Scholar]
- Luo, T. Patterns of Net Primary Productivity for Chinese Major Forest Types and Their Mathematical Models; Chinese Academy of Sciences: Beijing, China, 1996. [Google Scholar]
- Fang, J.-Y.; Wang, Z.M. Forest biomass estimation at regional and global levels, with special reference to China’s forest biomass. Ecol. Res. 2001, 16, 587–592. [Google Scholar] [CrossRef]
- Zhao, M.; Zhou, G.-S. Estimation of biomass and net primary productivity of major planted forests in China based on forest inventory data. For. Ecol. Manag. 2005, 207, 295–313. [Google Scholar] [CrossRef]
- Zhou, G.; Wang, Y.; Jiang, Y.; Yang, Z. Estimating biomass and net primary production from forest inventory data: A case study of China’s Larix forests. For. Ecol. Manag. 2002, 169, 149–157. [Google Scholar] [CrossRef]
- Liu, Y.; Wang, Y.; Yu, P.; Xiong, W.; Mo, F.; Wang, Z. Biomass and its allocation of the main vegetation types in Liupan Mountains. For. Res. Beijing 2011, 24, 443–452. [Google Scholar]
- Konôpka, B.; Pajtík, J.; Moravčík, M.; Lukac, M. Biomass partitioning and growth efficiency in four naturally regenerated forest tree species. Basic Appl. Ecol. 2010, 11, 234–243. [Google Scholar] [CrossRef]
- André, F.; Jonard, M.; Ponette, Q. Biomass and nutrient content of sessile oak (Quercus petraea (Matt.) Liebl.) and beech (Fagus sylvatica L.) stem and branches in a mixed stand in southern Belgium. Sci. Total Environ. 2010, 408, 2285–2294. [Google Scholar]
- Mo, J.; Zhang, D.; Huang, Z.; Yu, Q.; Kong, G. Distribution pattern of nutrient elements in plants of Dinghushan lower subtropical evergreen broad-leaved forest. J. Trop. Subtrop. Bot. 2000, 8, 198–206. [Google Scholar]
- Thompson, K.E.; Parkinson, J.A.; Band, S.R.; Spencer, R.E. A comparative study of leaf nutrient concentrations in a regional herbaceous flora. New Phytol. 1997, 136, 679–689. [Google Scholar] [CrossRef]
- He, J.S.; Fang, J.; Wang, Z.; Guo, D.; Flynn, D.F.; Geng, Z. Stoichiometry and large-scale patterns of leaf carbon and nitrogen in the grassland biomes of China. Oecologia 2006, 149, 115–122. [Google Scholar] [CrossRef]
- Reich, P.B.; Oleksyn, J. Global patterns of plant leaf N and P in relation to temperature and latitude. Proc. Natl. Acad. Sci. USA 2004, 101, 11001–11006. [Google Scholar] [CrossRef] [PubMed]
- Ren, S.J.; Yu, G.R.; Jiang, C.M.; Fang, H.J.; Sun, X.M. Stoichiometric characteristics of leaf carbon, nitrogen, and phosphorus of 102 dominant species in forest ecosystems along the North-South Transect of East China. Yingyong Shengtai Xuebao 2012, 23, 581–586. [Google Scholar] [PubMed]
- Ryan, M.G.; Hubbard, R.M.; Pongracic, S.; Raison, R.J.; McMurtrie, R.E. Foliage, fine-root, woody-tissue and stand respiration in Pinus radiata in relation to nitrogen status. Tree Physiol. 1996, 16, 333–343. [Google Scholar] [CrossRef] [PubMed]
- Harmand, J.M.; Njiti, C.F.; Bernhard-Reversat, F.; Puig, H. Aboveground and belowground biomass, productivity and nutrient accumulation in tree improved fallows in the dry tropics of Cameroon. For. Ecol. Manag. 2004, 188, 249–265. [Google Scholar] [CrossRef]
- Agren, G.I. The C: N: P stoichiometry of autotrophs–theory and observations. Ecol. Lett. 2004, 7, 185–191. [Google Scholar] [CrossRef]
- Thomas, S.; Malczewski, G. Wood carbon content of tree species in Eastern China: Interspecific variability and the importance of the volatile fraction. J. Environ. Manag. 2007, 85, 659–662. [Google Scholar] [CrossRef]
- Swamy, S.; Kushwaha, S.; Puri, S. Tree growth, biomass, allometry and nutrient distribution in Gmelina arborea stands grown in red lateritic soils of Central India. Biomass Bioenergy 2004, 26, 305–317. [Google Scholar] [CrossRef]
- Litton, C.M.; Raich, J.W.; Ryan, M.G. Carbon allocation in forest ecosystems. Glob. Chang. Biol. 2007, 13, 2089–2109. [Google Scholar] [CrossRef]
- Matsuzaki, E.; Sanborn, P.; Fredeen, A.L.; Shaw, C.H.; Hawkins, C. Carbon stocks in managed and unmanaged old-growth western redcedar and western hemlock stands of Canada’s inland temperate rainforests. For. Ecol. Manag. 2013, 297, 108–119. [Google Scholar] [CrossRef]
- Shin, M.Y.; Miah, M.D.; Lee, K.H. Potential contribution of the forestry sector in Bangladesh to carbon sequestration. J. Environ. Manag. 2007, 82, 260–276. [Google Scholar] [CrossRef]
- Wang, H.; Huang, Y.; Wang, S.; Zou, D. Carbon and nitrogen storage under different forest ecosystems in mid-subtropical regions. Zhongguo Shengtai Nongye Xuebao 2010, 18, 576–580. [Google Scholar] [CrossRef]
- Niklas, K.J.; Owens, T.; Reich, P.B.; Cobb, E.D. Nitrogen/phosphorus leaf stoichiometry and the scaling of plant growth. Ecol. Lett. 2005, 8, 636–642. [Google Scholar] [CrossRef]
- Güsewell, S. N:P ratios in terrestrial plants: Variation and functional significance. New Phytol. 2004, 164, 243–266. [Google Scholar] [CrossRef]
- Hättenschwiler, S.; Aeschlimann, B.; Coûteaux, M.M.; Roy, J.; Bonal, D. High variation in foliage and leaf litter chemistry among 45 tree species of a neotropical rainforest community. New Phytol. 2008, 179, 165–175. [Google Scholar] [CrossRef]
- Elser, J.J.; Fagan, W.F.; Denno, R.F.; Dobberfuhl, D.R.; Folarin, A.; Huberty, A.; Interlandi, S.; Kilham, S.S.; McCauley, E.; Schulz, K.L.; et al. Nutritional constraints in terrestrial and freshwater food webs. Nature 2000, 408, 578–580. [Google Scholar] [CrossRef]
- Koerselman, W.; Meuleman, A.F. The vegetation N:P ratio: A new tool to detect the nature of nutrient limitation. J. Appl. Ecol. 1996, 33, 1441–1450. [Google Scholar] [CrossRef]
- Yuan, Z.; Chen, H.Y.; Reich, P.B. Global-scale latitudinal patterns of plant fine-root nitrogen and phosphorus. Nat. Commun. 2011, 2, 344. [Google Scholar] [CrossRef]
- Liu, C.; Wang, Y.; Wang, N.; Wang, G. Advances research in plant nitrogen, phosphorus and their stoichiometry in terrestrial ecosystems: A review. Chin. J. Plant Ecol. 2012, 36, 1205–1216. [Google Scholar] [CrossRef]
- Wu, T.G.; Yu, M.K.; Wang, G.G.; Dong, Y.; Cheng, X.R. Leaf nitrogen and phosphorus stoichiometry across forty-two woody species in Southeast. China Biochem. Syst. Ecol. 2012, 44, 255–263. [Google Scholar] [CrossRef]


© 2020 by the authors. Licensee MDPI, Basel, Switzerland. This article is an open access article distributed under the terms and conditions of the Creative Commons Attribution (CC BY) license (http://creativecommons.org/licenses/by/4.0/).