Article

Impact Quantification of Decentralization in Urban Growth by Extracting Impervious Surfaces Using ISEI in Model Maker

by
Nana Yaw Danquah Twumasi
1,2,*,
Chikondi Chisenga
1,3,
Nayyer Saleem
1,
Neema Nicodemus Lyimo
1 and
Orhan Altan
4
1
State Key Laboratory of Information Engineering in Surveying, Mapping and Remote Sensing, Wuhan University, 129 Luoyu Road, Wuhan 430079, China
2
Civil Engineering Department, Wa Polytechnic, Box 553, Wa, Upper West Region, Ghana
3
Department of Earth Sciences, Ndata School of Climate and Earth Sciences, Malawi University of Science and Technology, Box 5196, Limbe, Malawi
4
Department of Geomatics, Istanbul Technical University, Istanbul 36626, Turkey
*
Author to whom correspondence should be addressed.
Sustainability 2020, 12(1), 380; https://doi.org/10.3390/su12010380
Submission received: 29 November 2019 / Revised: 23 December 2019 / Accepted: 30 December 2019 / Published: 3 January 2020

Abstract

:
Decentralization problems in Africa have caused some infrastructure disparity between country capitals and distant districts. In Ghana, less public investment has created a gap between implementation results and theoretical benefits. Spectral indices are a good approach to extracting impervious surfaces, which is a good method of measuring urbanization. These are restricted by complexity, sensor limitation, threshold values, and high computational time. In this study, we measure the urbanization dynamics of Wa District in Ghana by applying a proposed method of impervious surface extraction index (ISEI), to evaluate the decentralization policy using Landsat images from 1984–2018 and a single S2A data. Comparing our proposed method with five other existing indexes, ISEI provided good discriminated results between target feature and background, with pixel values ranging between 0 and +1. Other indexes produced negative values. ISEI accuracy varied from 84.62–94.00% while existing indexes varied from 73.85–90.00%. Our results also showed increased impervious surface areas of 83.26 km2, which is about 7.72% of total area while the average annual urban growth was recorded as 4.42%. These figures proved that the quantification of decentralization is very positive. The study provides a foundation for urban environment research in the context of decentralization policy.

1. Introduction

Detailed acquisition of global and synoptic information about the Earth and its environment is possible now with Earth-orbiting satellite sensors. These satellite sensors provide a platform for assessing, evaluating, and determining features of spatial phenomena for effective urban planning, expansion, and monitoring studies [1,2,3]. Digital image processing of remote sensing images can now be used to improve image visual quality. It can selectively enhance and highlight particular features, classify, identify, extract spectral, and spatial patterns representing different phenomena [4]. Applications are now in greater aspects of environmental studies such as population trends, urbanization and its associated dynamics, and other environmental related fields. With over four decades of data collection and information, physical environmental processes are now easily monitored using the repetitive coverage capability of satellites. Seasonal, annual, and longer-term observation such as urbanization and urban growth [5], urban expansion and urban sprawl [6,7], can also possibly be monitored. These phenomena are driven by the rising percentage of the urban population of which it is estimated that the world’s urban population will be 2.5 billion by 2050, with almost 90% of this growth occurring in Asia and Africa [8]. Impermeable surfaces, such as concrete, roads, buildings, asphalts, walkways, sidewalks are also called impervious surfaces [9], which is a characteristic of urbanization and modernization. To understand the impact of urbanization, different methods have been expansively studied by [10,11,12,13,14], who further developed a system for retrieving annual and long-term fields of impervious surface cover of urban growth [15]. Previous studies have also developed various ISEI for urban mapping and monitoring studies [16,17], rate of urbanization, urban growth and expansion [18,19,20], and recently applied to megacities [21]. The idea is to develop a very good extraction method that work in a particular area with different conditions and environmental factors. Normalized difference impervious surface index was modified [12] by fusing night-time light luminosity, land surface temperature, and multispectral reflectance to produce a better result. Another fusion involved synthetic aperture radar (SAR) and optical data at the decision level [22] yielded better accuracies.
As a phenomenon, imperviousness has also been used to study the economic transitions for cities [23], in which land-use and land-cover change signify the eco-environmental restoration planning that respond to formulated policies. Despite the effectiveness of the impervious extraction method, the relative accuracy of an extraction index depends on the complexity of the image used (very high or medium resolution), the expertise of the user and the kind of index adopted or developed. Researchers of urbanization in developing countries such as [24,25] have argued that the disparity of infrastructure development between the capitals of countries and the less urbanized distant districts can be addressed by decentralization. However, in developing countries such as Ghana, there is a gap between the theoretical benefits and the actual implementation yields of decentralization, mostly due to less public investment [26]. Decentralization is a reform that is aggressively embarked on by developing countries, which seeks to transfer power and resources to sub-national government bodies [27]. However, such expectations have not been realized over the decades in most countries because revenue collected at the local districts is insufficient for self-postulated infrastructure development [24,25,28,29]. On the other hand, others have advocated for more of such decentralization [29,30], resulting in the creation of smaller administrative boundaries. These come with rapid population growth associated with important environmental, infrastructural and social impacts [31,32]. This rapid urbanization brings about dramatic expansion of impervious surface areas [33].
In Ghana, a hybrid of the various aspects of decentralization [24] is practiced, where there is a transfer of administrative and fiscal responsibilities from the nation’s capital [29], to the district and municipal capitals. Mapping this expansion is important for monitoring and understanding physical changes in land development [34]. In January 2019, 6 new regions were created to bring the total number of regions in Ghana to 16. In this paper, impervious surface extraction is used to quantify the urban development in assessing the impact of the decentralization in Ghana. The study quantifies the impact by extracting the built-up (impervious surface) areas in the newest created regional capital, until January 2019, Wa District of the Upper West Region. It measures the growth and coverage of imperviousness to examine the spatial evidence of physical infrastructure development (growth expansion of infrastructure). Nevertheless, Ghana is in a semi-arid region with different environmental conditions. This makes it difficult to use the existing indexes for the study. As such, we develop an impervious surface extraction index (ISEI) that can be applied in Ghana or similar environment to achieve the objectives of this study. We also compared the developed index with five impervious surface areas (ISA) indexes, which are discussed in Section 2, to ascertain the extraction capability of the new index and its accuracy in relation to the others within the spectral signatures.

2. Review of Five Existing Comparable Impervious Surface Areas (ISA) Indexes

In this section, we give a brief background of comparable existing ISA indices, whose results will be compared with the proposed method in the subsequent sections. Indices are a form of an algorithm that combine different spectral bands of an image to highlight a feature of interest in the data. Furthermore, these indices are place-specific, as different environmental factors influence the attained results. The five existing indices (Equations (1)–(5)) that will be compared to the proposed index are the Urban Index (UI), Normalized Difference Built-up Index (NDBI), Enhanced Bareness, Built-up Index (EBBI), Normalized Built-up Area Index (NBAI), and New Build-up Index NBI. These five indices are ideal in the comparison, mainly because they focus on analyzing the urban expansion or growth within a city. Every band in a multispectral satellite image is spectrally biased towards a specific feature within the environment or a group of features usually with similar spectral properties. Notwithstanding, spectral reflectance may represent the combination of several land class as mixed pixel or impure pixel [35]. These spectral properties are enhanced when two or more bands are mathematically manipulated. An extraction index is a ratio between the strongest or maximum reflectance band to the weakest or minimum reflectance band, for a specific feature or genre cluster of features. Indexes basically, combine bands to extract specific land cover. The performance of these indices depends greatly on the spectral response of these features as espoused by [36]. However, climate and topographical differences influence the performance of these indexes on urban features.
Urbanization is mainly characterized by increase in imperviousness. Within the peri-urban and rural settings, especially of Sub-Saharan Africa, impervious surfaces might only be roads and building (rooftops). It is, therefore, important to consider the imperviousness in the context of a typical urban area of residential, industrial, commercial service centers, parking lots, and transportation, bus terminals, airports, which mainly is made up of rooftops, asphalt, and concrete. Therefore, comparison of the proposed index is made to the indices that consider the urban mix (urban indexes) instead of those that deal with “only impervious surfaces”. Furthermore, these indexes are known to have been used in different climate and topography but rarely in the semi-arid environment of Africa. In addition, the intended application of the proposed index to four sensors necessitated the consideration of indexes that make use of bands common to the applicable sensors and not affected by economic constraints.
Generally, spectral indices take advantage of the unique spectral response of built-up areas and other land covers through arithmetic manipulation. In recent years, Sun, Z. et al. [37] developed an index for impervious extraction that combined and altered some existing indices by using the brightness temperature of the thermal band. This index gave better results compared to the unaltered indices [38]. The first of the indexes, called UI, which is described by Equation (1), is not ideal because it is difficult to separate the urban from the soil due to high reflectance in the same short wavelength for both soil and urban [39]. The second one, called the NDBI, shown in Equation (2), can serve as a worthwhile alternative for quickly and objectively mapping built-up areas [40]. However, the index is unable to distinguish properly between urban and bare land area [41]. The third index (Equation (3)) was developed through a combination of all the three features in the development [38]. A root function is then applied to cluster the numbers that contrast identical objects based on the different levels of reflectance values. These were multiplied by a factor of 10. Waqar et al. [36] identified unique patterns in bare soil and built-up area spectral signatures, combining bands with almost similar reflectance with minute differences, to develop new indices (NBAI), as shown in Equation (4). The NBAI (Equation (4)) was then improved to become NBI, as shown in Equation (5). The improvement was in such a way that it provides features that can better discriminate barren lands from residential lands [42].
Urban Index = UI = [(((Bswir1 − Bnir)/(Bswir1 + Bnir)) + 1) × 100],
Normalized Difference Built-up Index = NDBI = (Bswir1 − Bnir)/(Bswir1 + Bnir),
Enhanced Bareness, Built-up Index = EBBI = (Bswir1 − Bnir)/[10 × √(Bswir1 + Bnir)],
Normalized Built-up Area Index = NBAI = [Bswir2 − (Bswir1/Bgreen)]/[Bswir2 + (Bswir1/Bgreen)],
New Built-up Index = NBI = (Bred + Bswir1)/Bnir,
A few limitations exist in other indices, which has also enabled us to develop an index that suits our study environment. For instance, high heterogeneous terrains in EBBI are still problematic when subdividing urban areas. Secondly, EBBI is limited in distinguishing between homogeneous bare land and heterogeneous bare land mixed in urban areas with high temperature radiations. For most of the indexes described, the application is only possible after bare soil and water bodies have been masked, which is also very challenging [38,43]. These indexes from time to time use complex computational formulas in cases where better results were achieved. Also, the application of some are limited to only a few sensors, in that the whole array of Landsat sensors cannot be used when a historical analysis study of a phenomenon is to be investigated. As the spectral response of land-cover features varies from region to region due to topographic and climatic changes, so are their spectral curves. Indexes developed for one area is rarely effective when applied to another area.

3. Materials and Methods

3.1. Study Area

The study was applied to the Wa District that falls within latitudes 9°32′ N to 10°20′ N and longitudes 1°40′ W to 2°45′ W [44], as shown in Figure 1. It covers an area of approximately 1078 km2, representing about 19.74% of the region [45]. In pursuant of the decentralization policy, Wa Municipal was carved of the Wa District in 2004. However, the new municipal status was attained due to the increase in population, thus the study focuses on the Wa District status instead of the municipal. The climate of Wa is made up of long dry season and short raining season. The dry season records temperatures between 40–45 °C and annual mean temperature of about 27–28 °C. The total annual rainfall ranges from 910 to 2000 mm with an annual mean rainfall of 1027 mm and an annual average relative humidity of 59.3% [44,46]. The dry season is normally from November to April while the remaining months experience the raining season with its peak in August and October.

3.2. Datasets

This study used Landsat; Thematic Mapper 5 (Landsat TM 5) Enhanced Thematic Mapper Plus (Landsat ETM+) and Operational Land Imager (Landsat OLI) for the period 1984–2018 and a single 2018 Sentinel 2A (1C) multispectral images, all downloaded from the United States Geological Survey (USGS) website (Table 1: http://earthexplorer.usgs.gov), to map the impervious surfaces in Wa District. We also used these four sensors to test the robustness and flexibility of the proposed index. The multispectral imagery is important as different bands can visually distinguish features of interest. For instance, false-color imagery is good for detecting pervious/impervious features. Infrared (IR) is mostly useful in detecting and extracting vegetation while Red band is useful for discriminating bare soil. Blue is useful for discriminating urban features. Bands 11 and 12 of Sentinel 2 were rescaled to 10 m to conform to the other bands of the image.
The satellite images were subjected to atmospheric correction and radiometric correction to maintain spectral indices variables loyalty with magnitudes of brightness values [47]. The images were for the month of August to December with very little to no clouds. As such, it was not necessary to remove clouds and cloud cover. Then, we clipped the Wa District from the images using the boundary shapefiles of the city, by applying an area of interest (AOI) algorithm in ERDAS software. As shown in Figure 2, the images were converted from digital numbers (DN) to top of atmosphere (TOA) reflectance. We then stacked the bands of the images to serve as input for the proposed index creation in the model maker of ERDAS.

3.3. Proposed Index—Impervious Surface Extraction Index (ISEI)

The stacked TOA images were used in the model maker to create the proposed index. The accuracy for index was conducted using digitized Google Earth data, which gives a real-time historical imagery of spatial features. The use of point samples as training data or validation data is only very effective if the points were/are picked for the respective year for which the classification is being done. The model maker facility in ERDAS enables the representation, in a simplified form, aspects of the computational mathematics and provides real-time feedback of the index manipulation results. The main advantage here is the capacity and ability to create self-contained functions that can be used later. The development of the proposed ISEI, as indicated in Equation (6), is based on mathematical consideration and manipulations of five bands. Three different Landsat sensors and a Sentinel sensor were used to test the new index. Processed images were subjected to five established impervious surface (built-up, considering man-made structures) extraction indices whose accuracies were used as a comparison case for the new index. The proposed new index is aimed at its suitability to be applied to four sensors thus it is developed based on the six common bands of the four Landsat sensors using band math algebra manipulations of the bands. For robustness and effectiveness, it has been tried with different sensors. This same explanation has been adduced by [36]. Also, these images stretch between 1984–2018, thus testing the atmospheric and climatic influence on the quality of images obtained.
ISEI = (Bred × Bblue)/[(Bnir/Bswir1) + (Bnir/Bswir2)],
Man-made objects reflect highly in the SWIR spectrum. On the other hand, it is noted for its significant absorption by water, water vapor, and CO2. Unlike the visible spectrum, not all sunlight passes through the atmosphere due to the bands of absorption, especially water vapor around 0.938 µm, 1.13 µm, 1.38 µm, 1.88 µm and 2.68 µm. This distinct property of SWIR has been exploited in this study where the net result of a reduced Equation (6) makes use of the multiple effect of SWIR1 and SWIR2 at the numerator section. Most literature review has revealed that researchers develop spectral indices for rapid built-up areas extraction based on the peculiar response of urban features of specific image data.
Thus, it is essential to develop spectral indices for other types of satellite images, which may not have been applied on most geographic terrains [48]. Most high-resolution images are very expensive and non-available globally. Most often, extraction methods use other data sources that cannot be obtained by most researchers. Therefore, it is important to use methods that are easy to replicate and not restricted by data availability and economic constraints. This is what was done.

3.4. Growth and Change Analysis Formula

We analyzed the change from the extracted results by the proposed index. The change rate indicates when much imperviousness or built-up have occurred which can be a measure of the economic status of the region. It is expressed in Equations (7) and (8) [49]. Change and growth rates are known phenomena and have been used by [50,51] to examine the urban impervious surface distribution and change dynamics where the surface area coverage was determined for various years for Hangzhou and Xiamne cities. The change rate is this paper was calculated using Equation (7) while the growth rate is calculated by Equation (9).
Change Rate = (CR) = A(x) = [f(x2) − f(x1)]/[x2 − x1] = (y2 − y1)/(x2 − x1),
f(x2) = x22 − (2 × x2); f(x1) = x12 − (2 × x1),
where x2 is the final year, and x1 is the initial year; the functions are defined as in Equation (8):
Different formulas exist for the calculation of growth rates; however, in this study the formula of Equation (9) [52] was adopted.
Growth Rate = (GR) = T(x) = [present/past]1/n − 1,
where present and past represent the impervious surface area coverage figures for the current and past years, respectively. n is the interval over which the growth is computed.
To assess the spatial distribution of built-up expansion intensity, an annual urban expansion intensity index (AUEII) by [53] was adopted and modified to Built-Up Expansion Intensity Index (BUEII) for use as an indicator of the urbanization rate of the study area. BUEII is expressed as in Equation (10).
BUEII = [(An+i − Ai)/nTAn+i] × 100%,
where TAn+i is the total area of the target unit at time n + i; An+i and Ai the built-up area within the target unit at time n + i and i, respectively, and n the interval period (in years).

3.5. Index Performance—Accuracy and Background Discrimination

An accuracy assessment and pixel value comparison were used to assess the performance of the proposed index and the other five comparable indexes. There are always errors in land-cover maps derived from remote sensing data. The performance of the spectral indices and classification algorithms are measured by various means. Important among them is the accuracy test which assess how well the ‘classification’ worked. It measures the degree of agreement between a correctly assumed standard and a classified image of unknown quality. It estimates how accurate the land-cover data are in terms of thematic categories to determine whether the derived maps meet the requirements of the intended application.
To assess the performance of the proposed index, an agreement comparison was made and the proposed ISEI was found to have a higher agreement percentage than the other five indexes. To do this, points were picked from Google Earth, which was saved as point layer for each year. After the index manipulation, the binary images were superimposed with the point layers and the agreement percentages were calculated based on how many points that were picked as either an impervious surface or as pervious surface, and actually, fall within the impervious surface zone or the pervious surface zone. Using four statistical indicators the degree of agreement was measured as the overall accuracy. The statistical indicators as defined and explained by [54], have been compared with other methods by [55]. They are shown in Equations (11)–(14). True Positives (TP) are the points that were picked as ISA and correctly agreed with the actual class of ISA during superimposition. True Negatives (TN) are the points that were picked as PSA and incorrectly fall within the actual class of ISA during superimposition. False Positives (FP) are the points that were picked as PSA correctly agreed with the actual class of PSA during superimposition. False Negatives (FN) are the points that were picked as ISA and incorrectly fall within the actual class of PSA during superimposition. The accuracy test is its ability to differentiate the ISA classes correctly. It is the most natural performance measure and it is simply a ratio of correctly predicted observation to the total observations. Precision is the ratio of correctly predicted positive observations to the total predicted positive observations. Sensitivity is the ratio of correctly predicted positive observations to the total observations of all positives. F-score is the weighted average of Precision and Recall, thereby considering both FP and FN.
Accuracy = ACC = (TP + TN)/(TP + TN + FP + FN),
Precision = P = TP/(TP + FP),
Sensitivity = S = TP/(TP + FN),
F-score = 2*TP/(2*TP + FP + FN),
Using this approach requires a very good source of reference data. Training points or validation points were picked for the various years on Google Earth and as ground truth, the platform gives geometrically corrected high-resolution image. This serves as a great free source of validating data because Google Earth can go back in time to give a real-time training data. It has been successfully used by [56]. The classification results using a combination of Google Earth imagery and object-based classification techniques can attain an overall accuracy above 70.00% [57], which is the case in this paper. The other performance assessment used is the pixel value of the binary results. This result will usually range between −1 and +1 depending on the type of index used. The target feature usually shows as bright white representing the target features which are found in areas with pixel values close to +1, while the background is either mostly 0 or less than 0.

4. Results

4.1. Results of Binary Image Index for the Respective Years

In this section, we provide the results of the index algorithms in a binary form of black and white. The contrast between white and black are the representation of target features and background, respectively.
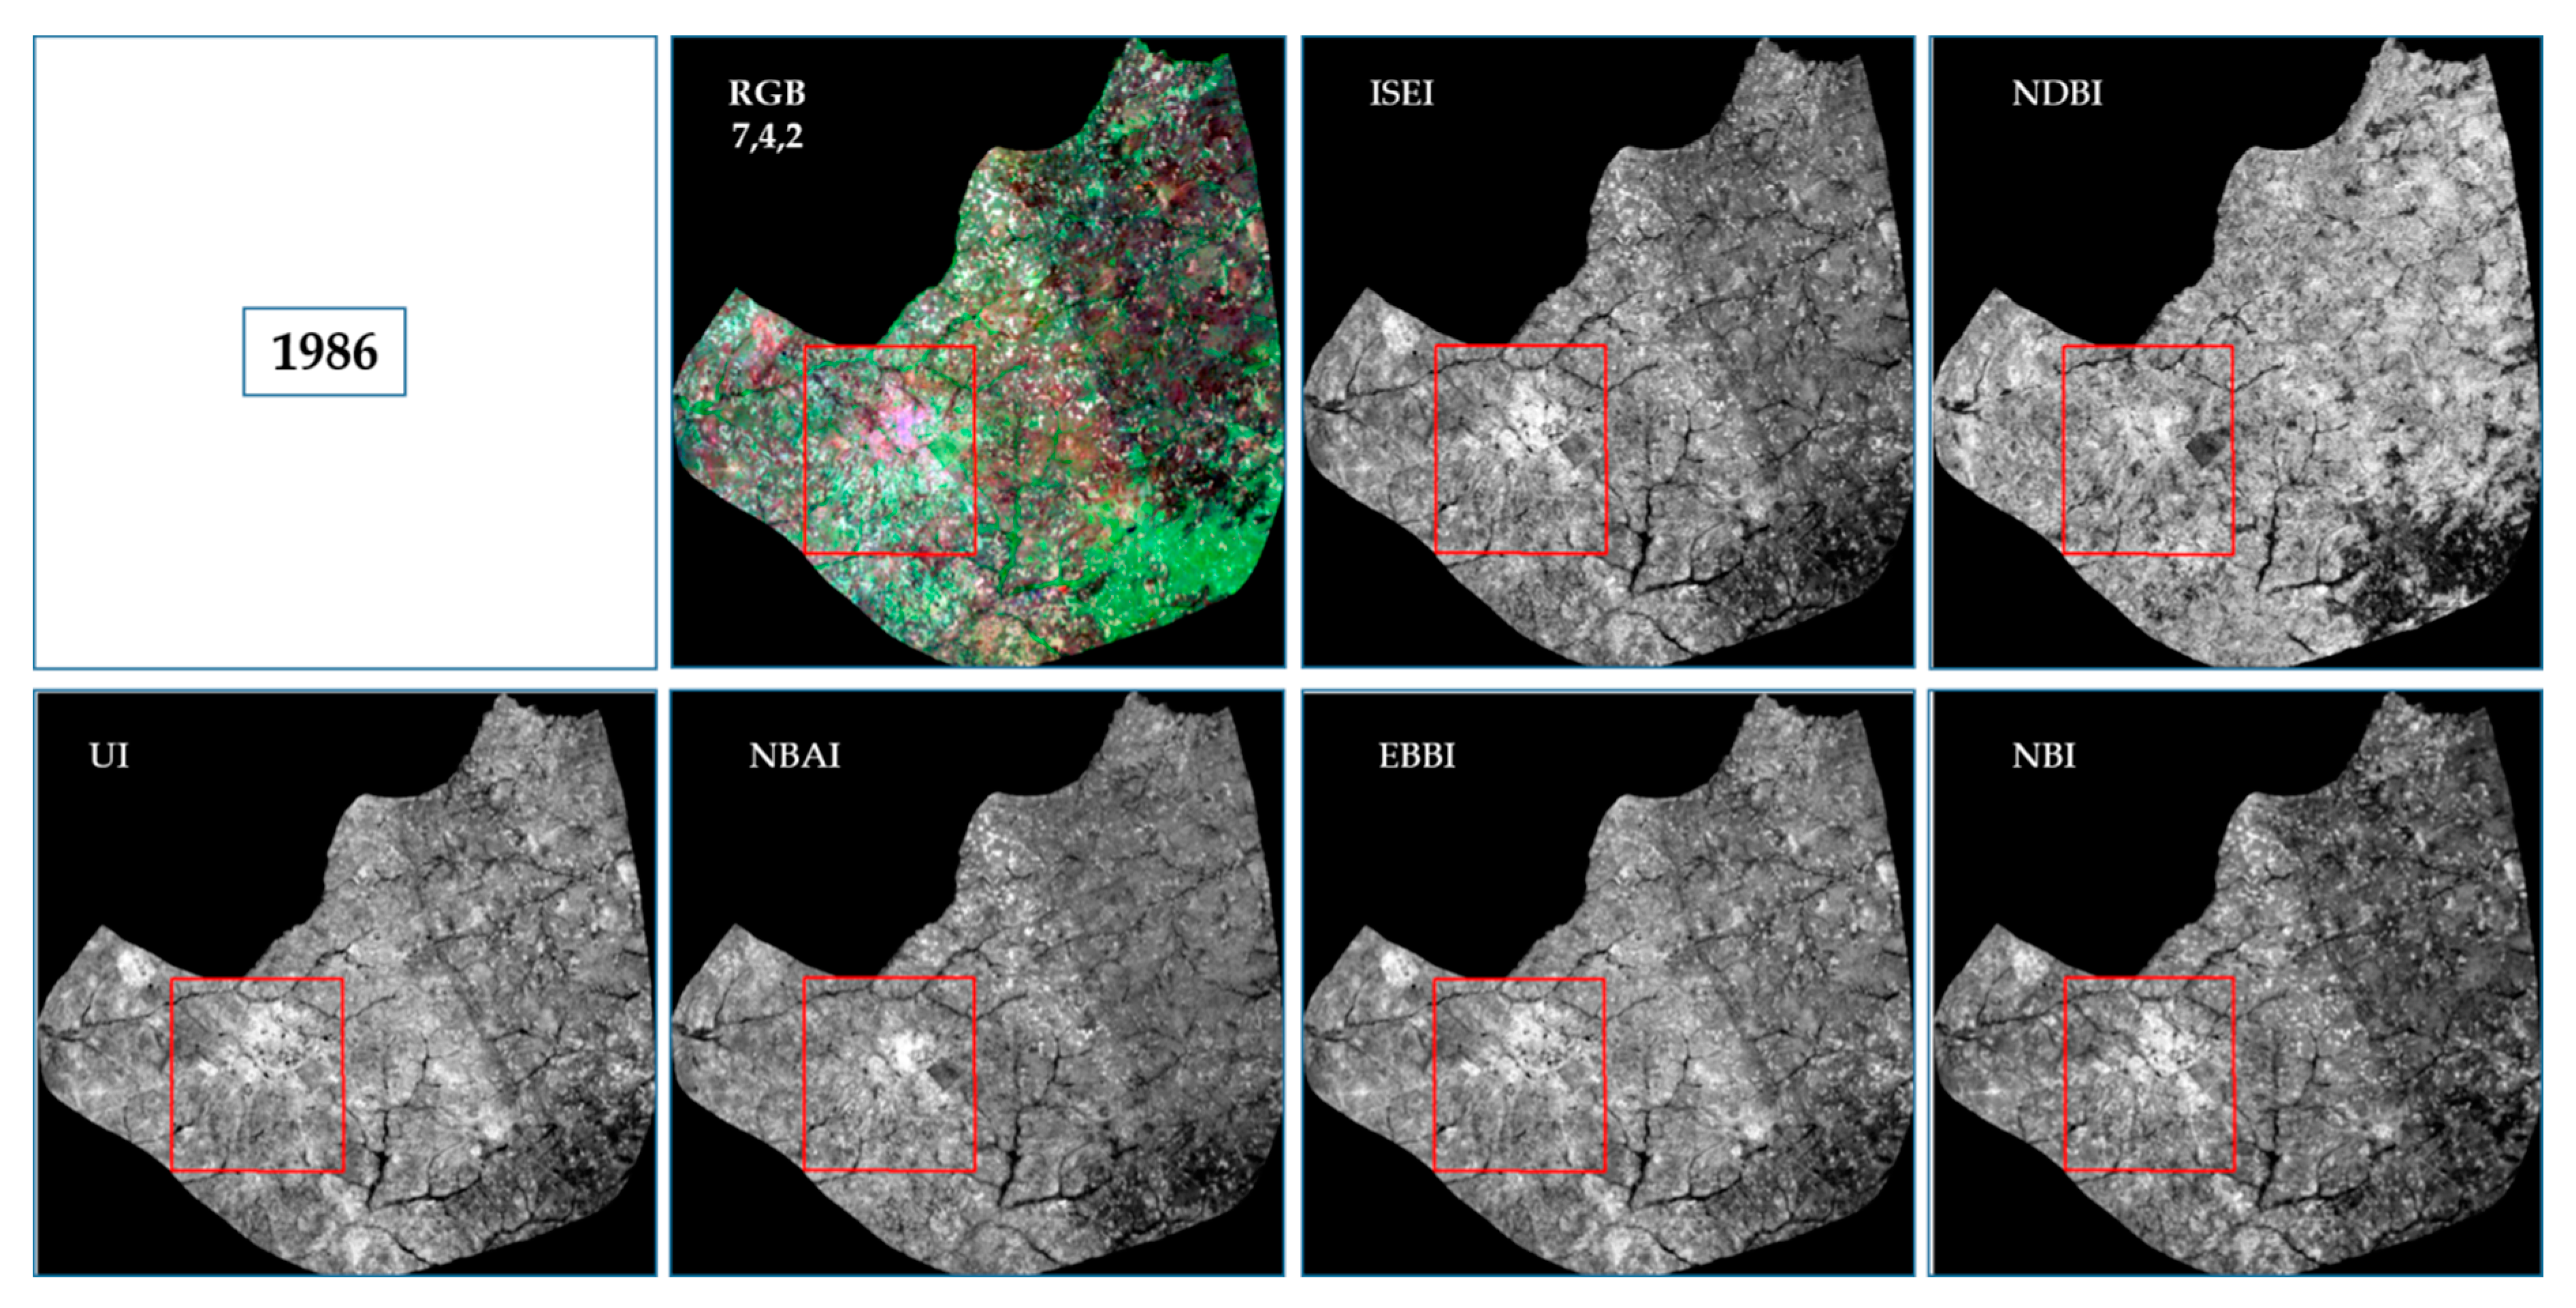
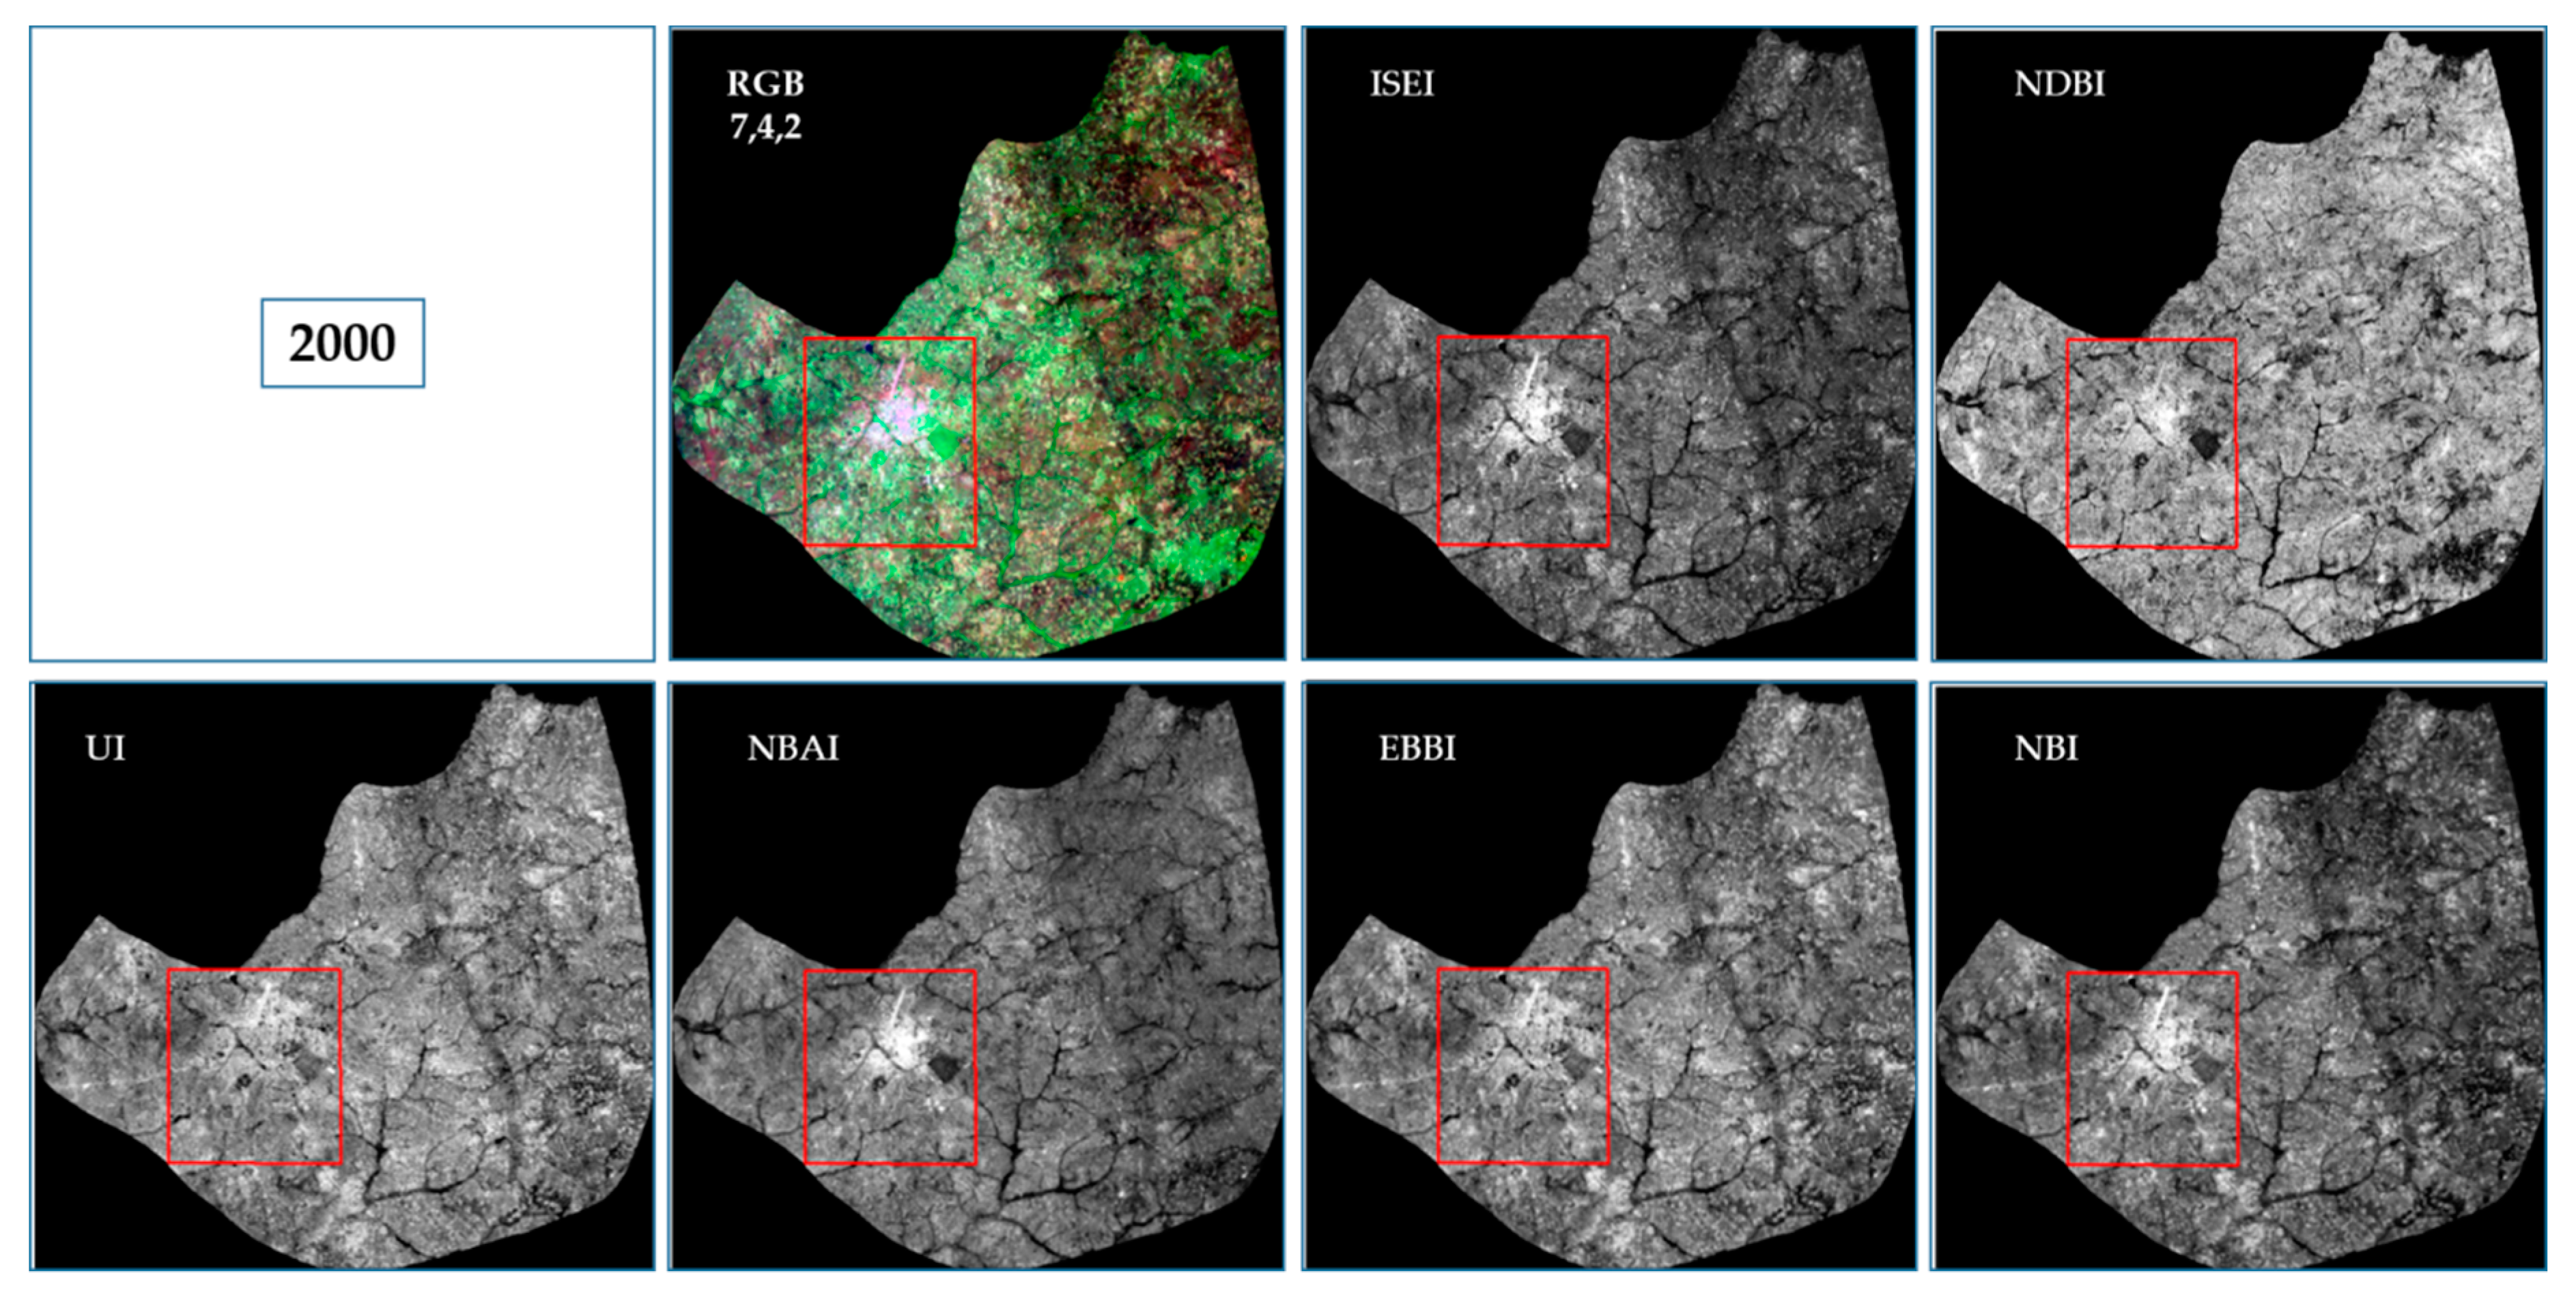
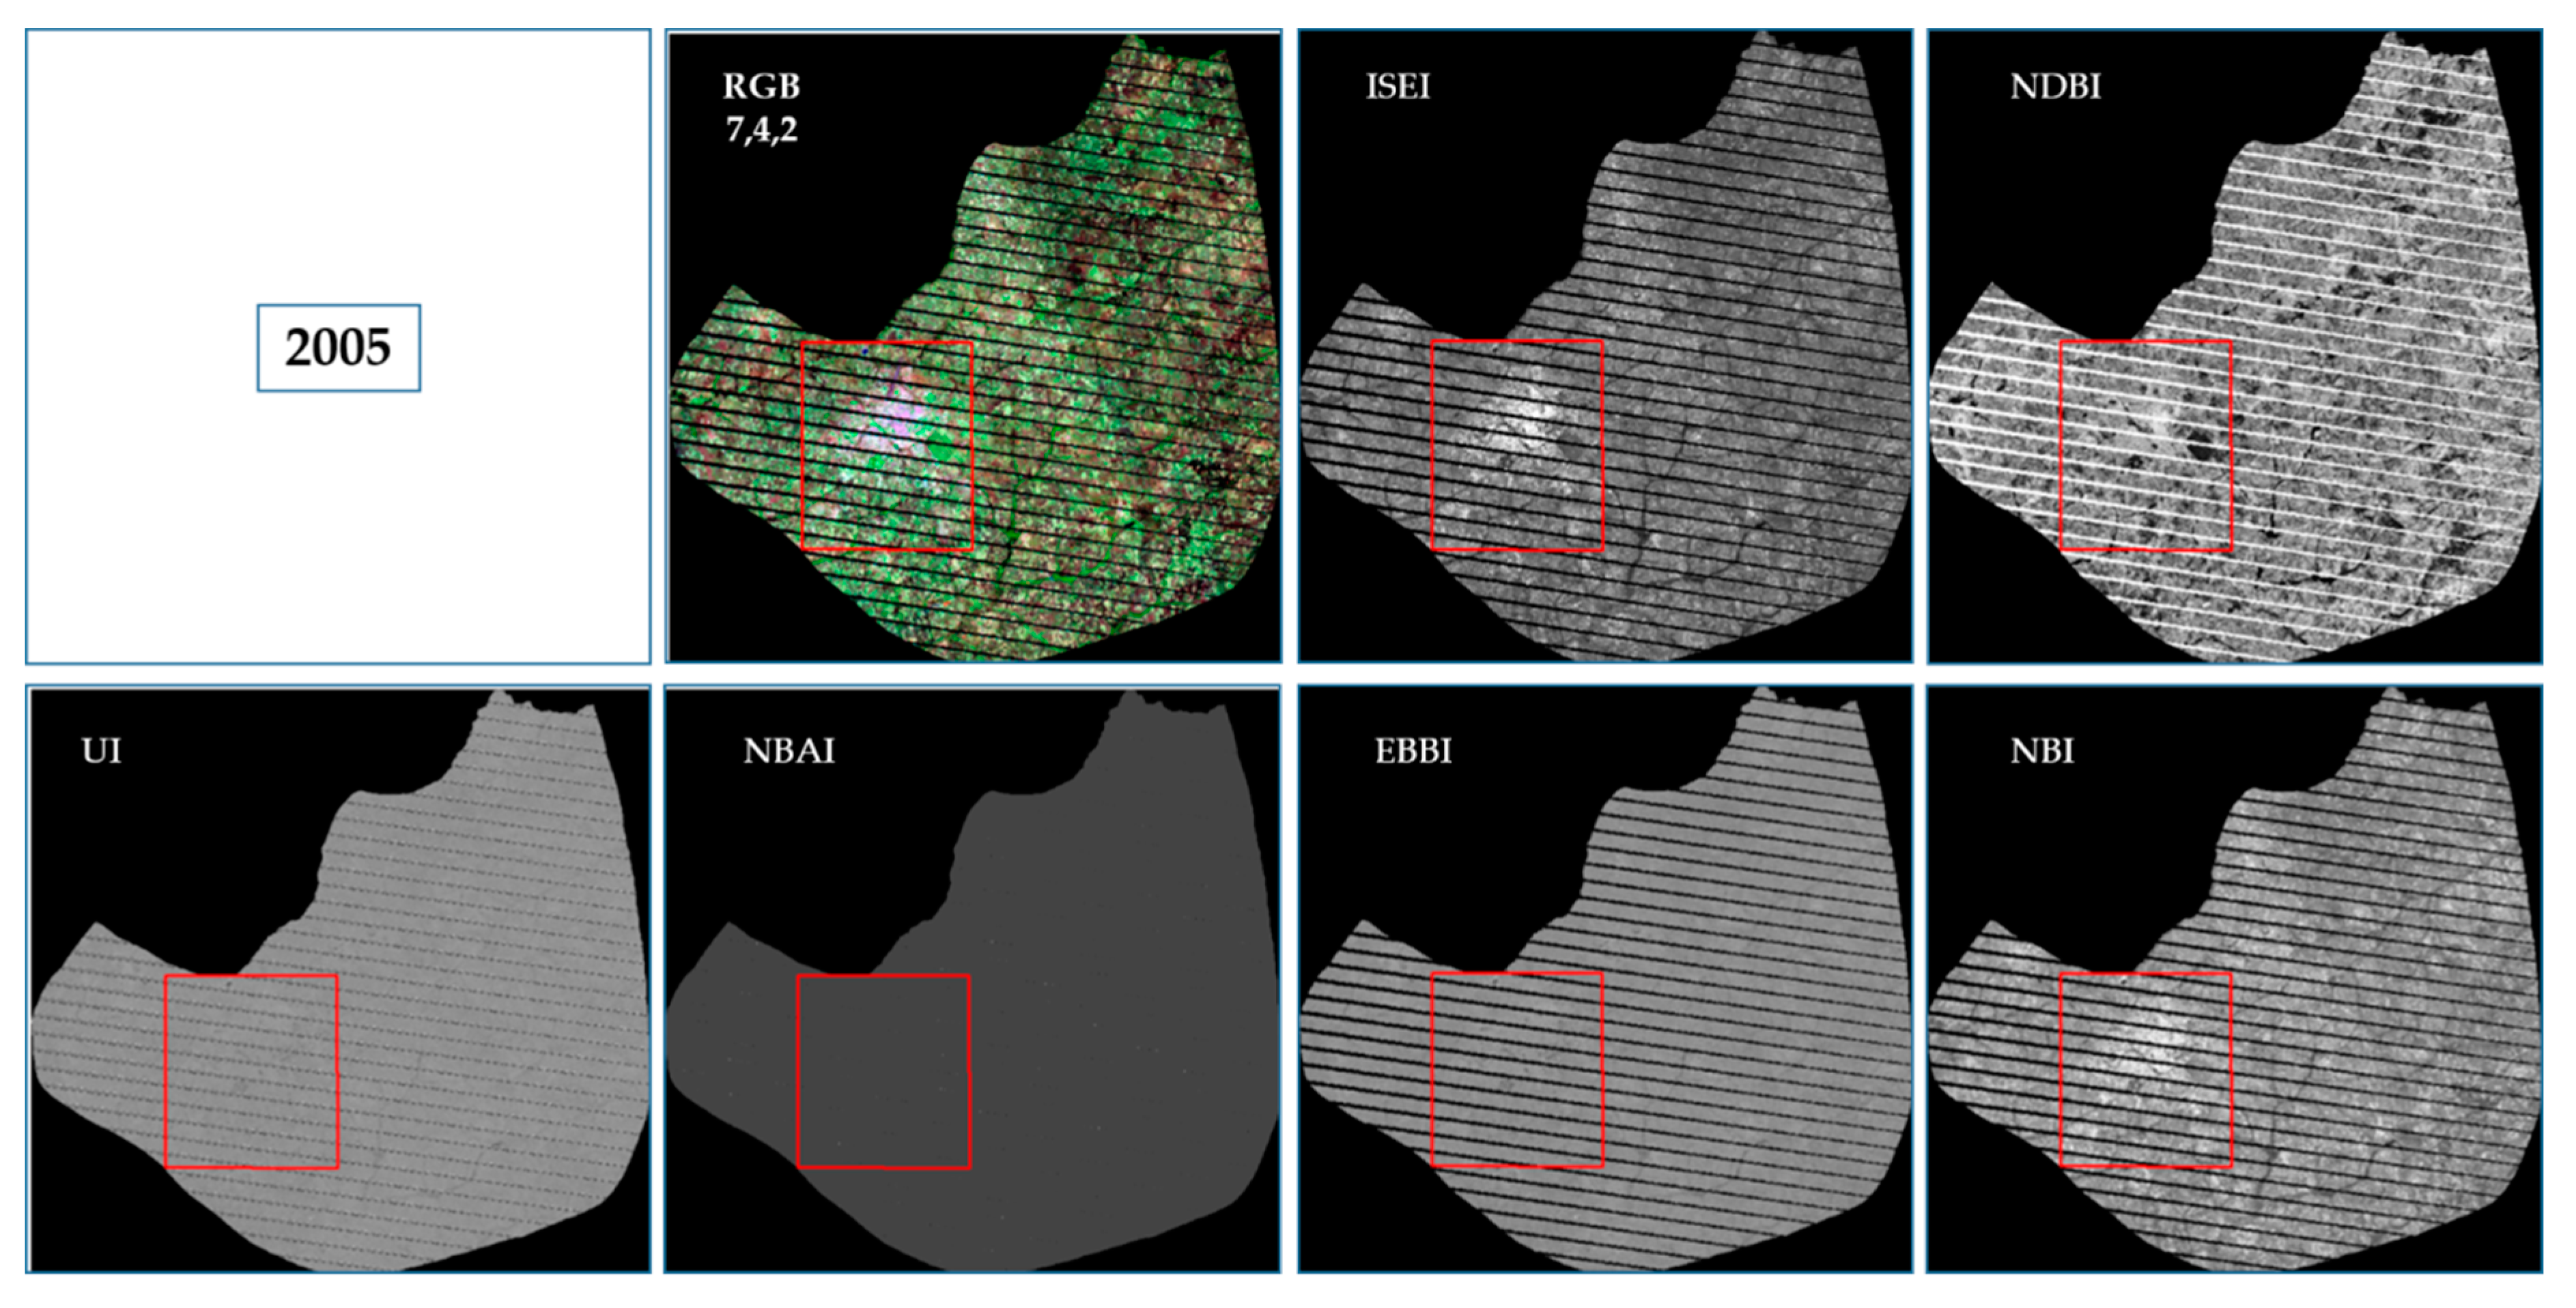
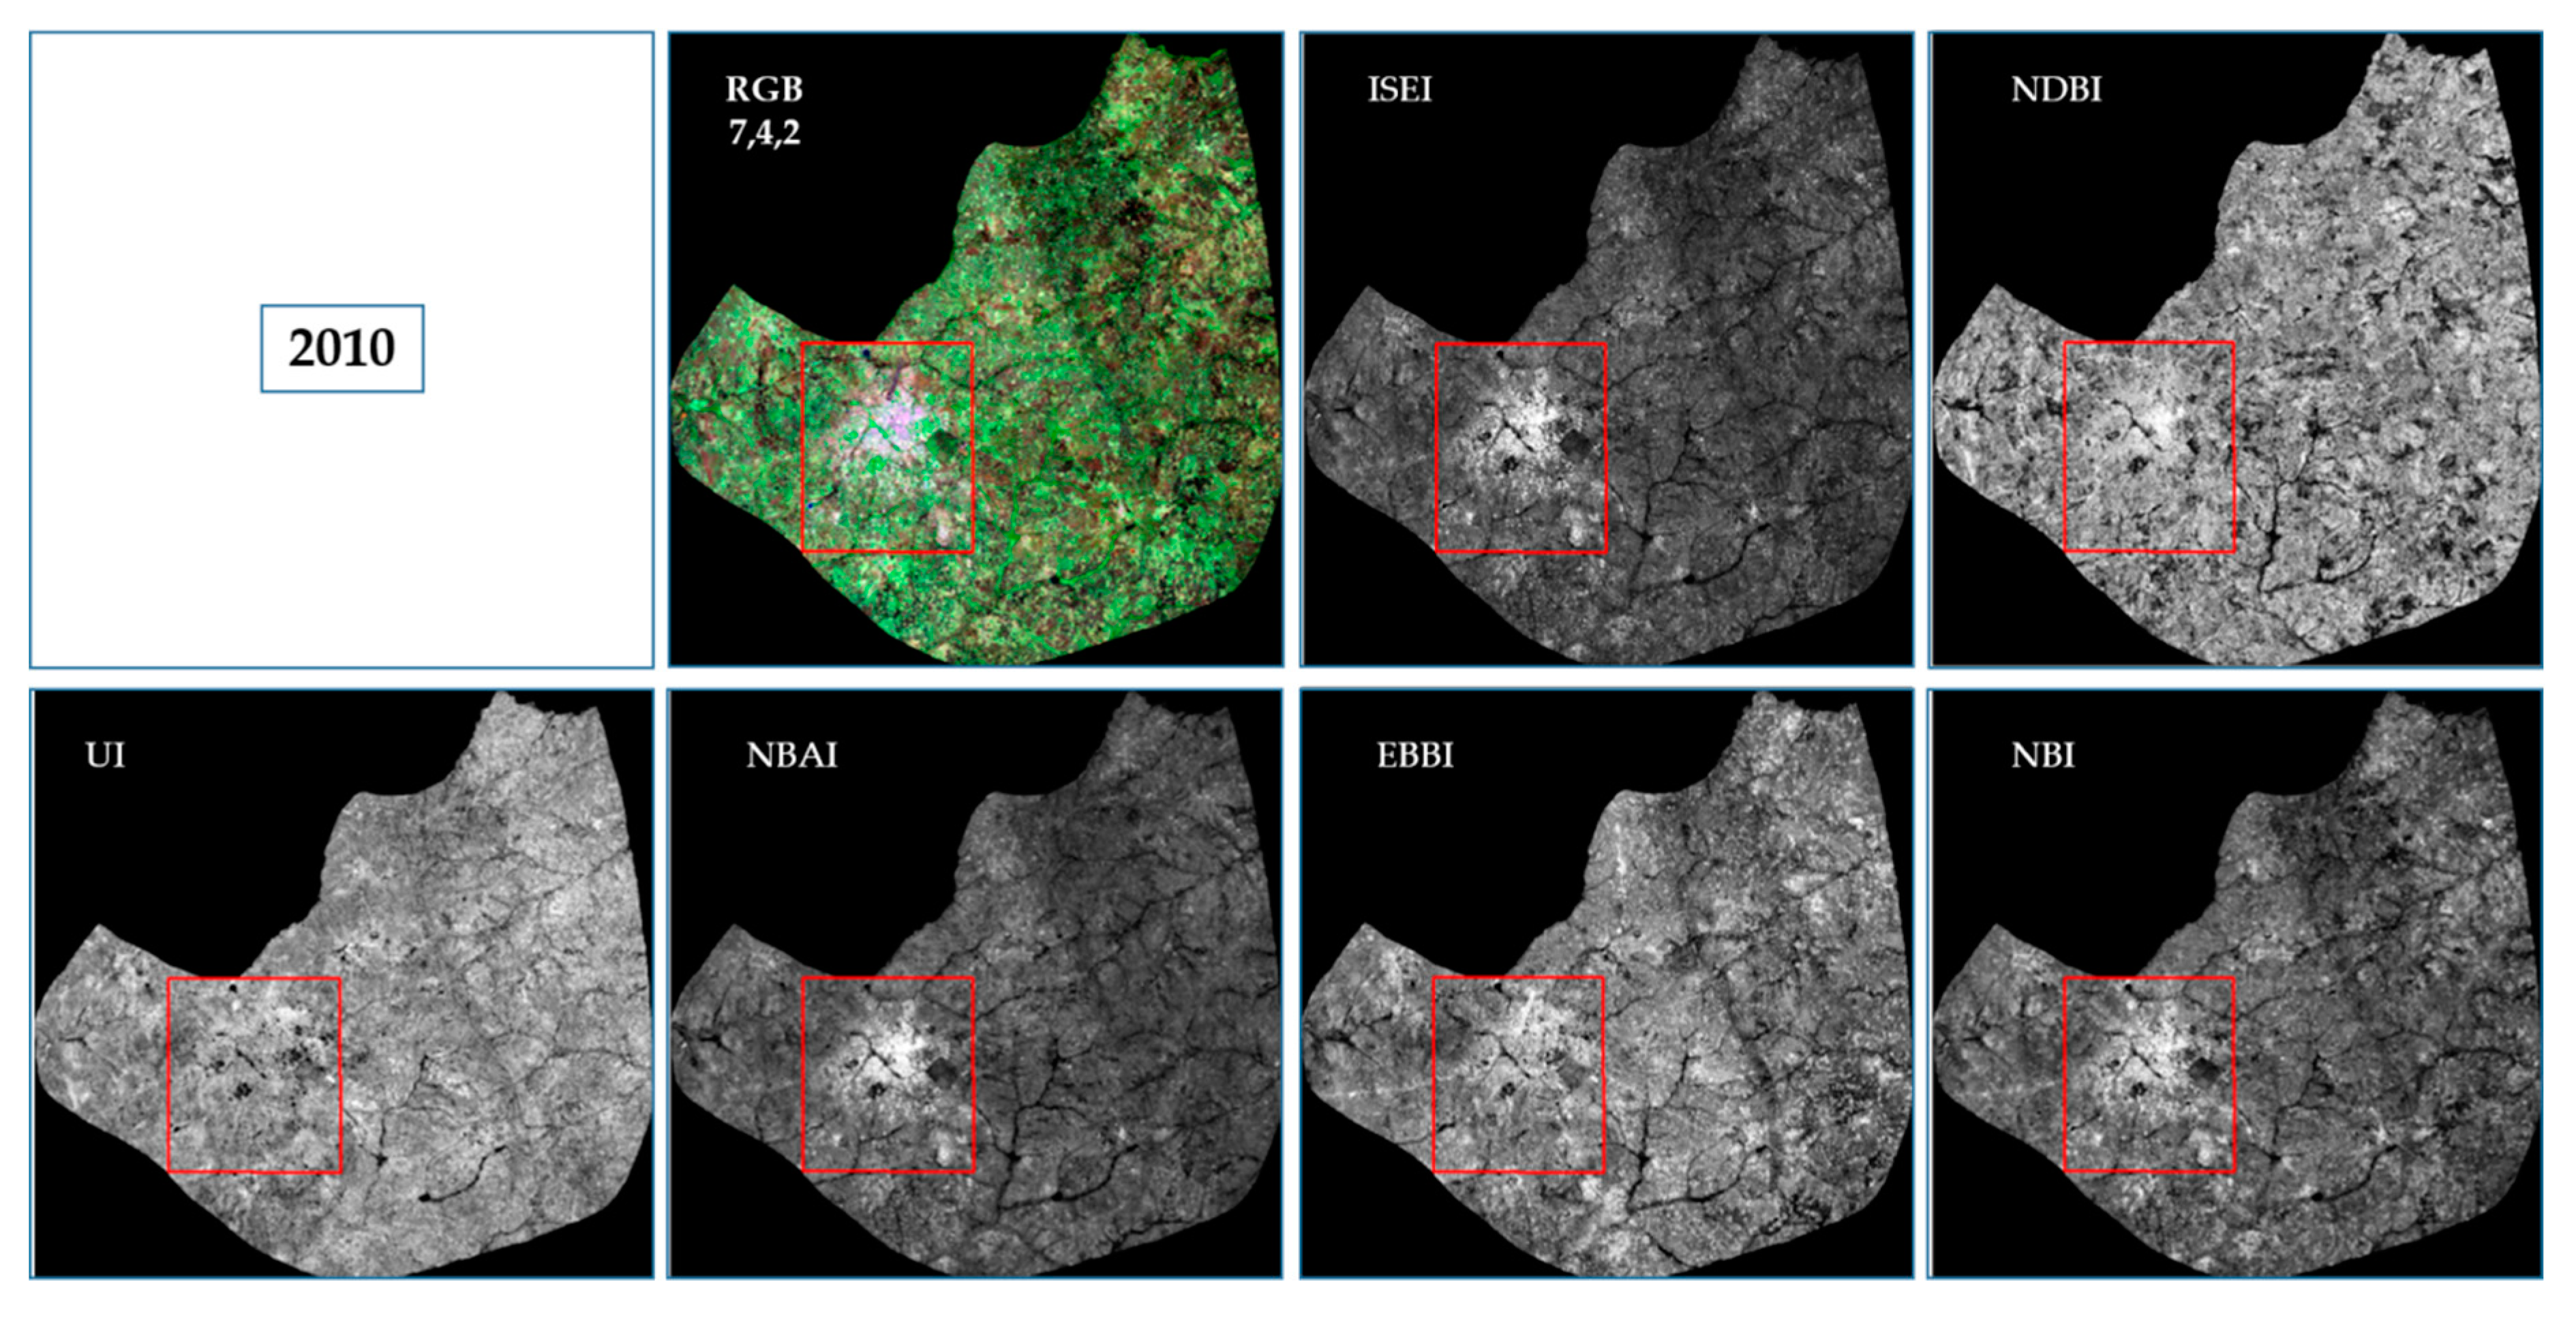
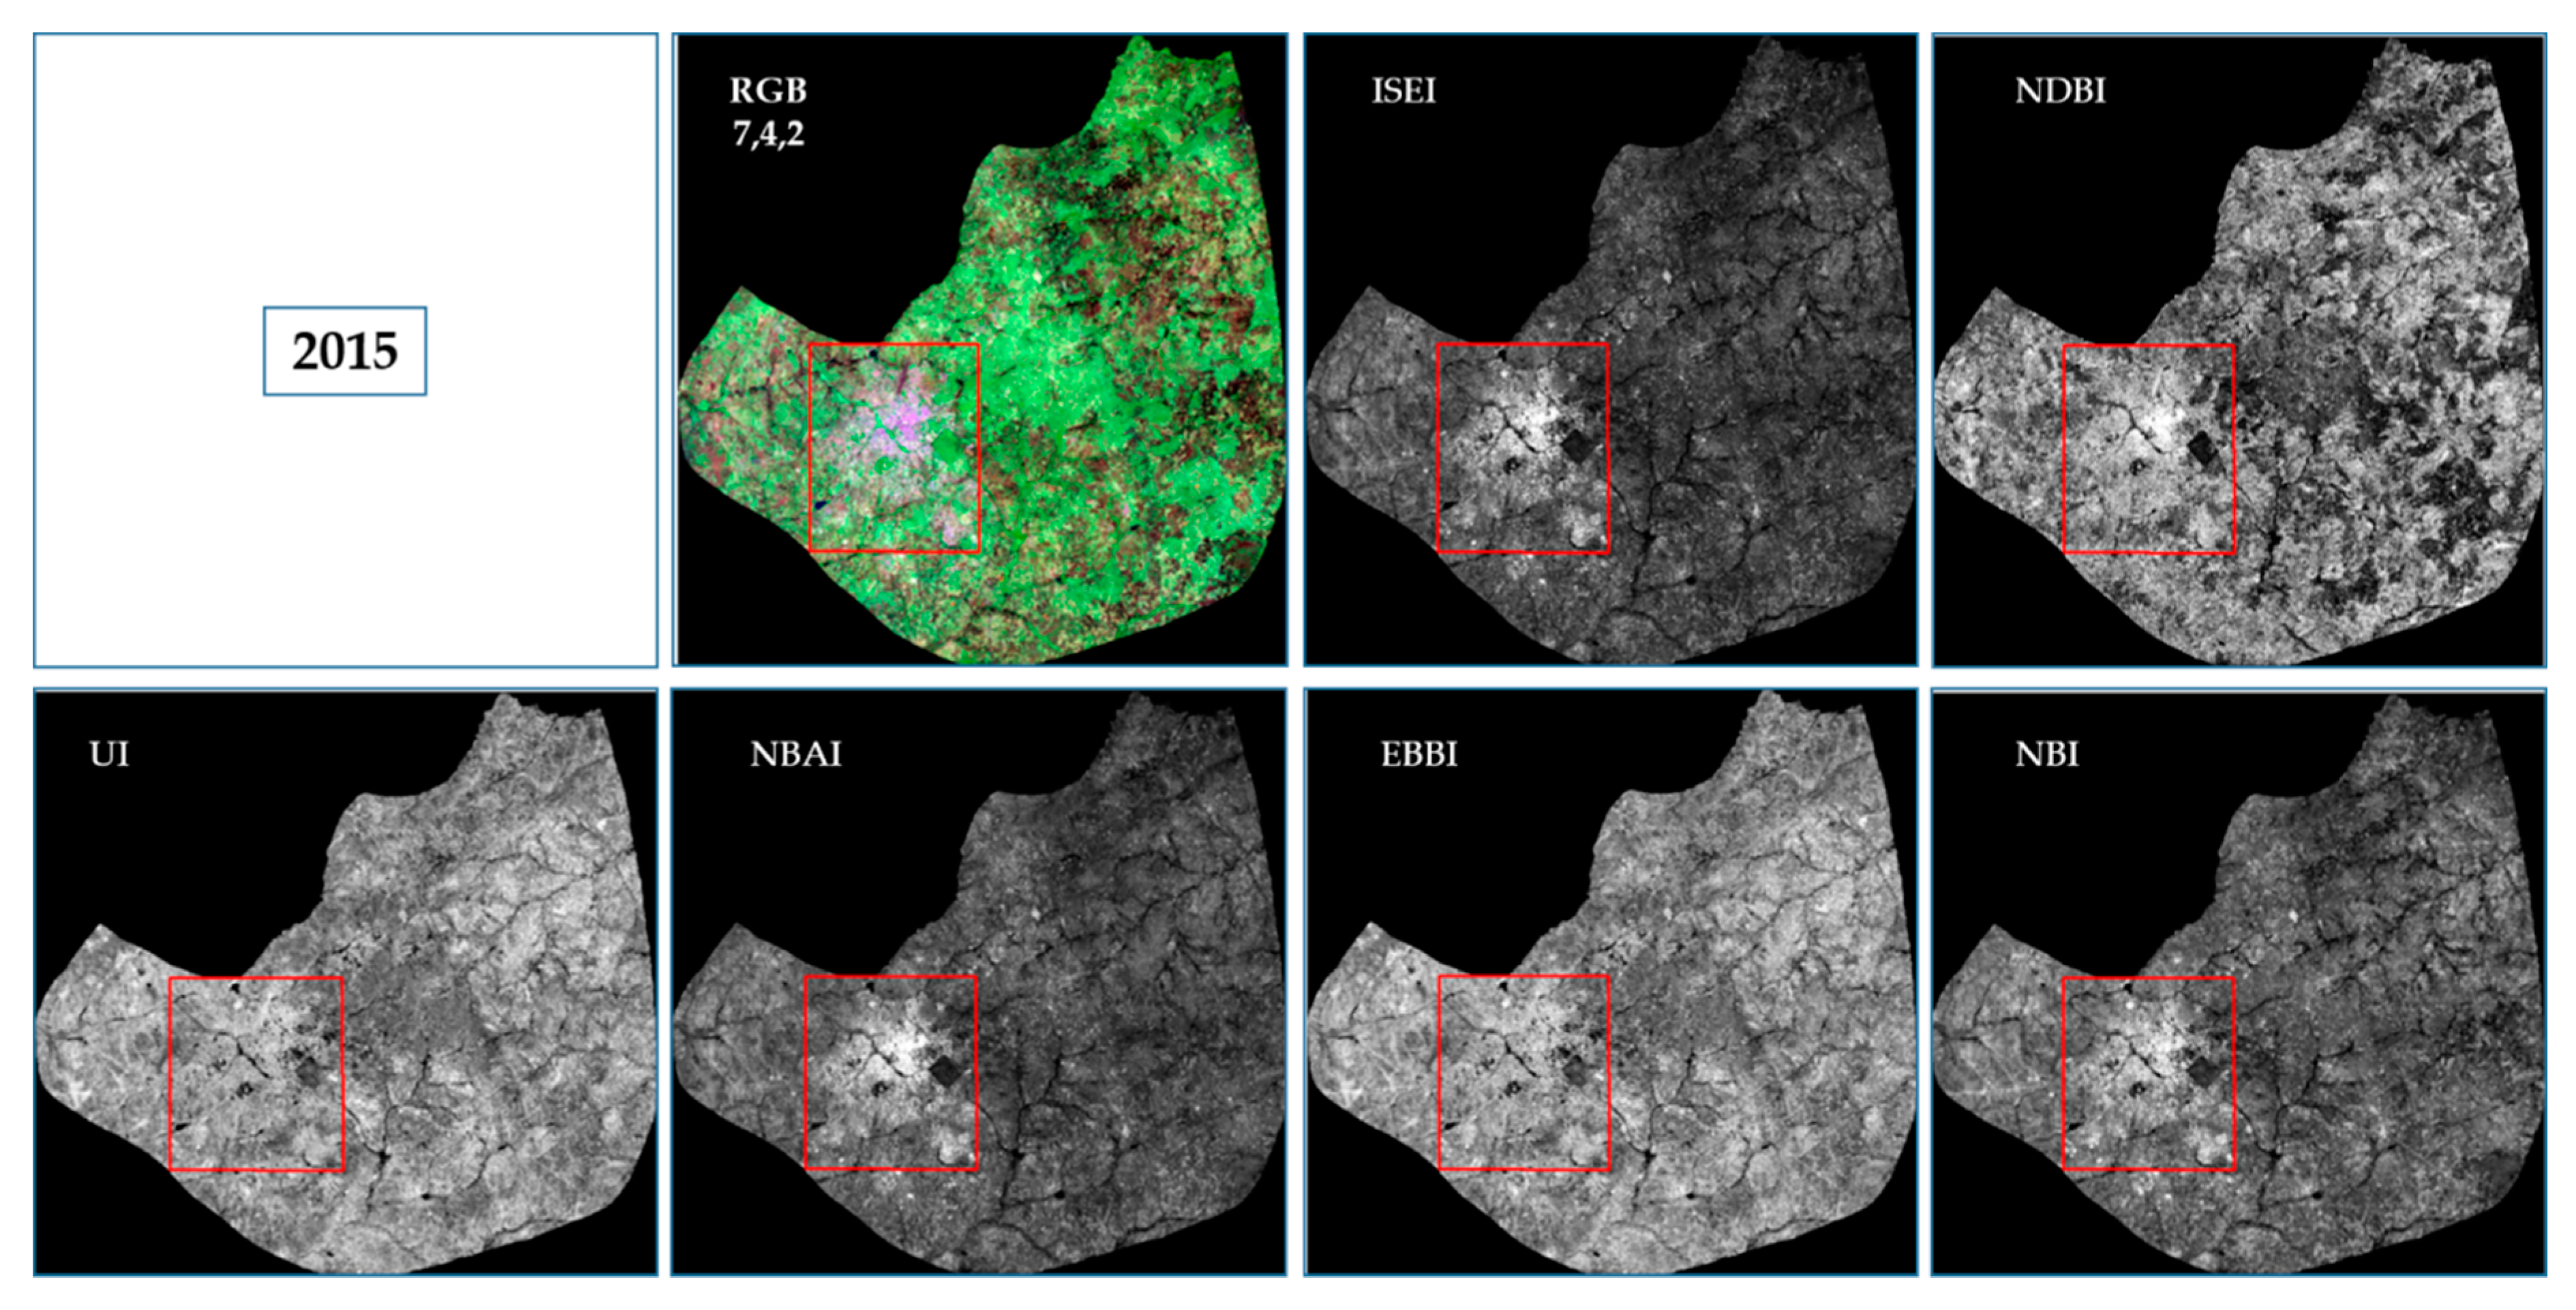
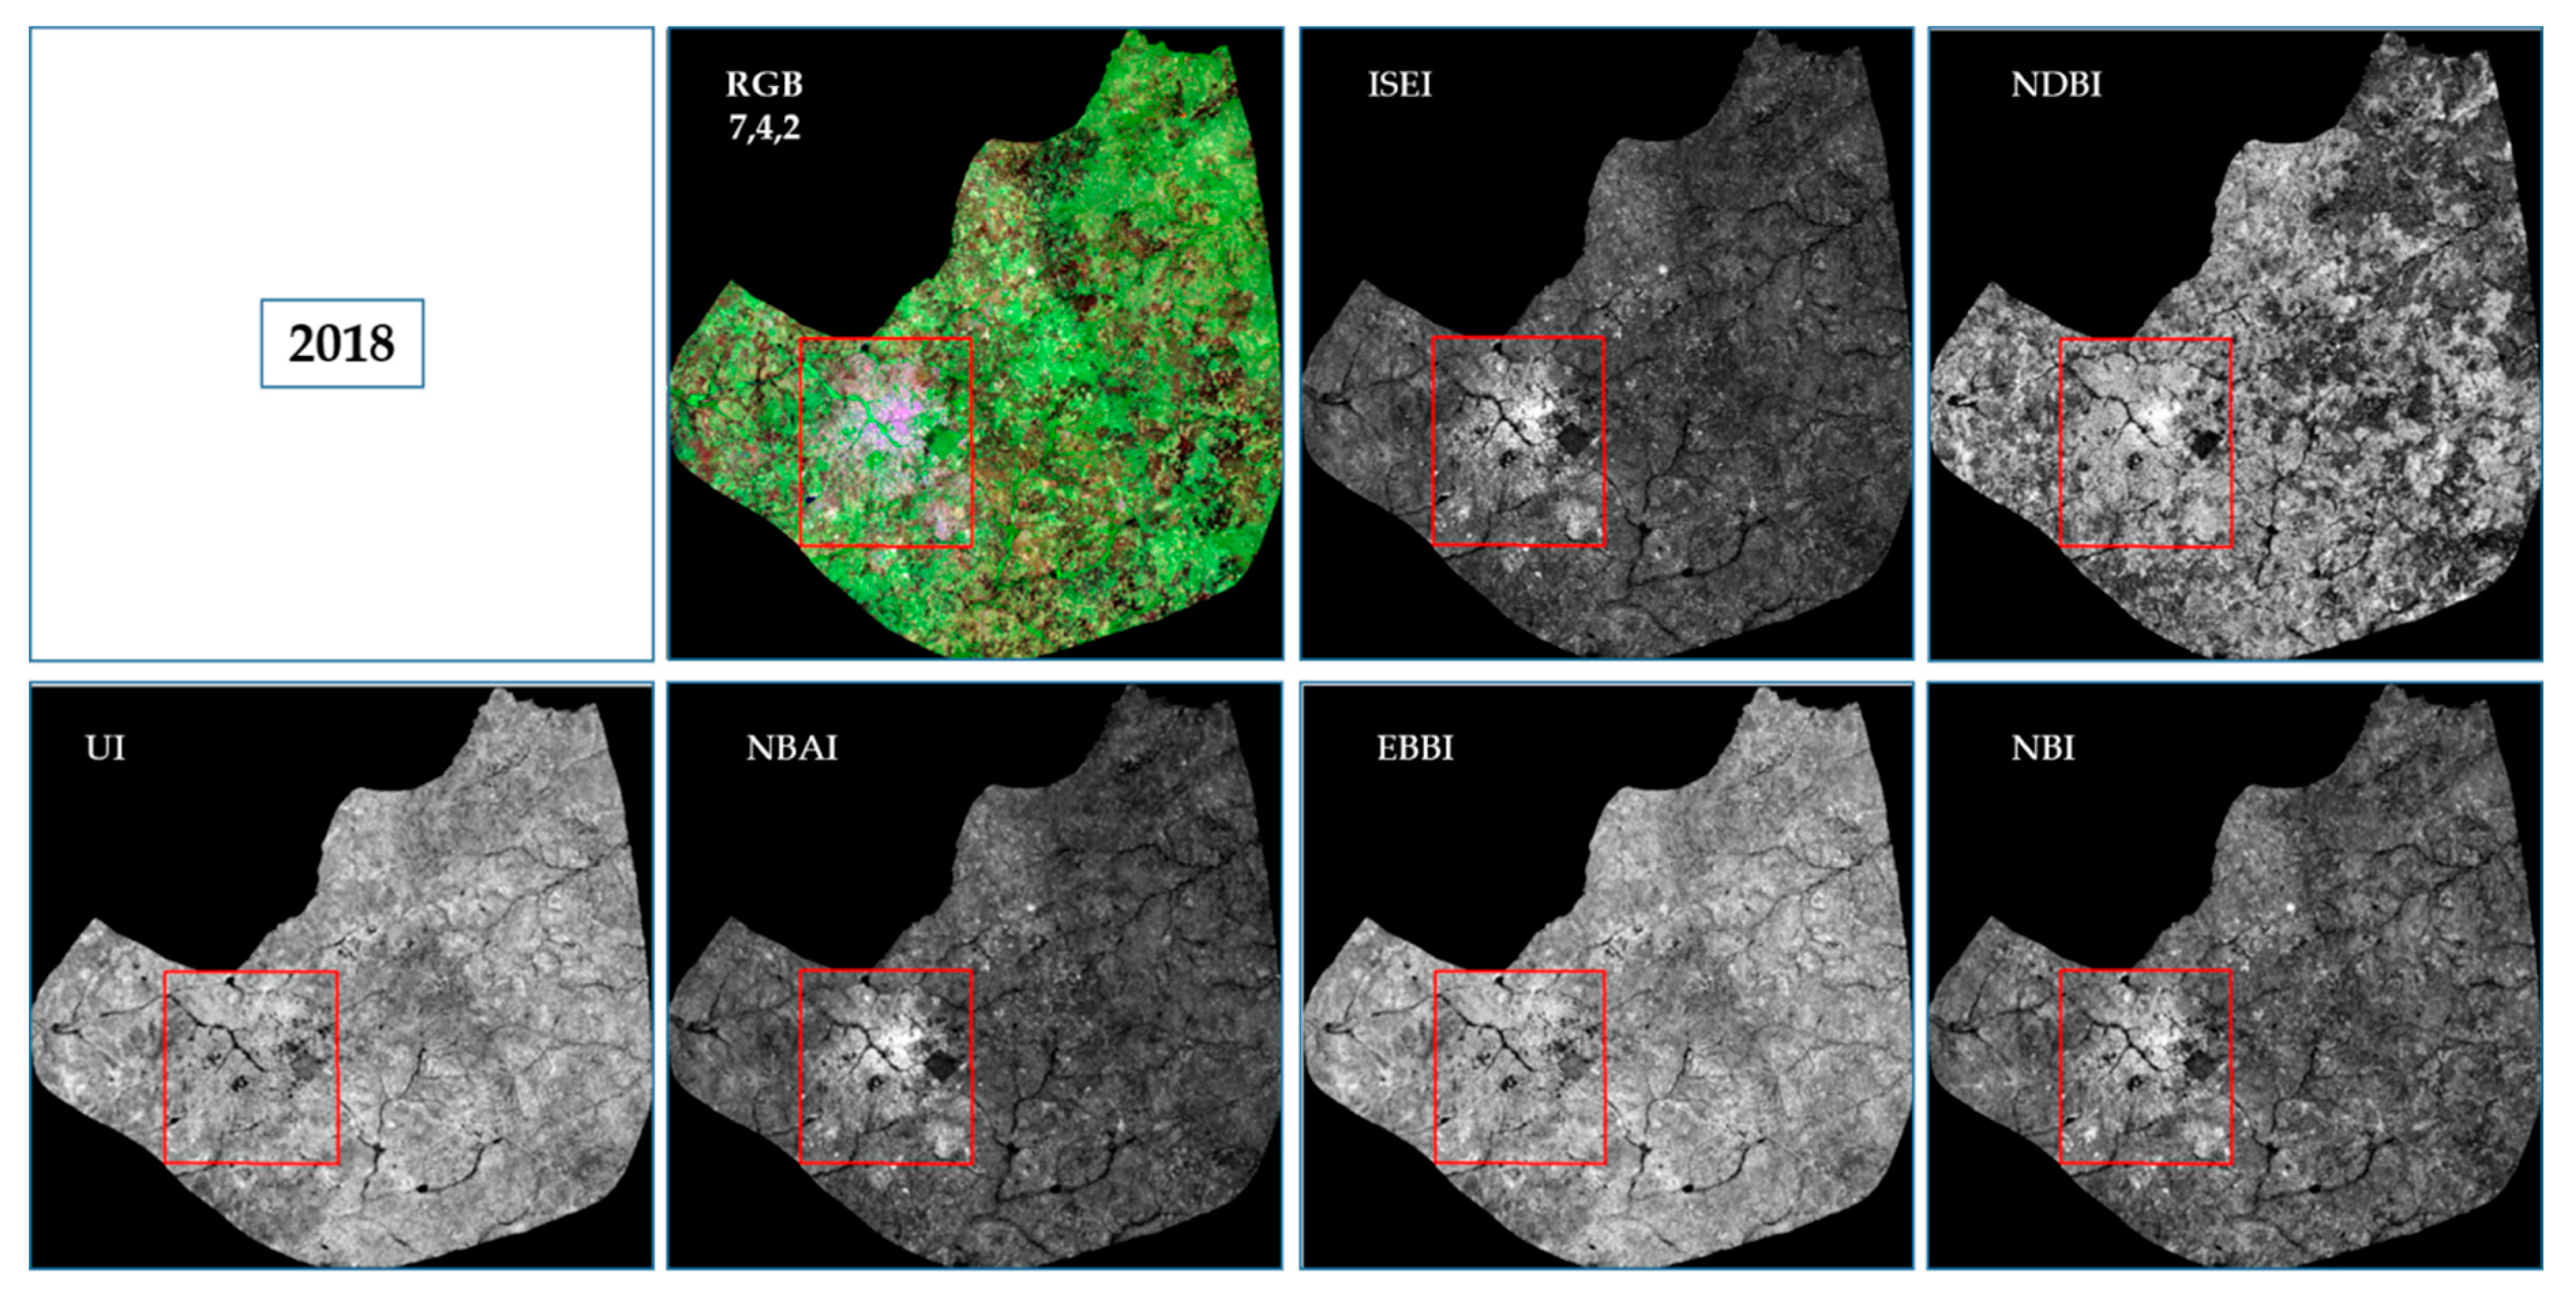
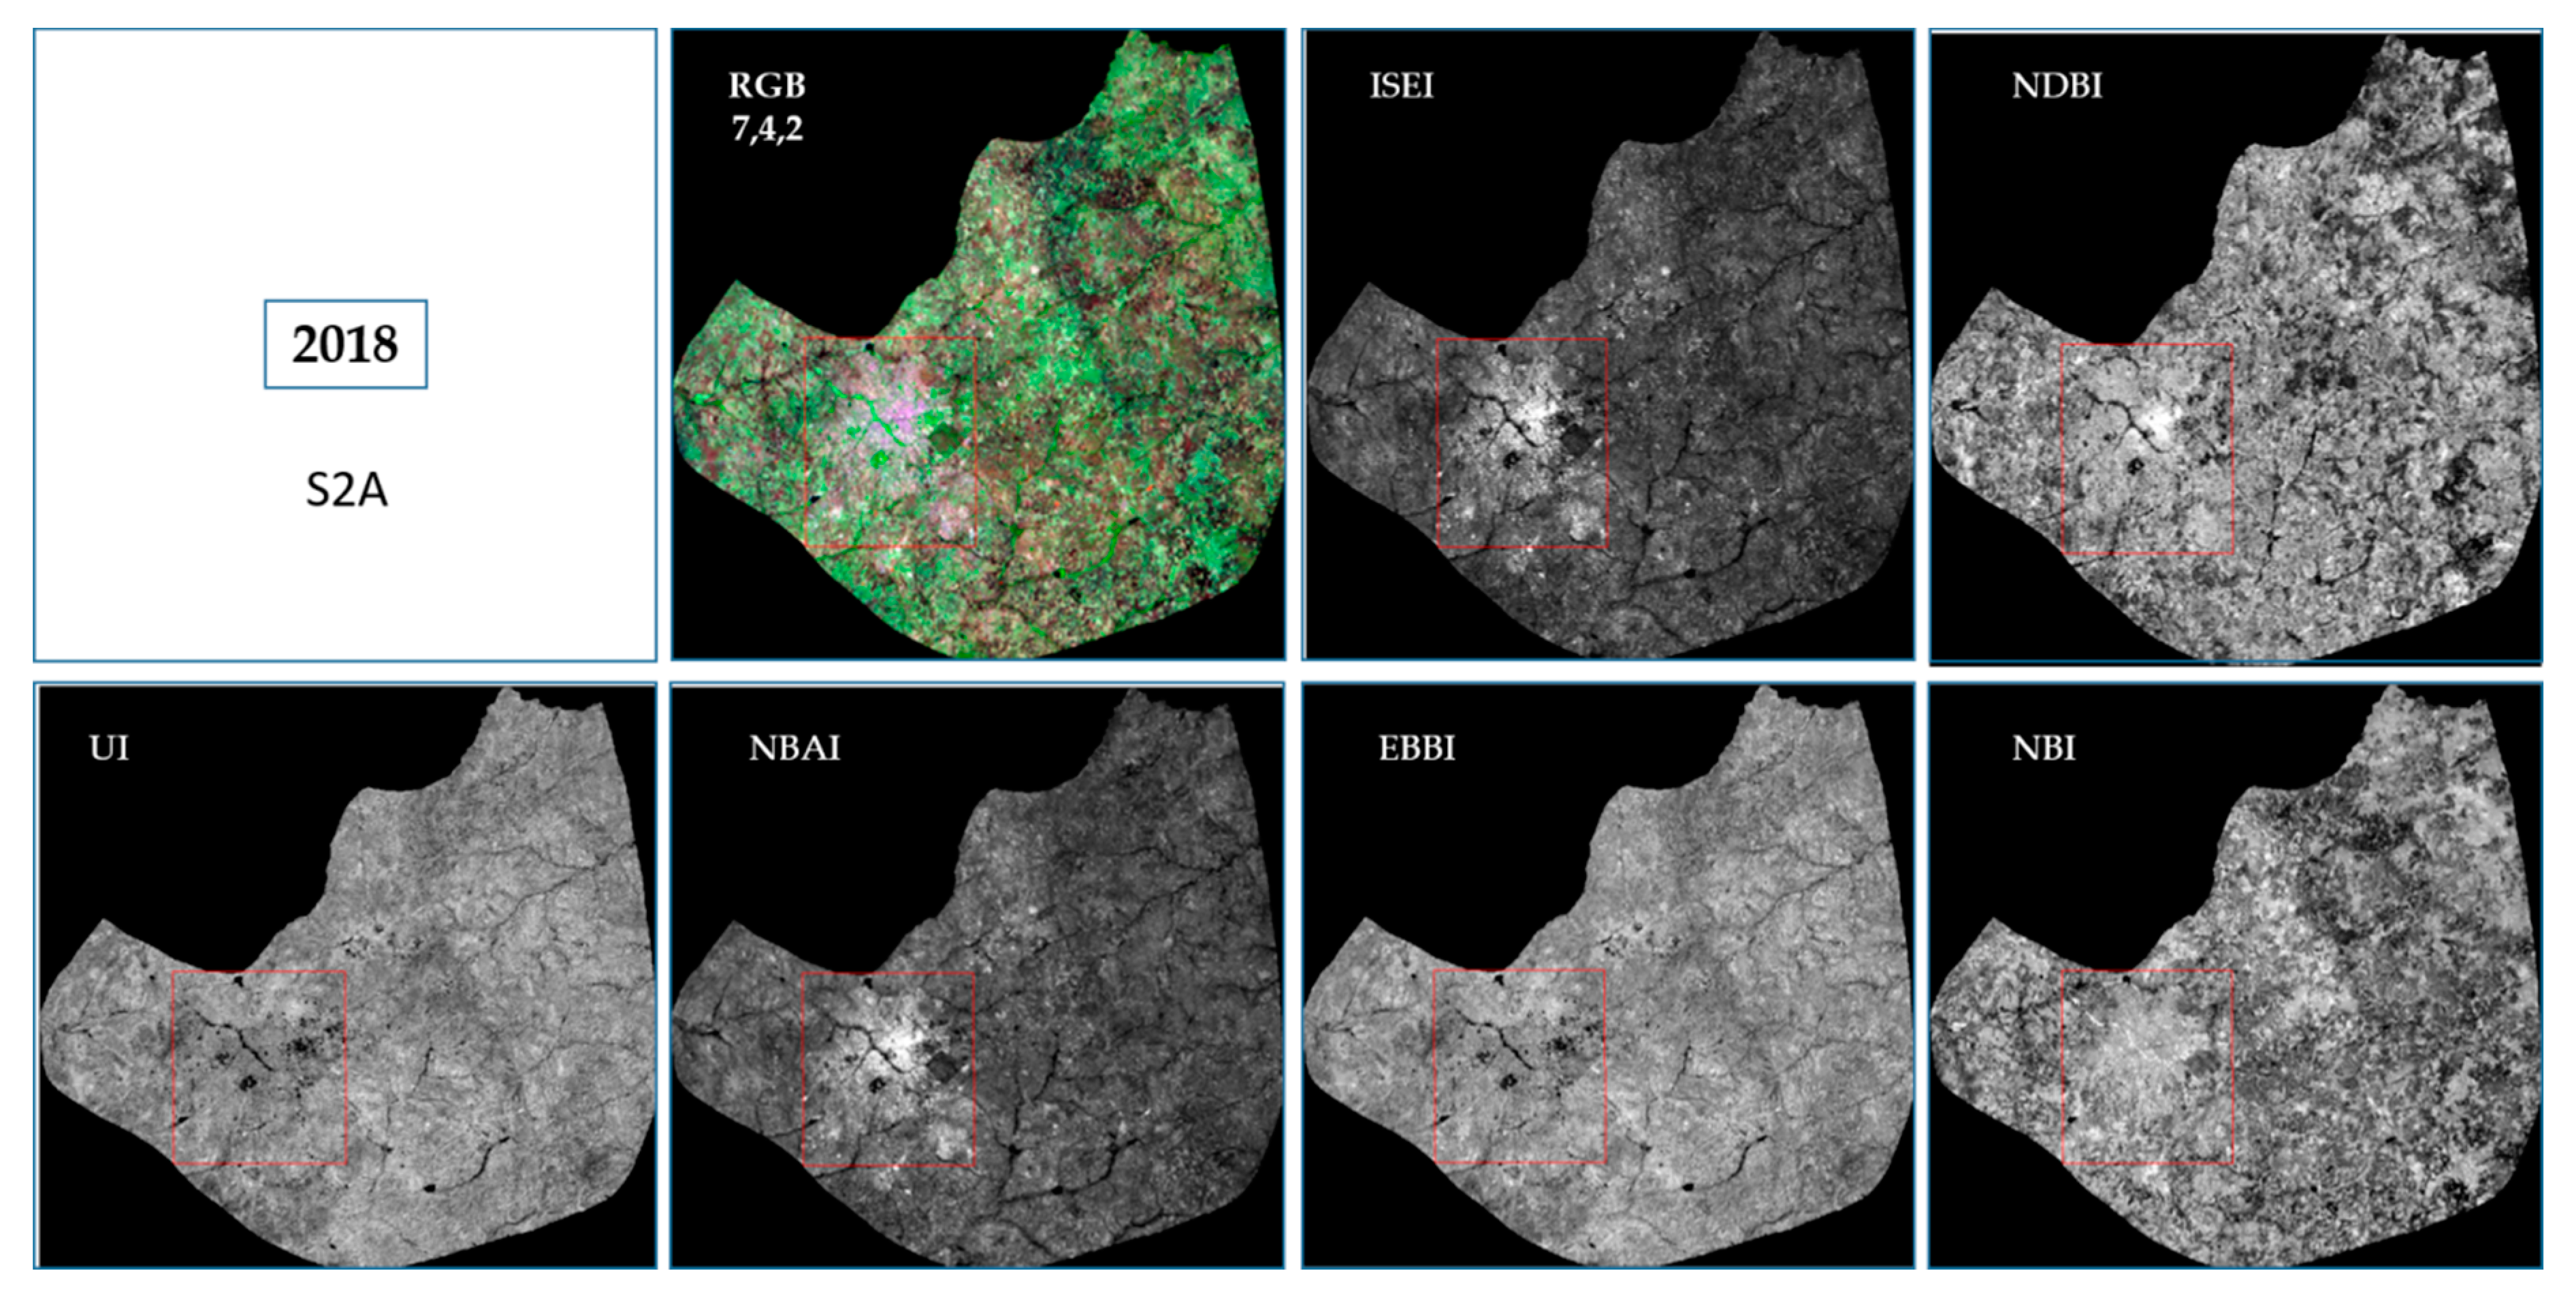
However, sometimes the error is usually the grey representation which indicates the level of features that are shown as background and vice versa. Visually, how much contrast there is, the better the result or performance of the index used. Notice that white portions are meant to be impervious areas (built-up areas). Between Figure 3, Figure 4, Figure 5, Figure 6, Figure 7, Figure 8, Figure 9, Figure 10, Figure 11 and Figure 12, results of the index algorithms are displayed, in which the ISA (built-up in this context) are shown as bright white and the pervious surface areas as dark. The grey portions depict other features that may have similar spectral characteristics as the ISA, such as bright and exposed rocks or bare soil. Generally, as much as possible, images were obtained in the dry seasons to avoid clouds. Nothing was done to those with little clouds; however, it is noticeable the proposed index discriminated well compared to the other indexes as shown in Figure 6. Table 2 shows results of the ISA coverage after extraction. It complements the results of Figure 3, Figure 4, Figure 5, Figure 6, Figure 7, Figure 8, Figure 9, Figure 10, Figure 11 and Figure 12.
Generally, highways in the urban areas and urban built-up or paved areas appear as brighter tone while forests, water body, and croplands appear darker. Indexes mostly enhance these spectral properties, where the index that does the enhancement better is said to have performed better. The analysis was grouped into four periods; 3 years (e.g., 1984–1986), 4 years (e.g., 1986–1990) and 5 years (e.g., 1990–1995). Along such groupings allow analysis on how long any visible change is realized. With this argument, it is assumed that both the citizens and the government do the built-up (imperviousness) activities. While the government is building roads and big structures, citizens put up their residence which all add up to the impervious surfaces increase. The area coverage percentages have been analyzed on three bases; on the original Wa District, the newly created municipality, and the Wa township itself. The results as displayed in Table 2.
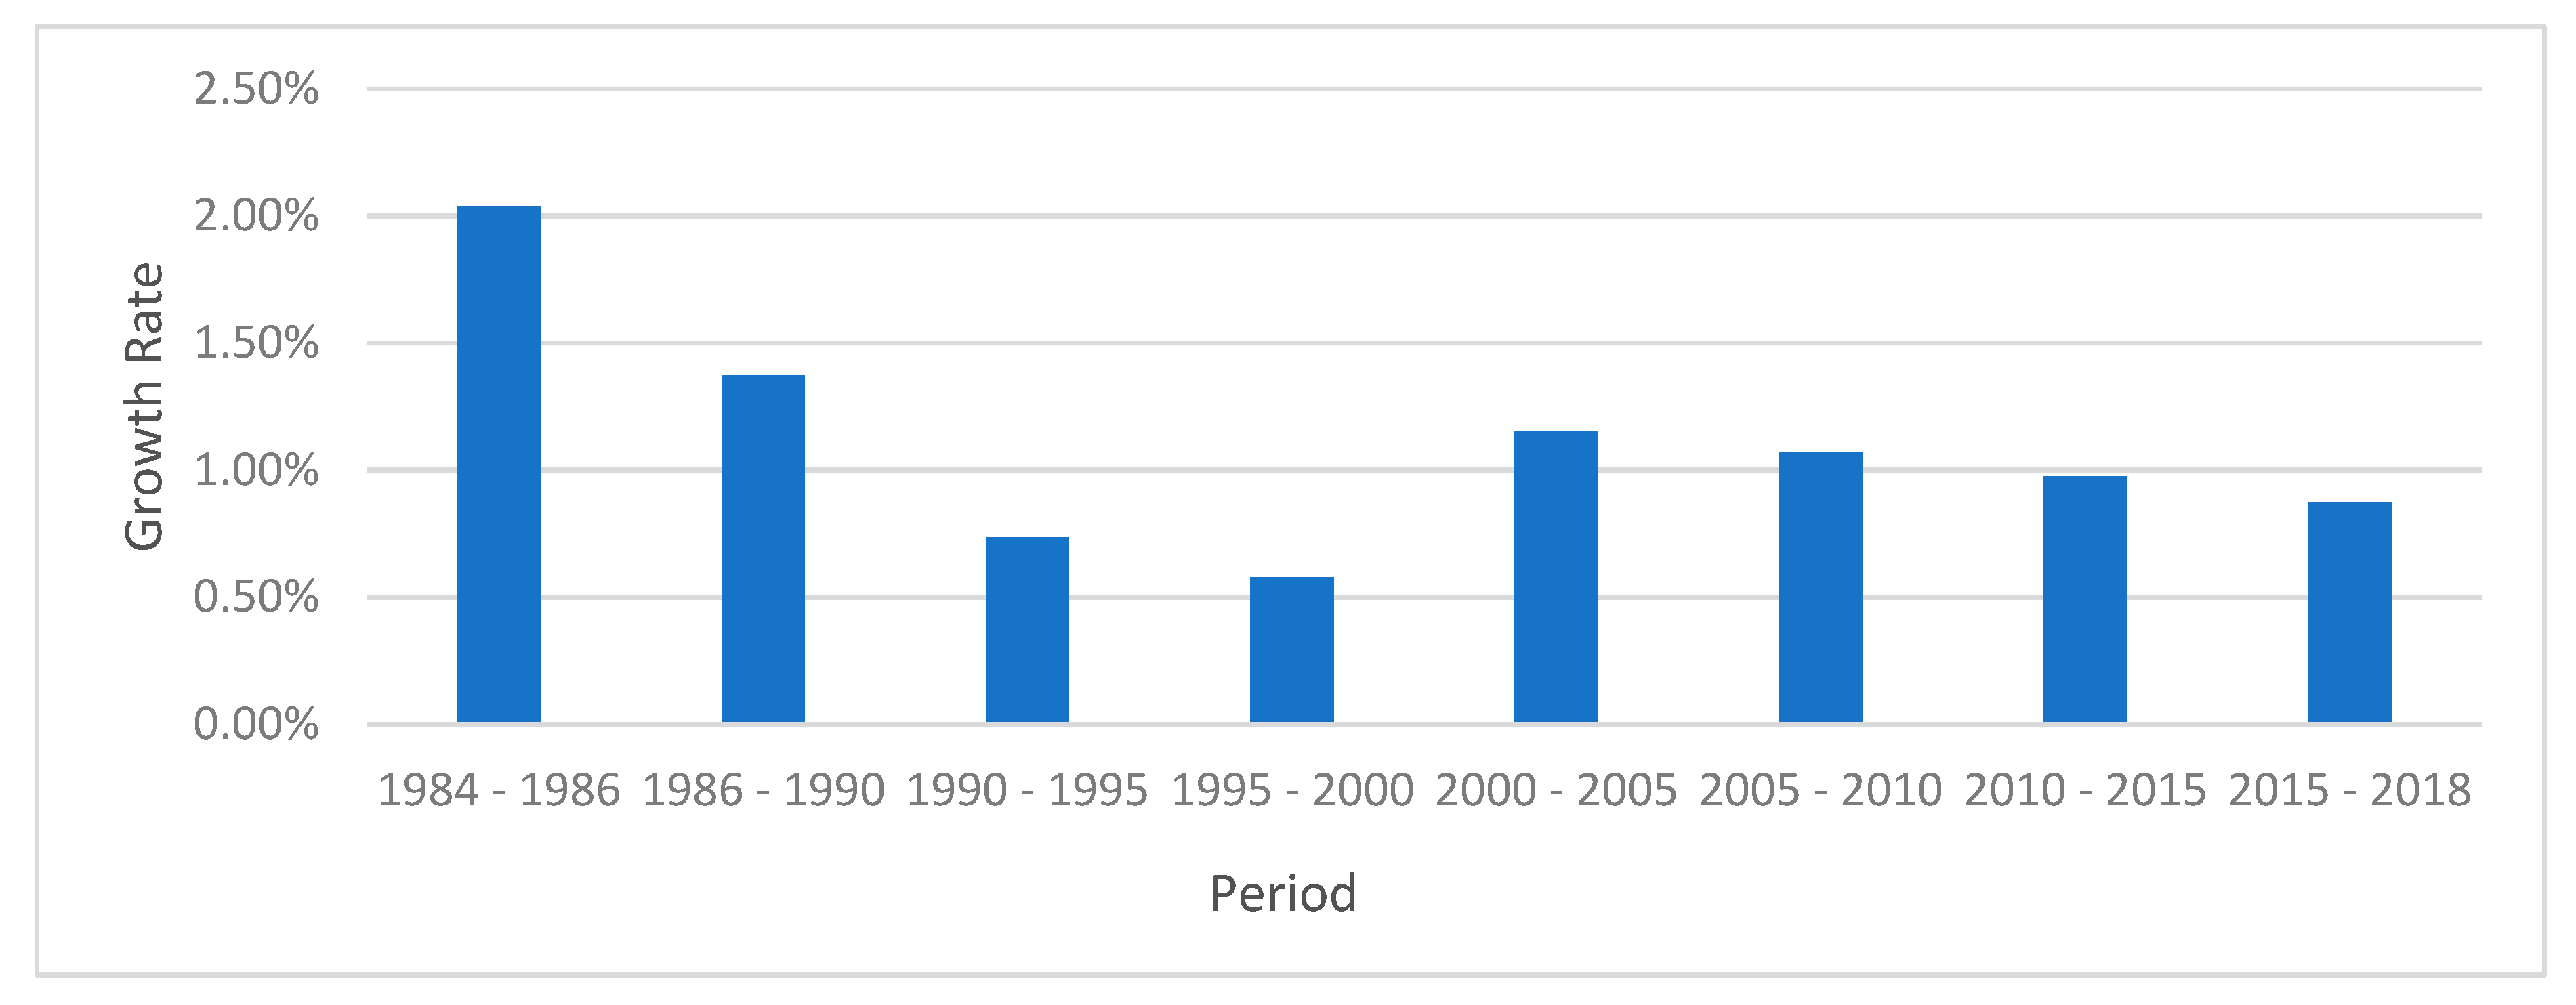
In the period 1984–1986, there was a change rate (CR) of 36.23% of its impervious surfaces, close to 4 years after the establishment of the district capital. This has increased steadily over the entire period of 35 years. Table 2 has the full results. By 2000, the imperviousness had increased from 18.73% in 1984 to 21.98% representing a land surface area of 201.89 km2 and 236.98 km2, respectively. This is an increase of only 3.25%. However, by 2010, over 27 years, the built-up areas occupied 24.55% of the surface area. By 2018 the district had seen an average increase of 0.97% per year which translate to 10.46 km2 additions between years. The growth rate (GR) over the period 1984–1986, 1995–2000, and 2005–2015 were 2.04%, 0.58%, and 1.02% respectively. Interestingly, over the entire period of 1984–2018, 34 years, there was a growth rate of 1.02%. This figure means that the area coverage of imperviousness grew by 2.06 km2 more of what existed in 1984 in-between years. This does not necessarily mean lack of development (urbanization) but rather it tells the spatial coverage of development within the district since infrastructure density can be another factor to consider in analyzing urbanization. Full results are complemented by Figure 13 and Table 4.
The accuracy performances of the various algorithm indexes are shown in Table 3. Notice the comparable close performance results of NBI to ISEI. It shows robustness to an extent.
Although the country experienced some military era prior to 1992, the country had a stable environment for growth. This is clearly shown in Figure 13 for the periods 1984–1986 and 1986–1990. Newly created regions received the needed attention. The highest annual increase occurred for the period 1984–1986 up till 1990. In Table 4 it is observed that there is a slight decrease between 1990 and 2000. This was so because of the economic hardship that befell the country which necessitated some capital expenditure restrictions and support from International Monetary Fund (IMF). In an earlier study conducted this year by Oteng-Ababio et al., [58], it was realized that the municipal had a 66.3% concentration of urban settlers compared to 16.3% and 50.9% for the regional and national population, respectively. This is a slight reduction from the municipal figures of 2018 of 70.73% as displayed in Table 4.

4.2. Change Rate and Growth Rate Calculations and Analyses

The government of Ghana, having implemented the decentralization policy, proposed to establish a university in every region. Wa District saw the establishment of two tertiary institutions, the University of Development Studies (UDS) in 1992 (Wa campus in 2002) and Wa Polytechnic in 2003. Wa township was upgraded to a municipality in 2004. This lifts up the population of the regional capital, providing jobs and lifting the economic status of the district.
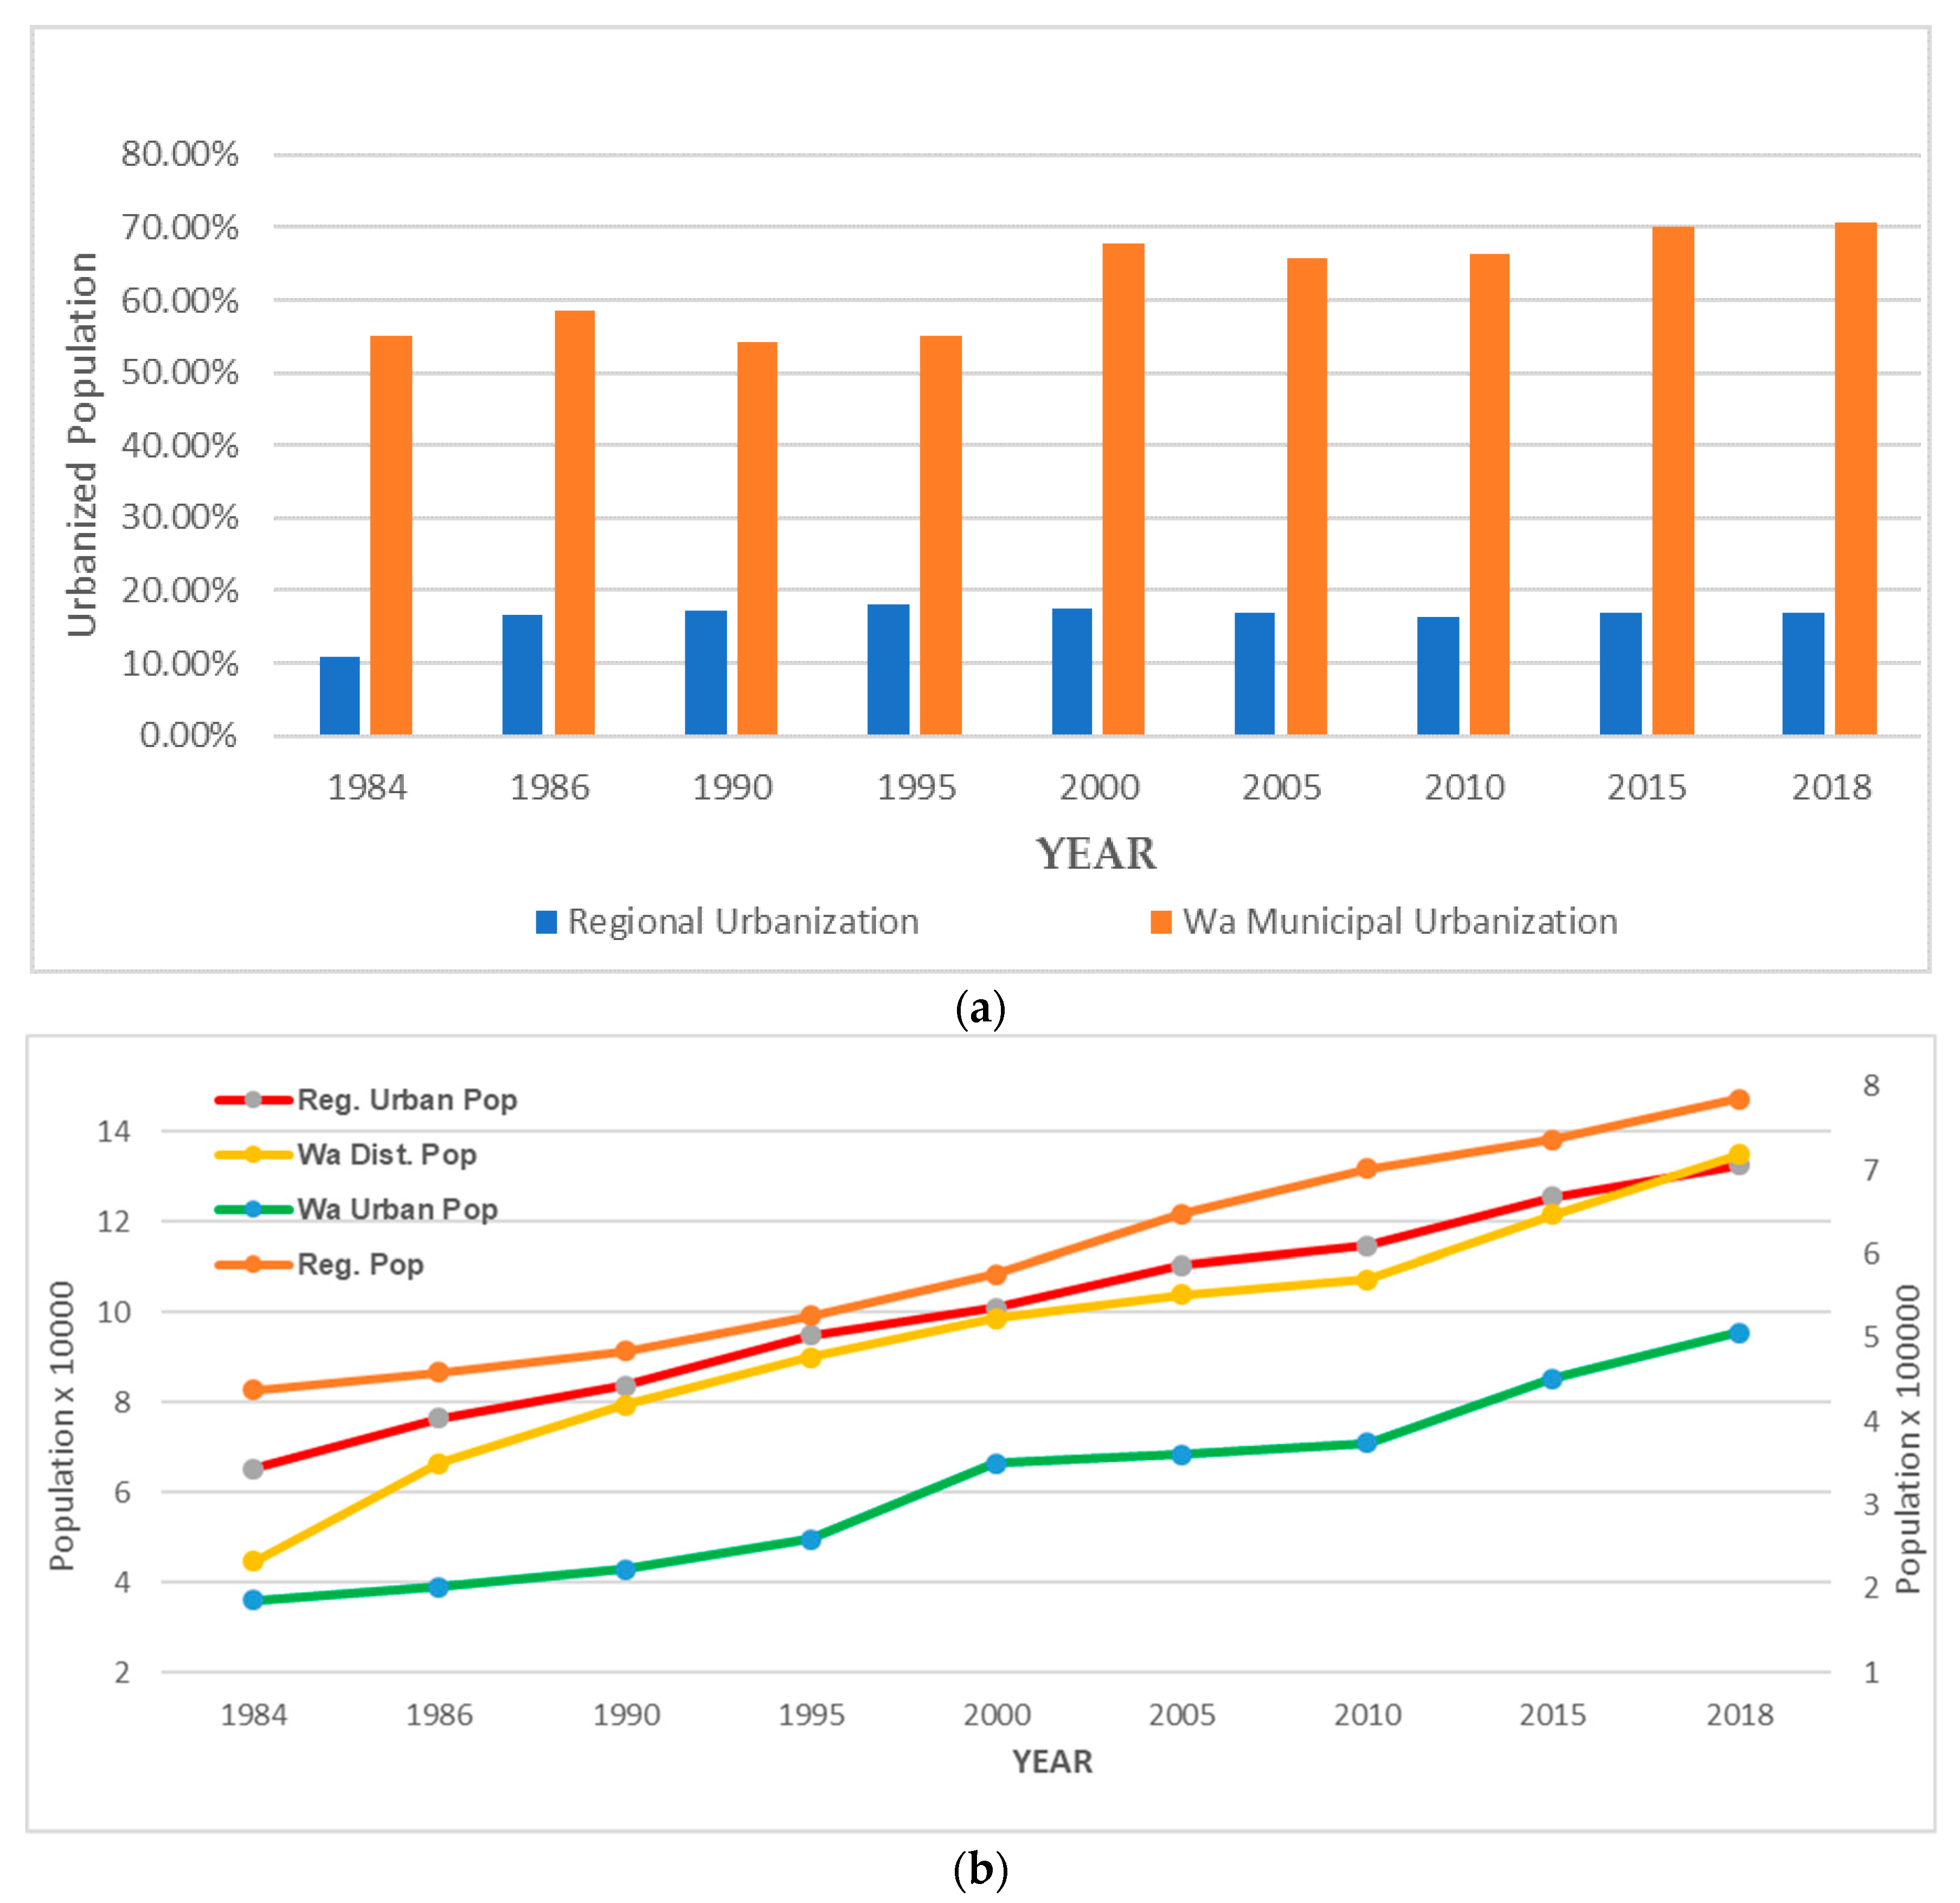
In 1984, only the area within the central district, now the municipal had good roads and a few urban facilities hence such a high urban population, as shown in Table 4 above. This led to a lot of the village folks coming to settle within the town. Notice in Figure 14 how the trend of district and regional population follow similar growth. Wa urban population depicts similar rise. Impervious area coverage from the proposed algorithm is shown in Table 2, while Table 5 shows the impervious rate analyses results. Population analysis have been added in columns 2 and 3 of Table 5. In Figure 13 it is clear that there is an addition within each analyzed period. This compared to Figure 15, shows that the amount of change within some periods were great while others were minimal.
Wa municipality is one of the urban areas of Ghana that has seen a significant increase in population partly due to the establishment of the Wa Polytechnic and the University for Development Studies. There is a clear distinction between Wa District (until 2004), Wa municipal (since 2004) and Wa township (eternal). However, some researchers tend to confuse these names when commenting on their land area or size. Wa township is the ‘central business district’ of the Wa municipal which was carved out of Wa District. Wa township has remained the capital town of the Upper West Region since its creation in 1983. Likewise, in land size terms Wa township is smaller than Wa municipal which is also smaller than the then Wa District (does not exist anymore).

4.3. Accuracy Assessment of Results

The use of the visual interpretation of the binary images as presented in Section 4.1. Visual examination shows that the contrast between the white (ISA) areas and the darker (pervious surface areas) areas. Impervious surface responds well to light does show whitish zones while pervious surfaces are the darker areas. Table 6 shows the maximum and minimum pixel values of the various algorithms. Table 3 shows the comparison of accuracy performance of these indices.
As shown in Table 6 the worst performing index is EBBI since it produced zero even as the highlighted feature and mostly negative values. Although UI produced positive maximum values, all of them were above +1 which shows an over estimation. NBAI maximum figures were mostly zero meaning it could not properly discriminate between built-up areas and background. The closest well performed index to ISEI is NBI which produced both positive and negative values as maximum and minimum, respectively. Usually with such application of indices the binary image pixel values will range from −1 and +1. Target feature are the highlighted thus will usually be representing pixels close to +1 while the background is either mostly 0 or less than 0.

5. Discussion

5.1. Established Satellite ISA Extraction Indexes

UI usually is not used alone but in conjunction with normalized difference vegetation index NDVI; however, this relationship cannot be quantified as a single index, since it is visually assessed using the UI–NDVI diagram [61]. With EBBI there is still a problem with heterogeneous terrains in distinguishing bare land mixed with dried vegetation [38]. NDBI is limited by the semiautomatic approach which depend on training samples [62]. The performance of NBI and NBAI are strongly affected by drier month images [63] where there is difficulty to differentiate between bare land and urban areas. Scenes with some pixel values of zero, end up giving blank or plain result especially with most normalized equations or index algorithms. This was experienced in this study also as shown in Figure 7 of 2005 results where three algorithms produced a blank result because of the scan line off effect in ETM+ images where some pixel values have 0 as DN value.

5.2. Impervious Surface Extraction Index (ISEI)

Depending on the target within the environment, in a given wavelength, sensors record the reflected part of the energy from the spectrum of incident energy. The apparent reflectance, or reflectance at the TOA, provides that part of the solar energy reflected by Earth’s surface and the atmosphere at the level of the satellite sensor. Conversion into reflectance enables image normalization in an interval of continuous values between 0 and 1 and thus the comparison of the images. Ratio indexes suppress the background features while highlighting the targeted feature, in that the bands sensitive to the targeted feature is kept as the numerator while the bands that absorb energy from background features are kept as the denominator enhancing the properties more. The bands chosen for this index were carefully considered in these advantages. The NIR wavelength from multispectral sensors reflects vegetation very strongly. In Equation (6), this band is kept as a denominator to suppress the background vegetation.
Data-rich SWIR imagery is ideal for locating, categorizing, and classifying man-made features. They are very useful for discerning differences in bare earth and for telling what is wet and what is dry in a scene, one more important reason dry season images were preferred. SWIR bands reveal information that is not visible to the naked eye to unlock critical information. These wavelengths penetrate smoke and haze, so decisions can be made with confidence as easily as possible. The special property enables high-confidence decision-making with information not available from other bands. From the results presented under Section 4, it can be seen that a lot of rocks and bare soil are exposed but the discrimination by ISEI is better, in that it was able to suppress the background better, highlighting the town center better than the peripherals which is an indication of less imperviousness if any at the peripherals. At worse exposed bare land with very similar pixel values to impervious areas are even very faintly shown. ISEI works well both on medium resolution and on high-resolution images. The use of dry season images is deliberate, to test the robustness in discriminating exposed rocks and bare soil because as a developing town, a lot of construction works is ongoing.
Some extraction index such as NDVI results in −1 and +1, other indexes simply range between 0 and +1. The range of the binary results is always between these figures. The background features in a scene is usually represented by minimum range values, while the targeted features are represented by maximum range values. Table 6 gives the minimum and maximum values of the binary result of the extraction index. ISEI results show better suppression of background and a better highlight of impervious areas. Even with 2005, whereas some indexes could not produce any result, due to 0 DN values of some pixels, the proposed index showed robustness even though the scanline off reduced the spectral reflectance of the bands. Finally, the proposed index does not use a combined effect of more indexes.

5.3. Indices Accuracy Performance

In reference to Table 3 (full results in Appendix A), TP and TN are always good in they show how a good representation the classification is. The higher their value the better the situation. FP are just false representation and with iterative methods, these could be easily corrected. However, false negative actually mean a false representation, in that a pervious pixel has been categorized as an impervious pixel and vice versa. This is actually the error representation of these algorithms. Therefore, specificity value is 60% means that 4 of every 10 pervious pixels are in reality are miss-labeled as impervious pixels and 6 are correctly labeled as pervious pixels. A sensitivity value is 70% means that 3 of every 10 impervious pixel in reality are missed by the algorithm and 7 labeled as impervious pixels. A precision value of 80% means that on average, 2 of every 10 impervious pixel labeled by the algorithm is pervious, and 8 is impervious. An accuracy value of 90% means that 1 of every 10 labels is incorrect, and 9 is correct. The agreement performance between the training samples and the delineated urban area is displayed in Table 3. The minimum overall accuracy for comparable five indices is 73.85% while the maximum is 84.62%. This is 10.77% and 4.00% less, respectively, compared to the proposed index ISEI. This type of assessment has been comprehensively explained by [55]. Again, NBI performed closely better to ISEI than the other indices. Maximum accuracy achieved for ISEI is 94.00% and a minimum of 90.00%.

5.4. Impact of Decentralization on Impervious Surface Areas

The Wa township is also growing as also demonstrated by [64]. Usually, the growth factor is a quantity factor by which a quantity multiplies itself over time whereas GR, on the other hand, is the addend by which that quantity changes over time. The urban growth for the initial 3 and 4 years after the creation of the regional capital is 4.12% and 5.59% for 1984–1986 and 1986–1990, respectively. These growths declined for the period 1990–2000 largely due to the economic hardship the country experienced. The average annual increase of imperviousness is 1.10% which translate to 0.35 km2 per year over the 34 years, which compares to the 0.27 km2 per year results achieved by [46]. The CR in this study for the period 1986–2010 is 42.05% which is slightly higher than the 34.15% results obtained by [46] for the period 1986–2011. However, it should be noted that the mapping accuracy achieved in that study for built-up was 84.85% whereas, as high 94.00% accuracy was achieved in this study. Population increase does not essentially mean an increase in imperviousness but can be an indicator of urban sprawl and expansion. This is clearly shown in column 3 of Table 4 where the district population GR is highest for the period 1995–2000 but does not correspond proportionally to the increase in imperviousness. Now, the built-up and imperviousness of the district or municipality has expanded beyond the Wa township or the central business district [64] if it is compared with the area as quoted by [46].
The adoption of the National Urban Policy Framework has coincided with the formulation and implementation of numerous projects and programs that directly affect urban development [65]. Utilities such as water supply have been aggressively pursued [58] which rates compare to other big cities such as Accra and Kumasi. It is, therefore, estimated that between 2010 and 2030, a period of 20 years, the government will be able to increase the urban share of the population from 52% to 65% [66], which evidence is shown in Table 4. The built-up area of the municipality increased by 8.37 km2 between 1984 and 1986 which compares to 6.14 km2 in 1986 obtained by [67]. The same author obtained 20.12 km2 increase in 2001 compared to our results of 35.09 km2 by 2000. The slight differences may be due to the inherent errors, both intrinsic and extrinsic, associated with the methods used for the classifications and the quality of the validation or training samples used. Any community or city urbanizing at these rates is very fast and shows the effective implementation of the decentralization policy in Ghana. For instance, the significant increase in imperviousness (urbanization) can be attributed to the establishment of the Wa Polytechnic and the University for Development Studies which have attracted a lot of people into the municipality, and most importantly the implementation of decentralizing in that part of the country.
Research has proven that decentralization links to growth, inequality, and political stability [68], as supported by the assertion that rapid urbanization in Africa is associated with low levels of economic development, short life expectancy, poor nutrition, and low levels of education [69]. This, however, is not the case for Wa District and in Ghana as a whole as decentralization, development and economic transformation are all achieved and improved together [70].

6. Conclusions

The causes of the massive change within urban centers are partly due to human-related events such as urbanization and expansion of agricultural lands. However, urbanization is another process of land transformation that can be monitored using Landsat data. With the continuous global urbanization, sustainable development will increasingly depend on the management of urban growth within low to middle-income countries with the fastest projected urbanization. In meeting the needs of the growing urban populations many of these countries will face a lot of challenges. These include providing energy, housing, transportation and other infrastructure as well as jobs and basic services of better schools (education), health care, decent work, and a safe environment. This is very critical in achieving the goals of the 2030 agenda for sustainable development. The integrated policy of decentralization needs to be adopted and implemented to improve the economic, social, and environmental standards of the people, whether rural or urban.
In this paper, the impact of decentralization has been quantified by measuring and analyzing the ISA coverage within Wa District (Wa municipal by 2004), the recent newly created district until 2019. Both Landsat and Sentinel images were used to test the flexibility of the index. Again, stripes on ETM+ images were not filled. An image with some cloud presence was also used, all in the attempt to examine the robustness of the discriminating capacity of the proposed index. The proposed method of ISEI made use of the special properties of SWIR and NIR bands. It performed an average of 7.39% better than the other indices. Additionally, the automation in model maker makes it simple to apply. Furthermore, this index can be used to develop images that can serve as a reference for other classification techniques to check their accuracy. Impact of decentralization has not been studied in the context of impervious surface growth and expansion, especially in West Africa and Africa. This study, therefore, provides a foundation for more of such approach for evaluation. Decentralization has had a great impact on the Wa District or municipality, with an average annual increase in built-up expansion intensity of 0.24% and an average urban growth of 4.42%, for such a small area.
The method was found to be very simple to compute and easy to implement with a high accuracy; however, it needs more testing particularly in a more complex heterogeneous landscape to help differentiate more land-cover classes [71]. It may be useful to test the method on fused data of continuous reflectance for the evaluation of urban hydrological systems as explored by [72,73]. In addition, future work involves how the index can be integrated into Google Earth engine platform so the issue of data availability, preprocessing, and cloud removal can be dealt with within a single platform. This will improve the computation time. Again, the issue of training sample could be eliminated since this extraction index does not use training samples for classification but simply highlights the targeted feature for delineation. Another angle of application could be the use on very high-resolution images.

Author Contributions

The following were the various contributions from the authors; conceptualization, N.Y.D.T. and N.S.; methodology, N.Y.D.T.; validation, N.S., C.C. and N.Y.D.T.; formal analysis, C.C. and N.N.L.; investigation, C.C. and N.N.L.; resources, N.Y.D.T.; writing—original draft preparation, N.Y.D.T.; writing—review and editing, O.A.; visualization, O.A.; supervision, O.A. All authors have read and agreed to the published version of the manuscript.

Funding

This research was funded by National Key R&D plan on Strategic International Scientific and Technological Innovation Cooperation special project (2016YFE0202300), Fundamental Research Funds for the Central Universities (2042016kf0179 and 2042016kf1019), the Wuhan Chen Guang project (2016070204010114), the Guangzhou Science and Technology project (201604020070), the Special Task of Technical Innovation in Hubei Province project (2016AAA018), and the Natural Science Foundation of China (61671332, 41771452 and 41771454).

Acknowledgments

Gratitude is expressed to Zhenfeng Shao for his administrative role, securing funds and support for the success of this research.

Conflicts of Interest

With regards to the materials, methods, and data used in the whole of this paper. The authors declare no conflict of interest. Although this study was funded, the funders had no role in the design of the study; in the collection, analyses, or interpretation of data; in the writing of the manuscript, or in the decision to publish the results.

Appendix A

Table A1. Full results of Statistical Evaluation of Classification Accuracy Assessment.
YEARUINBAIEBBINBINDBIISEIINDICATORS
198490.48%84.78%86.96%87.50%82.61%92.00%Precision
74.51%81.25%83.33%89.36%82.61%90.20%Sensitivity
71.43%58.82%64.71%66.67%52.94%71.43%Specificity
81.72%82.98%85.11%88.42%82.61%91.09%F-Score
73.85%75.38%78.46%83.08%74.60%86.15%Overall Accuracy
198684.78%80.39%91.30%87.50%81.25%92.16%Precision
82.98%87.23%85.71%85.71%82.98%88.68%Sensitivity
61.11%44.44%75.00%62.50%50.00%66.67%Specificity
83.87%86.67%88.42%86.60%82.11%90.38%F-Score
76.92%78.38%83.08%80.00%73.85%84.62%Overall Accuracy
199086.27%89.29%88.89%90.91%85.71%93.22%Precision
83.02%89.29%90.57%90.91%90.57%94.83%Sensitivity
58.82%57.14%62.50%66.67%52.94%66.67%Specificity
84.62%89.29%89.72%90.91%88.07%94.02%F-Score
77.14%82.86%84.06%85.71%81.43%90.00%Overall Accuracy
199594.44%87.27%87.50%92.86%90.74%92.98%Precision
87.93%90.57%89.09%91.23%89.09%94.64%Sensitivity
75.00%58.82%58.82%69.23%66.67%66.67%Specificity
91.07%88.89%88.29%92.04%89.91%93.91%F-Score
85.71%82.86%81.94%87.14%84.29%89.71%Overall Accuracy
200092.59%87.27%92.86%89.09%92.45%93.44%Precision
87.72%90.57%88.14%92.45%84.48%95.00%Sensitivity
73.33%63.16%69.23%64.71%71.43%66.67%Specificity
90.09%88.89%90.43%90.74%88.29%94.21%F-Score
84.72%83.33%84.72%85.71%81.94%90.28%Overall Accuracy
2005---61.22%78.57%93.65%Precision
---69.77%77.19%92.19%Sensitivity
---48.65%47.83%75.00%Specificity
---65.22%77.88%92.91%F-Score
---60.00%68.75%88.75%Overall Accuracy
201084.85%89.23%87.69%88.06%86.15%95.71%Precision
86.15%87.88%87.69%90.77%87.50%95.71%Sensitivity
50.00%63.16%60.00%60.00%57.14%80.00%Specificity
85.50%88.55%87.69%89.39%86.82%95.71%F-Score
77.65%82.35%81.18%83.53%80.00%92.94%Overall Accuracy
201589.86%90.00%90.14%93.24%88.57%96.10%Precision
88.57%87.50%91.43%94.52%88.57%96.10%Sensitivity
65.00%61.11%65.00%70.59%60.00%76.92%Specificity
89.21%88.73%90.78%93.88%88.57%96.10%F-Score
83.33%82.22%85.56%90.00%82.22%93.33%Overall Accuracy
201891.14%89.29%92.50%92.68%91.36%96.51%Precision
87.80%91.46%90.24%92.68%90.24%96.51%Sensitivity
61.11%50.00%66.67%66.67%61.11%78.57%Specificity
89.44%90.36%91.36%92.68%90.80%96.51%F-Score
83.00%84.00%86.00%88.00%85.00%94.00%Overall Accuracy

References

  1. Terfa, B.K.; Chen, N.; Liu, D.; Zhang, X.; Niyogi, D. Urban Expansion in Ethiopia from 1987 to 2017: Characteristics, Spatial Patterns, and Driving Forces. Sustainbility 2019, 11, 2973. [Google Scholar] [CrossRef] [Green Version]
  2. Sumari, N.S.; Xu, G.; Ujoh, F.; Korah, P.I.; Ebohon, O.J.; Lyimo, N.N. A Geospatial Approach to Sustainable Urban Planning: Lessons for Morogoro Municipal. Sustainbility 2019, 11, 6508. [Google Scholar] [CrossRef] [Green Version]
  3. Lemoine, G.; Conway, J.; Baker, J. Agricultural Monitoring—The Need For Better Information; Remote Sensing Exploitation Division, ESRIN: Noordwijk, The Netherlands, 1995. [Google Scholar]
  4. Liu, J.G.; Mason, P.J. Essential Image Processing and GIS for Remote Sensing; John Wiley & Sons, Inc.: Hoboken, NJ, USA, 2009. [Google Scholar] [CrossRef] [Green Version]
  5. Uduporuwa, M. An Analysis of Urban Growth and Urbanization in the Sabaragamuwa Province, Sri Lanka. Sabaragamuwa Univ. J. 2010, 9, 115–132. [Google Scholar] [CrossRef]
  6. Angel, S.; Parent, J.; Civco, D.L.; Blei, A.; Potere, D. The Dimensions of Global Urban Expansion: Estimates and Projections for All Countries, 2000–2050. Prog. Plan. 2011, 75, 53–107. [Google Scholar] [CrossRef]
  7. Ghosh, S.; Singh, P.; Kumari, M. Assessment of Urban Sprawl and Land Use Change Dynamics, Using Remote Sensing Technique. A Study of Kolkata and Surrounding Perphery, WB, India. In Proceedings of the NGCT 2017: 3rd International Conference on Next Generation Computing Technologies-Springer, Scopus, SCIE, Web of Science, DBLP, Dehradun, India, 30–31 October 2017. [Google Scholar]
  8. United Nations office for Economic and Social Affairs. World Urbanizationprospects: The 2018 Revision; United Nations: New York, NY, USA, 2018. [Google Scholar]
  9. Frazer, L. Paving Paradise: The Peril of Impervious Surfaces. Environ. Health Perspect. 2005, 113, 8. [Google Scholar] [CrossRef] [PubMed] [Green Version]
  10. Salahat, E.; Qasaimeh, M. Recent Advances in Features Extraction and Description Algorithms: A Comprehensive Survey. In Proceedings of the 2017 IEEE International Conference on Industrial Technology (ICIT), Toronto, ON, Canada, 22–25 March 2017; pp. 1059–1063. [Google Scholar] [CrossRef] [Green Version]
  11. Shao, Z.; Liu, C. The Integrated Use of DMSP-OLS Nighttime Light and MODIS Data for Monitoring Large-Scale Impervious Surface Dynamics: A Case Study in the Yangtze River Delta. Remote Sens. 2014, 6, 9359–9378. [Google Scholar] [CrossRef] [Green Version]
  12. Liu, C.; Shao, Z.; Chen, M.; Luo, H. MNDISI: A Multi-Source Composition Index for Impervious Surface Area Estimation at the Individual City Scale. Remote Sens. Lett. 2013, 4, 803–812. [Google Scholar] [CrossRef]
  13. Zhang, L.; Weng, Q.; Shao, Z. An Evaluation of Monthly Impervious Surface Dynamics by Fusing Landsat and MODIS Time Series in the Pearl River Delta, China, from 2000 to 2015. Remote Sens. Environ. 2017, 201, 99–114. [Google Scholar] [CrossRef]
  14. Shao, Z.; Wang, L.; Wang, Z.; Deng, J. Remote Sensing Image Super-Resolution Using Sparse Representation and Coupled Sparse Autoencoder. IEEE J. Sel. Top. Appl. Earth Obs. Remote Sens. 2019, 12, 2663–2674. [Google Scholar] [CrossRef]
  15. Song, X.P.; Sexton, J.O.; Huang, C.; Channan, S.; Townshend, J.R. Characterizing the Magnitude, Timing and Duration of Urban Growth from Time Series of Landsat-Based Estimates of Impervious Cover. Remote Sens. Environ. 2016, 175, 1–13. [Google Scholar] [CrossRef]
  16. Li, X.; Zhou, Y.; Zhu, Z.; Liang, L.; Yu, B.; Cao, W. Mapping Annual Urban Dynamics ( 1985–2015 ) Using Time Series of Landsat Data. Remote Sens. Environ. 2018, 216, 674–683. [Google Scholar] [CrossRef]
  17. Forest, A.; Woodcock, C.E.; Macomber, S.A.; Pax-lenney, M.; Cohen, W.B. Monitoring Large Areas for Forest Change Using Landsat: Generalization across Space, Time and Landsat Sensors. Remote Sens. Environ. 2001, 78, 194–203. [Google Scholar]
  18. Mohammady, S.; Delavar, M.R.; Pijanowski, B.C. Urban Growth Modelling with Artificial Neural Network and Logistic Regression. Case Study: Sanandaj City, Iran. Rom. Rev. Reg. Stud. 2013, IX, 47–60. [Google Scholar]
  19. Mertes, C.M.; Schneider, A.; Sulla-Menashe, D.; Tatem, A.J.; Tan, B. Detecting Change in Urban Areas at Continental Scales with MODIS Data. Remote Sens. Environ. 2015, 158, 331–347. [Google Scholar] [CrossRef]
  20. Malik, R.; Ali, M. The Impact of Urbanization on Agriculture Sector: A Case Study of Peshawar, Pakistan. J. Resour. Dev. Manag. 2015, 8, 79–86. [Google Scholar]
  21. Li, D.; Ma, J.; Cheng, T.; van Genderen, J.L.; Shao, Z. Challenges and Opportunities for the Development of MEGACITIES. Int. J. Digit. Earth 2018, 15, 1–14. [Google Scholar] [CrossRef]
  22. Shao, Z.; Fu, H.; Fu, P.; Yin, L. Mapping Urban Impervious Surface by Fusing Optical and SAR Data at the Decision Level. Remote Sens. 2016, 8, 945. [Google Scholar] [CrossRef] [Green Version]
  23. Yin, J.; Yin, Z.; Zhong, H.; Xu, S.; Hu, X.; Wang, J.; Wu, J. Monitoring Urban Expansion and Land Use/Land Cover Changes of Shanghai Metropolitan Area during the Transitional Economy (1979–2009) in China. Environ. Monit. Assess. 2011, 177, 609–621. [Google Scholar] [CrossRef]
  24. Dafflon, B.; Madies, T. The Political Economy of Decentralization in Sub-Saharan Africa—A New Implementation Model in Burkina Faso, Ghana, Kenya and Senegal; Africa Development Forum: Washigton, DC, USA, 2013. [Google Scholar]
  25. Hanna, N.; Picciotto, R.; Crook, R.; Manor, J. Democratic Decentralization. In Making Development Work: Development Learning in a Word of Poverty and Wealth; Taylor & Francis Group: New York, NY, USA, 2019. [Google Scholar] [CrossRef]
  26. Andr’e, P.; Mespl’e-Somps, S. Politics and the Geographic Allocation of Public Funds in a Semi-Democracy. The Case of Ghana, 1996–2004. In The Allocation of Public Goods and National Elections in Ghana; MPRA: Paris, France, 2011. [Google Scholar]
  27. Dickovick, J.T.; Wunsch, J.S. Decentralization in Africa: The Paradox of State Strength; Lynne Rienner Publisher: Boulder, CO, USA, 2015; Volume 45. [Google Scholar] [CrossRef]
  28. Crook, R. Decentralisation and Good Governance. In Federalism in a Changing World-Learning from Each Other; McGill-Queen’s University Press: Montreal, QC, Canada; Kingston, ON, Canada; London, UK, 2002. [Google Scholar]
  29. Ahwoi, K. Rethinking Decentralization and Local Government in Ghana—Proposals for Amendment; AfricalPortal: Accra, Ghana, 2010. [Google Scholar]
  30. Hoffman, B.D.; Metzroth, K.M. The Political Economy of Decentralization in Ghana; Centre for Democracy and Civil Society, Georgetown University: Washington, DC, USA, 2010. [Google Scholar]
  31. Schug, F.; Okujeni, A.; Hauer, J.; Hostert, P.; Nielsen, J.Ø.; van der Linden, S. Mapping Patterns of Urban Development in Ouagadougou, Burkina Faso, Using Machine Learning Regression Modeling with Bi-Seasonal Landsat Time Series. Remote Sens. Environ. 2018, 210, 217–228. [Google Scholar] [CrossRef]
  32. Sanyare, F.N. Decentralised Local Governance and Community Development: Empirical Perspectives from Northern Ghana. Univ. Manch. 2013. [Google Scholar] [CrossRef] [Green Version]
  33. White, M.D.; Greer, K.A. The Effects of Watershed Urbanization on the Stream Hydrology and Riparian Vegetation of Los Peñasquitos Creek, California. Landsc. Urban Plan. 2006, 74, 125–138. [Google Scholar] [CrossRef]
  34. Sugg, Z.P.; Finke, T.; Goodrich, D.C.; Moran, M.S.; Yool, S.R.; Finke, T.; Sugg, Z.P.; Yool, S.R.; Moran, M.S. Mapping Impervious Surfaces Using Object-Oriented Classification in a Semiarid Urban Region. Photogramm. Eng. Remote Sens. 2014, 80, 343–352. [Google Scholar] [CrossRef] [Green Version]
  35. Wu, C. Normalized Spectral Mixture Analysis for Monitoring Urban Composition Using ETM+ Imagery. Remote Sens. Environ. 2004, 93, 480–492. [Google Scholar] [CrossRef]
  36. Waqar, M.M.; Mirza, J.F.; Mumtaz, R.; Hussain, E. Development of New Indices for Extraction of Built-Up Area {&} Bare Soil. Open Access Sci. Rep. 2012, 1, 1–4. [Google Scholar] [CrossRef]
  37. Sun, Z.; Wang, C.; Guo, H.; Shang, R. A Modified Normalized Difference Impervious Surface Index (MNDISI) for Automatic Urban Mapping from Landsat Imagery. Remote Sens. 2017, 9, 942. [Google Scholar] [CrossRef] [Green Version]
  38. As-syakur, A.R.; Adnyana, I.W.S.; Arthana, I.W.; Nuarsa, I.W. Enhanced Built-UP and Bareness Index (EBBI) for Mapping Built-UP and Bare Land in an Urban Area. Remote Sens. 2012, 4, 2957–2970. [Google Scholar] [CrossRef] [Green Version]
  39. Sekertekin, A.; Abdikan, S.; Marangoz, A.M. The Acquisition of Impervious Surface Area from LANDSAT 8 Satellite Sensor Data Using Urban Indices: A Comparative Analysis. Environ. Monit. Assess. 2018, 190, 1–13. [Google Scholar] [CrossRef]
  40. Zha, Y.; Gao, J.; Ni, S. Use of Normalized Difference Built-up Index in Automatically Mapping Urban Areas from TM Imagery. Int. J. Remote Sens. 2003, 24, 583–594. [Google Scholar] [CrossRef]
  41. Hidayati, I.N.; Suharyadi, R.; Danoedoro, P. Developing an Extraction Method of Urban Built-Up Area Based on Remote Sensing Imagery Transformation Index. Forum Geogr. 2018, 32, 96–108. [Google Scholar] [CrossRef] [Green Version]
  42. Chen, J.; Li, M.; Liu, Y.; Shen, C.; Hu, W. Extract Residential Areas Automatically by New Built-up Index. In Proceedings of the 2010 18th International Conference on Geoinformatics, Geoinformatics 2010, Beijing, China, 18–20 June 2010. [Google Scholar]
  43. Wang, Z.; Gang, C.; Li, X.; Chen, Y.; Li, J. Application of a Normalized Difference Impervious Index (NDII) to Extract Urban Impervious Surface Features Based on Landsat TM Images. Int. J. Remote Sens. 2015, 36, 1055–1069. [Google Scholar] [CrossRef]
  44. UNDP. Wa Municipal Assembly Human Development Report 2011 And The Attainment Of Mdgs Development; UNDP: New York, NY, USA, 2011. [Google Scholar]
  45. Ghana Statistical Service. District Analytical Report—Wa Municipality; Ghana Statistical Service: Washington, DC, USA, 2014. [Google Scholar]
  46. Aduah, M.S.; Aabeyir, R. Land Cover Dynamics in Wa Municipality, Upper West Region of Ghana. Res. J. Environ. Earth Sci. 2012, 4, 658–664. [Google Scholar]
  47. Azmi, R.; Alami, O.B.; Saadane, A.E.; Kacimi, I.; Chafiq, T. A Modified and Enhanced Normalized Built-up Index Using Multispectral and Thermal Bands. Indian J. Sci. Technol. 2016, 9, 1–10. [Google Scholar] [CrossRef]
  48. Sameen, M.I.; Pradhan, B. A Novel Built-up Spectral Index Developed by Using Multiobjective Particle-Swarm-Optimization Technique. In Proceedings of the 8th IGRSM International Conference and Exhibition on Remote Sensing & GIS (IGRSM 2016) IOP, Kuala Geospatial, Malaysia, 13–14 April 2016. [Google Scholar]
  49. Phiri, L.; Nyirenda, E. Urban Growth Analysis for Lusaka City Using Remote Sensing and GIS. In Proceedings of the DII-2015 Conference (Development and Investment in Infrastructure Conference), Livingstone, Zambia, 16–18 September 2015. [Google Scholar]
  50. Li, L.; Lu, D.; Kuang, W. Examining Urban Impervious Surface Distribution and Its Dynamic Change in Hangzhou Metropolis. Remote Sens. 2016, 8, 265. [Google Scholar] [CrossRef] [Green Version]
  51. Xu, H.; Lin, D.; Tang, F.; Wei, C. Remote Sensing of Impervious Surface Dynamics of Xiamen City, Southeastern China. In Proceedings of the 2011 19th International Conference on Geoinformatics, Shanghai, China, 24–26 June 2011. [Google Scholar]
  52. Feeney, G. Demography 101: Population Growth Rates. The Demography-Statistics-Information Technology Letter. New York, NY, USA, 2014. Available online: http://demographer.com/dsitl/09-d101-population-growth-rates/DSITL09-D101-population-growth-rates.pdf (accessed on 12 September 2019).
  53. Liu, S.H.; Wu, C.J.; Shen, H.Q. A GIS BasedM Odel of Urban Land Use Growth in Be Ij Ing. Acta Geogr. Sin. 2000, 55, 407–416. [Google Scholar]
  54. Baratloo, A.; Hosseini, M.; Negida, A.; El Ashal, G. Part 1: Simple Definition and Calculation of Accuracy, Sensitivity and Specificity. Emerg 2015, 3, 48–49. [Google Scholar]
  55. Tharwat, A. Classification Assessment Methods. Appl. Comput. Inform. 2018. [Google Scholar] [CrossRef]
  56. Twumasi, N.Y.D.; Shao, Z.; Altan, O. Mapping Built-Up Areas Using Two Band Ratio on Landsat Imagery of Accra in Ghana from 1980 to 2017. Appl. Ecol. Environ. Res. 2019, 17, 13147–13168. [Google Scholar]
  57. Hu, Q.; Wu, W.; Xia, T.; Yu, Q.; Yang, P.; Li, Z.; Song, Q. Exploring the Use of Google Earth Imagery and Object-Based Methods in Land Use/Cover Mapping. Remote Sens. 2013, 5, 6026–6042. [Google Scholar] [CrossRef] [Green Version]
  58. Oteng-Ababio, M.; Owusu, G.; Asafo, D.M. Following the Footsteps: Urbanisation of Wa Municipality and Its Synergism in Risk Accumulation, Uncertainties and Complexities in Urban Ghana. Jàmbá J. Disaster Risk Stud. 2019, 11, 1–10. [Google Scholar] [CrossRef] [Green Version]
  59. Ghana Statistical Service. 2010 Population & Housing Census-National Analytical Report; Ghana Statistical Service: Washington, DC, USA, 2013. [Google Scholar]
  60. UNFPA. Population-Situation—Analysis-(PSA): A Conceptual and Methodological Guide; UNFPA: New York, NY, USA, 2010. [Google Scholar]
  61. Stathakis, D.; Perakis, K.; Savin, I. Efficient Segmentation of Urban Areas by the VIBI. Int. J. Remote Sens. 2012, 33, 6361–6377. [Google Scholar] [CrossRef]
  62. He, C.; Shi, P.; Xie, D.; Zhao, Y. Improving the Normalized Difference Built-up Index to Map Urban Built-up Areas Using a Semiautomatic Segmentation Approach. Remote Sens. Lett. 2010, 1, 213–221. [Google Scholar] [CrossRef] [Green Version]
  63. Valdiviezo-N, J.C.; Téllez-Quiñones, A.; Salazar-Garibay, A.; López-Caloca, A.A. Built-up Index Methods and Their Applications for Urban Extraction from Sentinel 2A Satellite Data: Discussion. J. Opt. Soc. Am. A 2017, 35, 35. [Google Scholar] [CrossRef] [PubMed]
  64. Dapilah, F.; Nielsen, J.Ø.; Akongbangre, J.N. Peri-Urban Transformation and Shared Natural Resources: The Case of Shea Trees Depletion and Livelihood in Wa Municipality, Northwestern Ghana. African Geogr. Rev. 2018, 6812, 1–16. [Google Scholar] [CrossRef]
  65. Owusu, G.; Oteng-Ababio, M. Moving Unruly Contemporary Urbanism Toward Sustainable Urban Development in Ghana by 2030. Am. Behav. Sci. 2015, 59, 311–327. [Google Scholar] [CrossRef]
  66. Peprah, K. Urban Sprawl of Wa, Ghana: Socio-Economic Implications for Small-Holder Farmers. Int. J. Innov. Res. Dev. 2014, 3, 277–287. [Google Scholar]
  67. Osumanu, I.K.; Akongbangre, J.N.; Tuu, G.N.Y.; Owusu-Sekyere, E. From Patches of Villages to a Municipality: Time, Space, and Expansion of Wa, Ghana. Urban Forum 2019, 30, 57–74. [Google Scholar] [CrossRef]
  68. Schneider, A. Decentralization: Conceptualization. Stud. Comp. Int. Dev. 2003, 38, 32–56. [Google Scholar] [CrossRef]
  69. Hanna, W.J.; Hanna, J.L. An Interdisciplinary Approach, Urban Dynamincs in Black Africa, 2nd ed.; Taylor & Francis Group: Abingdon, UK, 1981. [Google Scholar]
  70. The World Bank Group. Rising through Cities in Ghana: Ghana Urbanization Review Overview Report; The World Bank Group: Washington, DC, USA, 2015. [Google Scholar]
  71. Sinha, P.; Verma, N.K.; Ayele, E. Urban Built-up Area Extraction and Change Detection of Adama Municipal Area Using Time-Series Landsat Images. Int. J. Adv. Remote Sens. GIS 2016, 5, 1886–1895. [Google Scholar] [CrossRef]
  72. Shao, Z.; Fu, H.; Li, D.; Altan, O.; Cheng, T. Remote Sensing Monitoring of Multi-scale Watersheds Impermeability for Urban Hydrological Evaluation. Remote Sens. Environ. 2019, 232, 111338. [Google Scholar] [CrossRef]
  73. Shao, Z.; Cai, J.; Fu, P.; Hu, L.; Liu, T. Deep Learning-based Fusion of Landsat-8 and Sentinel-2 Images for a Harmonised Surface Reflectance Product. Remote Sens. Environ. 2019, 235, 111425. [Google Scholar] [CrossRef]
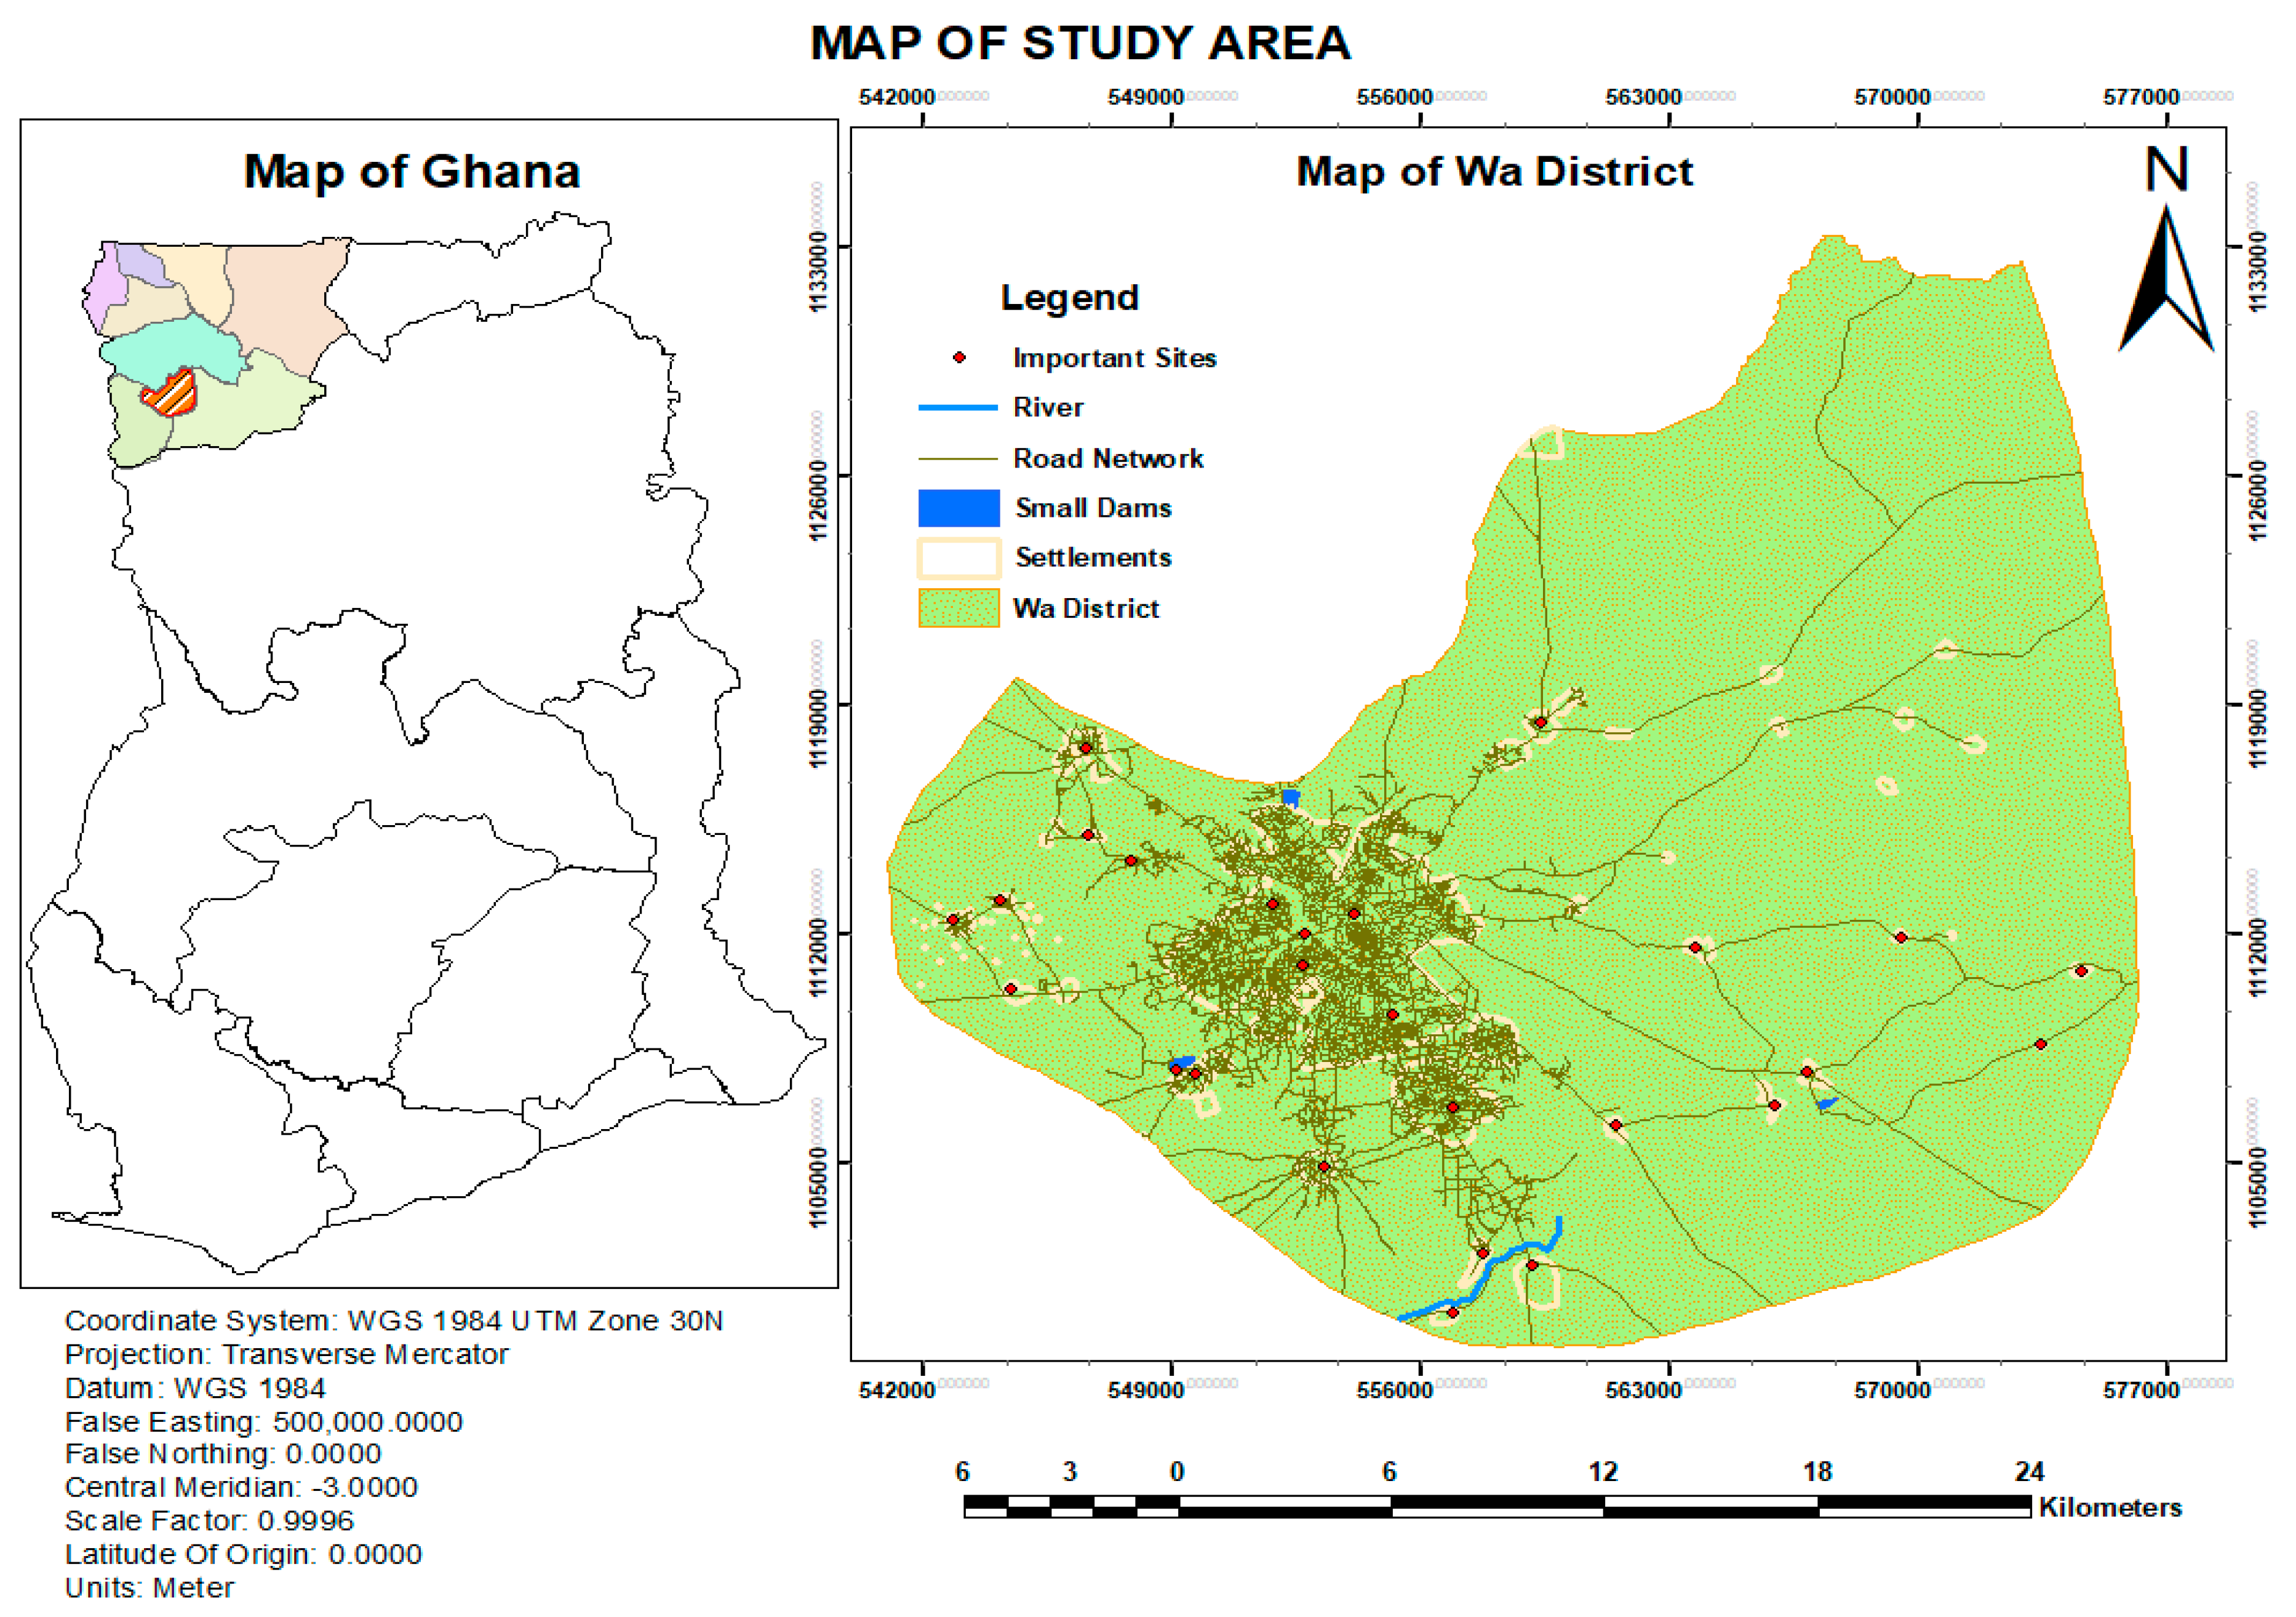
Figure 1. Left: Map of Ghana with Wa District shown in red. Right: Map of Wa District showing some urban features.
Sustainability 12 00380 g001
Figure 2. Methodology Workflow and Processes.
Sustainability 12 00380 g002
Figure 3. (a) Very small area results of index algorithms. A small community within Wa township. (b) Small area results of index algorithms. Wa Township enclosed in red box.
Sustainability 12 00380 g003
Figure 4. 1984 results of index algorithms. A year after establishment of Wa District.
Sustainability 12 00380 g004
Figure 5. 1986 results of index algorithms. Three years after the establishment of the Wa District.
Sustainability 12 00380 g005
Figure 6. 1995 results of index algorithms. Twelve years after the establishment of the Wa District, and nine years to the conversion to a municipal.
Sustainability 12 00380 g006
Figure 7. 2000 results of index algorithms. Seventeen years after the establishment of the Wa District and four years to the conversion to a municipal.
Sustainability 12 00380 g007
Figure 8. 2005 results of index algorithms. Twenty-two years after the establishment of the Wa District, and a year since conversion to a Municipal.
Sustainability 12 00380 g008
Figure 9. 2010 results of index algorithms. Twenty-seven years after the establishment of the Wa District, and six years since conversion to a Municipal.
Sustainability 12 00380 g009
Figure 10. 2015 results of index algorithms. Thirty-two years after the establishment of the Wa District, and Fifteen years since conversion to a Municipal.
Sustainability 12 00380 g010
Figure 11. 2018 results of index algorithms. Thirty-five years after the establishment of the Wa District, and Fifteen years since conversion to a Municipal.
Sustainability 12 00380 g011
Figure 12. 2018 Sentinel 2A results of index algorithms. S2A comes in TOA, so no conversion needed.
Sustainability 12 00380 g012
Figure 13. Graph of imperviousness growth rate for the Wa District.
Sustainability 12 00380 g013
Figure 14. (a) Graph of urbanized population for region and district. (b) Graph of urban population for region and district. NB: Reg. Pop is on the secondary axis (right axis).
Sustainability 12 00380 g014
Figure 15. Graph of imperviousness change rate for the Wa District.
Sustainability 12 00380 g015
Table 1. Information and Description of Data Used.
Band NameLandsat 5 TMLandsat 7 ETM+Landsat 8 OLISentinel 2A (1C)Pixel Size YearTypeAcquisition DateImage Size
BlueB1 (0.45–0.52)B1 (0.45–0.52)B2 (0.45–0.51)B2 (0.490)30; 101984TM 509/Sep/1984170 × 183
GreenB2 (0.52–0.60)B2 (0.52–0.60)B3 (0.53–0.59)B3 (0.560)30; 101986TM 520/Dec/1986170 × 183
RedB3 (0.63–0.69)B3 (0.63–0.69)B4 (0.64–0.67)B4 (0.665)30; 101990TM 515/Dec/1990170 × 183
NIR B4 (0.76–0.90)B4 (0.77–0.90)B5 (0.85–0.88)B8 (0.842)30; 101995TM 507/Aug/1995170 × 183
SWIR 1B5 (1.55–1.75)B5 (1.55–1.75)B6 (1.57–1.65)B11 (1.610)30; 202000ETM+18/Dec/2000170 × 183
SWIR 2B7 (2.08–2.35)B7 (2.09–2.35)B7 (2.11–2.29)B12 (2.190)30; 202005ETM+16/Dec/2005170 × 183
2010TM 522/Dec/2010170 × 183
2015OLI20/Dec/2015180 × 185
2018OLI12/Dec/2018180 × 185
2018SENT 2A21/Dec/2018100 × 100
NB: Landsat bands have pixel size of 30 m while Sentinel 2 bands have pixel sizes of 10 m and 20 m shown under column Pixel Size. Bands wavelengths are in micrometers (µm). Image sizes are in kilometers. These image data have an Universal Transverse Mercator (UTM) projection on the WGS 84 Datum. NIR is Near infrared, and SWIR is Shortwave infrared
Table 2. Results of area coverage of Imperviousness (Built-Up) for the three different area description.
YearBuilt-Up Areas (ISA) in km2Wa District (%) Wa Municipal (%)Wa Township (%)
1984201.893.7018.7334.81
1986210.203.8519.5036.24
1990221.964.0720.5938.27
1995230.244.2221.3639.70
2000236.984.3421.9840.86
2005250.964.6023.2843.27
2010264.654.8524.5545.63
2015277.815.0925.7747.90
2018285.155.2226.4549.16
NB: Total Land Area for Wa District = 5460 km2; Wa Municipal = 1078 km2; Wa Township = 580 km2. Upper West Region has an area of 18,476 km2.
Table 3. Statistical Evaluation of Classification Accuracy Assessment.
YEARUINBAIEBBINBINDBIISEIINDICATOR
198473.85%75.38%78.46%83.08%74.60%86.15%Overall Accuracy
198676.92%78.38%83.08%80.00%73.85%84.62%Overall Accuracy
199077.14%82.86%84.06%85.71%81.43%90.00%Overall Accuracy
199585.71%82.86%81.94%87.14%84.29%89.71%Overall Accuracy
200084.72%83.33%84.72%85.71%81.94%90.28%Overall Accuracy
2005---60.00%68.75%88.75%Overall Accuracy
201077.65%82.35%81.18%83.53%80.00%92.94%Overall Accuracy
201583.33%82.22%85.56%90.00%82.22%93.33%Overall Accuracy
201883.00%84.00%86.00%88.00%85.00%94.00%Overall Accuracy
NB: The full results with other indicators are shown in Appendix A.
Table 4. Statistical Evidence of Impact of Decentralization.
YearRegional PopulationWa Dist’ (Municipal)Regional Urban PopWa Urban PopulationRegional UrbanizationWa Mun. Urbanization
1984438,00865,354 47,74236,06710.9%55.19%
1986458,59466,44476,43138,95416.7%58.63%
1990 484,592 *79,37983,64942,95017.3%54.11%
1995526,34390,08494,95849,60518.0%55.07%
2000576,58398,675100,90266,44117.5%67.73%
2005 648,658 * 103,856 *110,48768,48617.0%65.94%
2010702,110107,214114,65371,05116.3%66.27%
2015737,215121,689125,54385,26117.0%70.06%
2018785,199135,000132,69895,49116.9%70.73%
Source: Figures are culled from [45,59,60]. * Estimated from Ghana Statistical Services (GSS) records.
Table 5. Imperviousness change and growth rates of Wa District (Municipality).
PeriodG R R. Pop.G R D. Pop.Change RateGrowth RateAnn. ISA Inc.Urban Growth
1984–19868.14%3.93%36.23%2.04%0.39%4.12%
1986–19904.62%5.00%38.09%1.37%0.27%5.59%
1990–19956.55%7.47%39.95%0.74%0.15%3.73%
1995–20003.08%15.73%41.34%0.58%0.13%2.93%
2000–20054.64%1.53%43.26%1.15%0.26%5.90%
2005–20101.87%1.86%45.83%1.07%0.25%5.46%
2010–20154.64%9.54%48.32%0.98%0.24%4.97%
2015–20182.81%5.83%50.22%0.87%0.23%2.64%
NB: GR R. Pop. = Regional Population Growth Rate; G R D. Pop. = District (Municipal) Population Growth Rate, Ann. ISA Inc. = Annual impervious surface area increase.
Table 6. Pixel Value Comparison of Algorithm Results.
YEARUINBAIEBBINBINDBIISEIRANGE
19841.1097200.00792120.24651800.648605max
0−0.439463−0.0424120−0.4486710min
19861.5774500.05137460.4948040.4793470.606685max
0−0.868018−0.0141180−0.2718270min
19901.6294100.05369240.4786640.7290150.681482max
0−1.01229−0.0202170−1.174610min
19951.4663400.02311870.442380.5842330.730034max
0−1.00185−0.0584130−1.031230min
20001.5523900.04733030.4268020.3059290.6879379max
0−0.96422−0.0118770−0.7564710min
20059.751931018.370.07834850.5991172.054050.785481max
−4.26604−20238−0.080975−5.12228−09172420min
20101.684350.01508070.00563700.4945650.3972090.620761max
0−0.933617−0.0257380−0.4670780min
20151.7986600.0912760.7179430.5108760.776112max
0−0.946106−0.2859840−0.4730980min
20181.7953100.09206770.5879830.5540110.8357515max
0−0.951719−0.0287920−0.374350min
2018 S2A1.829600.1073531.05930.568330.751928max
0−0.935889−0.0406780−0.4180550min
Range values: UI = −1 to +1; NBAI = −1 to 0; EBBI = −1 to +1; NBI = 0 to +1; NDBI = −1 to +1; ISEI = 0 to +1.