Research on Drilling Response Characteristics of Two-Wing PDC Bit

Abstract
:1. Introduction
2. Experimental Study
2.1. Experimental Apparatus
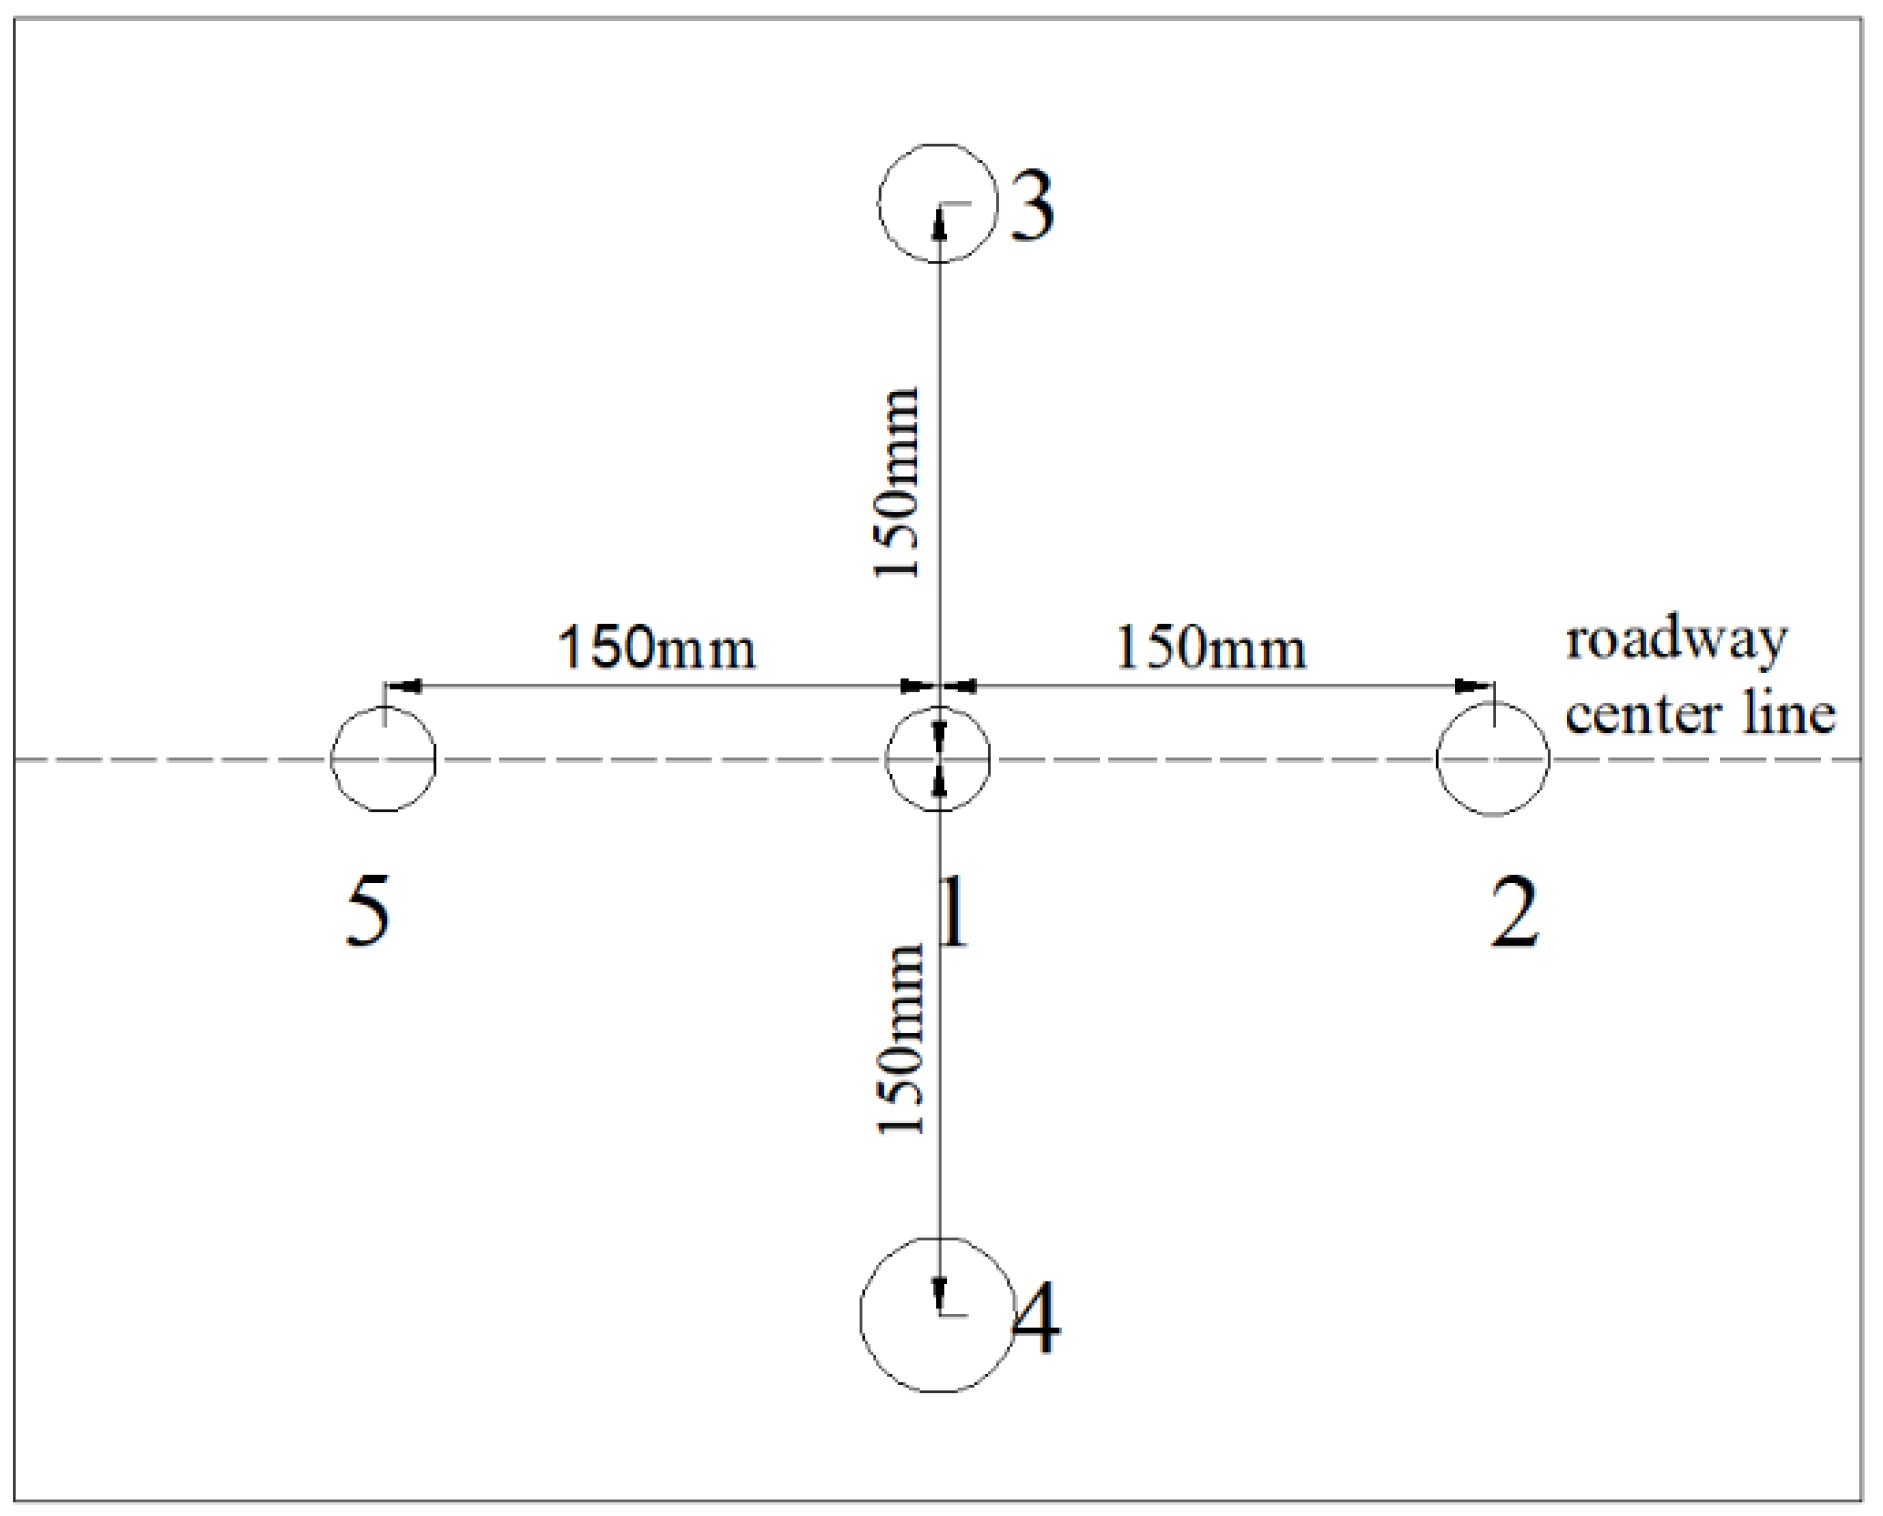
2.2. Experimental Program
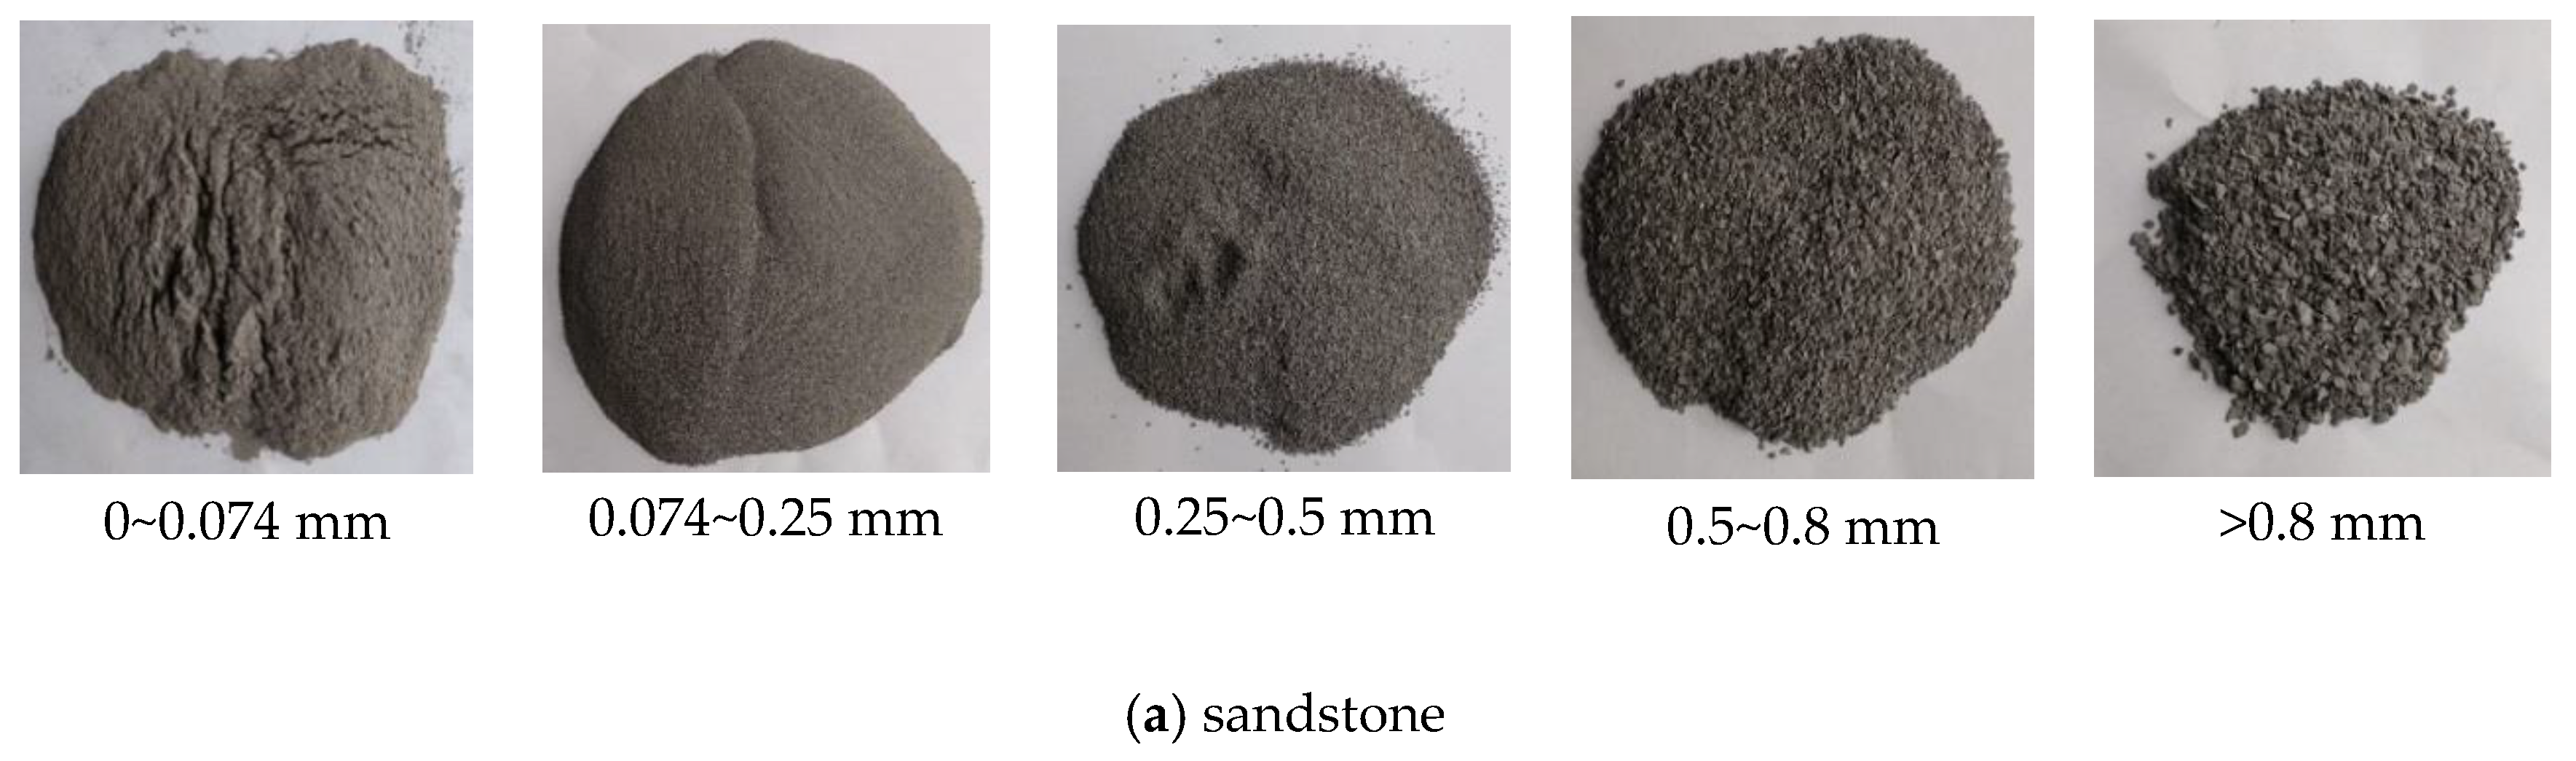
2.3. The Rock Cuttings Screening Method for Different Particles
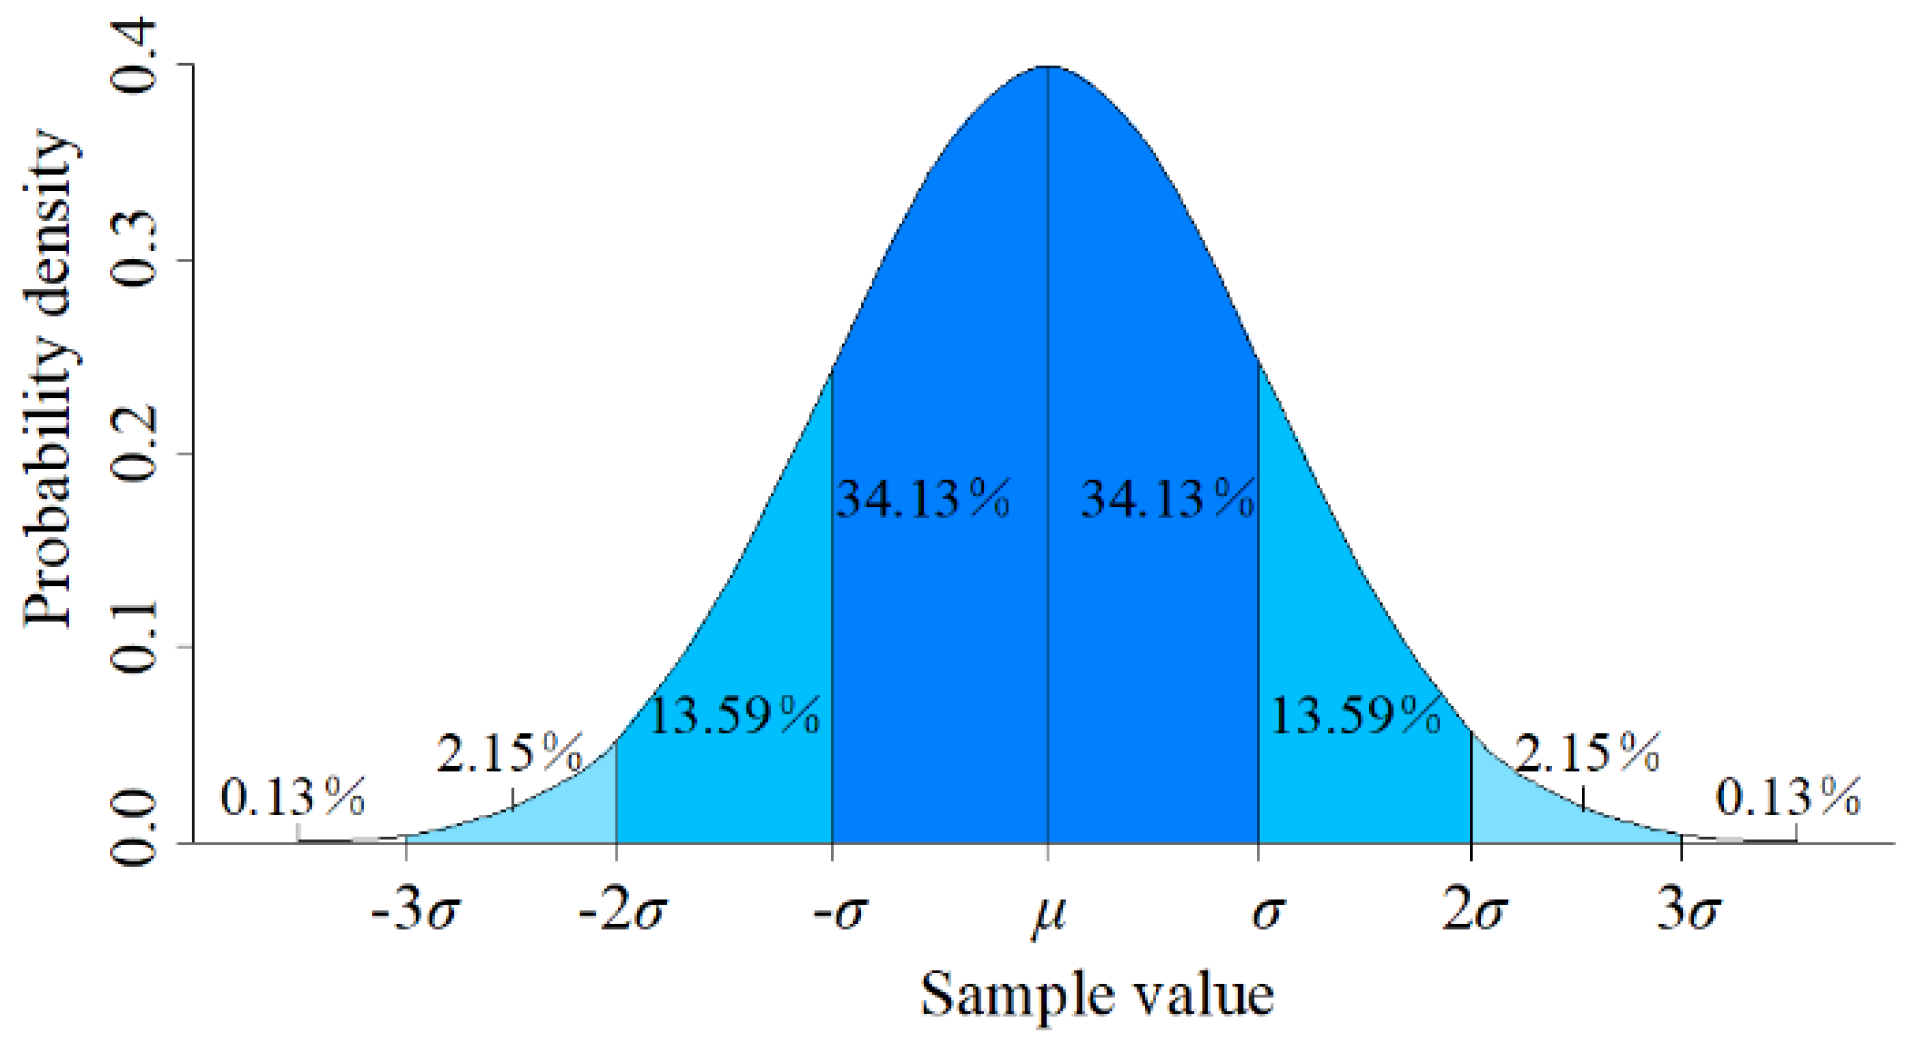
2.4. Data Processing Method
3. Experimental Results
3.1. Sound Response Characteristics
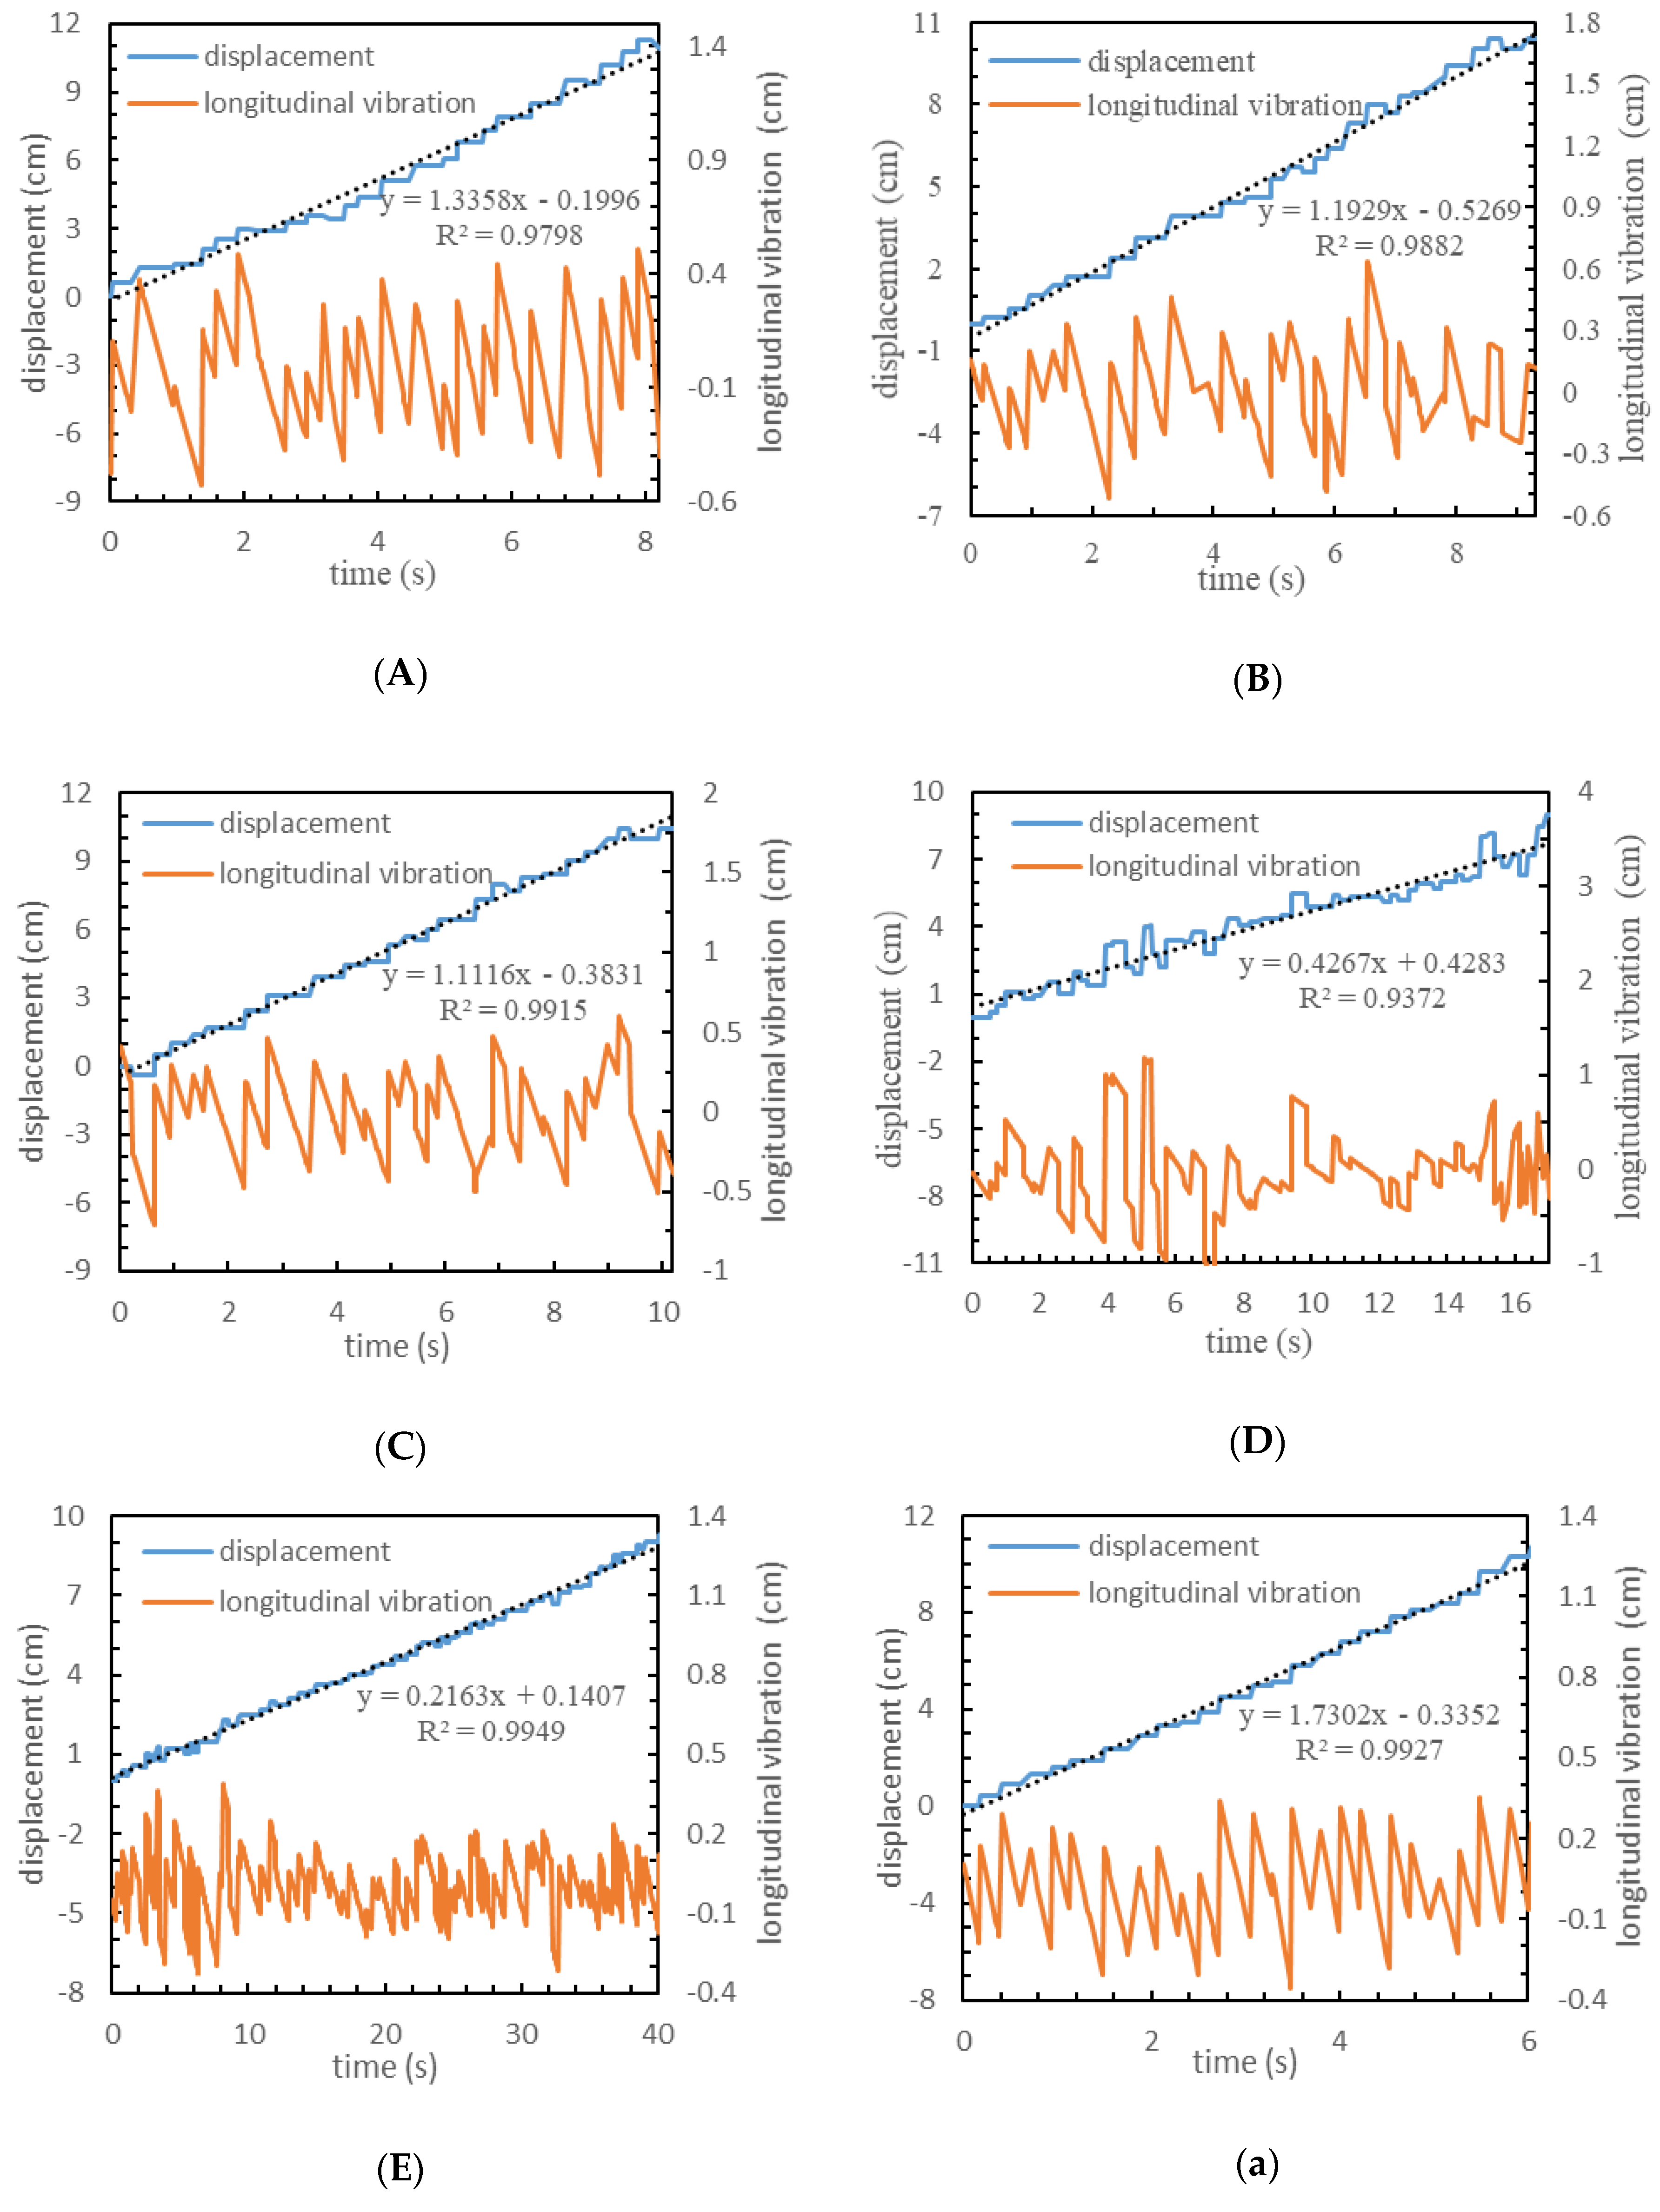
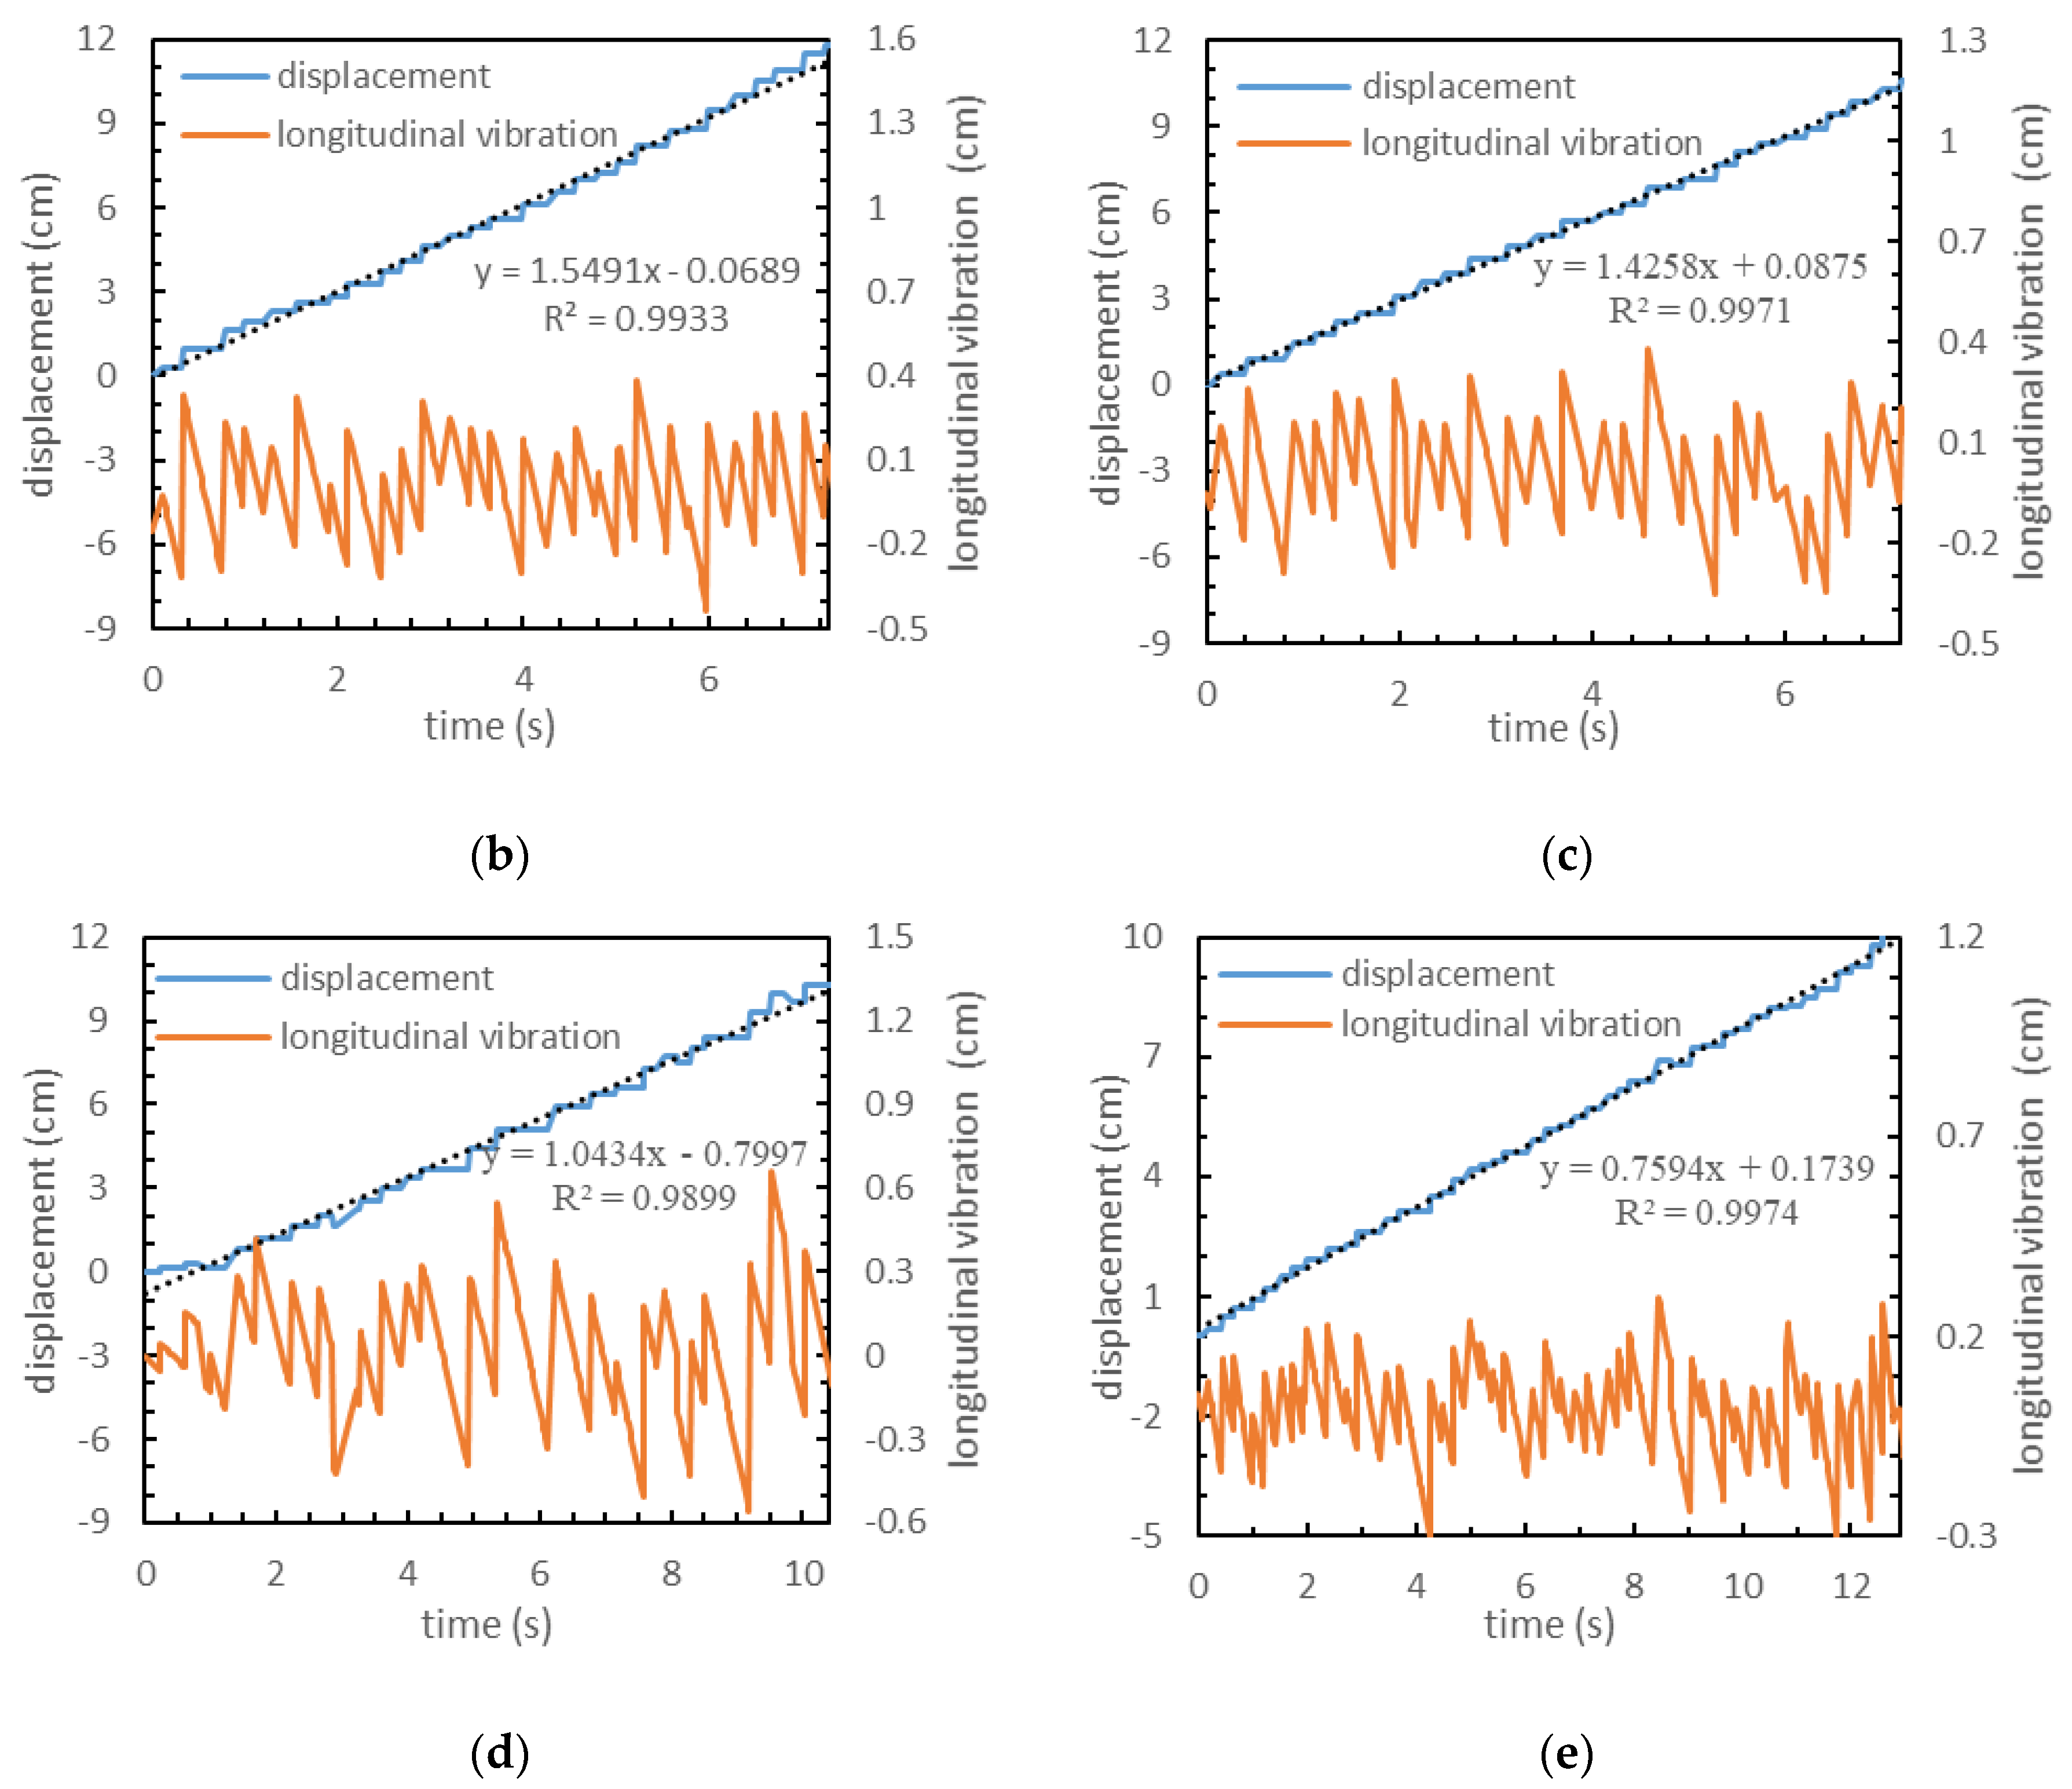
3.2. Vibration Response Characteristics
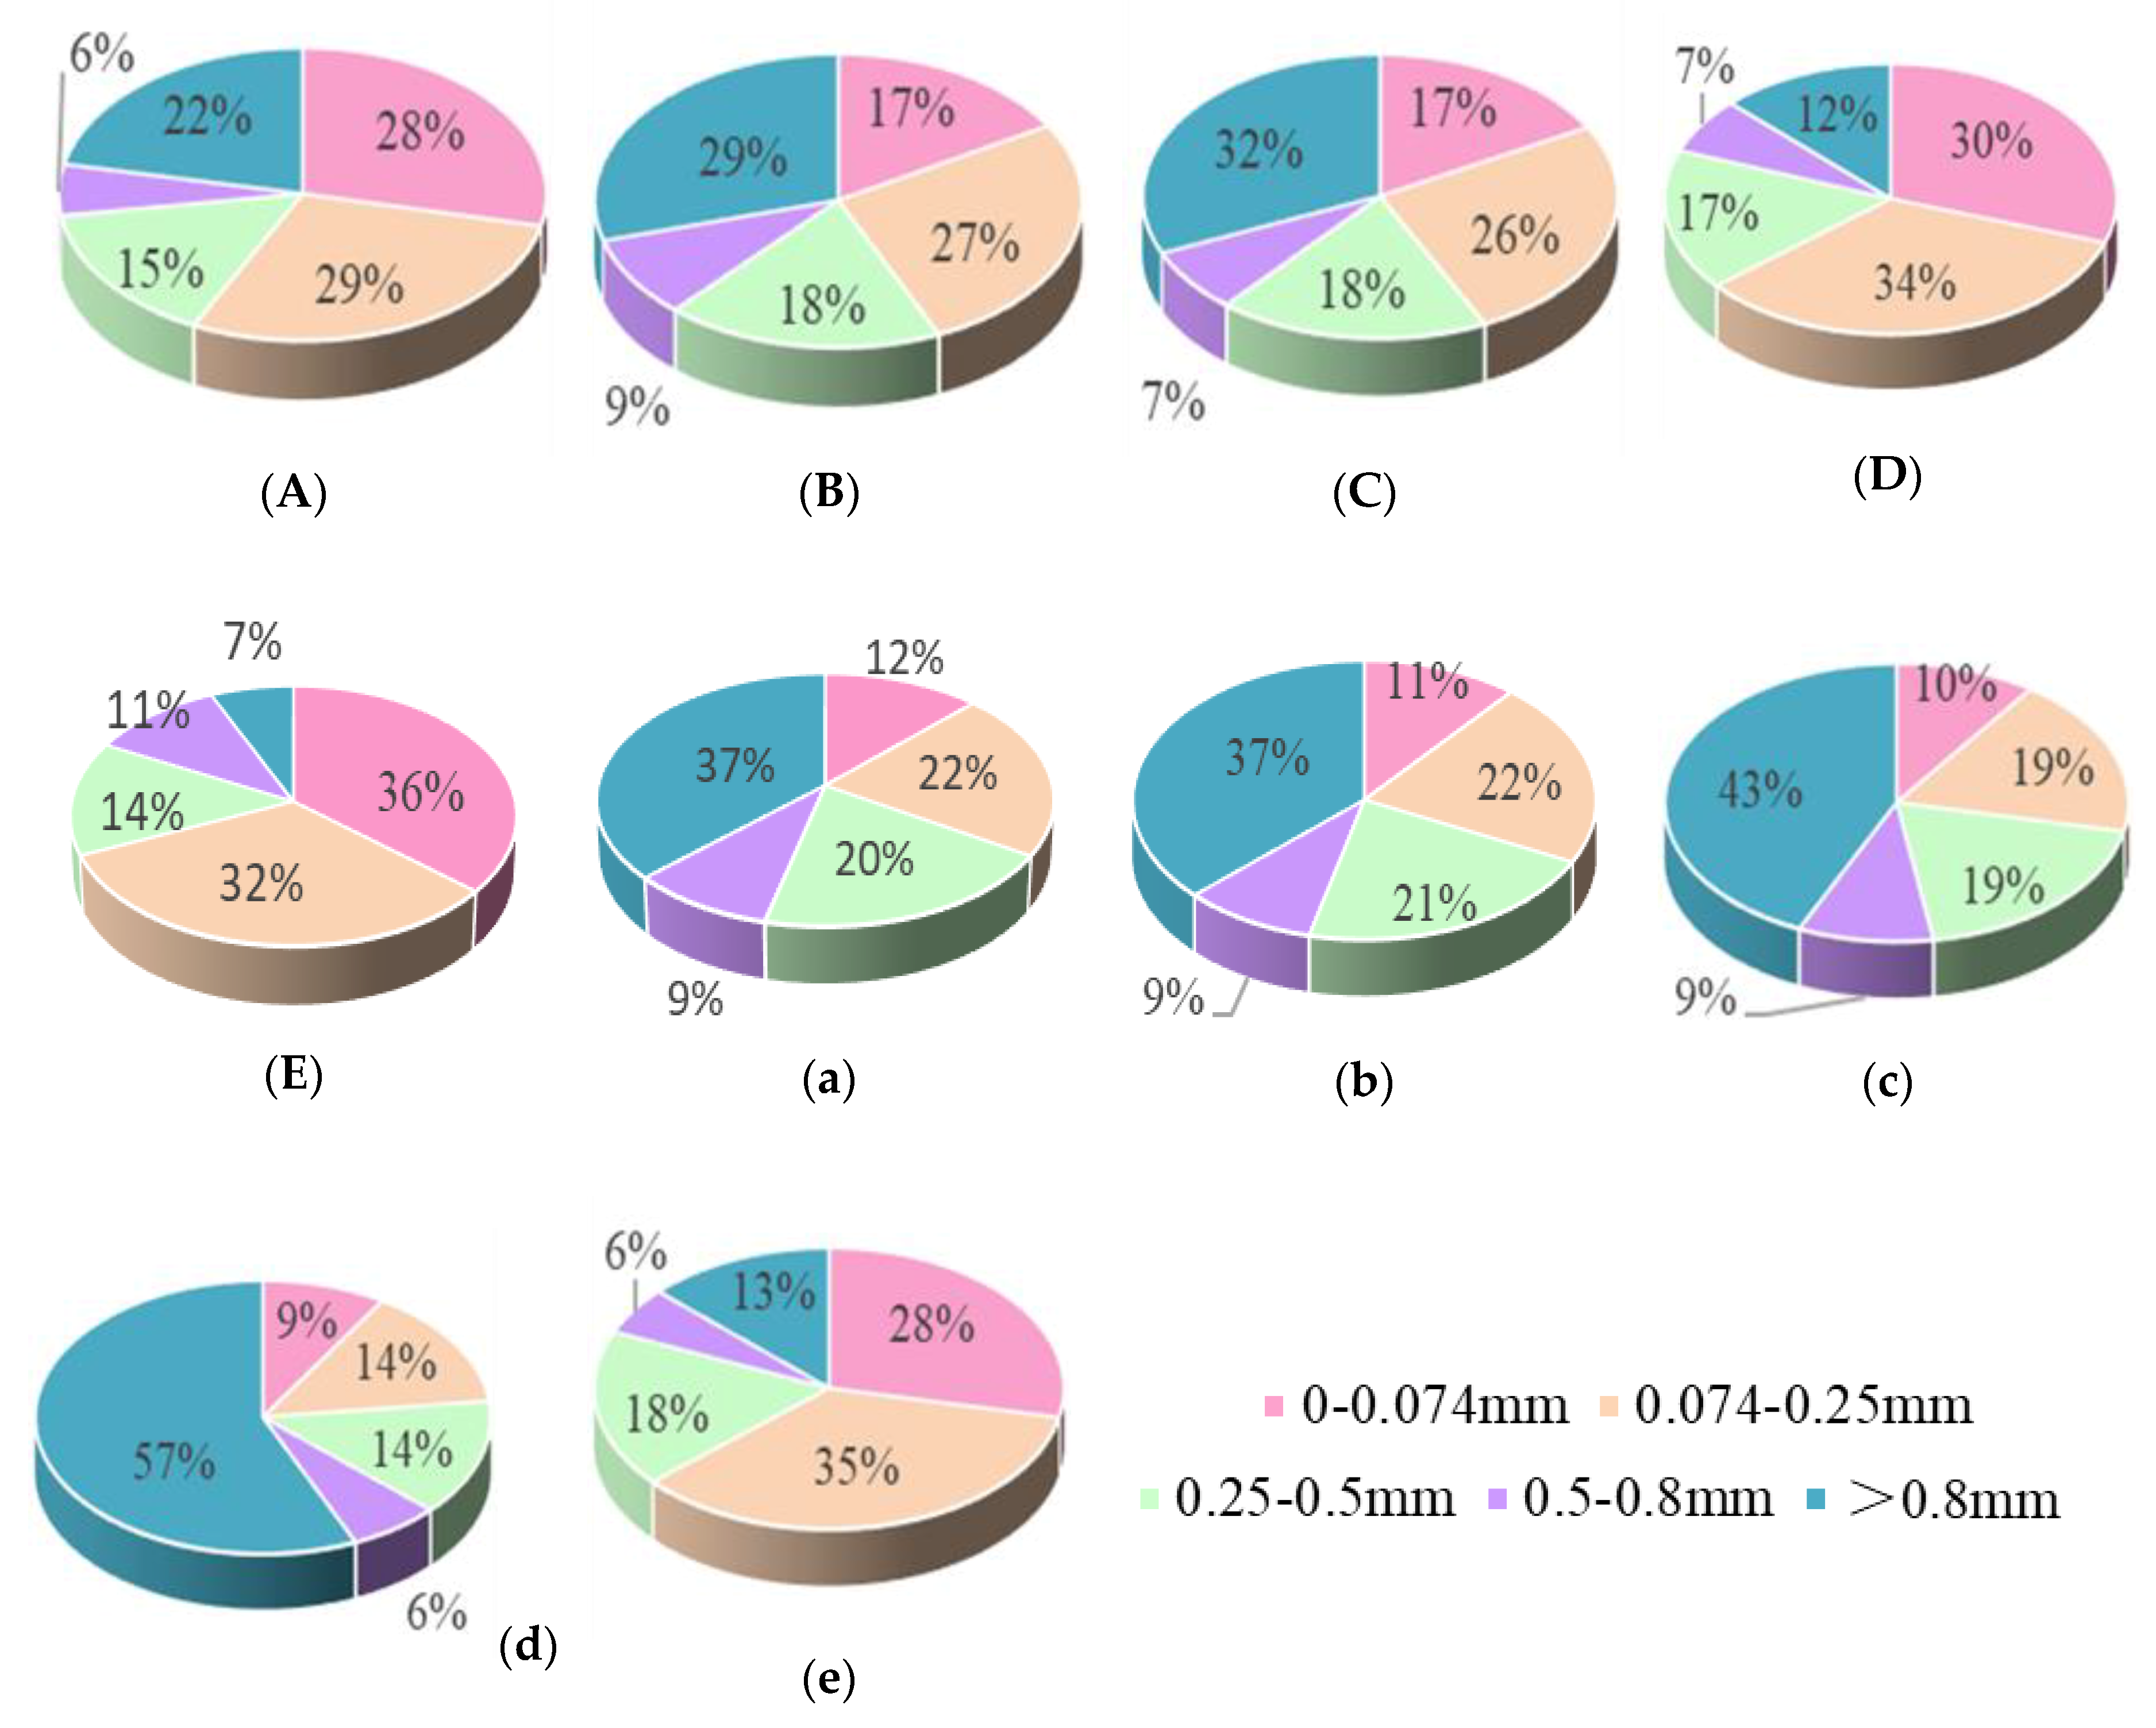
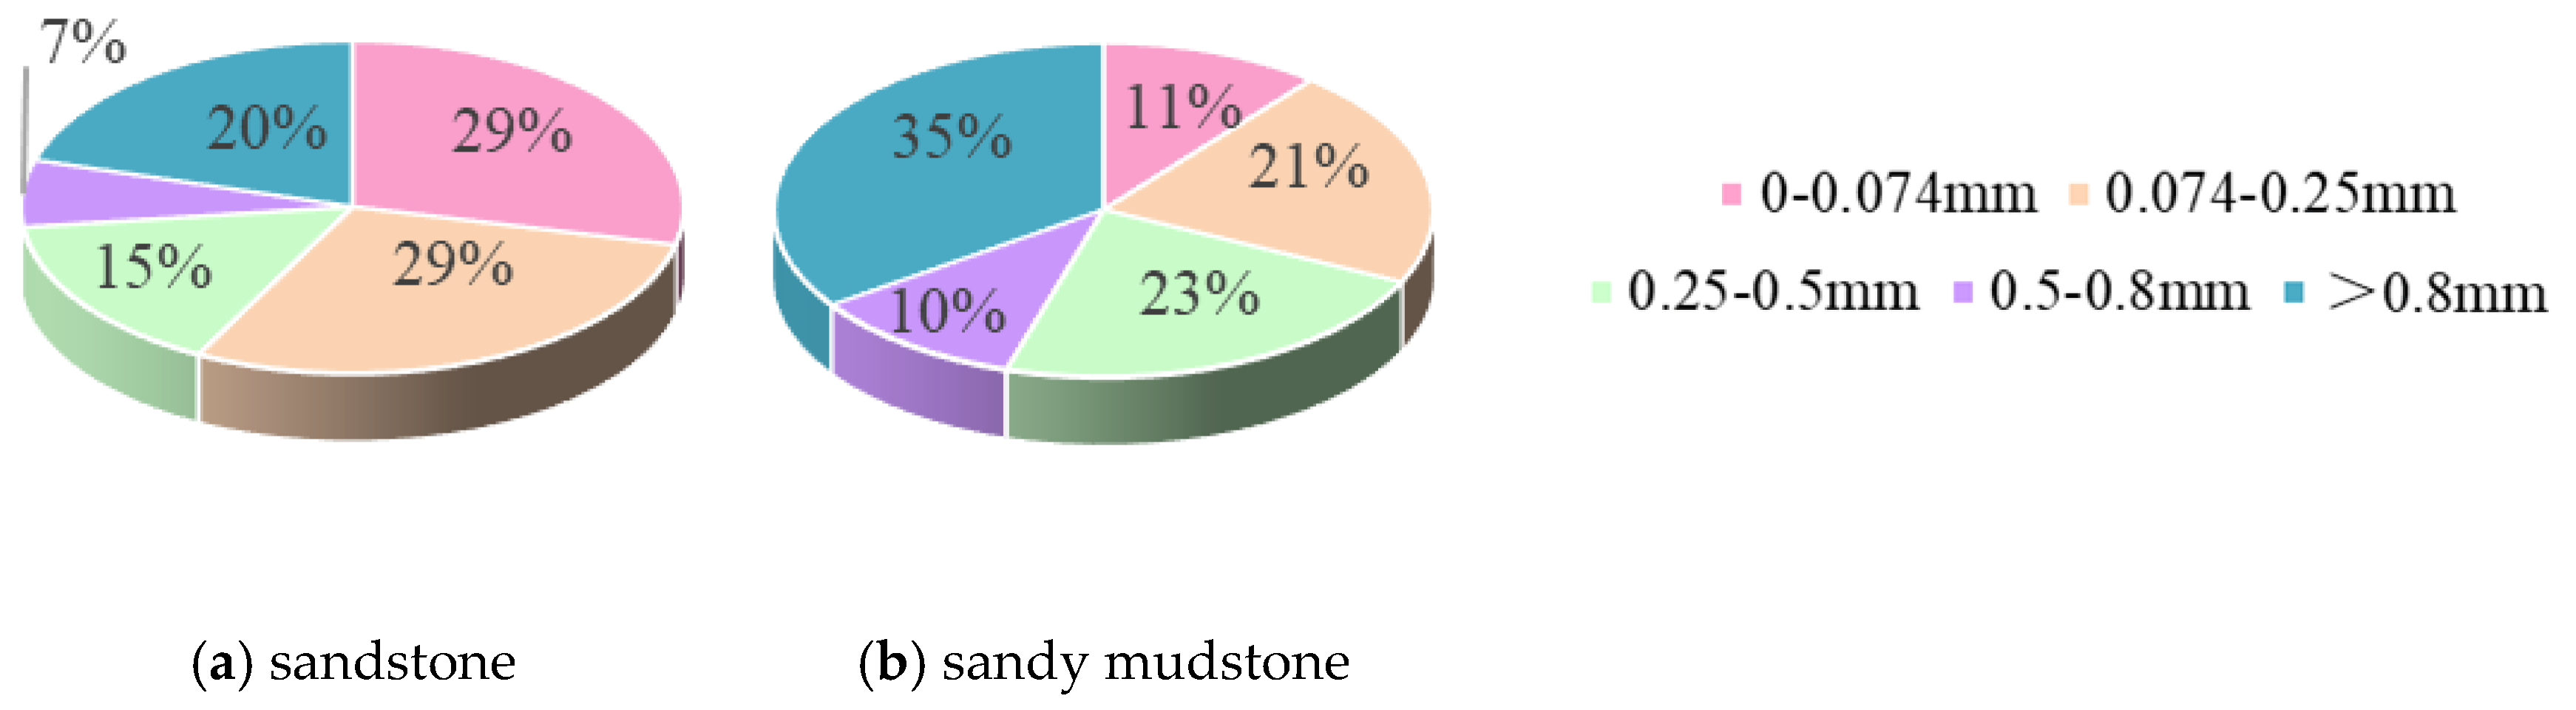
3.3. Distribution Characteristics of Cuttings Particles
3.4. Drilling Efficiency Analysis
4. Discussion
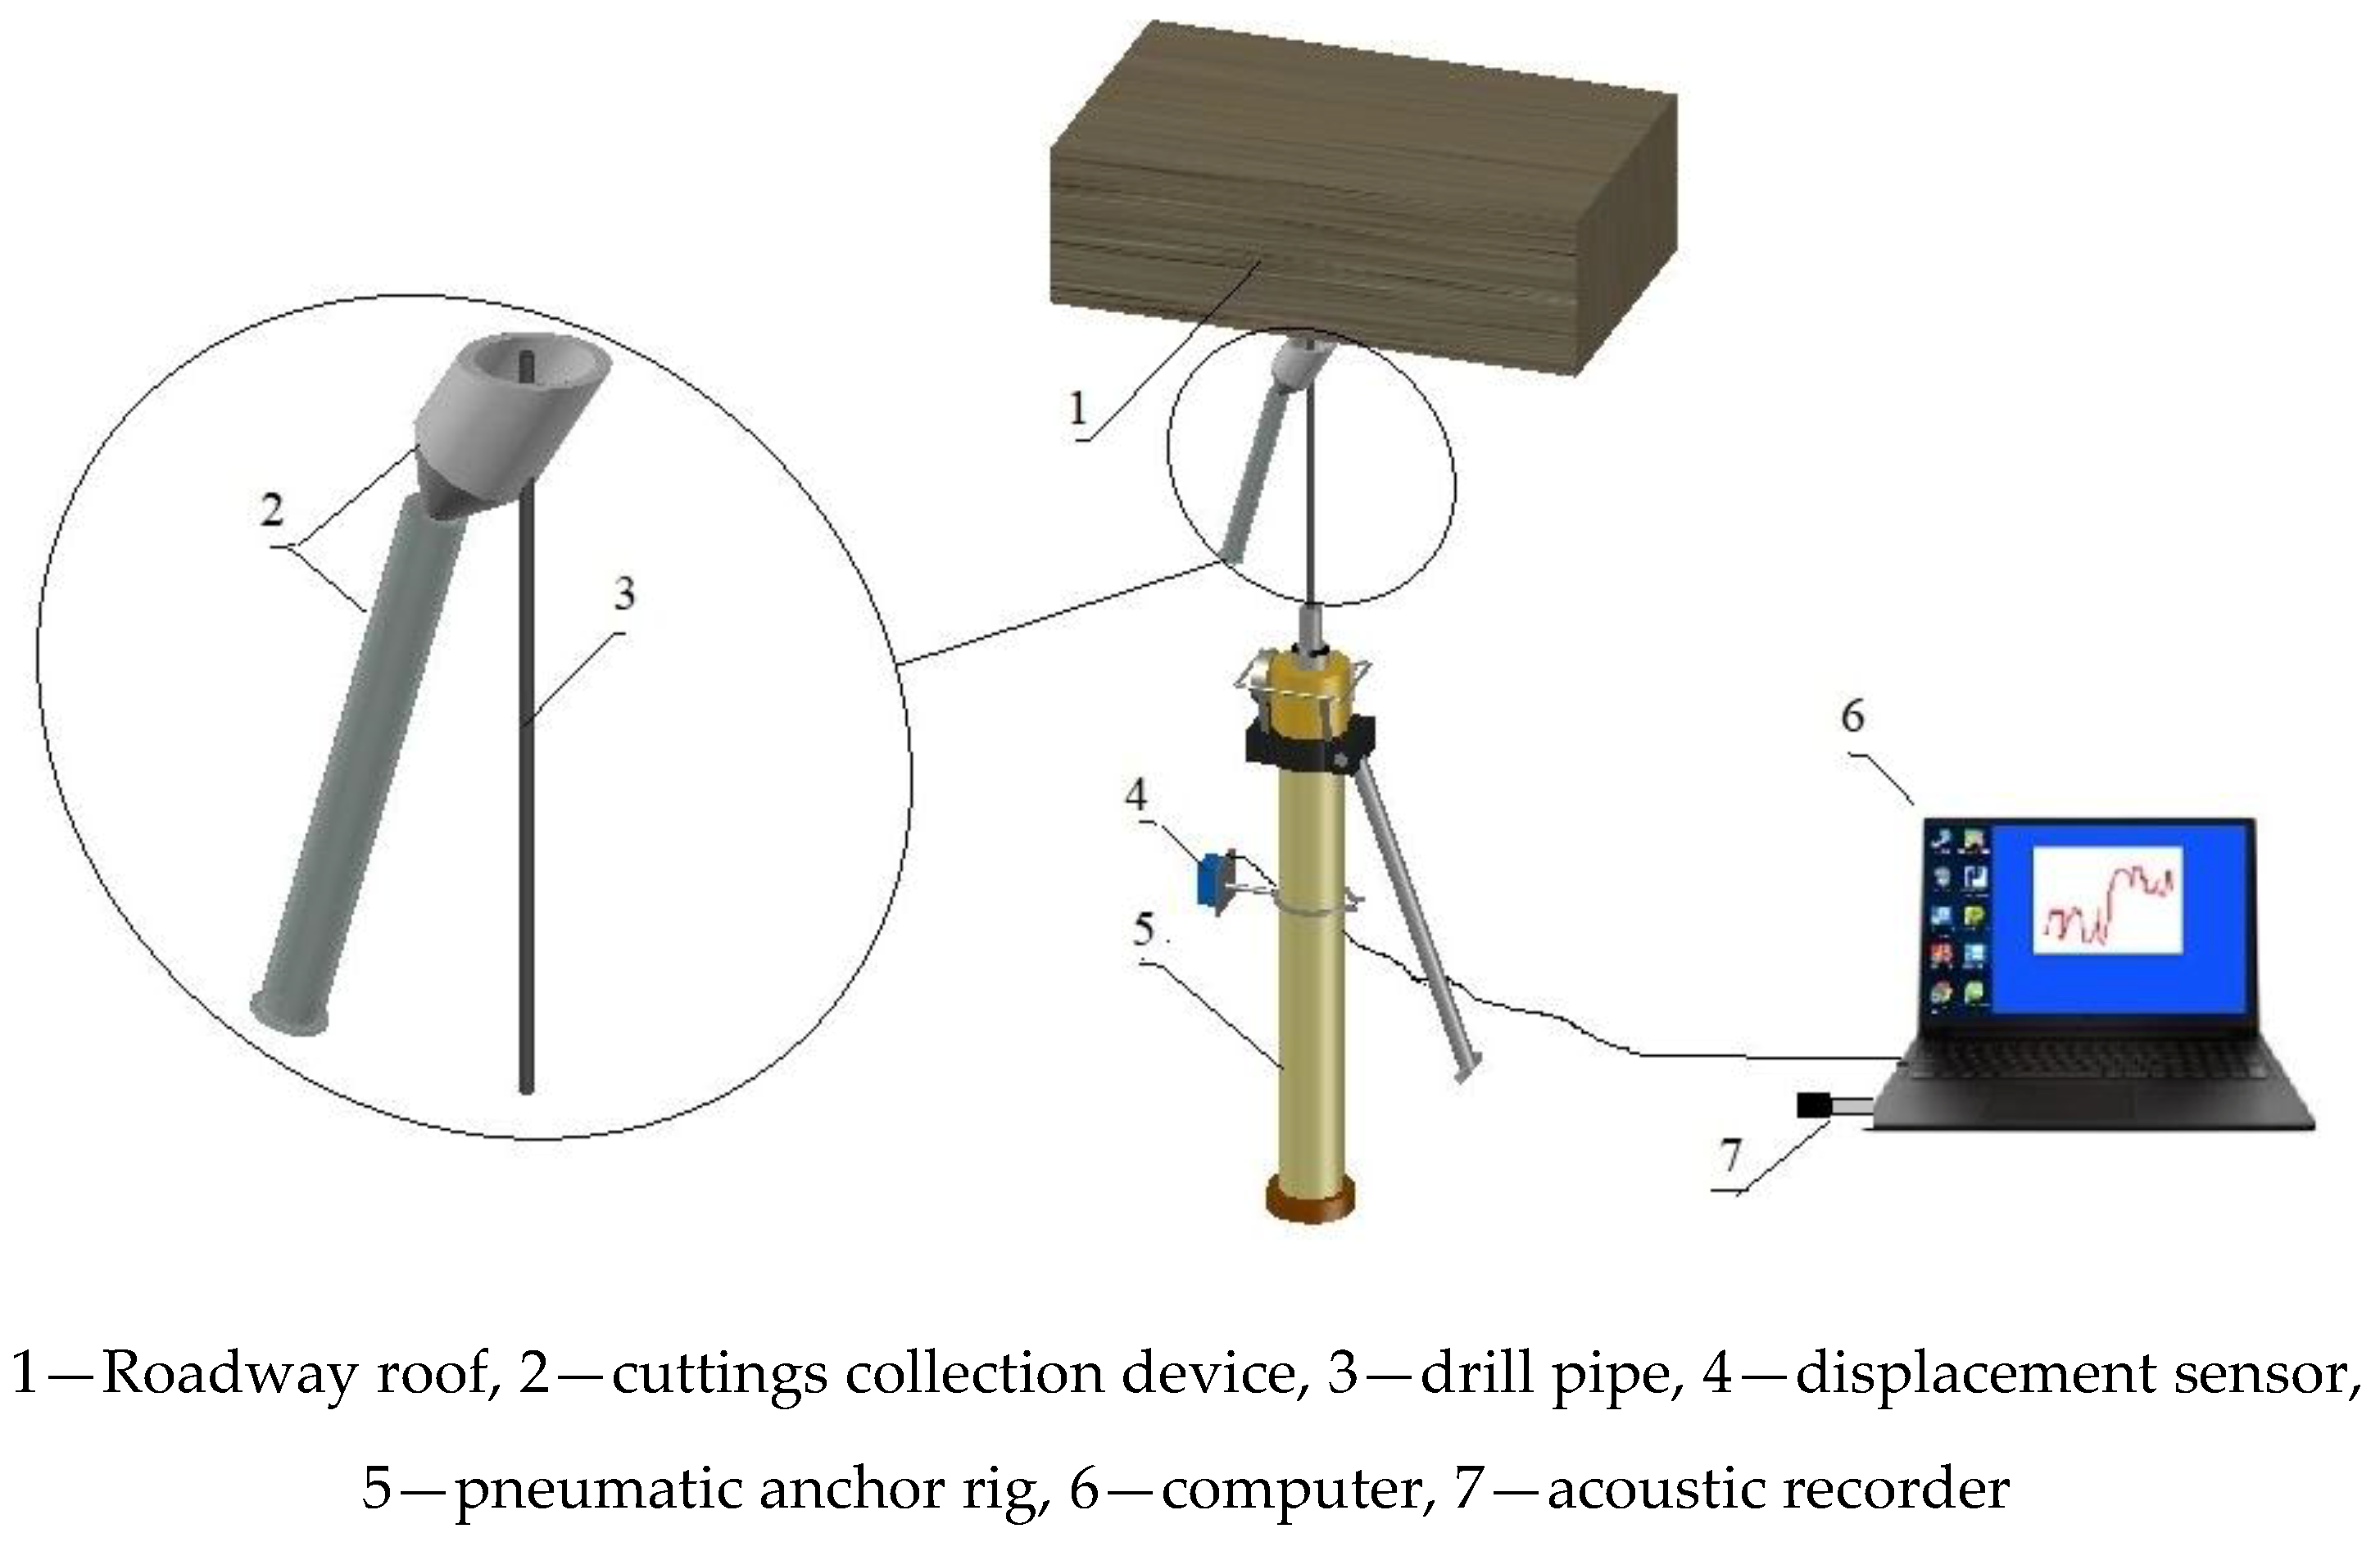
- Sound pressure level, penetration rate, longitudinal vibration, and the cuttings collection device shown in Figure 3 can be used to identify the interface and thickness of various formations.
- A new method for bit wear and drilling efficiency evaluation can be established based on the distribution characteristics of drill cuttings.
- Drilling efficiency can be improved by optimizing the bit structure so that the broken rock blocks flow out of the anchor holes as early as possible to avoid being broken into cuttings.
- The drilling efficiency may be improved by optimizing the thrust and torque distribution ratio of the pneumatic bolt rig for different strength rock layers.
5. Conclusions
Author Contributions
Funding
Acknowledgments
Conflicts of Interest
Abbreviations
| PDC | Polycrystalline Diamond Compact |
| UCS | Uniaxial Compressive Strength |
| ti | Time corresponding to the i-th data |
| Si | Displacement corresponding to the i-th data |
| V | Constant velocity when drilling in the same strength rock formation |
| V(ti) | Penetration rate corresponding to ti time |
| Li | Longitudinal vibration |
| Lp | Mixed sound pressure level |
| Lp1 | Noise sound pressure level |
| Lp2 | Anchor rig sound pressure level |
| μ | Mean value of sample data |
| σ | Standard deviation of sample data |
References
- Ajibose, O.K.; Wiercigroch, M.; Akisanya, A.R. Experimental studies of the resultant contact forces in drillbit–rock interaction. Int. J. Mech. Sci. 2015, 91, 3–11. [Google Scholar] [CrossRef] [Green Version]
- Yang, Y.X.; Zhang, C.L.; Lin, M.; Chen, L. Research on rock-breaking mechanism of cross-cutting PDC bit. J. Pet. Sci. Eng. 2018, 161, 657–666. [Google Scholar] [CrossRef]
- Cai, C.; Wu, K.S.; Lian, D.; Yuan, X.H. Study of rock-breaking mechanism under single-tooth impact. Rock. Soil. Mech. 2015, 36, 1659–1666 and 1675. [Google Scholar] [CrossRef]
- Yahiaoui, M.; Gerbaud, L.; Paris, J.Y.; Denape, J.; Dourfaye, A. A study on PDC drill bits quality. Wear 2013, 298, 32–41. [Google Scholar] [CrossRef] [Green Version]
- Karasawa, H.; Ohno, T.; Miyazaki, K.; Eko, A. Experimental results on the effect of bit wear on torque response. Int. J. Rock Mech. Min. Sci. 2016, 84, 1–9. [Google Scholar] [CrossRef]
- Botti, L.; Mora, C.; Antonucci, A.; Carty, P.; Barr, A.; Rempel, D. Carbide-tipped bit wear patterns and productivity with concrete drilling. Wear 2017, 386, 58–62. [Google Scholar] [CrossRef]
- Wang, S.Y.; Sloan, S.W.; Liu, H.Y.; Tang, C.A. Numerical simulation of the rock fragmentation process induced by two drill bits subjected to static and dynamic (impact) loading. Rock Mech. Rock Eng. 2011, 44, 317–332. [Google Scholar] [CrossRef]
- Cheng, Z.; Sheng, M.; Li, G.; Huang, Z.; Shi, H.; Dai, X.; Guo, Z. Cracks imaging in linear cutting tests with a PDC cutter: Characteristics and development sequence of cracks in the rock. J. Pet. Sci. Eng. 2019, 179, 1151–1158. [Google Scholar] [CrossRef]
- Cheng, Z.; Sheng, M.; Li, G.; Huang, Z.; Wu, X.; Zhu, Z.; Yang, J. Imaging the formation process of cuttings: Characteristics of cuttings and mechanical specific energy in single PDC cutter tests. J. Pet. Sci. Eng. 2018, 171, 854–862. [Google Scholar] [CrossRef]
- Wang, X.; Wang, Z.; Wang, D.; Chai, L. A novel method for measuring and analyzing the interaction between drill bit and rock. Measurement 2018, 121, 344–354. [Google Scholar] [CrossRef]
- Miyazaki, K.; Ohno, T.; Karasawa, H.; Takakura, S.; Eko, A. Performance evaluation of polycrystalline diamond compact percussion bits through laboratory drilling tests. Int. J. Rock Mech. Min. Sci. 2016, 87, 1–7. [Google Scholar] [CrossRef]
- Sun, R.; Ju, P.; Shi, Z. Simulation study of new directional drilling PDC bit used in coal mine. Geosystem Eng. 2017, 20, 142–148. [Google Scholar] [CrossRef]
- Huang, K.; Ai, Z.; Yang, Y.; Xie, Z. The improved rock breaking efficiency of an annular-groove PDC bit. J. Pet. Sci. Eng. 2019, 172, 425–435. [Google Scholar] [CrossRef]
- Cancan, L.; Xigui, Z.; Arifuggaman, A.; Mengbin, X. Measurement and analysis of penetration rate and vibration on a roof bolter for identification rock interface of roadway roof. Energy Sources Part A Recovery Util. Environ. Eff. 2019. [Google Scholar] [CrossRef]
- Li, W. Research on Theory and Method for Identification of Rock Mass Properties Based on Drilling Response. Available online: http://kreader.cnki.net/Kreader/CatalogViewPage.aspx?dbCode=cdmd&filename=1017132164.nh&tablename=CDFDLAST2017&compose=&first=1&uid=WEEvREcwSlJHSldRa1FhcTdWa2FjcW9xcjNWTUZ2TWtZTjdCS2JqMVRsND0=$9A4hF_YAuvQ5obgVAqNKPCYcEjKensW4IQMovwHtwkF4VYPoHbKxJw!! (accessed on 25 December 2019).
- Liu, S.; Luo, Y.; Jia, H. Vibration mechanism and characteristics analysis of drill rod when drilling roof bolt hole. J. China Univ. Min. Technol. 2016, 45, 893–900. [Google Scholar] [CrossRef]
- Gradl, C.; Eustes, A.W., III; Thonhauser, G. An analysis of noise characteristics of drill bits. J. Energy Res. Technol. 2008, 134, 681–687. [Google Scholar] [CrossRef]
- Ma, Y.; Huang, Z.; Li, Q.; Zhou, Y.; Peng, S. Cutter layout optimization for reduction of lateral force on pdc bit using kriging and particle swarm optimization methods. J. Pet. Sci. Eng. 2018, 163, 359–370. [Google Scholar] [CrossRef]
- Dougherty, P.S.M.; Pudjoprawoto, R.; Fred Higgs, C. Bit cutter-on-rock tribometry: Analyzing friction and rate-of-penetration for deep well drilling substrates. Tribol. Int. 2014, 77, 178–185. [Google Scholar] [CrossRef]
- Qiu, P.H. Introduction to Statistical Process Control; Taylor & Francis Group: Boca Raton, FL, USA, 2014; pp. 104–105. [Google Scholar]
- Liu, S.W.; Luo, Y.F.; Jia, H.S. Energy response characteristics of rock interface under drilling of roof anchorage borehole in coal roadway. J. China Univ. Min. Technol. 2018, 47, 88–96. [Google Scholar] [CrossRef]
- Wang, Q.; Qin, Q.; Gao, S.; Li, S.C.; Gao, H.K.; He, M.C.; Jiang, B.; Zhang, C. Relationship between rock drilling parameters and rock uniaxial compressive strength based on energy analysis. J. China Coal Soc. 2018, 43, 1289–1295. [Google Scholar] [CrossRef]
- Rojek, J.; Onate, E.; Labra, C.; Kargl, H. Discrete element simulation of rock cutting. Int. J. Rock Mech. Min. Sci. 2011, 48, 996–1010. [Google Scholar] [CrossRef]
- Su, O.; Akcin, N.A. Numerical simulation of rock cutting using the discrete element method. Int. J. Rock Mech. Min. Sci. 2011, 48, 434–442. [Google Scholar] [CrossRef]
- Li, X. Study on the Roof Drilling Characteristics Experiment of Anchorage Hole in Coal Roadway. Available online: http://kreader.cnki.net/Kreader/CatalogViewPage.aspx?dbCode=cdmd&filename=1016711111.nh&tablename=CMFD201602&compose=&first=1&uid=WEEvREcwSlJHSldRa1FhcTdWa2FjcW9xck9nSUVubEdzck9xSUYySHJGYz0=$9A4hF_YAuvQ5obgVAqNKPCYcEjKensW4IQMovwHtwkF4VYPoHbKxJw!! (accessed on 25 December 2019).
- Liu, D. Research of the Dynamic Response Characteristics in the Drilling of Anchor Hole in the Roof of Roadway. Available online: http://kreader.cnki.net/Kreader/CatalogViewPage.aspx?dbCode=cdmd&filename=1015903273.nh&tablename=CMFD201701&compose=&first=1&uid=WEEvREcwSlJHSldRa1FhcTdWa2FjcW9xck9nSUVubEdzck9xSUYySHJGYz0=$9A4hF_YAuvQ5obgVAqNKPCYcEjKensW4IQMovwHtwkF4VYPoHbKxJw!! (accessed on 25 December 2019).


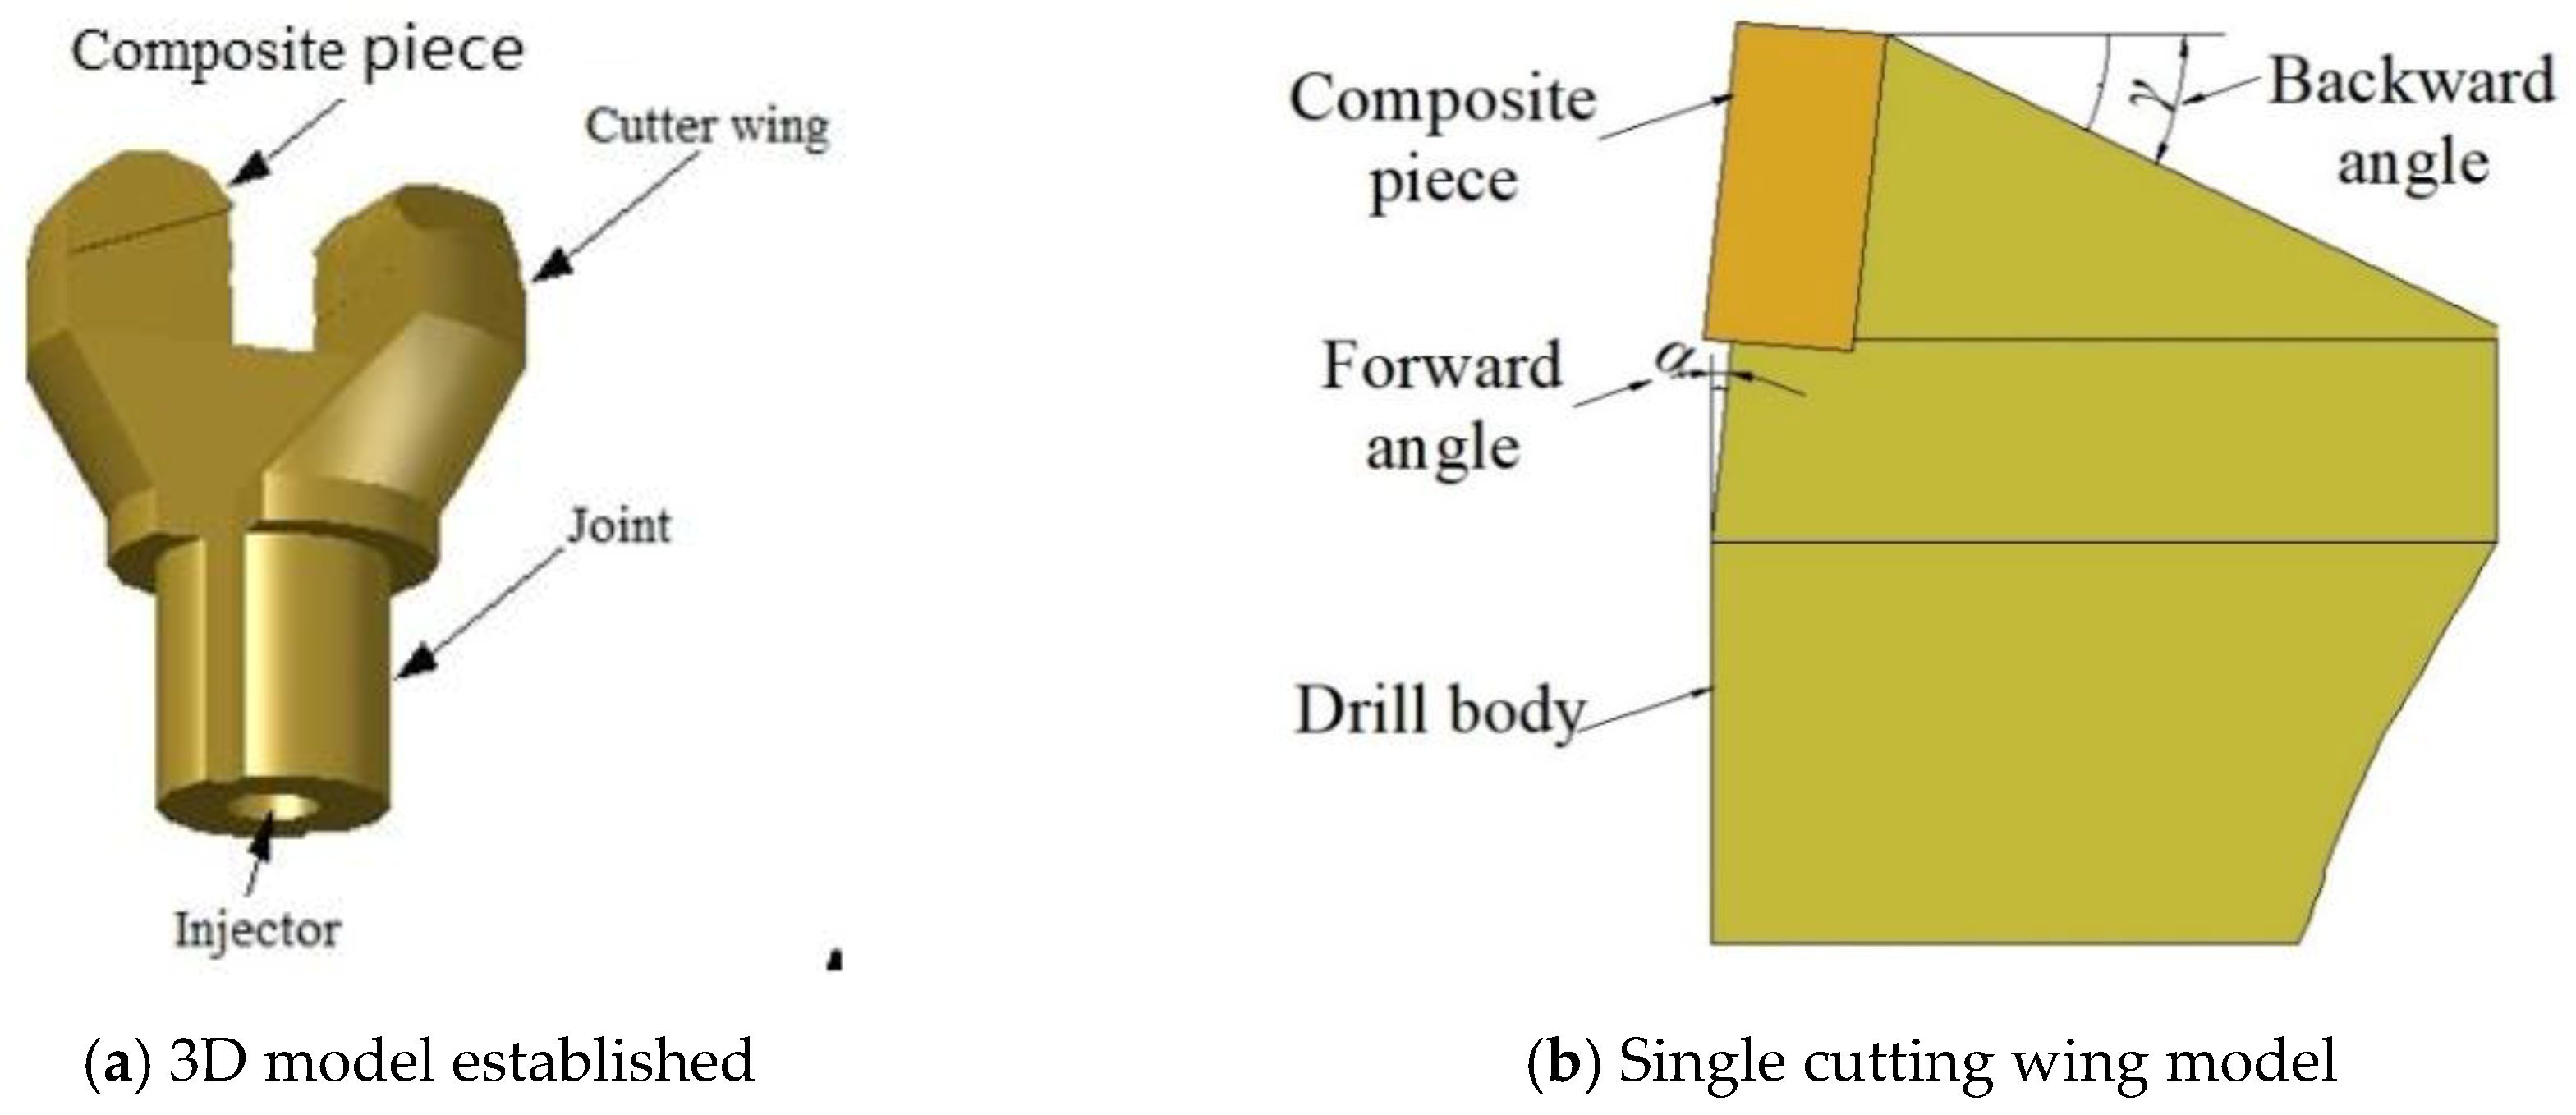
| Drill Bit Number | Type | Diameter/mm | Height/mm | α/(°) | γ/(°) | Weight/g |
|---|---|---|---|---|---|---|
| 1 | new | 28 | 47.54 | 6 | 25 | 72 |
| 2 | new | 30 | 46.89 | 7 | 25 | 79 |
| 3 | new | 32 | 48.41 | 6 | 24 | 84 |
| 4 | new | 42 | 58.61 | 6 | 23 | 186 |
| 5 | worn | 28 | 35.83 | 5 | 9 | 52 |
| Borehole Number | 0~0.074 mm | 0.074~0.25 mm | 0.25~0.5 mm | 0.5~0.8 mm | >0.8 mm |
|---|---|---|---|---|---|
| 1 | M-m1 | M-m1-m2 | M-m1-m2-m3 | M-m1-m2-m3-m4 | m4 |
© 2020 by the authors. Licensee MDPI, Basel, Switzerland. This article is an open access article distributed under the terms and conditions of the Creative Commons Attribution (CC BY) license (http://creativecommons.org/licenses/by/4.0/).
Share and Cite
Liu, C.; Zheng, X.; Wang, G.; Xu, M.; Li, Z. Research on Drilling Response Characteristics of Two-Wing PDC Bit. Sustainability 2020, 12, 406. https://doi.org/10.3390/su12010406
Liu C, Zheng X, Wang G, Xu M, Li Z. Research on Drilling Response Characteristics of Two-Wing PDC Bit. Sustainability. 2020; 12(1):406. https://doi.org/10.3390/su12010406
Chicago/Turabian StyleLiu, Cancan, Xigui Zheng, Gang Wang, Mengbin Xu, and Zhishang Li. 2020. "Research on Drilling Response Characteristics of Two-Wing PDC Bit" Sustainability 12, no. 1: 406. https://doi.org/10.3390/su12010406