Article

Energy–Finance–Growth Nexus in ASEAN-5 Countries: An ARDL Bounds Test Approach

1
Department of Finance and Banking, Faculty of Business and Accountancy, University of Malaya, Kuala Lumpur 50603, Malaysia
2
Department of Operation and Management Information System, Faculty of Business and Accountancy, University of Malaya, Kuala Lumpur 50603, Malaysia
3
Department of Accountancy, Faculty of Business and Accountancy, University of Malaya, Kuala Lumpur 50603, Malaysia
*
Author to whom correspondence should be addressed.
Sustainability 2020, 12(1), 5; https://doi.org/10.3390/su12010005
Submission received: 7 November 2019 / Revised: 10 December 2019 / Accepted: 12 December 2019 / Published: 18 December 2019
(This article belongs to the Section Economic and Business Aspects of Sustainability)

Abstract

:
This study examines the relationship between energy consumption, financial development and economic growth for ASEAN-5 countries, namely Malaysia, Indonesia, the Philippines, Singapore and Thailand, over the period from 1980 to 2017. Finance–growth and energy–growth relationships have been well researched; however, the energy–finance–growth nexus is an equally important but less explored area. Our Auto Regressive Distributed Lags (ARDL) bounds test for cointegration results suggests that the variables tend to move together in the long run for all countries, apart from Indonesia. Our study also considers the effect of a structural break due to financial crisis and confirms that the break does not affect the long-term relationship among the variables; in other words, the financial crisis does not affect the energy–finance–growth nexus. Hence, considering the consistency of energy consumption, the importance of the energy sector must not be undermined, and appropriate energy policies are instrumental in maintaining a well-managed financial sector for sustainable economic growth.

1. Introduction

Energy is vital to human societies and plays a critical role in economic growth as an indispensable factor of production [1]. All social and financial aspects, as well as the quality of life, are influenced by energy [2]. Energy is also seen as a significant constituent in the progression of industrialization and technology [3]. Likewise, the financial sector creates a socioeconomic environment conducive to innovation and technological advancement that stimulates economic growth [4]. A properly developed and prudentially managed financial sector allows the allocation of adequate financial resources to the energy sector and maintains a healthy balance between energy production and consumption [5]. This is conducive to increasing savings, and the efficient transition from saving to investment fosters capital accumulation and long-term economic growth [6].
A direct connection between financial development and energy consumption was first identified by [7]. Since then growing amount of empirical research has been dedicated to the energy–finance nexus in recent years [8,9,10,11,12]. Despite growing interest, compared to the finance–growth and energy–growth literature, the relationship between financial development and energy consumption remains a mostly under-explored area [13]. Although there is a substantial amount of literature on the growth–energy relationship, it shows only a partial picture [14]. The prevailing literature largely ignores the role of financial development in stimulating economic growth as well as the influence of growth on energy demand [15], while the importance of financial variables in investigatng the energy–growth nexus is well documented by [16]. Financial development indicates the actual level of financial resources available for production and channels these funds through banks and stock markets [17]; thus, this promotes economic growth by boosting investment via transparent transactions for productive ventures [15]. A higher level of economic development through raising the capacity of the production sector and attracting foreign investment requires a stable power supply, which necessitates support by the financial sector through channeling resources to the energy sector [18]. A well-developed financial market makes financial resources available to high-return projects; at the same time, this implies better accounting and reporting standards, which increases investors’ confidence [19], and attracts Foreign Direct Investment(FDI) [7]; which in turnaffects energy consumption. Similarly, financial development increases energy consumption by enhancing liquidity through the allocation of assets to appropriate ventures [15]. Hence, financial development affects the growth of an economy, which may influence energy consumption [20], and consequently, can act as the missing link in the energy–growth nexus [5]. With the growth in the economy, more productive inputs are needed which are supported by activities such as capital accumulation and energy expenditure where the role of finance is undisputable [21].
However, to date, the nature of the relationship remains inconclusive from the relatively small amount of prevailing literature. Some researchers have found a negative relationship between energy consumption and financial development [22], while others detect a positive relationship [13,23]. Similarly, the results of the cointegration and causality analysis-based studies are also inconclusive. Several studies reported bidirectional causality between financial development and energy consumption [8,9,11], since economic activities and energy consumption have a mutual influence on each other [24]. On the contrary, others found only a unidirectional effect either running from financial development to energy consumption [20,25] or the other way around [5]. Further, other scholarly investigations on this topic detected no causal relationship between variables [10]. Hence, our study’s main contribution is to add to this literature by investigating the long-term association between energy consumption and financial development, together with the addition of economic growth, in order to achieve a more comprehensive understanding of this crucial relationship. Further, from statistical perspectives, our study contributes by considering a multivariate model, while a large number of studies investigate the long-term relationship using a bi-variate model (i.e., the finance–growth or energy–growth nexus). Compared to bi-variate models, multivariate models enjoy superiority by incorporating variables to ensure robust results that may alter the statistical relationship established in a bivariate framework [26]. Further, the estimated relationship in a bi-variate model suffers from omitted variable bias, and causality tests from bivariate models can be misleading [27]; whereas, the multivariate approach suggests a maximum likelihood estimation procedure that affords an estimation of all the cointegrating vectors present in a group of variables [28].
Moreover, previous studies remain inconclusive, mostly owing to the choice of samples and methods of analyzing data. In particular, most studies have only been carried out considering a single country or a shorter period, which provide a limited understanding and fail to accommodate the heterogeneity among different countries. A few studies also attempt to analyze the relationship using panel datasets while studying multiple countries [29,30]. However, each country has its distinct financial background, institutions, policies and environments, and as such, the broad comparative analyses conducted at the aggregate level are hardly able to capture such differences [31]. Similarly, countries contrast in terms of their financial structure, size of financial institutions and instruments, financial intermediation efficiency, degree of concentration of financial institutions, the volume of financial transactions and the efficacy of the financial regulatory framework [31,32]. Thus, the inclusion of the unobserved country-specific effects in the error term might lead to biased and inconsistent estimates [33]. Consequently, the panel data-based studies also fail to determine the relationship conclusively. Moreover, in-depth country-specific study, particularly in terms of heterogeneity across areas, lends beneficial reference for other emerging economies [31]. Hence, our study aims to investigate the energy–finance nexus in relation to economic growth for a sample of countries separately in order to overcome the limitations discussed above. As such, another contribution of our study is to analyze a dataset of countries within a significantly important economic zone (here, we have chosen the five largest economy of Association of South East Asian Nations, which is popularly known as ASEAN-5) using an extended period (38 years) and considering each country separately.
ASEAN is one of the fastest-growing economic regions in the world; constant growth in urbanization and industrialization in the region noticeably increases energy consumption [34]. With the anticipated GDP and population growth rate, the expected energy consumption is projected at an annual growth rate of 4.4 per cent per year up to 2030. According to the International Energy Agency, this growth is substantially higher than the average global annual energy demand growth rate of 1.4% over 2008–2035. However, there has been little published empirical research examining the energy–finance nexus in this region despite the economic significance. Moreover, an empirical analysis of the relationship between energy consumption and financial development in emerging countries is rather scarce [35]. The co-integration and causal relationship between economic growth and energy consumption in ASEAN-5 countries is examined by [34]; however, they overlooked the critical role of financial development in the nexus—a critical factor that channels resources from unproductive to productive uses [36]. Hence, it is imperative that we examine the long-run association of energy–finance–growth for this economically significant set of ASEAN-5 countries.
Moreover, we use annual data from 1980 to 2017 that cover almost four decades which have experienced major changes regionally and globally which can possibly cause structural changes. Therefore, our study considers the possibility of a structural break in the time series data. A structural break in the time series occurs due to some unique economic events [37]. From energy–finance–growth aspects, such events include the changes in economic conditions, changes in energy policy, and fluctuations in the price of energy [38], legislative or technical changes [39]; consequently, these can have a permanent effect on the pattern of the time series [40]. Hence, it is critical to identify structural breaks in the data to avoid model misspecification and coefficient bias and to ensure that tests for the non-stationarity of the data give the correct result [41]; ignoring such break when it is present can result in misinterpretation by reducing the ability to reject a false unit root null hypothesis [37]. Taking such importance into account, we consider the possible impact of astructural break in the analyses due to the Asian financial crisis suffered by the countries in this region during 1997. Consequently, the Zivot-Andrews unit root test procedure is employed to account for the break in the time series, which offers a novel aspect of the study as earlier studies disregard such possibility in analysis for ASEAN-5 countries. Further, we employ the Chow breakpoint test to confirm the break during the crisis period. The impact of the structural break on the long-run relationship between energy, finance and growth is investigated through the approach suggested by [42]. Finally, we employ the Auto Regressive Distributed Lags (ARDL) bounds test technique developed by [43] to examine the long-run relationship among the variables.
Our first set of results from the Chow breakpoint test provides the evidence of a break in the time series for all the variables. However, further analysis using the Gregory and Hansen test confirms that the break does not exert any significant effect on the long-run relationship among the variables for all the countries. Finally, by employing the ARDL bounds test approach, we find that energy–finance–growth has a long-run association for all ASEAN-5 countries, except for Indonesia. Therefore, we provide further insights regarding the relationship between energy, finance and growth by taking the impact of a structural break into account. Our considerations of structural break issues bring a new perspective to the energy–finance–growth literature and further contribute to the existing body of knowledge.
The paper is set out as follows: Section 2 discusses the theoretical aspect of the energy–finance nexus and reviews the existing literature. Section 3 introduces our method and data. Section 4 presents and discusses the findings. Finally, Section 5 summarizes the findings and concludes our study.

2. Literature Review

2.1. The Nexus between Energy Consumption and Financial Development

The role of the energy sector is critical in meeting sustainability goals [44]. An effective financial system promotes customers to buy more products, leading to higher energy consumption [5]. This indicates that financial development indirectly promotes energy consumption through growth in consumers’ level of income. Simultaneously, a well-managed financial system can provide the necessary assistance to manufacturers’ efforts to expand their business operations. As a result, this stimulates innovation and in turn, leads to an increase in energy consumption. In short, by escalating company operations and improving consumer purchasing power, financial sector development can trigger a rise in energy consumption. There also exists an efficiency effect regarding a country’s financial development. The development of financial markets improves diversification and liquidity, which raises investment to greater returns and higher risk projects. For instance, stock market development is expected to result in increased investment, economic growth, and energy demand by increasing the availability of funds for investment projects [13]. Moreover, financial development stimulates a number of changes within a country, such as minimizing borrowing expenses and reducing financial risk, creating high transparency between borrowers and lenders, facilitating financial capital accessibility, improving cross-border investment, and providing energy-efficient products with cutting-edge technology [35]. All these changes can influence the demand for energy, as well as the consumption of energy, in conjunction with investment by businesses.
Similarly, Ref. [7] pointed out that financial development makes it easy to offer low-cost financial resources for customers to purchase big-ticket (durable) items, for instance, houses, automobiles, air conditions, refrigerators, televisions, washing machines and the like. Such products consume a substantial amount of energy; consequently, this may influence the energy consumption of the country in general. Likewise, financial development promotes the purchase of advanced technologies and equipment by providing loans at low cost, which can impact the demand for energy [12]. Financial development, therefore, affects economic growth, and consequently, exert an influence on energy consumption. On the contrary, Ref. [29] argued that financial development cuts the amount of energy consumption either by allowing business-level R&D activities related to more energy-efficient techniques or by promoting more efficient products. Through mobilizing substantial investment resources towards energy-efficient technologies, this likely has vital implications for the economic system [45]. Thus, it is crucial to explain energy consumption behavior through diverse channels. It is also essential to analytically describe financial development and observe its impact on the demand for energy [46].

2.2. Empirical Evidence from Preceding Studies

The empirical evidence, thus far, is inconclusive with regards to the relationship between energy consumption and financial development. As reported by [47], total primary energy consumption, CO2 emission, and investment have a long-term effect on Saudi Arabia’s financial development. Besides, Ref. [12] found a long-run relationship in the presence of structural breaks in Indonesia using ARDL and the Granger test. Further, Ref. [48] reported a long-run unidirectional influence of financial development on energy consumption in the Indian economy. Similarly, Ref. [25] recognized unidirectional causality from financial development to energy consumption in Japan by applying the ARDL bounds test and Granger causality approach with the data from 1970 to 2012. In contrast, Ref. [49] investigated the financial development and energy consumption relationship in the US market spanning a period from 1973 to 2014. Their results found evidence that financial development decreases energy consumption while analyzing the long-run relationship between financial development and energy demand. On the other hand, Ref. [46] considered energy demand as a measurement of energy consumption and expanded the sample for Next evelver (or N-11) countries, which include Bangladesh, Egypt, Indonesia, Iran, Mexico, Nigeria, Pakistan, South Korea, the Philippines, Turkey and Vietnam, and their causality analysis showed contrasting results. They reported that financial development stimulated the demand for energy when they incorporated the role of globalization in their analysis. Then again, some studies have shown that the long-term relationship between energy consumption and financial development is reversed, i.e., that energy consumption stimulates financial development. Besides, Ref. [10] provided the evidence from a group of 19 developing countries from different continents using data from 1980 to 2008; using the Pedroni and Panel Granger test, the study concluded that energy consumption allows these countries to achieve strong economic and financial growth. In a comparable analysis, Ref. [5] measured the relationship for a group of Asian countries between 1980 and 2012 by employing a heterogeneous panel causality test and recognized that there is unidirectional causality from energy consumption to financial development.
We find that the empirical literature provides evidence of contradictory results due to the choice of measurement for variables or methods. For instance, Ref. [9,50] both studied the finance and energy relationship in Tunisia using data from a similar period (in the former from 1971 to 2008, while in the latter from 1972 to 2010). However, the former analysis found bi-directional causality exists between finance and energy using an ARDL-unrestricted error correction model (UECM) framework, while the latter reported unidirectional causality running from energy consumption to financial development while analyzing the data using Johansen cointegration and the VECM approach. Moreover, both studies measured the financial development in the same way; however, Ref. [9] measured energy consumption by total energy consumption per capita, while [50] chose per capita energy consumption growth as a proxy. Similar to [9], a bidirectional relationship was reported in [8] for Malaysia, and in [11] for Saharan Africa countries.
Another stream of studies considered panel data in place of time series analysis; yet, they remained unsettled regarding the relationship between these variables.The generalized method of moments (GMM) technique was employed by [20] to analyze data for Pakistan for 1972–2012; the studyconcluded that financial development positively and significantly affects energy consumption through the economic growth channel. Besides, Ref. [23] broadly analyzed a pool of 65 countries, including advanced and emerging economies from 1990 to 2011 using dynamic panel test and reported a positive relationship between finance and energy. Similarly, Ref. [7] used a set of 22 developing countries in 1990–2006 with dynamic panel data estimation and found a positive association between finance and energy. Comparable findings were reported by [13] using an alternative set of nine countries in Central and Eastern Europe using a similar dynamic panel estimation. However, Ref. [30] observed no significant relationship between financial development and energy consumption using system-GMM in all the EU-27 countries. Further analysis comparing old and new member countries, however, found out that better financial development intensifies energy consumption for old members regardless of whether the financial development is measured by the banking sector or stock market development. On the other hand, this relationship for the new member countries is sensitive to the proxy used to measure financial development as only the banking sector development is significant.
While a number of studies report a positive association between energy and finance, a negative linkage is recognized by [22] in developing countries when the level of energy intensity is measured against the inflow of FDI. However, their study suffers from a methodological inefficiency as the relationship is measured with simple regression without considering the heterogeneity of the sample countries. In a recent study, Ref. [51] used the data from the North American Free Trade Agreement (NAFTA) Member countries and performed several tests including cross-section dependence. However, they found a negative relationship between energy consumption and financial development.
In conclusion, the empirical evidence is inconclusive thus far and, as such, calls for further investigation of the long-run relationship between energy consumption and financial development, and their effect on economic growth.

3. Materials and Methods

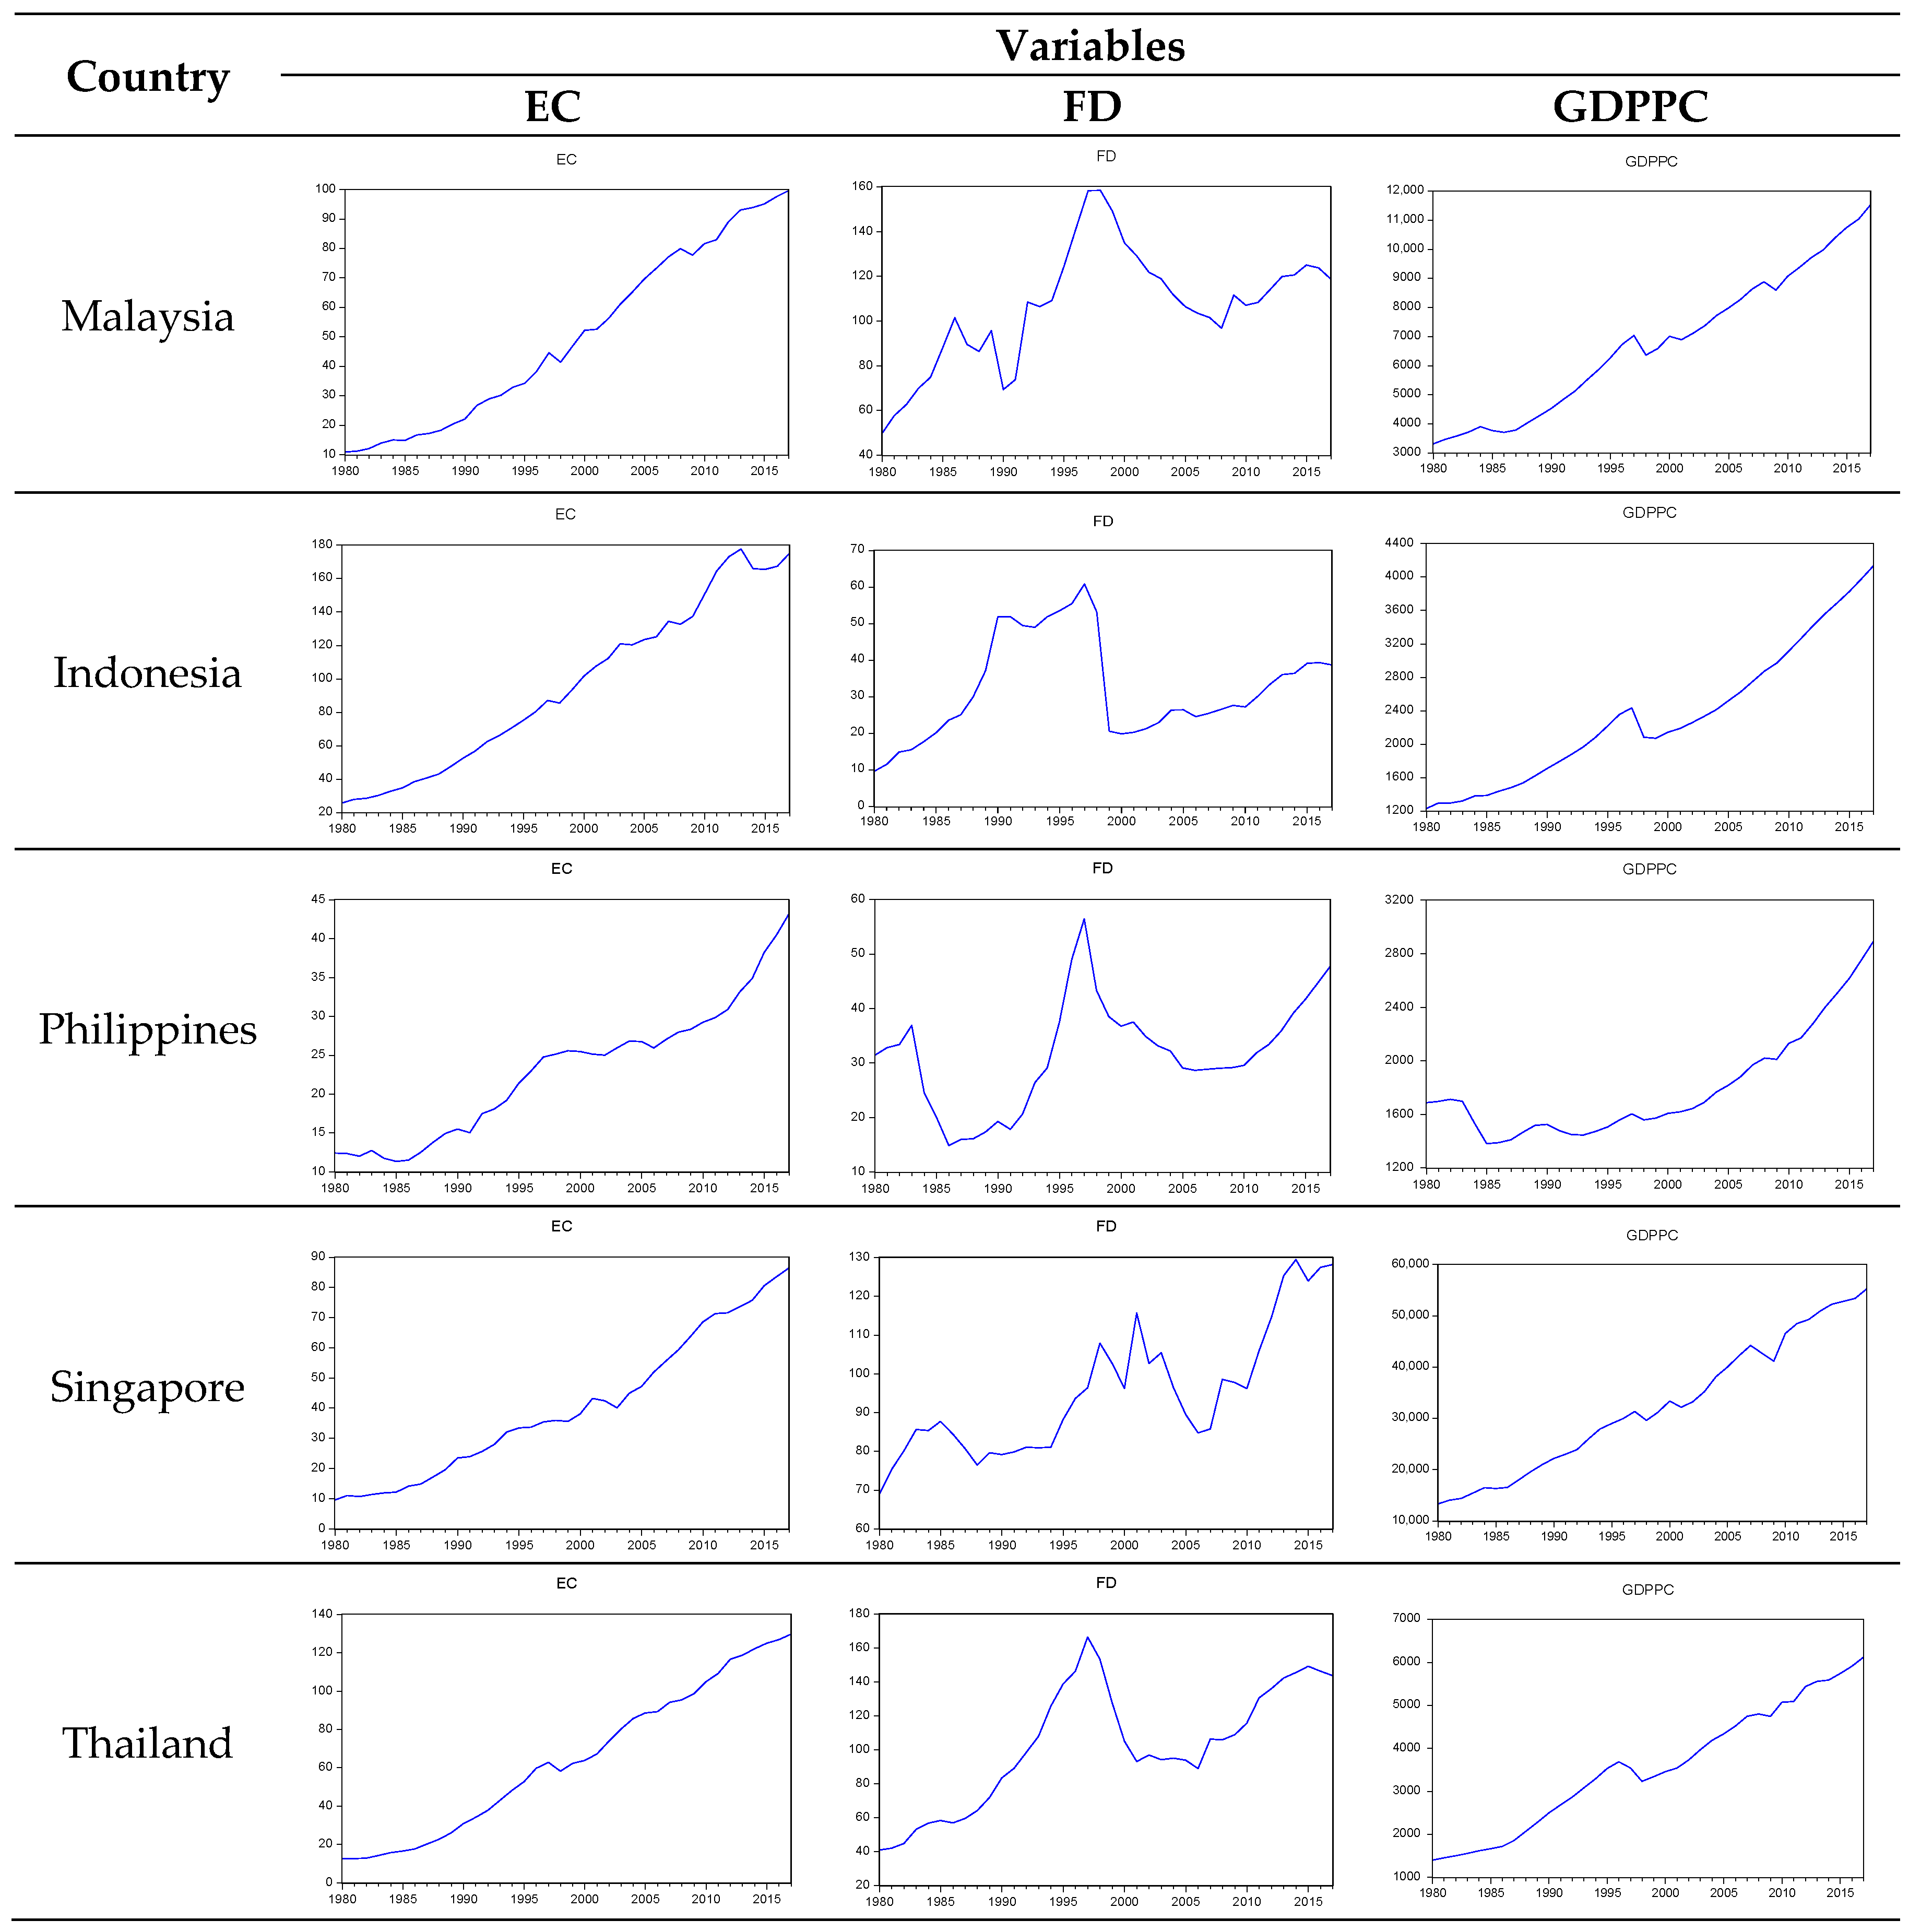
3.1. Data and Variables

This paper investigates the long-term relationship between energy consumption, financial development and economic growth in ASEAN-5, namely, Malaysia, Indonesia, the Philippines, Singapore and Thailand. For empirical analysis purposes, the study employs annual data obtained from the World Development Indicators (WDI) of the World Bank from 1980 to 2017. We use primary energy consumption (Million Tons of Oil Equivalent) as a proxy for each country’s energy consumption [52]. This is reported in net terms and adjusted for nuclear and hydroelectric generated energy values as well as renewable energy. To measure the financial development, we use the country’s domestic credit to the Private Sector (percentage of Gross Domestic Product) as this is a broad measure of financial sector development [9]. Further, GDP per capita (in current US dollars) is used to measure the economic growth of the countries [53]. All of these proxies have widely been used in previous studies [5,9,20].

3.2. Test of the Stationarity of Data

Financial data alway exhibit time series components, including seasonality component, trend, cyclical and irregular changes. Statistically, in order to model the uncertainty of the series, there must be some characteristics that have to remain stable over the time [54]. As by an unit root test is able to determine the stationarity of the variables [54,55]; thus, we employ a group unit root test to generate the stationarity of the series. Further, we also perform a unit root test using Zivot and Andrews’s procedure, which allows for the existence of a possible structural break in the series [56]. The Zivot and Andrews method regards every point as a potential break date, runs a regression for every possible break date sequentially and chooses the most significant one [57], where the t-statistic on the unit root hypothesis is minimized or the t-statistic for the break coefficient is maximized [58]. Conventional tests (i.e., Augmented Dickey–Fuller (ADF) or Phillips–Perron) to determine the presence of unit roots in a data series may erroneously specify the presence of a unit root when the series, in reality, is stationary around a single structural break [56,59]. The existence of endpoints creates divergence towards infinity in the asymptotic distribution of statistics. Some region must, therefore, be selected in such a way that the sample endpoints are not included. Therefore, we follow the suggestion by [56] in choosing the endpoints; the authors proposed that researchers should specify the “trim region” as (0.15 T, 0.85 T). The authors also claim that by endogenously determining the time of structural breaks, the outcomes of the standard unit root hypothesis may be reversed. The model in [56] endogenizes one structural break in a series as follows:
y t   =   μ ^ + θ ^ D U t ( T ^ ) β ^ t   +   γ ^ D T t ( T ^ b )   +   α ^ y t 1   +   j = 1 k c ^   Δ y t 1 + ε ^ t
This model takes both the probability of intercept shift and a trend break into consideration. DUt is a dummy variable that captures a change in the intercept, and another dummy variable DTt represents a change in the trend at time Tb. The test hypothesizes that the series (yt), is I (0) with one structural break. Tb denotes the break date, and if t > Tb then DUt takes the value 1, and 0 otherwise; whereas, if (t > Tb) DT is equal to (t-Tb), and 0 otherwise. If the coefficient of α is statistically significant, the null hypothesis is rejected.

3.3. Test of the Effect of a Structural Break in Cointegration

As [60] claims, disregarding the problem of possible structural breaks can invalidate statistical results for cointegration besides testing unit root tests. The author of [61] states that when a structural change is present, traditional cointegration tests that do not allow for the break can produce “spurious cointegration”. Therefore, a consideration for the possible effects of structural breaks on the results of a cointegration test is required since breaks generally arise as a result of major changes in policy or external shocks in the economy.
The method proposed by [42] addresses the issue of estimating co-integration when a potential structural break may be present by applying a residual-based technique to test the null hypothesis of no co-integration against the alternative of co-integration in the presence of a break (such as regime change). They introduced three alternative models by considering the existence of a potential unknown which is endogenously determined.
The first model includes an intercept (or constant) and a level shift dummy. The model is as follows:
Yit = μ1 + μ2DUt1y2tt
In this case, after the break date, the dummy for the variable (DUt) takes the value 1, and 0 otherwise.
The second alternative model includes an intercept and trend with a level shift dummy, and is as follows:
Yit = μ1 + μ2 DUt+ μ3t+ α1y2tt
The third one is the “full break model” that includes two dummy variables, for the intercept and for the slope, without incorporating a trend in the model. This model accommodates for change in both the intercept and slope as specified below:
Yit = μ1 + μ2 DUt+ α1y2t+ α2y2t DUtt      t = 1……, n
In the equations, DUt = 0, if t ≤ [nτ] and DUt = 1 if t > [nτ], where the unknown parameter τ ∈ (0,1) is delineated as the relative timing of the change point. α1 denotes the cointegration slope coefficient before the regime shift, and α2 indicates the change in the slope coefficient at the time of regime shift. Finally, μ1 and μ2 indicate a change in the intercept before and at the time of the shift in the intercept.

3.4. Test of Cointegration—ARDL Bounds Test Approach

We employ the ARDL bounds test developed by [43] to determine the long-run relationship between the variables. The ARDL framework provides multiple benefits to predict cointegration. One of the major advantages is that while other techniques of cointegration necessitate the integration of all regressors of the same order, ARDL can be applied regardless of the order of integration of the variables.
Following [43] ARDL bounds test for cointegration approach, this study estimates the following model to investigate the relationship between variables:
Δ EC t   = α 0   + i = 1 p β i EC t i + i = 1 p θ i F D t i + i = 1 p λ i G D P P C t i +   δ 1 E C t 1 +   δ 2 F D t 2 +   δ 3 G D P P C t 3 + μ t
where, EC, FD and GDPPC represent energy consumption, financial development and economic growth respectively; Δ is the first difference operator; μt is the error term and p is the optimal lag length. The maximum lag lengths are determined by using one or more of the “information criteria”—the Akaike information criterion (AIC) or the Schwarz Bayesian criterion (SBC).
In the ARDL bounds test of cointegration, F-statistics is used to examine the null hypothesis of no cointegration among the variables; specifically, the test of the null hypothesis for no cointegration among variables (H0: δ1 = δ2 = δ3 = δ4) against the alternative hypothesis (H1: δ1 ≠ δ2 ≠ δ3 ≠ δ4). The estimated F-statistics value is then compared with the upper and lower boundary of critical values. If the F-test statistic exceeds their corresponding upper critical values, the evidence of a long-term relationship between the variables is conclusive. Alternatively, the null hypothesis of no cointegration cannot be rejected if the F-statistics value is smaller than the critical values; whereas, if the value falls between the two critical value bounds, the decision regarding a long-term relationship remains inconclusive. Therefore, the nexus between energy consumption, financial development and economic growth is measured with the model specified below:
EC t   =   α 1   + i = 1 p β 1 i E C t i + i = 1 p θ 1 i F D t i +   i = 1 p λ 1 i G D P P C t i +   ε t

4. Results and Discussions

Financial data usually exhibit irregular changes. A breakpoint test is used in this study to identify a possible structural break in the time series. Time series data can often contain a structural break due to a change in policy, a sudden shock to the economy or market crash [55,62]. From Figure 1, we observe that the variables are subject to structural changes around the year 1997, especially, the FD for all the countries under consideration. One possible reason behind such a break is the Asian Financial Crisis. The ASEAN-5 countries under consideration experienced severe economic downturn caused by the event along with other Asian countries. The crisis brought into view the region’s vulnerability, which was mainly related to financial and economic fragility; therefore, this resulted in diversified growth and financial sector development in ASEAN-5 economies [63]. Consequently, the demand and supply of energy of the economies were affected through the economic stagnation induced by the crisis [64].
To confirm the possible structural break, we begin with the Chow test, which specifies a null hypothesis of no break to occur in the considered year (i.e., 1997). The Chow test fundamentally examines whether a single line of regression or whether two distinct lines of regression fit the data best [65]. The results, presented in Table 1, show that the F-statistic is significant for all the variables in all five countries, thus, confirming the structural break during the 1997 Asian Financial Crisis in the time series variables under consideration.
First, the Levin, Lin and Chu, and ADF unit root tests are used to examine the data series and the results are reported as follows (Table 2):
The results show that all series are non-stationary as individuals but stationary when the variables are grouped as common according to country, except the Philippines. Therefore, it is interesting to identify the impact of structural changes as well as breaks in the time series. Considering the existence of structural change, we perform the unit root test advised in [56], and the results of the test are presented in Table 3.
The results suggest that the time series are integrated in different orders for all the countries except Malaysia and the Philippines. However, all the variables are integrated either in I (0) or I(1); therefore, the unit root test advocates examining the cointegrating relationship using the ARDL framework. ARDL can be applied irrespective of whether underlying regressors are purely I (0), I(1) or mutually cointegrated and allows variables to have different optimal lags which is impossible for conventional cointegration procedures [66]. However, as the Chow test evidences the presence of structural breaks, we further consider the effect of the break in the long-run relationship among variables. Following the procedure in [67], the Gregory and Hansen test is performed to check if the structural break asserts any significant influence on the long-run relationship among variables.
The results presented in Table 4 illustrate that for all the models, test statistics are smaller than the respective 1% and 5% critical values reported in [42] for the ASEAN-5 countries under consideration. Hence, the test fails to reject the null hypothesis of no cointegration. Accordingly, the result confirms that the existence of the structural break in the series does not affect the co-movement of variables in the long run. The results imply that the crisis may have created distress in the financial sector and the economic growth of the countries, however, the relationship dynamics concerning energy consumption are not affected over time. The result is in line with the findings of [67], who found no evidence of a structural break in the cointegrating relationship among variables. However, the context of their study was different as they were studying the relationship between real money demand, GDP and money supply. Therefore, we conclude that the structural break due to the Asian Financial Crisis did not affect the long-run stability of the relationship. One possible reason is that policy makers in the region have maintained prudent financial positions by continuing capital and liquidity buffers of regional financial institutions after the crisis, which might have subsequently abetted the impact [63].
After that, the long-run relationship between energy consumption and financial development, along with economic growth, is tested using the ARDL bounds test approach and the results are presented in Table 5 below:
From Table 5, the bounds F-test for cointegration shows the evidence of a long-run relationship between variables at the 1% level of significance for the Philippines, Singapore and Thailand since the calculated F-values (7.2371, 7.5909 and 5.2977 respectively) are higher than the upper bound of the critical value (4.38). Further, for Malaysia, the calculated F-value (3.6167) is higher than the upper bound critical value at 10% (3.35); therefore, the cointegrating relationship holds at the 10% level of significance. However, the statistical evidence provides no such long-run co-movement for Indonesia as the calculated F-value (2.1368) falls below the lower bound of critical values at the 1%, 5% and 10% levels of significance.
The evidence of a cointegrating relationship implies that the energy consumption, financial development and economic growth of the ASEAN-5 countries maintain a relationship over time. The findings indicate that there is a common force that brings the variables back to equilibrium in the long run for all the countries, except Indonesia. The difference in the result for Indonesia might have been due to the banking crisis faced by the country compared to its peer countries. The massive breakdown in the Indonesian banking sector during the Asian Financial Crisis was an extraordinary aspect for the country [68] compared to its peer countries. The banking sector collapse intertwined with a currency devaluation to spur a twin crisis [69], owing mostly to the undercapitalized and poorly supervised banks [70]. However, our findings contradict with the findings of [12], who report a long-run relationship between energy consumption, financial development and economic growth in Indonesia. In their study, they measured energy consumption using a different proxy (i.e., per capita energy consumption), while our study considers the total consumption of primary energy. Additionally, their study generates quarterly observations from yearly data through interpolation; the differences in data frequency might have contributed to the dissimilar findings.
Overall, our result of the long-run equilibrium among the variables supports the findings of [5,71], who found a long-run equilibrium relationship among energy consumption and financial development in Asian countries. Therefore, the consumption of energy in Malaysia, the Philippines, Singapore and Thailand is associated with macroeconomic variables, namely, financial development and economic growth in the long run.

5. Conclusions

We examine the long-run relationship between energy consumption, financial development and economic growth in ASEAN-5 countries during the period of 1980–2017. To measure the relationship, we use the ARDL bounds test technique proposed by [43] based on the evidence of different levels of integration of the variables for different countries provided by the Unit Root Test proposed by [56]. Additionally, the Chow test of breakpoint is employed to confirm the possibility of a structural break in the series due to the 1997 Asian financial crisis. By considering the evidence of the structural break provided by the Chow test, our study further considers the impact of that structural break on the cointegration by using the technique proposed in [42]. We find that the structural break does not assert a significant impact on the long-run relationship among the variables. Consequently, the ARDL bounds test results show that there is a long-term relationship between energy consumption, financial development and economic growth in Malaysia, the Philippines, Singapore and Thailand, although not for Indonesia. Since these five selected ASEAN countries are not at the same level of economic development, such diverse finding is to be expected [34].
Taking the heterogeneity of macroeconomic development into account, our study provides empirical evidence from multiple countries considering the relationship dynamics for each country separately. ASEAN-5 are energy-dependent economies [27]; in general, they require an intensive use of energy to support their economic development, which is driven by industrial growth. The technology-oriented export focus of ASEAN-5 countries places greater pressures on the volume of energy consumed [34]. Hence, considering the undeniable role of energy, we suggest that policy makers in these countries need to pay considerable attention to financial sector development. An effective financial system is key to ensuring and maintaining sustainable economic development processes for the country. Thus, appropriate policies must be put in place and substantial efforts made to ensure the financial sector is on course. Further, in order to attract investors, it is essential to have a stable and sufficient energy supply. This could, in turn, affect the capital formation of the country through investment and overall economic growth. Therefore, to maintain sustainable economic growth, the energy sector should be supported with essential resources through well-managed development in the financial sector.
This study has some limitations which future research can address. One such limitation is that the analysis is at an aggregated level, while a sectoral analysis may provide greater understanding about the relationship. Further, future research may also include some useful energy-related variables such as CO2 emission and energy efficiency to expand the multivariate framework as well as incorporate stock market variables to measure the financial development in understanding the relationship in a much better way for the ASEAN region. Notwithstanding these limitations, the study suggests that a structural break should be considered more carefully in determing the long-term relationship among variables. Further research in this field would be of great help, with different methods such as Residual Augmented Least Squares Lagrange Multiplier (RALS-LM) suggested by [72] (see, Ref. [38] for example) as well as considering the non-linear aspects by investigating the cointegrating relationship with asymmetric techniques such as the non-linear ARDL in [73].

Author Contributions

Conceptualization, M.M., S.W.P. and I.I.; methodology, M.M. and S.W.P.; software, M.M. and S.W.P.; validation, S.W.P. and I.I.; formal analysis, M.M.; data curation, M.M.; writing—original draft preparation, M.M.; writing—review and editing, I.I. and S.W.P.; visualization, M.M..; supervision, I.I. and S.W.P.; project administration, C.R.I. and I.I.; funding acquisition, C.R.I., I.I. and S.W.P.

Funding

This research was funded by the Long-Term Research Grant Scheme by the Ministry of Higher Education (Malaysia)—MOHE and University of Malaya, Malaysia, grant number LR001B-2016A and the APC was funded by the Long-Term Research Grant Scheme by the Ministry of Higher Education (Malaysia)—MOHE, grant number LR001B-2016A.

Conflicts of Interest

The authors declare no conflict of interest.

References

  1. Lee, C.-C.; Chang, C.-P. Energy consumption and economic growth in Asian economies: A more comprehensive analysis using panel data. Resour. Energy Econ. 2008, 30, 50–65. [Google Scholar] [CrossRef]
  2. Dantama, Y.U.; Abdullahi, Y.Z.; Inuwa, N. Energy consumption-economic growth nexus in Nigeria: An empirical assessment based on ARDL bound test approach. Eur. Sci. J. 2012, 8, 141–157. [Google Scholar]
  3. Jumbe, C.B. Cointegration and causality between electricity consumption and GDP: Empirical evidence from Malawi. Energy Econ. 2004, 26, 61–68. [Google Scholar] [CrossRef]
  4. Ozturk, I. Financial Development And Economic Growth: Evidence From Turkey. Appl. Econom. Int. Dev. 2008, 8, 85–98. [Google Scholar]
  5. Furuoka, F. Financial development and energy consumption: Evidence from a heterogeneous panel of Asian countries. Renew. Sustain. Energy Rev. 2015, 52, 430–444. [Google Scholar] [CrossRef]
  6. Han, T. Financial development and economic growth: An empirical research for China. Econ. Sci. 2001, 3, 31–40. [Google Scholar]
  7. Sadorsky, P. The impact of financial development on energy consumption in emerging economies. Energy Policy 2010, 38, 2528–2535. [Google Scholar] [CrossRef]
  8. Islam, F.; Shahbaz, M.; Ahmed, A.U.; Alam, M.M. Financial development and energy consumption nexus in Malaysia: A multivariate time series analysis. Econ. Model. 2013, 30, 435–441. [Google Scholar] [CrossRef] [Green Version]
  9. Shahbaz, M.; Lean, H.H. Does financial development increase energy consumption? The role of industrialization and urbanization in Tunisia. Energy Policy 2012, 40, 473–479. [Google Scholar] [CrossRef] [Green Version]
  10. Al-mulali, U.; Sab, C.N.B.C. The impact of energy consumption and CO2 emission on the economic and financial development in 19 selected countries. Renew. Sustain. Energy Rev. 2012, 16, 4365–4369. [Google Scholar] [CrossRef]
  11. Al-Mulali, U.; Sab, C.N.B.C. The impact of energy consumption and CO2 emission on the economic growth and financial development in the Sub Saharan African countries. Energy 2012, 39, 180–186. [Google Scholar] [CrossRef]
  12. Shahbaz, M.; Hye, Q.M.A.; Tiwari, A.K.; Leitão, N.C. Economic growth, energy consumption, financial development, international trade and CO2 emissions in Indonesia. Renew. Sustain. Energy Rev. 2013, 25, 109–121. [Google Scholar] [CrossRef] [Green Version]
  13. Sadorsky, P. Financial development and energy consumption in Central and Eastern European frontier economies. Energy Policy 2011, 39, 999–1006. [Google Scholar] [CrossRef]
  14. Shahbaz, M.; Islam, F.; Butt, M.S. Finance–growth–energy nexus and the role of agriculture and modern sectors: Evidence from ARDL bounds test approach to cointegration in Pakistan. Glob. Bus. Rev. 2016, 17, 1037–1059. [Google Scholar] [CrossRef] [Green Version]
  15. Roubaud, D.; Shahbaz, M. Financial development, economic growth, and electricity demand: A sector analysis of an emerging economy. J. Energy Dev. 2017, 43, 47–98. [Google Scholar]
  16. Karanfil, F. How many times again will we examine the energy-income nexus using a limited range of traditional econometric tools? Energy Policy 2009, 37, 1191–1194. [Google Scholar] [CrossRef]
  17. Minier, J. Opening a stock exchange. J. Dev. Econ. 2009, 90, 135–143. [Google Scholar] [CrossRef]
  18. Rashid, A. Contribution of Financial development in electricity-growth nexus in Pakistan. Acta Univ. Danub. Œconomica 2015, 11, 223–240. [Google Scholar]
  19. Shahbaz, M. A reassessment of finance-growth nexus for Pakistan: Under the investigation of FMOLS and DOLS techniques. IUP J. Appl. Econ. 2009, 8, 65. [Google Scholar]
  20. Komal, R.; Abbas, F. Linking financial development, economic growth and energy consumption in Pakistan. Renew. Sustain. Energy Rev. 2015, 44, 211–220. [Google Scholar] [CrossRef]
  21. Moon, Y.-S.; Sonn, Y.-H. Productive energy consumption and economic growth: An endogenous growth model and its empirical application. Resour. Energy Econ. 1996, 18, 189–200. [Google Scholar] [CrossRef]
  22. Mielnik, O.; Goldemberg, J. Foreign direct investment and decoupling between energy and gross domestic product in developing countries. Energy Policy 2002, 30, 87–89. [Google Scholar] [CrossRef]
  23. Omri, A.; Kahouli, B. Causal relationships between energy consumption, foreign direct investment and economic growth: Fresh evidence from dynamic simultaneous-equations models. Energy Policy 2014, 67, 913–922. [Google Scholar] [CrossRef] [Green Version]
  24. Glasure, Y.U.; Lee, A.-R. Cointegration, error-correction, and the relationship between GDP and energy: The case of South Korea and Singapore. Resour. Energy Econ. 1998, 20, 17–25. [Google Scholar] [CrossRef]
  25. Rafindadi, A.A.; Ozturk, I. Effects of financial development, economic growth and trade on electricity consumption: Evidence from post-Fukushima Japan. Renew. Sustain. Energy Rev. 2016, 54, 1073–1084. [Google Scholar] [CrossRef]
  26. Bartleet, M.; Gounder, R. Energy consumption and economic growth in New Zealand: Results of trivariate and multivariate models. Energy Policy 2010, 38, 3508–3517. [Google Scholar] [CrossRef]
  27. Lean, H.H.; Smyth, R. Multivariate Granger causality between electricity generation, exports, prices and GDP in Malaysia. Energy 2010, 35, 3640–3648. [Google Scholar] [CrossRef]
  28. Goodwin, B.K. Multivariate cointegration tests and the law of one price in international wheat markets. Rev. Agric. Econ. 1992, 14, 117–124. [Google Scholar] [CrossRef]
  29. Chang, S.-C. Effects of financial developments and income on energy consumption. Int. Rev. Econ. Financ. 2015, 35, 28–44. [Google Scholar] [CrossRef] [Green Version]
  30. Çoban, S.; Topcu, M. The nexus between financial development and energy consumption in the EU: A dynamic panel data analysis. Energy Econ. 2013, 39, 81–88. [Google Scholar] [CrossRef]
  31. Ouyang, Y.; Li, P. On the nexus of financial development, economic growth, and energy consumption in China: New perspective from a GMM panel VAR approach. Energy Econ. 2018, 71, 238–252. [Google Scholar] [CrossRef]
  32. Ang, J.B. Economic development, pollutant emissions and energy consumption in Malaysia. J. Policy Model. 2008, 30, 271–278. [Google Scholar] [CrossRef]
  33. Pesaran, M.H.; Smith, R. Estimating long-run relationships from dynamic heterogeneous panels. J. Econom. 1995, 68, 79–113. [Google Scholar] [CrossRef]
  34. Saboori, B.; Sulaiman, J. CO2 emissions, energy consumption and economic growth in Association of Southeast Asian Nations (ASEAN) countries: A cointegration approach. Energy 2013, 55, 813–822. [Google Scholar] [CrossRef]
  35. Saud, S.; Chen, S. An empirical analysis of financial development and energy demand: Establishing the role of globalization. Environ. Sci. Pollut. Res. 2018, 25, 24326–24337. [Google Scholar] [CrossRef] [PubMed]
  36. Durusu-Ciftci, D.; Ispir, M.S.; Yetkiner, H. Financial development and economic growth: Some theory and more evidence. J. Policy Model. 2017, 39, 290–306. [Google Scholar] [CrossRef]
  37. Glynn, J.; Perera, N.; Verma, R. Unit Root Tests and Structural Breaks: A Survey with Applications. J. Quant. Methods Econ. Bus. Adm. 2007, 3, 63–79. [Google Scholar]
  38. Gómez, M.; Ciarreta, A.; Zarraga, A. Linear and nonlinear causality between energy consumption and economic growth: The case of Mexico 1965–2014. Energies 2018, 11, 784. [Google Scholar] [CrossRef] [Green Version]
  39. Nilsson, I. Unit Root Tests and Structural Breaks in the Swedish Electricity Price. Master’s Thesis, Lulea University of Technology, Luleå, Sweden, 2009. [Google Scholar]
  40. Byrne, J.P.; Perman, R. Unit roots and structural breaks: A survey of the literature. In Cointegration for the Applied Economist; Palgrave Macmillan: Basingstoke, UK, 2007. [Google Scholar]
  41. Harvie, C.; Pahlavani, M.; Saleh, A.S. Identifying structural breaks in the Lebanese economy 1970–2003: An application of the Zivot and Andrews test. Middle East Bus. Econ. Rev. 2006, 18, 18. [Google Scholar]
  42. Gregory, A.W.; Hansen, B.E. Residual-based tests for cointegration in models with regime shifts. J. Econom. 1996, 70, 99–126. [Google Scholar] [CrossRef] [Green Version]
  43. Pesaran, M.H.; Shin, Y.; Smith, R.J. Bounds testing approaches to the analysis of level relationships. J. Appl. Econom. 2001, 16, 289–326. [Google Scholar] [CrossRef]
  44. Zaharia, A.; Diaconeasa, M.C.; Brad, L.; Lădaru, G.-R.; Ioanăș, C. Factors Influencing Energy Consumption in the Context of Sustainable Development. Sustainability 2019, 11, 4147. [Google Scholar] [CrossRef] [Green Version]
  45. Bosetti, V.; Carraro, C.; Massetti, E.; Sgobbi, A.; Tavoni, M. Optimal energy investment and R&D strategies to stabilize atmospheric greenhouse gas concentrations. Resour. Energy Econ. 2009, 31, 123–137. [Google Scholar]
  46. Saud, S.; Baloch, M.A.; Lodhi, R.N. The nexus between energy consumption and financial development: Estimating the role of globalization in Next-11 countries. Environ. Sci. Pollut. Res. 2018, 25, 18651–18661. [Google Scholar]
  47. Mahalik, M.K.; Babu, M.S.; Loganathan, N.; Shahbaz, M. Does financial development intensify energy consumption in Saudi Arabia? Renew. Sustain. Energy Rev. 2017, 75, 1022–1034. [Google Scholar] [CrossRef] [Green Version]
  48. Boutabba, M.A. The impact of financial development, income, energy and trade on carbon emissions: Evidence from the Indian economy. Econ. Model. 2014, 40, 33–41. [Google Scholar] [CrossRef] [Green Version]
  49. Farhani, S.; Solarin, S.A. Financial development and energy demand in the United States: New evidence from combined cointegration and asymmetric causality tests. Energy 2017, 134, 1029–1037. [Google Scholar] [CrossRef]
  50. Chtioui, S. Does economic growth and financial development spur energy consumption in Tunisia? J. Econ. Int. Financ. 2012, 4, 150–158. [Google Scholar] [CrossRef] [Green Version]
  51. Gómez, M.; Rodríguez, J.C. Energy Consumption and Financial Development in NAFTA Countries, 1971–2015. Appl. Sci. 2019, 9, 302. [Google Scholar] [CrossRef] [Green Version]
  52. Dong, K.-Y.; Sun, R.-J.; Li, H.; Jiang, H.-D. A review of China’s energy consumption structure and outlook based on a long-range energy alternatives modeling tool. Pet. Sci. 2017, 14, 214–227. [Google Scholar] [CrossRef] [Green Version]
  53. Mishra, V.; Smyth, R.; Sharma, S. The energy-GDP nexus: Evidence from a panel of Pacific Island countries. Resour. Energy Econ. 2009, 31, 210–220. [Google Scholar] [CrossRef]
  54. Phoong, S.W.; Phoong, S.Y.; Moghavvemi, S.; Phoong, K.H. Multiple Breakpoint Test on Crude Oil Price. Found. Manag. 2019, 11, 187–196. [Google Scholar] [CrossRef] [Green Version]
  55. Phoong, S.Y.; Phoong, S.W. Modelling the economic cycle between GDP and government spending on technological innovation. Pertanika J. Soc. Sci. Hum. 2017, 25, 45–52. [Google Scholar]
  56. Zivot, E.; Andrews, D.W.K. Further evidence on the great crash, the oil-price shock, and the unit-root hypothesis. J. Bus. Econ. Stat. 2002, 20, 25–44. [Google Scholar] [CrossRef]
  57. Waheed, M.; Alam, T.; Ghauri, S.P. Structural Breaks and Unit Root: Evidence from Pakistani Macroeconomic Time Series; University Library of Munich: Munich, Germany, 2006. [Google Scholar]
  58. Meng, M. Three Essays on More Powerful Unit Root Tests with Non-Normal Errors; University of Alabama Libraries: Tuscaloosa, AL, USA, 2013. [Google Scholar]
  59. Pahlavani, M.; Wilson, E.; Worthington, A. Trade-GDP nexus in Iran: An application of the autoregressive distributed lag (ARDL) model. Am. J. Appl. Sci. 2005, 2, 1158–1165. [Google Scholar] [CrossRef] [Green Version]
  60. Perron, P. The great crash, the oil price shock, and the unit root hypothesis. Econom. J. Econom. Soc. 1989, 57, 1361–1401. [Google Scholar] [CrossRef]
  61. Kunitomo, N. Tests of unit roots and cointegration hypotheses in econometric models. Jpn. Econ. Rev. 1996, 47, 79–109. [Google Scholar] [CrossRef]
  62. Li, R.Y.M. Chow Test Analysis on Structural Change in New Zealand Housing Price During Global Subprime Financial Crisis. In Proceedings of the 18th Annual Pacific-Rim Real Estate Society Conference, Adelaide, Australia, 15–18 Janurary 2012. [Google Scholar]
  63. Hui, G.T.E.; Kiesha, O. Structural reforms in ASEAN-5 economies: Past successes and future challenges. Policy 2016, 8, 85–89. [Google Scholar]
  64. Nakano, K.; Honda, K. Impacts of Financial Crisis on Asian Energy Supply and Demand and Outlook; Institute of Energy Economics: Tokyo, Japan, 2000. [Google Scholar]
  65. Morley, B. Chow Test for Structural Stability. Univ. Bath. 2006. Available online: http://people.bath.ac.uk/bm232/EC50161/Chow%20Test.doc (accessed on 23 April 2019).
  66. Ozturk, I.; Acaravci, A. Electricity consumption and real GDP causality nexus: Evidence from ARDL bounds testing approach for 11 MENA countries. Appl. Energy 2011, 88, 2885–2892. [Google Scholar] [CrossRef]
  67. Nair, M.; Samudram, M.; Vaithilingam, S. Malaysian money demand function revisited: The ARDL approach. J. Asia Pac. Bus. 2008, 9, 193–209. [Google Scholar] [CrossRef]
  68. McLeod, R.H. Dealing with bank system failure: Indonesia, 1997–2003. Bull. Indones. Econ. Stud. 2004, 40, 95–116. [Google Scholar] [CrossRef]
  69. Kasri, R. Explaining the Twin Crises in Indonesia; Faculty of Economics and Business, University of Indonesia: Depok, Indonesia, 2011. [Google Scholar]
  70. Sharma, S.D. The Indonesian financial crisis: From banking crisis to financial sector reforms, 1997–2000. Indonesia 2001, 71, 79–110. [Google Scholar] [CrossRef] [Green Version]
  71. Jian, J.; Fan, X.; He, P.; Xiong, H.; Shen, H. The Effects of Energy Consumption, Economic Growth and Financial Development on CO2 Emissions in China: A VECM Approach. Sustainability 2019, 11, 4850. [Google Scholar] [CrossRef] [Green Version]
  72. Meng, M.; Lee, J.; Payne, J.E. RALS-LM unit root test with trend breaks and non-normal errors: Application to the Prebisch-Singer hypothesis. Stud. Nonlinear Dyn. Econom. 2017, 21, 31–45. [Google Scholar] [CrossRef]
  73. Shin, Y.; Yu, B.; Greenwood-Nimmo, M. Modelling asymmetric cointegration and dynamic multipliers in a nonlinear ARDL framework. In Festschrift in Honor of Peter Schmidt; Springer: New York, NY, USA, 2014; pp. 281–314. [Google Scholar]
Figure 1. Structural break in time series. EC: energy consumption; FD: financial development; GDPPC: gross domestic product per capita.
Sustainability 12 00005 g001
Table 1. Chow Test of breakpoint for the year 1997.
CountryVariables
EC
FDGDPPC
Malaysia36.5653 ***25.45166 ***17.04503 ***
Indonesia32.57413 ***29.58952 ***14.50024 ***
Philippines46.67442 ***14.14112 ***71.78095 ***
Singapore5.675828 ***2.469036 *9.513005 ***
Thailand49.66331 ***4.515376 ***24.24333 ***
Note: *, ** and *** indicate the level of significance at 10%, 5% and 1% respectively.
Table 2. Levin, Lin and Chu and Augmented Dickey–Fuller (ADF) unit root tests.
Levin, Lin and ChuADF Test
Null: Unit root (Assumes Common Unit Root Process)Null: Unit root (Assumes Individual Unit Root Process)
Test StatisticsProbabilityTest StatisticsProbability
Malaysia−3.109530.000911.33370.0786
Indonesia−2.704410.003410.35200.1106
Philippines3.224810.99942.075300.9126
Singapore−2.385120.00854.091170.6643
Thailand−3.237100.00069.200320.1626
Table 3. Zivot and Andrews unit root test results.
CountryVariables Test StatisticsOrder of Integration
MalaysiaECLevel−3.538905I (1)
First difference−8.066572 **
FDLevel−4.487476 I (1)
First difference−3.946545 ***
GDPPCLevel−2.735251I (1)
First difference−7.503437 ***
IndonesiaECLevel−4.924191I (1)
First difference−4.859985 ***
FDLevel−7.681760 ***I (0)
First difference−5.122355
GDPPCLevel−3.089788 ***I (0)
First difference−6.420811
PhilippinesECLevel−2.522312I (1)
First difference−5.759279 ***
FDLevel−2.987915I (1)
First difference−7.296979 ***
GDPPCLevel−1.635966I (1)
First difference−7.807071 *
SingaporeECLevel−3.832414 **I (0)
First difference−5.806963
FDLevel−3.792653 ***I (0)
First difference0.083147
GDPPCLevel−4.975770 **I (0)
First difference−6.545626
ThailandECLevel−3.860627I (1)
First difference−6.135177 ***
FDLevel0.000112 ***I (0)
First difference−5.576288
GDPPCLevel−2.777161I (1)
First difference−5.494244 **
Note: *, ** and *** indicate the level of significance at 10%, 5% and 1% respectively.
Table 4. Gregory and Hansen test of the effect of a structural break on cointegration.
CountryModelTest StatisticsCritical ValueReject H0
1%5%
MalaysiaC−3.88−5.44−4.92No
C/T−4.29−5.80−5.29
C/S−3.99−5.97−5.50
IndonesiaC−3.36−5.44−4.92No
C/T−5.20−5.80−5.29
C/S−4.68−5.97−5.50
PhilippinesC−3.42−5.44−4.92No
C/T−3.85−5.80−5.29
C/S−3.83−5.97−5.50
SingaporeC−4.99−5.44−4.92No
C/T−4.43−5.80−5.29
C/S−5.27−5.97−5.50
ThailandC−3.13−5.44−4.92No
C/T−3.92−5.80−5.29
C/S−5.67−5.97−5.50
Note: C, C/T and C/S represent a break in intercept, intercept and trend and full break models.
Table 5. Auto Regressive Distributed Lags (ARDL) bounds test.
CountriesModelsFDW Value
Malaysia(1,0,1)3.61671.79
Indonesia(4,0,2)2.13682.16
Philippines(1,3,1)7.23711.99
Singapore(4,4,3)7.59091.94
Thailand(4,4,4)5.29772.25
I (0)I (1)
Critical Value at 1%4.134.38
Critical Value at 5%3.13.87
Critical Value at 10%2.633.35
Note: DW stands for the Durbin–Watson statistic, which is a test for autocorrelation.

