Article

Influence of Microtopography and Alluvial Lowland Characteristics on Location and Development of Residential Areas in the Kuji River Basin of Japan

1
Department of Transdisciplinary Science and Engineering, Tokyo Institute of Technology, 4259 G5-4 Nagatsuda-cho, Midori-ku, Yokohama 226-8502, Japan
2
Aqua-restoration Research Center, Public Works Research Institute, Kawashima Kasada-machi, Kakamigahara-City 501-6021, Gifu Prefecture, Japan, [email protected]
3
Disaster Risk Reduction Research Center, Graduate School of Engineering, Kyushu University, 744 Motooka, Nishi-ku, Fukuoka-City 819-0395, Fukuoka Prefecture, Japan, [email protected]
*
Author to whom correspondence should be addressed.
Sustainability 2020, 12(1), 65; https://doi.org/10.3390/su12010065
Submission received: 29 November 2019 / Revised: 16 December 2019 / Accepted: 18 December 2019 / Published: 20 December 2019

Abstract

:
Adopting a comprehensive, basin-wide method for preventing flood disasters would be effective to deflect the climate-change-induced intensified water-related disasters. This study considers the land use and settlement patterns based on microtopography and flood risks. The influence of the microtopography and alluvial lowland characteristics on the location and development of residential areas in the Kuji River basin, Japan, is a fundamental aspect of historical knowledge. Investigating the relation between the microtopography and the location of antiquities shows that most of the relics dating to or before the third century were situated in the terraces near the lowlands. The development of lowlands near the mainstream of the Kuji River began around the third century. Furthermore, the relation between the microtopography and development of residential areas is investigated using building density as the development indicator. The results confirm the increase in building density in the alluvial surface, proving a history of flood damage and delayed development compared to other regions. This investigation reveals land development in areas, including the former river bed on the mouth of the Kuji River and the flood plain on the margins of the Hitachiota urban distinct, with no confirmed inhabitation before modern times because of elevated flooding risk.

1. Introduction

Floods are among the most severe disasters and cause much human damage and economic loss globally [1,2]. UNISDR (United Nations International Strategy for Disaster Risk Reduction) has reported that half of the victims of natural disasters (around 61.77 million) were flood victims in 2018 [3], and concerns are growing about increasing flood risk due to climate change, economic development, or population growth on a global scale [4,5,6].
On one hand, many of the deaths due to flood disasters are concentrated in developing countries such as India, China, and Bangladesh [7]. On the other hand, economic loss is serious in the developed countries although where flood prevention systems have been progressed. The annual average flood damage in Europe in the last few decades is about EUR 4 billion per year [8]. In addition, an economic loss of $ 9.256 billion occurred from 1972 to 2006 due to 531 severe floods in the United States [9].
Recently, floods exceeding design levels have occurred frequently centered around small and medium-size rivers in Japan. The Fifth Assessment Report of the Intergovernmental Panel on Climate Change (IPCC) pointed out that localized torrential rain is becoming more intense and frequent in mid-latitude areas [10], and some quantitative research has suggested that storm flows are increasing in Japanese rivers [11,12].
In seeking to reduce flood damage, conventional river engineering method such as continuous dikes, flood-control dams, and drainage pumps all have limitations. In recent years, flood prevention throughout an entire basin has been highlighted, including land-use regulation and appropriate evacuation behavior based on the concept of basin-wide comprehensive flood disaster prevention. The river council report of Japan in 2000 recognized the limitations of flood prevention that uses only flood control facilities, and it emphasized the necessity of using various measures in watersheds and rivers so that flood damage can be minimized even if a large flood occurs [13]. Furthermore, measures that have been recommended for flood control in an entire basin include (i) conserving natural levees and continuous embankments to prevent a flood from expanding, (ii) flood control measures based on land use, and (iii) induction of residence and urban function in areas with low risk of inundation [14,15,16,17]. In the fields of hydrology and river engineering, there has been much research into estimating the flood magnitude using frequency analysis and predicting, or recreating the inundation area using numerical simulation [18,19,20,21]. In response to advances in numerical simulation and hydrological frequency analysis, there has been research into appropriate land use for flood damage mitigation, and the configuration of the flood inundation area [22,23,24]. However, numerical simulation and frequency analysis have problems such as the uncertainty of certain scales, limitations on the number of external forces, and the dependence of the calculation results on the boundary conditions [25,26,27].
Awareness of the strong relationship between microtopography (MT) and inundation risk is important for mitigating the flood damage in the plain field where population and assets are concentrated. Differences in the height or deposition conditions of sand gravel in a deposition plain indicates the history of floods, from which we can determine the inundation frequency or duration by classifying the MT of the plain [28]. The relationship between MT and flood damage has been researched in the field of geography, focusing on the relationship between and MT and flood records [29,30,31]. Generally, the degree of safety against flood inundation is high in slightly elevated areas such as terraces and natural levees but low in former river beds or backmarshes. Therefore, people tended to live on natural levees and use backmarshes and floodplains as farmland to minimize the damage caused by a large-scale flood [32,33,34]. However, land development has progressed in lowland areas where the inundation risk is high, this being because of the decreased inundation frequency due to modern flood prevention projects including the construction of continuous embankments and flood control dams in recent years [35,36]. In the flooding of the Kinu River in the heavy rainfall disaster of September 2015 in the Japanese districts of Kanto and Tohoku, severe inundation damage occurred in residential areas and commercial facilities located on the floodplain or in the backmarshes. Based on that phenomenon, floodplain management considering future land-use change and population dynamics was proposed [37,38]. However, although there are some research examples and recommendations for reducing flood risk by controlling land use [39,40,41,42], social implementation is yet to be achieved.
Among MTs, natural levees, floodplains, and former river beds all belong to the alluvial lowland (AL). Therefore, the process whereby the AL forms is related strongly to how each MT forms and the inundation risk of each MT. Even in the same type of MT, the degree of consolidation differs because of the formation process and influences the vulnerability to natural disasters [43,44]. Therefore, the relationship between MT and village location seems to be influenced strongly by the MT formation process. The relationship between the AL formation process and the distribution of ruins has been researched in the Osaka Plain [45], the Kyoto Basin [46], the Nara Basin [47], and the Ota Delta [48]. These studies highlighted the importance of sea-level changes and sediment transport caused by a large-scale flood. River floods have both a natural history and a social history: the former directs the latter, and the latter reflects the former. In addition, social history encompasses at least several thousand years and is the result of continuous experiments that continue today [49]. The relationship between the MT formation process related to natural history, the location, and development of villages’ related to social history shows how nature influences social history, and it can be important when considering future large-scale flood countermeasures.
To mitigate the damage caused by large-scale floods, land-use regulation, or relocation to areas of low flood risk is necessary in addition to conventional engineering methods. To achieve basin-wide comprehensive flood prevention including the above, it is essential to have fundamental knowledge about (i) the formation processes of the MTs that comprise the watershed geography, (ii) the relationship between MT class and flood risk, and (iii) the history of settlement in the diverse MTs. In the present study, we investigated the relationship between MT or the AL formation process and the development of residential areas in the Kuji River (KR) basin of Japan as the basis of developing countermeasures against large floods by land use and residence form based on the inundation risk and MT. The conceptual framework of the present study is shown in Figure 1.

2. Methods

2.1. Location of Study Area

The study area is located in the downstream area of the KR, for which a landform classification map for flood control has been developed (Figure 2). The KR rises from Mt. Yamizo (1022 m above sea level) and flows into the Pacific Ocean with a length of 124 km and a basin area of 1490 km2.

2.2. Literature Investigation of Land Formation Process in Lowlands

To develop a flood prevention system for an entire basin, it is important to understand (i) the river channel characteristics related to flood flows and (ii) the topographic formation process of AL, which is the main place for land development. AL formed by repeated river inundation has complex geographical features, including slight elevations and lowlands. Furthermore, AL is affected directly by sea-level changes distributing various topographical surfaces with different formation times. On that basis, we conducted a literature investigation of the historical development of landform in the lowland area of the KR. In addition to research on AL classification [50] and the relationship between sea-level changes and land formation process [51], we used the landform classification map for flood control [52] and the longitudinal profile of the KR to investigate the relationship between the ratio of MT by AL classification and river channel profile. The land classification map classifies the properties and conditions of the landform by the formation period, formative process, morphology, and component material. Natural landform is divided broadly into mountains, hills, terraces, and lowland by the scale and formative process. Furthermore, lowland is subdivided into floodplain, natural levees, former river beds, and back marsh, among others. The classification results are applicable for understanding the conditions of historical floods, predicting inundation area and time, and estimating where levee breaks are likely to occur.
Takagi [50] organized the existing knowledge and classified the lowland area of the KR basin into three categories, namely (i) alluvial surface (AS) Ib, which formed as a delta and meandering channel with many former river channels, (ii) AS Ia, which comprises river-flood and wetland sediments and is located upstream of AS Ib, and (iii) AS II, which is distributed between AS Ia and is surrounded by the KR (Figure 3). Furthermore, because the surface slope and characteristics of deposited sediments differ between ASs Ia and Ib, Takagi [50] proposed that that the boundary indicates the sea level in the Holocene glacial retreat. Table 1 indicates the MT ratios of ASs Ia, Ib, and II using the landform classification maps for flood control. In AS Ib, which was seabed in the Holocene glacial retreat, the natural-levee ratio was 30%, whereas in AS Ia it was only 4% and most parts were occupied by the floodplain. In addition, the natural-levee and former-river-bed ratios were higher in AS II than in the other ASs, indicating that the river process was the main factor in the MT formation. In addition, we compared the changing point of the channel bed slope and the AS boundary to investigate how AS changes affect the river morphology. The channel bed slopes of the Kuji, Sato, and Yamada Rivers were obtained from information made publicly available by river managers [53].

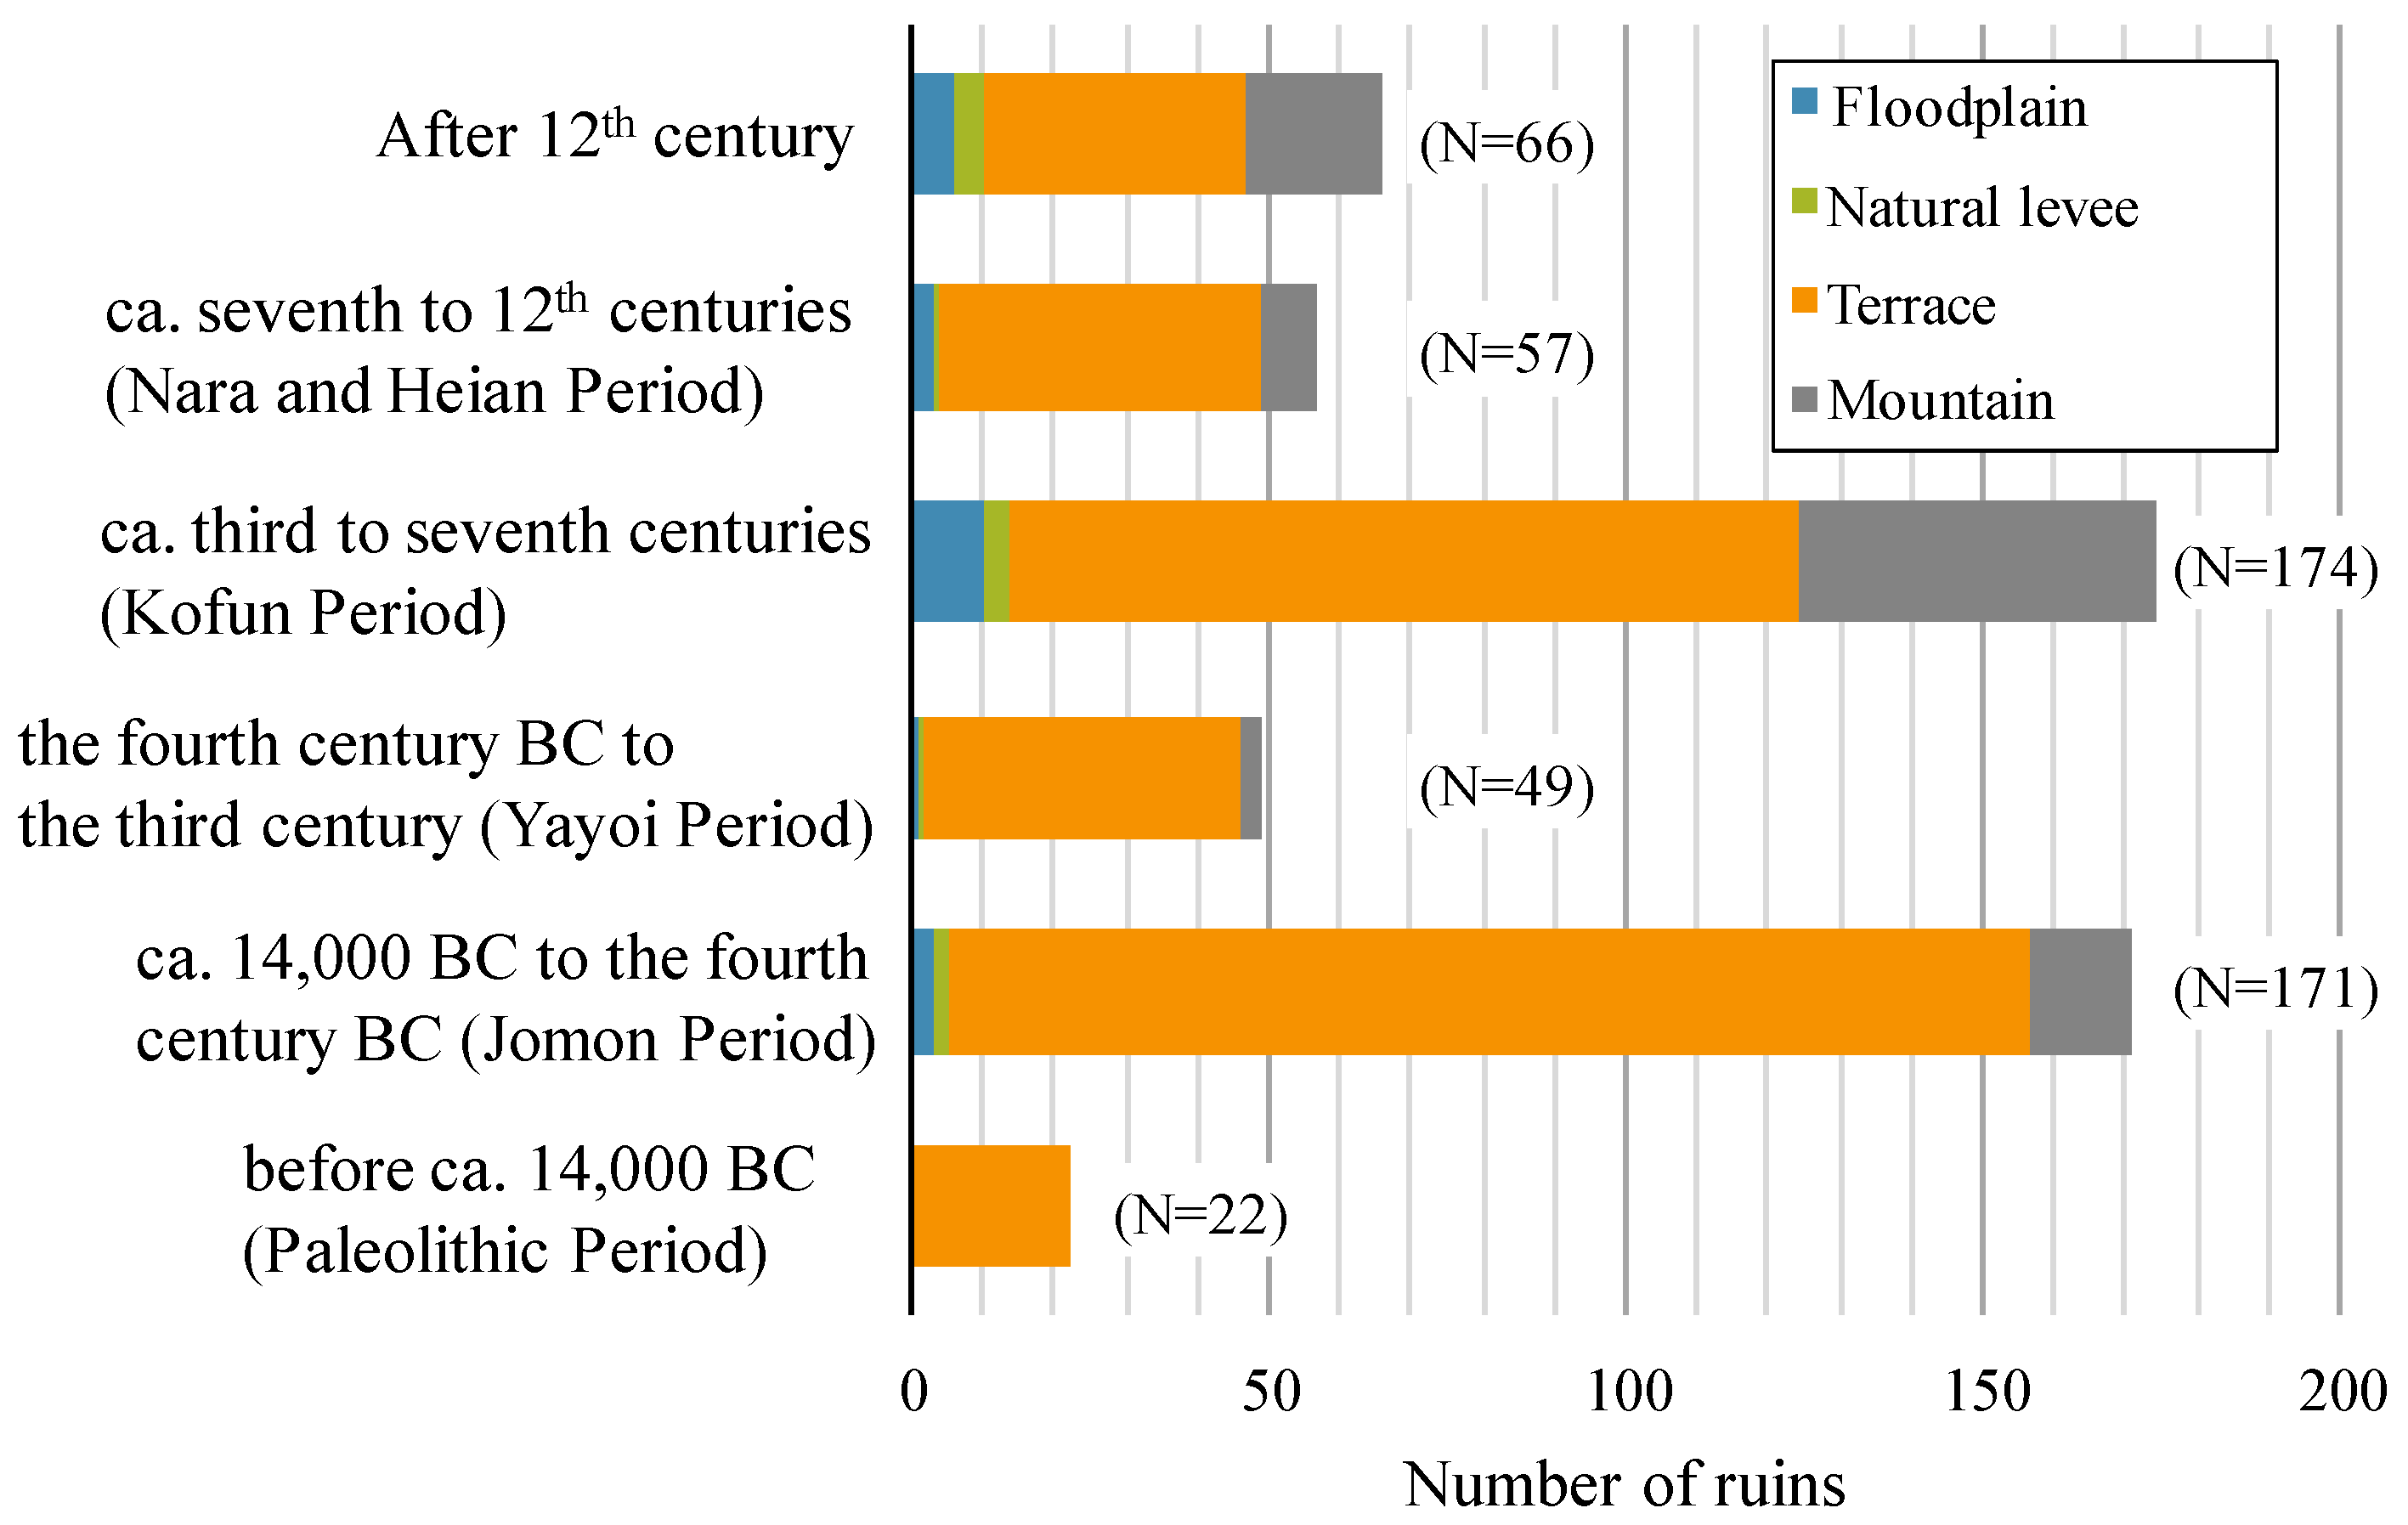
2.3. Relationship between Distribution of Ruins and Microtopography

To reveal the process whereby villages were located, we investigated the relationship between MT and the location and time of ruins. We collected the latter information from local city histories [54,55,56,57,58,59,60,61]. For ruins whose remains were excavated over multiple ages, the oldest age is shown as the start time of the ruins. For ruins whose remains were excavated over multiple ages, the oldest age is shown as the start time of the ruins. The excavated age was classified into the following six categories: (i) Before ca. 14,000 BC (Paleolithic Period), (ii) ca. 14,000 BC to the fourth century BC (Jomon Period), (iii) the fourth century BC to the third century (Yayoi Period), (iv) ca. third to seventh centuries (Kofun Period), (v) ca. seventh to 12th centuries (Nara and Heian Period), and (vi) after the 12th century. In addition, we coordinated the information of the distribution of the land-adjustment rice field, which is evidence for the consolidation of arable land holdings in the eighth to 16th centuries.

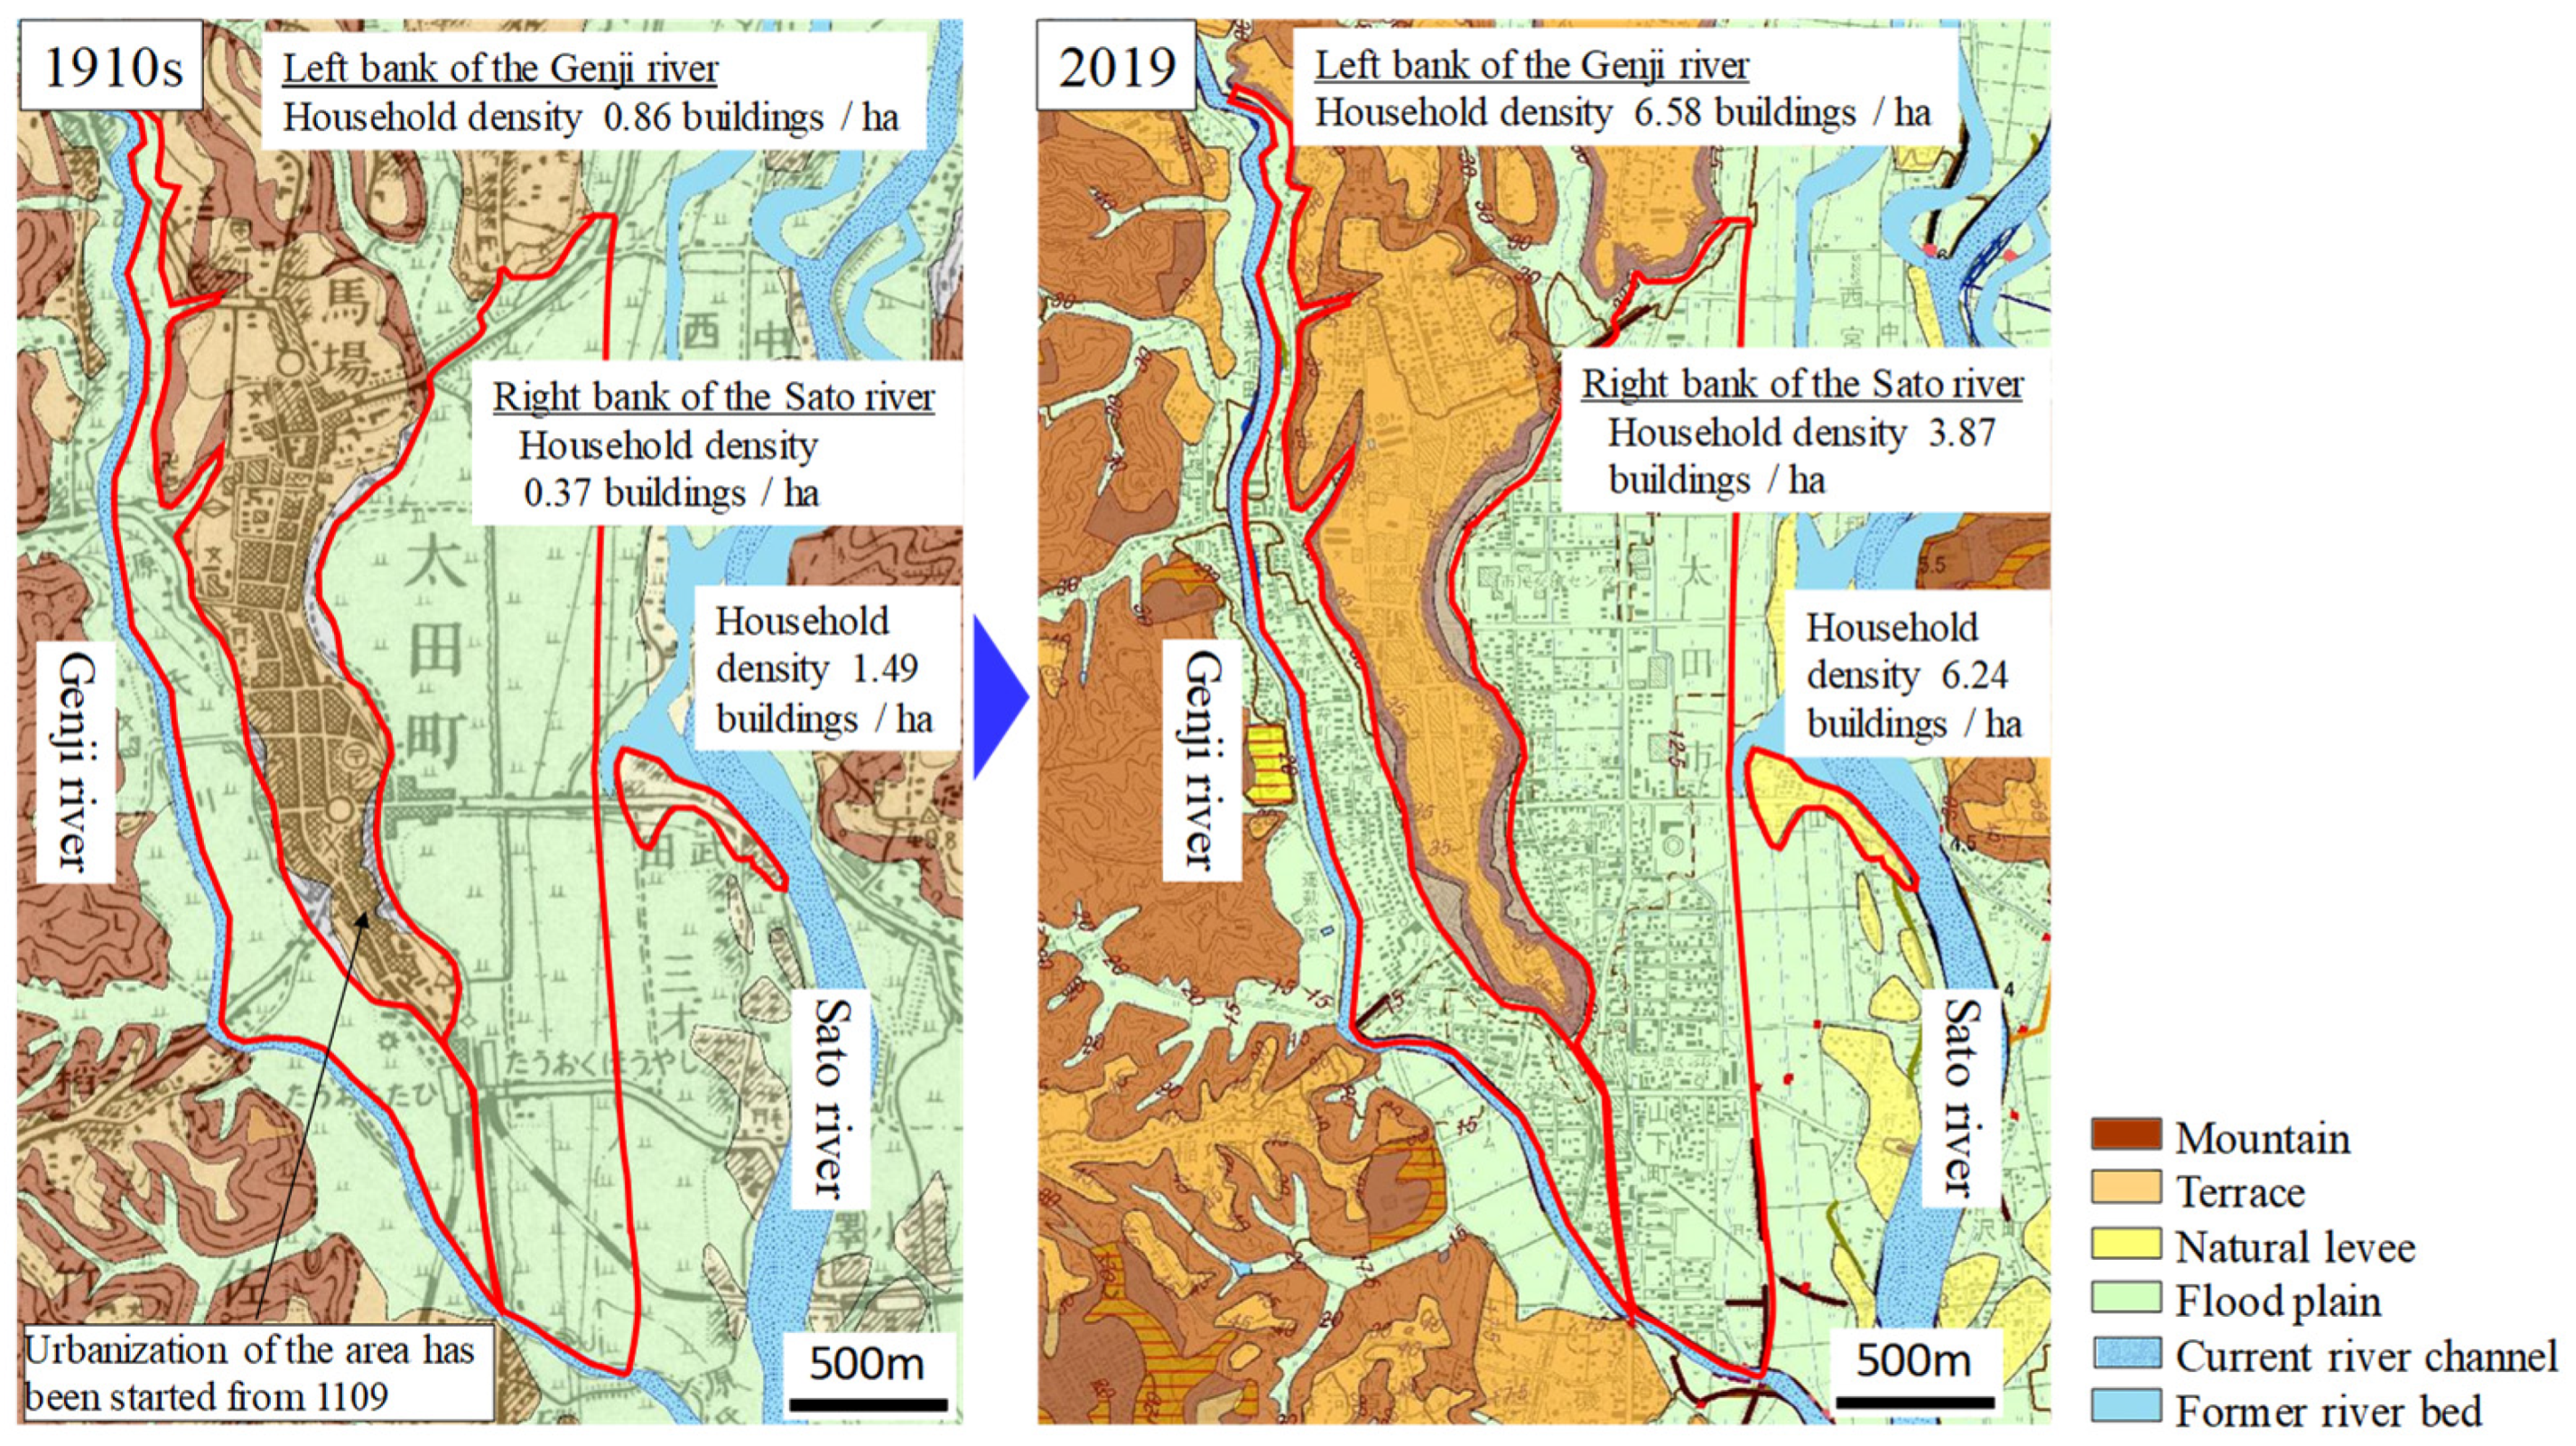
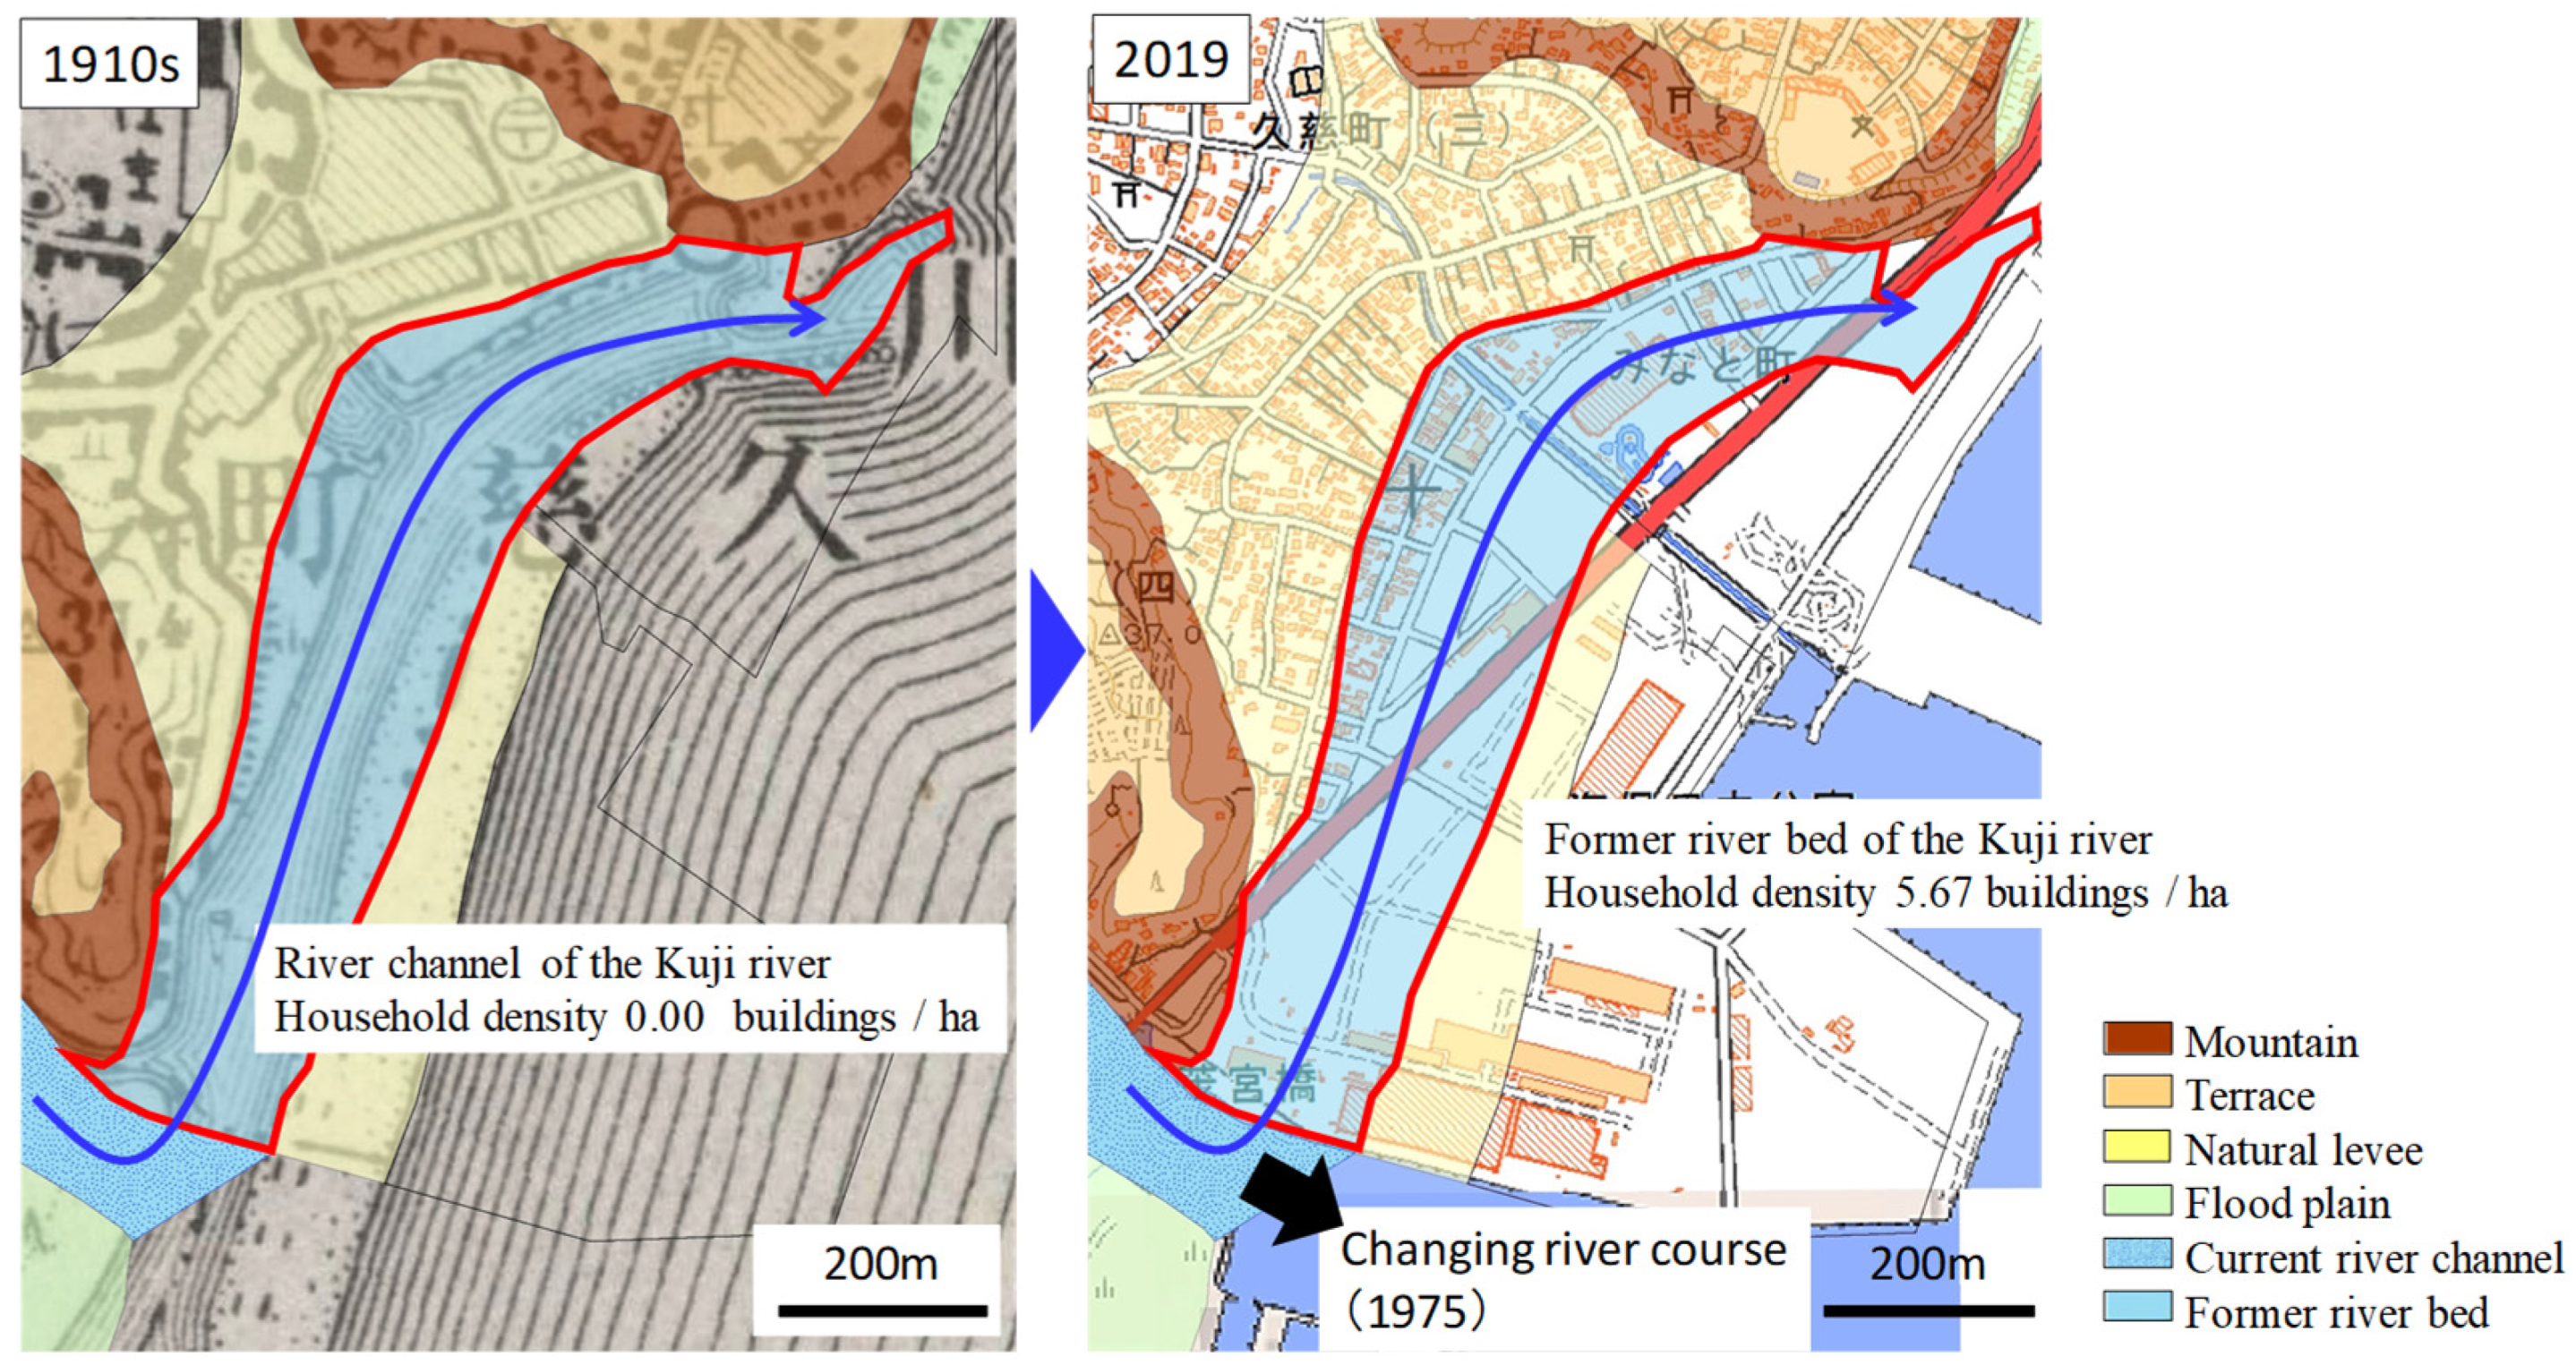
2.4. Relationship between Modern Village Development and Microtopography

We investigated the building density of each MT to reveal the relationship between village development and MT using 1:25,000 topographical maps from the 1910s [62,63,64,65,66], the 1970s [67,68,69,70,71], and 2019. We used building density as the indicator of village development. The types of MT, the total area of each MT, and the number of districts divided for calculating the building density are as follows: natural levee (1364 ha, 141 districts), floodplain (6591 ha, 237 districts), plateau (6758 ha, 109 districts), mountain (6758 ha, 296 districts), and piedmont aggraded slope (61 ha, 25 districts).

2.5. Statistical Analysis

To determine the significance of the difference in building density between times for each MT, we conducted a significant test as follows. We conducted the Bartlett test [72] to examine the uniformity of dispersion. In the event of equal variances, we conducted a one-way analysis of variance, and we also conducted an honestly significant difference test if the one-way analysis of variance confirmed a significant difference. In the event of nonequivalent dispersion in the Bartlett test, we conducted a Kruskal–Wallis test [73], and we conducted a Steel–Dwass test [74,75] if the Kruskal–Wallis test confirmed a significant difference. The significance level was p < 0.05. In addition, even with the same MT, the flood risk differs between ASs, and it is assumed that village development differs likewise. Therefore, we conducted a significant test between the ASs for three MTs (natural levee, floodplain, and former river bed). We used the statistical analysis software R (version 3.1.2) using the NSM3 R package to conduct all of the aforementioned analyses.

3. Results and Discussion

3.1. Topographical Formation Process of Lowland Area in KR Basin

We investigated the relationship between the channel slope and AS formation process (Figure 3). The river bed slope of the KR changes greatly at 7.5 km and 14.0 km from the river mouth: The longitudinal gradient of 0.0–7.5 km is 0.097%, that of 7.5–14.0 km is 0.71%, and that of 14.0–30.0 km is 1.11%. The most downstream changing point of the channel bed slope (7.5 km) generally corresponds to the boundary between sea and land in the Holocene glacial retreat proposed by Hayakawa and Yoshikawa (1984) [51] and boundary of ASs Ia and Ib [50]. The change point of the longitudinal channel slope is located upstream from that of the ASs because the sediment transported during flooding accumulates on AS Ib with a small gradient. Therefore, historically repeated sediment deposition shifts the change point of the channel slope upward, whereas the change point of the gradient of inland area corresponds nearly to the boundary between land and sea in the Holocene glacial retreat.
By contrast, most parts of the lowland area of the Sato River belong to AS Ia, and the boundary between land and sea in the Holocene glacial retreat is roughly 3.5 km upstream from the confluence with the KR [36]. The channel slope of the Sato River changes at around 2.5 km as a boundary, with 0.91% downstream and 4.76% upstream, whereas the gradient of the inland area is 0.67% downstream and 4.00% upstream. The change point of the gradient of the channel slope and inland generally corresponds to the boundary between land and sea in the Holocene glacial retreat, indicating the importance of sea-level rise for the landform process. Furthermore, the change point of the channel gradient is located farther upstream than the boundary between land and sea in the Holocene glacial retreat, which is because of sediment transport from upstream of the Sato River, like the KR. The longitudinal river profile is influenced strongly by tributary confluence, neo-tectonics, or active faults [76,77,78,79]. The change of the longitudinal gradient in the lowland area of the KR basin seems to be due to the sea level change in the Holocene glacial treat. This is because (i) the changing point corresponds to the boundary between sea and land in the Holocene glacial treat and (ii) the soil mechanics of Japanese ASs is influenced strongly by sea-level change [80].
Village development on natural levees located on AS II was delayed compared to that on the other ASs, and those villages have suffered from flood damage since the 1920s. The vulnerability to disasters and the degree of development differ depending on the topography formation process even in the same MT class, which is an important viewpoint for considering large-scale flood countermeasures in floodplains.

3.2. Microtopography and Village Development Process from Paleolithic Period to Early Modern Period

The number of ruins dating from the Paleolithic period to the early modern period for each MT is shown in Figure 4. In the area, many ruins dating from the Jomon period (ca. 14,000 BC to the fourth century BC) and the Kofun period (ca. third to seventh centuries) were confirmed, following ruins dating from the Nara and Heian periods (ca. seventh to 12th centuries). In ancient times (Paleolithic, Jomon, and Yayoi periods), most of the ruins were located on terraces, whereas some ruins dating from the Kofun period were located on the floodplain or the natural-levee or mountain area, indicating that the land development expanded from the terraces to the lowland and mountain area. Next, the relationship between the distribution of ruins and MT is shown in Figure 5. All 22 ruins dating from the Paleolithic period were located on terraces, especially in the terrace margin close to the KR [Naka Terrace (A), Nukada Terrace (B), and Urizura Hills (C)]. These areas are relatively close to the KR but are not affected directly by its flood damage. Therefore, these residential areas were thought to be selected in terms of flood disaster prevention and water utilization or fishing in rivers. By contrast, the ruins dating from the Jomon period were located on the terraces along the small tributaries of the KR. In addition, ruins dating from this period were confirmed in the terraces and mountains located on the left bank of the KR [Kuji Terrace (D), Taga Mountains (E), and Kuji Mountains (F)]. These ruins developed with the population growth from the Paleolithic period to the Jomon period, but the development remained on the terraces and plateau. Some of the ruins dating from the Yayoi period were located in the Naka Terrace, Nukada Terrace, and the left bank of the Yamada River. These areas close to the Kuji and Yamada Rivers were thought to have been developed from the perspective of water utilization for wet-rice agriculture. The late stage of the Jomon period was a time when the temperature dropped nationwide [81], and changes in living environment have been highlighted [82]. Reflecting these climatic influences, the number of ruins dating from the Yayoi period was lower than those from other periods (Figure 5). In the Kofun period, ruins were confirmed in the natural levee developed along the KR or the mountains along the tributaries. Development of the floodplain became possible through the improvement of civil engineering technology due to the construction of ancient tombs or securing a stable supply of workers because of the appearance of an authority such as the local ruling family.
The ruins dating from the Nara and Heian periods were centered on the terrace located on the right bank of the KR. The reason for the concentration of ruins in this area is thought to be related to the strong connection of the lower KR with ancient traffic routes. In the lowland of the KR, there was an official road connecting north and south, as well as transport routes connecting west and east for salt produced at the mouth of the KR [83]. The ruins dating from after the 12th century were located mainly either along these roads or at their confluences. Furthermore, ruins dating from the Paleolithic period to the early modern period were located along these roads, indicating that trade was an important factor in maintaining villages. By contrast, villages located along the small tributaries on terraces that were developed in the Jomon and Yayoi periods tend to be confirmed only in those periods in many cases.
Next, the relationship between the distribution of ruins and MT is shown in Figure 5. All 22 ruins dating from the Paleolithic period were located on terraces, especially in the terrace margin close to the KR [Naka Terrace (A), Nukada Terrace (B), and Urizura Hills (C)]. These areas are relatively close to the KR but are not affected directly by its flood damage. Therefore, these residential areas were thought to be selected in terms of flood disaster prevention and water utilization or fishing in rivers. By contrast, the ruins dating from the Jomon period were located on the terraces along the small tributaries of the KR. In addition, ruins dating from this period were confirmed in the terraces and mountains located on the left bank of the KR [Kuji Terrace (D), Taga Mountains (E), and Kuji Mountains (F)]. These ruins developed with the population growth from the Paleolithic period to the Jomon period, but the development remained on the terraces and plateau. Some of the ruins dating from the Yayoi period were located in the Naka Terrace, Nukada Terrace, and the left bank of the Yamada River. These areas close to the Kuji and Yamada Rivers were thought to have been developed from the perspective of water utilization for wet-rice agriculture. The late stage of the Jomon period was a time when the temperature dropped nationwide [82], and changes in living environment have been highlighted [83]. Reflecting these climatic influences, the number of ruins dating from the Yayoi period was lower than those from other periods (Figure 5). In the Kofun period, ruins were confirmed in the natural levee developed along the KR or the mountains along the tributaries. Development of the floodplain became possible through the improvement of civil engineering technology due to the construction of ancient tombs or securing a stable supply of workers because of the appearance of an authority such as the local ruling family.
The ruins dating from the Nara and Heian periods were centered on the terrace located on the right bank of the KR. The reason for the concentration of ruins in this area is thought to be related to the strong connection of the lower KR with ancient traffic routes. In the lowland of the KR, there was an official road connecting north and south, as well as transport routes connecting west and east for salt produced at the mouth of the KR [83]. The ruins dating from after the 12th century were located mainly either along these roads or at their confluences. Furthermore, ruins dating from the Paleolithic period to the early modern period were located along these roads, indicating that trade was an important factor in maintaining villages. By contrast, villages located along the small tributaries on terraces that were developed in the Jomon and Yayoi periods tend to be confirmed only in those periods in many cases.
In addition, land-adjustment rice fields, which are evidence of consolidation of arable land holdings (Figure 5, hatched area) were confirmed in the area surrounded by the natural levee and terraces near the left bank of the KR and along tributaries such as the Yamada, Asa, and Sato Rivers. Kagose [84] pointed out that the distributed area of the land-adjustment rice fields in the Kuji watershed was a lowland area with high water retention, thereby making it easy to avoid flood water from the main stream of the KR. Furthermore, paddy cultivation could use water that percolated from the terraces in these areas. The preferential development of the above area was thought to be due to the fact that the technological level at that time made it difficult to use the water from the KR directly. In addition, from the perspective of flood prevention, areas along the tributaries and away from the KR were developed initially for paddy fields.
In the early 1600s, development of new fields was frequently promoted by constructing weirs and holding ponds. After a severe famine in 1641–1642 in the area, the local lord decided to expand the paddy fields by constructing weirs and holding ponds, and 44 weirs and 88 holding ponds were constructed as a result. These projects promoted the changeover from dry fields to paddy fields. As a result, the crop yield of the beneficiary fields by the Tatsunoguchi weir was improved from 1,415,781 m3 in 1653 to 1,630,996 m3 in 1856 [85]. The land use of the KR basin was close to the present state in about 1800s because of the development of the previously undeveloped floodplain close to the KR in ancient times.

3.3. Microtopography and Village Development Process after 1900s

We investigated the number of buildings for each MT in the 1910s, 1970s, and 2019 to reveal the development process after the 1900s (Figure 6). In the targeted area, 13,590 buildings were confirmed in the 1910s, of which 58% were located on terraces and 24% were located on the natural levee, whereas the former river bed and the floodplain with high inundation risk accounted for only 0.6% and 9%, respectively. In the 1970s, the total number of buildings increased to 22,806. The terrace ratio increased to 62.2% and the natural-levee ratio decreased to 17.7%. In 2019, there were 36,097 buildings, roughly three times that in the 1910s, the natural-levee ratio decreased to 14%, and the floodplain and former-river-bed ratios increased slightly. In addition, the number of buildings in the mountains increased to 13.9%.
Boxplots comparing the building density in each distinct between times are shown in Figure 7. The top and bottom of each box indicate the third and first quartiles, respectively. The line at the top of the box indicates the largest value over than the value, calculated by (first quartile − 1.5 × (third quartile − first quartile)). The line at the bottom of the box indicates the smallest value less than the value, calculated by (third quartile − 1.5 × (third quartile − first quartile)). Except for the former river bed, the building density increased significantly from the 1910s to 2019 for each MT. Meanwhile, the increase in building density between times varied depending on the MT. As for the natural levee, a significant difference was confirmed between the 1900s and other times but was not confirmed between the 1970s and 2019. This result indicates that development on the natural levee was active after the 1910s and was almost complete by the 1970s. By contrast, on the floodplain a significant difference was confirmed between the 1970s and 2019 but was not confirmed between the 1910s and 1970s. This indicates that development on the natural levee was almost complete by the 1970s, and development progressed on the surrounding floodplain after the 1970s. Furthermore, no significant difference between times was confirmed in the former river bed, although the average building density tended to increase. On the terraces and in the mountains, a significant difference was confirmed between all times, indicating continuous development from the 1910s to date. In the 1910s, the MT with the highest building density was piedmont aggraded slope (2.71 buildings/ha) followed by natural levee (2.55 buildings/ha). Meanwhile, the building densities for former river bed (0.15 buildings/ha) and floodplain (0.28 buildings/ha) were lower than those for the other MTs. By contrast, in 2019 high building density was confirmed for piedmont aggraded slope (5.12 buildings/ha), natural levee (4.36 buildings/ha), and terrace (2.50 buildings/ha). This is because large-scale new settlements and industrial parks have been developed on the terraces and in the mountains.
Next, we discuss the area with dramatically increasing building density from the 1910s in the floodplain and former river bed. Figure 8 overlays the landform classification map for flood control and the topographic map in the urban area of the city of Hitachiota located on the right bank of the Sato River. Urbanization of the area began in 1109 when Ota Castle was constructed and progressed in the 1910s to some degree (Figure 8, left). However, in the 1910s the urban area was located only in the mountains and on the terraces, and the surrounding floodplain was used for paddy fields. However, in 2019 the urban area has extended to the floodplain and the building density is increasing remarkably (Figure 8, right). In addition, in the mouth of the KR, the river channel was shifted in 1975 to develop Hitachi port and reduce flood damage in the area. As a result, urbanization has progressed in the former riverbed (Figure 9). The aforementioned urbanized areas belong to the floodplain or former river bed with high inundation risk. Therefore, these areas require quantitative evaluation of flood inundation and countermeasures against large floods based on that evaluation.

3.4. Relationship between Alluvial Surface and Village Development

In Section 3.1, we noted that the lowland area of the KR was formed by three ASs (Figure 3) and that the vulnerability to flood inundation differs even in the same type of MT. In this subsection, we explain the relationship between AS and building density of MT in the 1910s, 1970s, and 2019.
The change in building density on the natural levee for each time is shown in Figure 10. In the 1910s, the building density for AS II was significantly lower than those for the other ASs. AS II was land even during the period of rising sea level, and the natural levee was formed by the river process. The development of the natural levee on AS II was delayed by flood inundation even though it is a natural levee. In actuality, the natural levee on AS II was damaged heavily by the floods of 1938 and 1941 [86]. Since the Meiji period, with the progressing improvement of the KR [53,87], the flood safety level of the natural levee on AS II has improved. As a result, the natural levee on AS II has developed, and no significant difference in building density was confirmed among the ASs in the 1970s.
On the floodplain, no significant difference was confirmed among the ASs in the 1910s but a significant difference between ASs Ia and II was confirmed because of the development of AS Ia. Similar results were obtained in 2019 (Figure 11). This result is due to the rapid development of the floodplain in AS Ia including the city of Hitachiota (Figure 8).
In the former river bed, no significant difference was confirmed in the 1910s and 2070s. By contrast, the building density in 2019 of AS Ib was significantly higher than those on the other ASs. This is because of the development of the river mouth and left-bank area of the Momiya River located on AS Ib. By contrast, no significant difference was confirmed between AS Ia and II in all ages (Figure 12).
In the 1910s, land development taking into account the flood risk was thought to be implemented because low building density was confirmed in the former river bed, flood plain, and natural levee located on AS II where the inundation risk is high. Over time, the river improvement project has reduced the inundation frequency of the inland area [87], and land development has progressed even in the area of potentially high flood risk. In addition, knowledge about the differing land development process depending on the AS even in the same MT is important for promoting countermeasure against large floods using adequate land use based on MT.

4. Conclusions

The objective of this study is to provide knowledge about the formation process of AL and the relationship between MT and land development. The knowledge reveals the relationship between human society and inundation risk, and this knowledge will contribute to large-scale flood countermeasures from the perspective of appropriate land use or relocation to areas with lower risk of flood inundation. The knowledge acquired from the results is summarized as follows.
1) The AL of the Kuji river was classified into AS Ib, which formed as a delta and meandering channel with many former river channels, AS Ia, which comprises river-flood and wetland sediments, and AS II, which is dominated by the former river bed and natural levees formed by the river process. On AS II, the household density was lower than on the other ASs, suggesting that the land development may have been delayed by river flooding. The fact that the risk of flood damage varies depending on the formation process, even in the same MT class, is an important finding for flood countermeasures based on appropriate land use.
2) As a result of investigating the relationship between MT and land development based on the distribution of ruins, settlement and farmland was extended from (i) the terrace margin close to the KR and (ii) the natural levee close to the small tributaries to (iii) the KR floodplain. These developments may reflect the improvement of water utilization technology, increasing engineering workforce, and demand for increased food production. Based on the process of land development in the KR, land use that involves using the floodplain with high inundation risk as cultivated land and the natural levees, or terraces with low inundation risk as settlement is considered to be the basis for flood prevention.
3) In the targeted areas, significant increases in building density were confirmed between the 1910s and 2019 in all MTs without the former river bed. In addition, rapid land development was confirmed in the flood-prone areas where land development was not confirmed in the 1910s. However, these areas have potentially high inundation risks, therefore it is necessary to quantify the risk of large-scale flooding and restructure the appropriate land use. In addition, taking into account the social issues such as population decline and increasing deserted cultivated land facing Japan, flood countermeasures should be planned based on appropriate land use and relocation to areas with low flood risk.

Author Contributions

R.I. directed the research program and wrote the paper, K.O. organized the geographical information, and T.S. conducted the topographic surveys. All authors have read and agreed to the published version of the manuscript.

Funding

This work was supported by the Ministry of Land, Infrastructure, Transport and Tourism of the Japanese Government.

Conflicts of Interest

The authors declare no conflict of interest.

References

  1. Sanyal, J.; Lu, X.X. Application of Remote Sensing in Flood Management with Special Reference to Monsoon Asia: A Review. Nat. Hazards 2004, 33, 283–301. [Google Scholar] [CrossRef]
  2. Kundzewicz, Z.W.; Lugeri, N.; Dankers, R.; Hirabayashi, Y.; Döll, P.; Pińskwar, I.; Dysarz, T.; Hochrainer, S.; Matczak, P. Assessing river flood risk and adaptation in Europe—Review of projections for the future. Mitig. Adapt. Strat. Glob. Chang. 2010, 15, 641–656. [Google Scholar] [CrossRef]
  3. UNDRR. 2018: Extreme Weather Events Affected 60m People. 2019. Available online: https://www.unisdr.org/archive/63267 (accessed on 14 October 2019).
  4. Mills, E. Insurance in a climate of change. Science 2005, 309, 1040–1044. [Google Scholar] [CrossRef] [PubMed] [Green Version]
  5. Chang, H.; Franczyk, J. Climate Change, Land-Use Change, and Floods: Toward an Integrated Assessment. Geogr. Compass 2008, 2, 1549–1579. [Google Scholar] [CrossRef]
  6. Güneralp, B.; Güneralp, I.; Liu, Y. Changing global patterns of urban exposure to flood and drought hazards. Glob. Environ. Chang. 2015, 31, 217–225. [Google Scholar] [CrossRef]
  7. Hu, P.; Zhang, Q.; Shi, P.; Chen, B.; Fang, J. Flood-induced mortality across the globe: Spatiotemporal pattern and influencing factors. Sci. Total Environ. 2018, 643, 171–182. [Google Scholar] [CrossRef] [PubMed]
  8. Barredo, J.I. Major flood disasters in Europe: 1950–2005. Nat. Hazards 2007, 42, 125–148. [Google Scholar] [CrossRef]
  9. Changnon, S.A. Assessment of Flood Losses in the United States. J. Contemp. Water Res. Educ. 2008, 138, 38–44. [Google Scholar] [CrossRef]
  10. IPCC. Summary for Policymakers. In Climate Change 2013: The Physical Science Basis; Contribution of Working Group I to the Fifth Assessment Report of the Intergovernmental Panel on Climate Change; Cambridge University Press: Cambridge, UK; New York, NY, USA, 2013. [Google Scholar]
  11. Sato, A.; Kawagoe, S.; Kazama, S.; Sawamoto, M. Evaluation of flood damages by numerical simulation and extreme precipitation data. Proc. Hydraul. Eng. 2008, 52, 433–438. [Google Scholar] [CrossRef]
  12. Tachikawa, Y.; Takino, S.; Fujioka, Y.; Yorozu, K.; Kim, S.; Shiiba, M. Projection of river discharge of Japanese river basins under a climate change scenario. J. Jpn. Soc. Civ. Eng. 2011, 67, 1–15. [Google Scholar] [CrossRef] [Green Version]
  13. Kadomatsu, T. River Council’s Report on “Basic Policies of Water Resources Management for the 21st Century”. Water Sci. 2000, 40, 83–107. [Google Scholar]
  14. Ministry of Land, Infrastructure, Transport and Tourism; Water and Disaster Management Bureau; River Planning Division; River Planning Coordination Office. Interim report of Climate Change Adaptation to Cope with Water-related Disasters due to Global Warming: Share the disaster risk information and sense of crisis, to society to tackle disaster risk reduction. Public Works Manag. J. 2015, 442, 12–15. [Google Scholar]
  15. Hall, J.W. Handling uncertainty in the hydroinformatic process. J. Hydroinform. 2003, 5, 215–232. [Google Scholar] [CrossRef] [Green Version]
  16. Hall, J.W.; Penning-Rowsell, E.C. Setting the scene for flood risk management. In Flood Risk Science and Management; Faulkner, H., Pender, G., Eds.; Blackwell: Oxford, UK, 2011; pp. 3–16. [Google Scholar]
  17. Faulkner, H.; McCarthy, S.; Tunstall, S. Flood risk communication. In Flood Risk Science and Management; Faulkner, H., Pender, G., Eds.; Blackwell: Oxford, UK, 2011; pp. 386–406. [Google Scholar]
  18. Burns, D.H. Evaluation of regional flood frequency analysis with a region of influence approach. Water Resour. Res. 1990, 26, 2257–2266. [Google Scholar] [CrossRef]
  19. Ward, P.J.; Bouwman, A.; Bierkens, M.F.P.; Ligtvoet, W.; Winsemius, H.C.; Jongman, B.; Weiland, F.S.; Van Beek, R. Assessing flood risk at the global scale: Model setup, results, and sensitivity. Environ. Res. Lett. 2013, 8, 044019. [Google Scholar] [CrossRef]
  20. Yue, S.; Ouarda, T.; Bobée, B.; Legendre, P.; Bruneau, P. The Gumbel mixed model for flood frequency analysis. J. Hydrol. 1999, 226, 88–100. [Google Scholar] [CrossRef]
  21. Teng, J.; Jakeman, A.; Vaze, J.; Croke, B.; Dutta, D.; Kim, S. Flood inundation modelling: A review of methods, recent advances and uncertainty analysis. Environ. Model. Softw. 2017, 90, 201–216. [Google Scholar] [CrossRef]
  22. Rodríguez-Gaviria, E.M.; Ochoa-Osorio, S.; Builes-Jaramillo, A.; Botero-Fernández, V. Computational Bottom-Up Vulnerability Indicator for Low-Income Flood-Prone Urban Areas. Sustainability 2019, 11, 4341. [Google Scholar] [CrossRef] [Green Version]
  23. Garcia-Ayllon, S. Long-Term GIS Analysis of Seaside Impacts Associated to Infrastructures and Urbanization and Spatial Correlation with Coastal Vulnerability in a Mediterranean Area. Water 2018, 10, 1642. [Google Scholar] [CrossRef] [Green Version]
  24. Mishra, B.K.; Rafiei Emam, A.; Masago, Y.; Kumar, P.; Regmi, R.K.; Fukushi, K. Assessment of future flood inundations under climate and land use change scenarios in the Ciliwung River Basin, Jakarta. J. Flood. Risk. Manag. 2018, 11, S1105–S1115. [Google Scholar] [CrossRef]
  25. Merz, B.; Kreibich, H.; Thieken, A.; Schmidtke, R. Estimation uncertainty of direct monetary flood damage to buildings. Nat. Hazards Earth Syst. Sci. 2004, 4, 153–163. [Google Scholar] [CrossRef] [Green Version]
  26. Hall, J.W.; Tarantola, S.; Bates, P.D.; Horritt, M.S. Distributed Sensitivity Analysis of Flood Inundation Model Calibration. J. Hydraul. Eng. 2005, 131, 117–126. [Google Scholar] [CrossRef]
  27. Werner, M.; Blazkova, S.; Petr, J. Spatially distributed observations in constraining inundation modelling uncertainties. Hydrol. Process. 2005, 19, 3081–3096. [Google Scholar] [CrossRef]
  28. Oya, M. Topographical survey map of the middle and lower courses of the Kanogawa river basin showing classification of floods stricken areas. Geogr. Rev. Jpn. 1960, 33, 156–162. [Google Scholar] [CrossRef] [Green Version]
  29. Iwatsuka, S. The Character of Flood Damages caused by Kanogawa Typhoon. Geogr. Rev. Jpn. 1960, 33, 97–104. [Google Scholar] [CrossRef]
  30. Nagumo, N.; Kubo, S. 2011 Flooding and Fluvial Micro Landforms in the Cambodian Lower Mekong Plain. E-J. GEO 2013, 8, 141–152. [Google Scholar] [CrossRef] [Green Version]
  31. Hiramatsu, Y.; Yasui, S.; Urabe, A.; Hongo, M. Flood Disaster along Kariyata River Caused by Heavy Rainfall on 13 July 2004, Niigata Prefecture, Central Japan-The Relation of the Current Processes of the Flood to the Landforms. J. Jpn. Soc. Eng. Geol. 2005, 46, 153–161. [Google Scholar] [CrossRef]
  32. Yamamuro, T. The Location of the Remains of Yayoi Age in Okayama Plain. Jpn. J. Hum. Geogr. 1979, 31, 437–448. [Google Scholar] [CrossRef]
  33. Iseki, H. Changes on the Deltaic Plains in Japan. Quat. Res. 1972, 11, 117–123. [Google Scholar] [CrossRef]
  34. Ando, M. The Inhabitants’ Life in the Lowland of the Kiso, Nagara and Ibi Rivers. J. Geogr. 1988, 97, 91–106. [Google Scholar] [CrossRef]
  35. Tanabe, T.; Okuma, T. A Study on the Roles and Effects of “NOKOSHI” on the Jobaru-River Basin: Example of Flood Control that Allows Overflowing and its Future Possibility. Hist. Stud. Civ. Eng. 2001, 21, 147–158. [Google Scholar]
  36. Ueno, T. On some problems in river administration and flood control measures fitting in the twenty-first century. Disaster Prev. Res. Inst. Annu. 2001, 45, 433–448. [Google Scholar]
  37. Nakamura, F.; Shimatani, Y.; Nishihiro, J.; Ohtsuki, K.; Itsukushima, R.; Yamada, H. Investigation team for the 2015 flood disaster in Kinu River organized by the president of Ecology and Civil Engineering Society. Report on flood disaster in Kinu River, occurred in September, 2015. Ecol. Civ. Eng. 2017, 19, 259–267. [Google Scholar] [CrossRef]
  38. Itsukushima, R. Countermeasures against floods that exceed design levels based on topographical and historical analyses of the September 2015 Kinu River flooding. J. Hydrol. Reg. Stud. 2017, 19, 211–223. [Google Scholar] [CrossRef]
  39. Cœur, D.; Lang, M. Use of documentary sources on past flood events for flood risk management and land planning. C. R. Geosci. 2008, 340, 644–650. [Google Scholar] [CrossRef]
  40. Posthumus, H.; Hewett, C.; Morris, J.; Quinn, P. Agricultural land use and flood risk management: Engaging with stakeholders in North Yorkshire. Agric. Water Manag. 2008, 95, 787–798. [Google Scholar] [CrossRef]
  41. Saito, S.; Ubaura, M. Problem and Actual Condition of Regulation of Building Restrictions to Reduce Flood Damage: Article 39 of the Building Standards Law. J. City Plan. Inst. Jpn. 2012, 47, 445–450. [Google Scholar]
  42. Teramoto, M.; Ichikawa, Y.; Tachikawa, Y.; Shiiba, M. Study on applicability of landuse regulation strategies based on flood risk assessment. Annu. J. Hydraul. Eng. JSCE 2010, 66, 130–144. [Google Scholar]
  43. Kadomura, H. Ground-geology and natural disasters due to soft ground conditions in the Shizuka-Shimizu region, central Japan. J. Geogr. 1966, 75, 226–248. [Google Scholar] [CrossRef] [Green Version]
  44. Endo, K.; Ishiwata, S.; Hori, S.; Nakao, Y. Tokyo Lowland and Chuseki-so: Formation of the Soft Ground and Jomon Transgression. J. Geogr. 2013, 122, 968–991. [Google Scholar] [CrossRef] [Green Version]
  45. Nukata, M. The Location of Relics and Paleogeographical Changes in the Northeastern Part of the Osaka Plain. Jpn. J. Hum. Geogr. 1993, 45, 416–431. [Google Scholar] [CrossRef]
  46. Nakatsuka, R. Micromorphological Analysis in Koizumi River Alluvial Lowland, Central Area of Yamashiro Basin, Kyoto Prefecture: Investigation of Morphogenetic Processes and Recent Tectonic Movement based on Archaeologic Chronological data. Ann. Tohoku Geogr. Assoc. 1991, 43, 1–18. [Google Scholar]
  47. Kawasumi, T. Geo-environmental Changes and Land Development History after the Middle of the Yayoi Period in the “Asuka-Fujiwara Region”, Nara Basin, West Japan. Jpn. J. Hum. Geogr. 2001, 53, 477–493. [Google Scholar] [CrossRef]
  48. Watanabe, F. Geomorphic Development of the Ota River Lowland, Southern Part of the Fukuroi City, Shizuoka Prefecture, Japan. Q. J. Geogr. 1995, 47, 103–118. [Google Scholar] [CrossRef] [Green Version]
  49. Koide, H. Japanese River. Natural History and Social History; University of Tokyo Press: Tokyo, Japan, 1974. [Google Scholar]
  50. Takagi, I. Microtopography and land development in the alluvial plain–lowland area of the Kuji and Naka river. Proc. Inst. Nat. Sci. Nihon Univ. 1969, 5, 55–70. [Google Scholar]
  51. Hayakawa, T.; Yoshikawa, A. Stratigraphy of Alluvium and Development of Alluvial Plain in Lower Part of Kuji River Basin, in Ibaraki Prefecture. Bull. Fac. Educ. Ibaraki Univ. Nat. Sci. 1984, 33, 1–16. [Google Scholar]
  52. Geographical Survey Institute. Landform Classification Map for Flood Control. 2007. Available online: http://maps.gsi.go.jp (accessed on 14 October 2019).
  53. Ministry of Land, Infrastructure, Transport and Tourism. Operation and Maintenance Plan of the Kuji River; Ministry of Land, Infrastructure, Transport and Tourism: Tokyo, Japan, 2012. [Google Scholar]
  54. Tokai City History Editing Committee. History of Tokai City: The General History; Tokai City History Editing Committee: Tokai, Japan, 1992. [Google Scholar]
  55. Naka City History Editing Committee. History of Naka City: Natural Environment and Primitive Age; Naka City History Editing Committee: Naka, Japan, 1998. [Google Scholar]
  56. Urizura City History Editing Committee. History of Urizura City; Urizura City History Editing Committee: Urizura, Japan, 1993. [Google Scholar]
  57. Hitachiota City History Editing Committee. History of Hitachiota City: The General History; Hitachiota City History Editing Committee: Hitachiota, Japan, 1978. [Google Scholar]
  58. Omiya City History Editing Committee. History of Omiya City; Omiya City History Editing Committee: Omiya, Japan, 1977. [Google Scholar]
  59. Yamakata City Conservation Research Society for Cultural Properties. History of Yamakata City; Yamakata City Conservation Research Society for Cultural Properties: Yamakata, Japan, 1976. [Google Scholar]
  60. Ibaraki Prefecture History Editing Committee. History of Ibaraki Prefecture, the Primitive Period; Ibaraki Prefecture History Editing Committee: Ibaraki, Japan, 1985. [Google Scholar]
  61. Ibaraki Prefecture History Editing Committee. History of Ibaraki Prefecture, the Middle Ages; Ibaraki Prefecture History Editing Committee: Ibaraki, Japan, 1986. [Google Scholar]
  62. Japanese Imperial Land Survey 1/25,000 Scale Map; Japanese Imperial Land Survey: Yamakata, Japan, 1916.
  63. Japanese Imperial Land Survey 1/25,000 Scale Map; Japanese Imperial Land Survey: Hitachiota, Japan, 1915.
  64. Japanese Imperial Land Survey 1/25,000 Scale Map; Japanese Imperial Land Survey: Hitachikuji, Japan, 1915.
  65. Japanese Imperial Land Survey 1/25,000 Scale Map; Japanese Imperial Land Survey: Ishiduka, Japan, 1916.
  66. Japanese Imperial Land Survey 1/25,000 Scale Map; Japanese Imperial Land Survey: Hitachiomiya, Japan, 1916.
  67. Geospatial Information Authority of Japan. 1/25,000 Scale Map; Geospatial Information Authority of Japan: Yamakata, Japan, 1970. [Google Scholar]
  68. Geospatial Information Authority of Japan. 1/25,000 Scale Map; Geospatial Information Authority of Japan: Hitachiota, Japan, 1971. [Google Scholar]
  69. Geospatial Information Authority of Japan. 1/25,000 Scale Map; Geospatial Information Authority of Japan: Hitachikuji, Japan, 1972. [Google Scholar]
  70. Geospatial Information Authority of Japan. 1/25,000 Scale Map; Geospatial Information Authority of Japan: Ishiduka, Japan, 1973. [Google Scholar]
  71. Geospatial Information Authority of Japan. 1/25,000 Scale Map; Geospatial Information Authority of Japan: Hitachiomiya, Japan, 1975. [Google Scholar]
  72. Bartlett, M.S. Properties of sufficiency and statistical tests. Proc. R. Soc. 1937, 160, 268–282. [Google Scholar]
  73. Hollander, M.; Wolfe, D.A. Non-Parametric Statistical Methods; John Wiley and Sons: New York, NY, USA, 1973. [Google Scholar]
  74. Steel, R.G.D. A Rank Sum Test for Comparing All Pairs of Treatments. Technometrics 1960, 2, 197–207. [Google Scholar] [CrossRef]
  75. Dwass, M. Some k-sample rank-order tests. In Contributions to Probability and Statistics; Olkin, I., Ed.; Stanford University Press: Stanford, CA, USA, 1960; pp. 198–202. [Google Scholar]
  76. Benda, L.; Andras, K.; Miller, D.; Bigelow, P. Confluence effects in rivers: Interactions of basin scale, network geometry, and disturbance regimes. Water Resour. Res. 2004, 40, W054021–W0540215. [Google Scholar] [CrossRef]
  77. Sarker, M.H.; Thorne, C.R.; Aktar, M.N.; Ferdous, R. Morpho-dynamics of the Brahmaputra-Jamuna River, Bangladesh. Geomorphology 2014, 215, 45–59. [Google Scholar] [CrossRef]
  78. Ianniruberto, M.; Trevethan, M.; Pinheiro, A.; Andrade, J.F.; Dantas, E.; Filizola, N.; Santos, A.; Gualtieri, C. A field study of the confluence between Negro and Solimões Rivers. Part 2: Bed morphology and stratigraphy. C. R. Geosci. 2018, 350, 43–54. [Google Scholar] [CrossRef]
  79. Kale, V.S.; Sengupta, S.; Achyuthan, H.; Jaiswal, M.K. Tectonic controls upon Kaveri River drainage, cratonic Peninsular India: Inferences from longitudinal profiles, morphotectonic indices, hanging valleys and fluvial records. Geomorphology 2014, 227, 153–165. [Google Scholar] [CrossRef]
  80. Yamamoto, K. Alluvial River; Gihodo Shuppan Co. Ltd.: Tokyo, Japan, 2010. [Google Scholar]
  81. Komoto, M. Climatic oscillations and archaeology. Kumamoto J. Cult. Humanit. 2008, 97, 1–52. [Google Scholar]
  82. Habu, J. Mechanisms of long-term culture change and human impacts on the environment: A perspective from historical ecology, with special reference to the Early and Middle Jomon periods of prehistoric Japan. Quat. Res. 2015, 54, 299–310. [Google Scholar] [CrossRef]
  83. Naka City History Editing Committee. River and Road of the Naka Terrace in the Middle Ages; Naka City History Editing Committee: Naka, Japan, 2018. [Google Scholar]
  84. Kagose, Y. A study of the Jôri system paddy fields around Mito city. Geogr. Rev. Jpn. 1971, 44, 765–779. [Google Scholar] [CrossRef]
  85. Nogami, T. Irrigation water use in the Mito Domain. Hist. Res. 1960, 29, 36–41. [Google Scholar]
  86. Aizawa, Y. Flood management of the Kuji River. Side Kuji River 2002, 15, 30–42. [Google Scholar]
  87. Association for Promoting the Improvement of the Kuji River. Development History of the Improvement of the Kuji River; Association for Promoting the Improvement of the Kuji River: Hitachiota, Japan, 1979. [Google Scholar]
Figure 1. Conceptual framework of present study.
Sustainability 12 00065 g001
Figure 2. Location of study site.
Sustainability 12 00065 g002
Figure 3. Microtopography (MT) and alluvial surfaces (ASs) in alluvial lowland (AL) of Kuji River (KR).
Sustainability 12 00065 g003
Figure 4. Number of excavations of each era and MT in study area.
Sustainability 12 00065 g004
Figure 5. Distribution of ruins and MT in study area.
Sustainability 12 00065 g005
Figure 6. Transition of number of buildings in each MT class.
Sustainability 12 00065 g006
Figure 7. Building density in MT of each age: (a) natural levee; (b) flood plain; (c) former river bed; (d) plateau and terrace; (e) mountainous land; (f) piedmont aggraded slope.
Sustainability 12 00065 g007
Figure 8. Development of urban distinct of Hitachiota city and MT (the red line indicates the unit used to calculate household density).
Sustainability 12 00065 g008
Figure 9. Shift of river channel in mouth of KR and development of former river bed (the red line indicates the unit used to calculate household density).
Sustainability 12 00065 g009
Figure 10. Comparison of building density of each AS between eras in natural levee: (a) 1910s; (b) 1970s; (c) 2019.
Sustainability 12 00065 g010
Figure 11. Comparison of building density of each AS between eras on floodplain: (a) 1910s; (b) 1970s; (c) 2019.
Sustainability 12 00065 g011
Figure 12. Comparison of building density of each AS between eras in former river bed: (a) 1910s; (b) 1970s; (c) 2019.
Sustainability 12 00065 g012
Table 1. Proportion of MT in each AS.
MicrotopographyAlluvial Surface
І aІ bII
Former river bed111 ha (9%)103 ha (4%)180 ha (20%)
Floodplain750 ha (63%)2463 ha (92%)397 ha (45%)
Natural levee333 ha (28%)117 ha (4%)306 ha (35%)

