Flexural Performance Evaluation of Novel Wide Long-Span Composite Beams Used to Construct Lower Parking Structures


Abstract
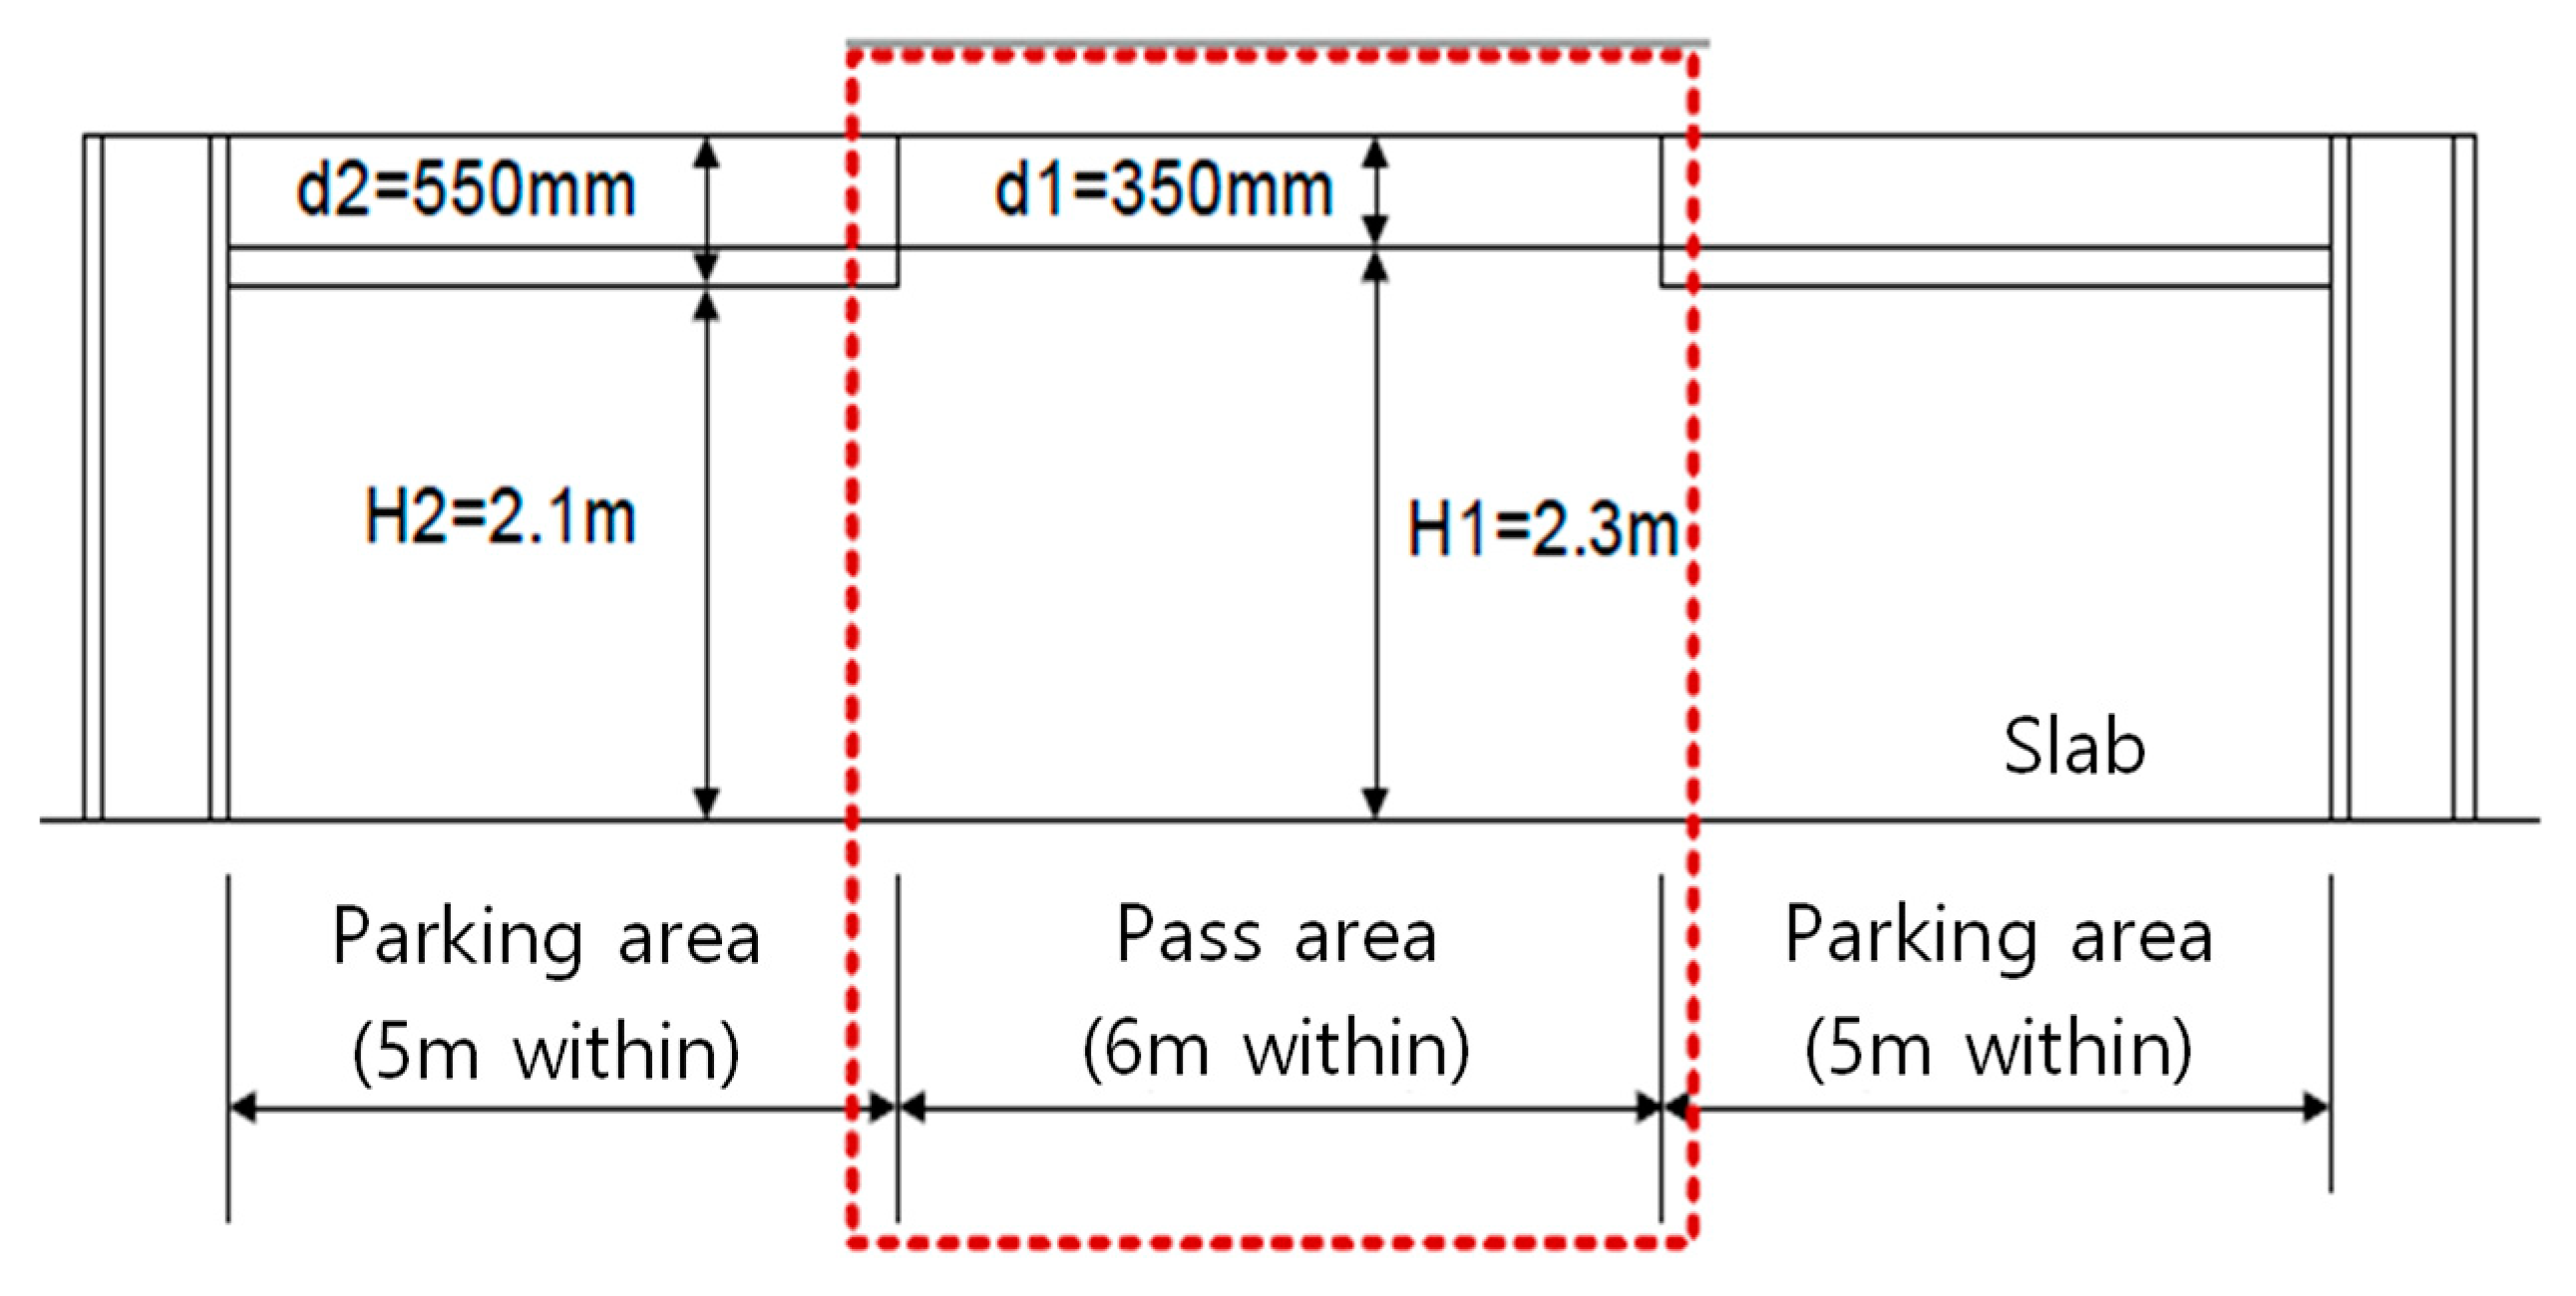
:1. Introduction
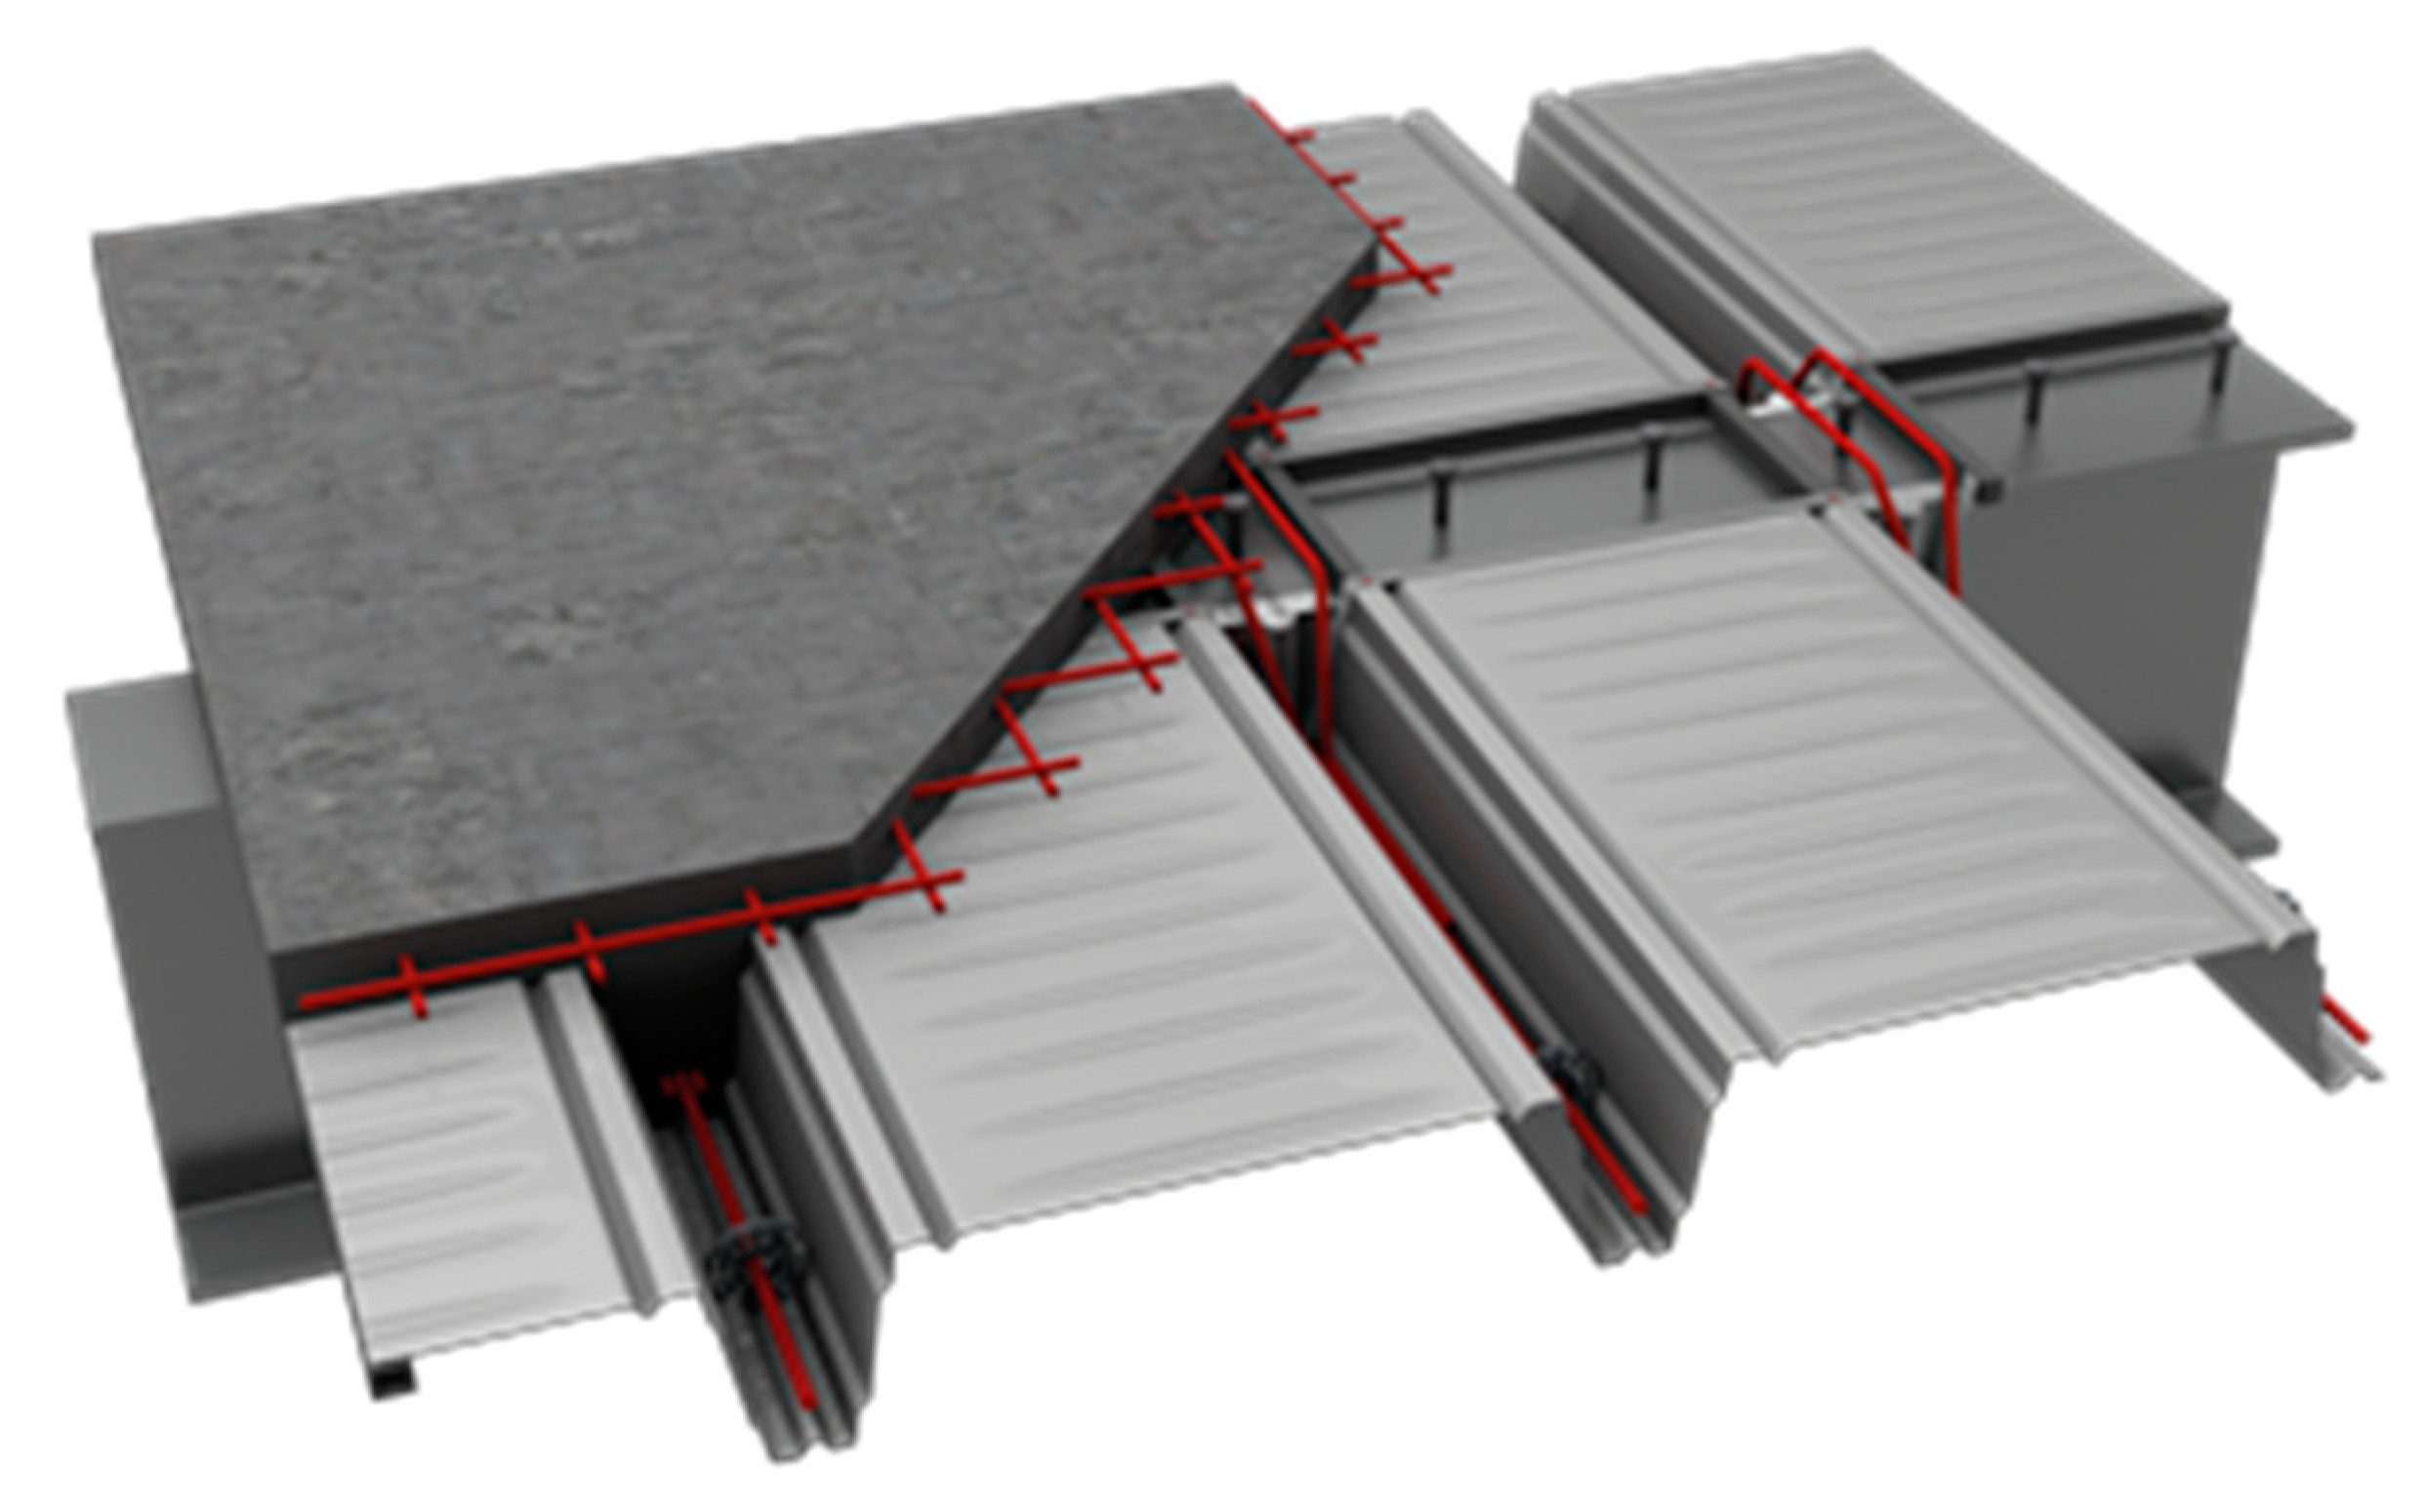
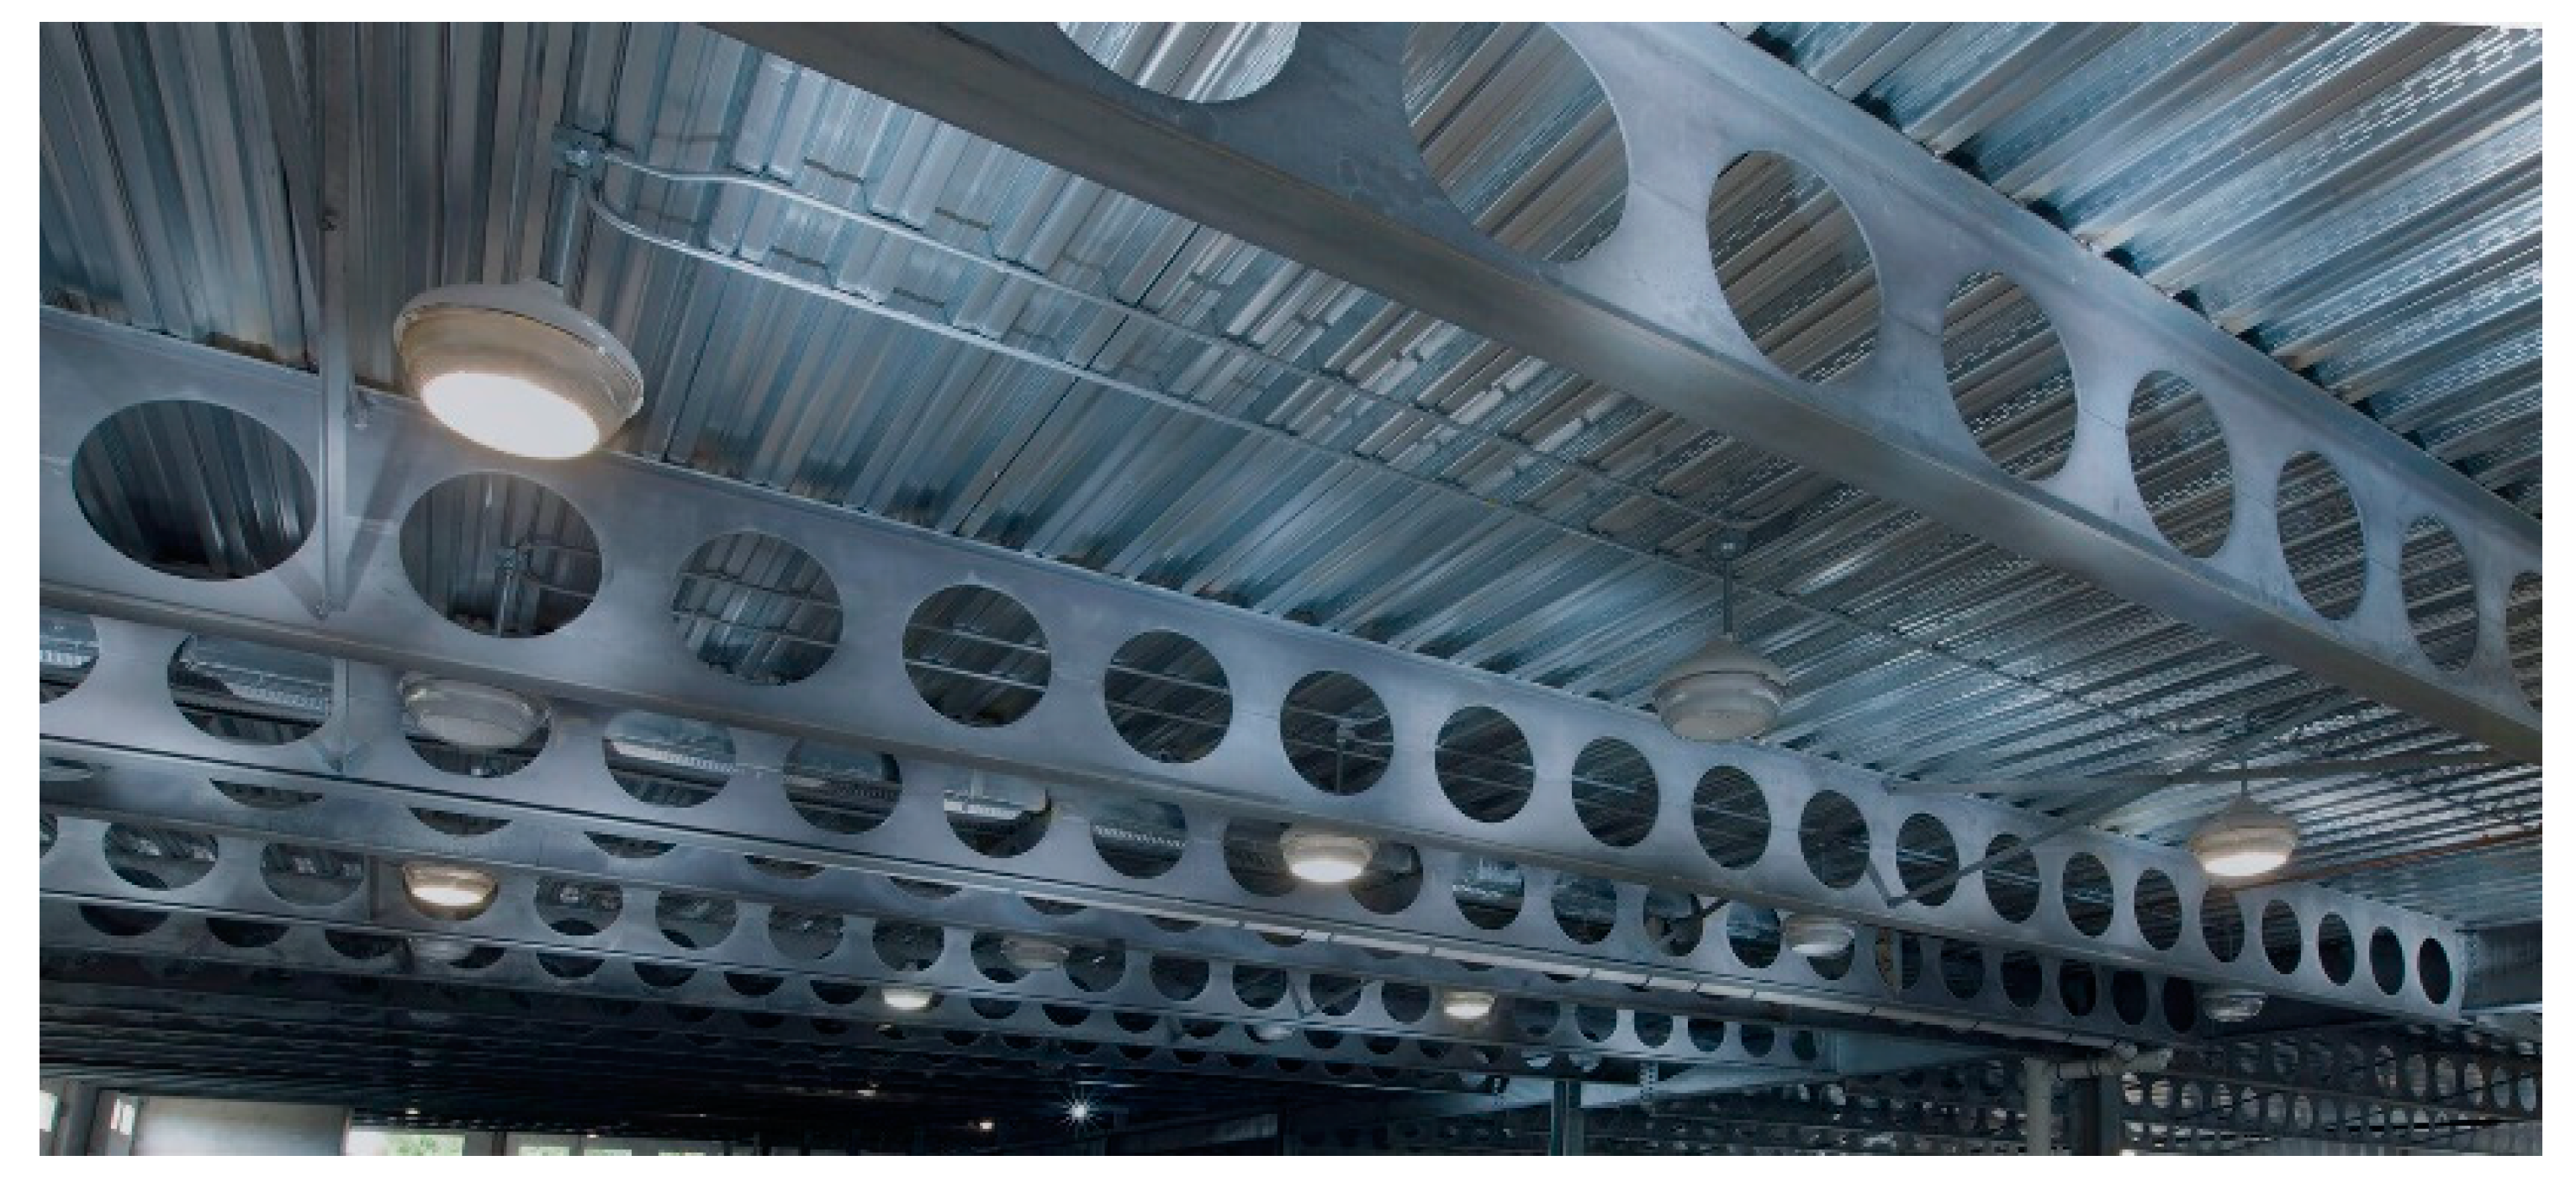
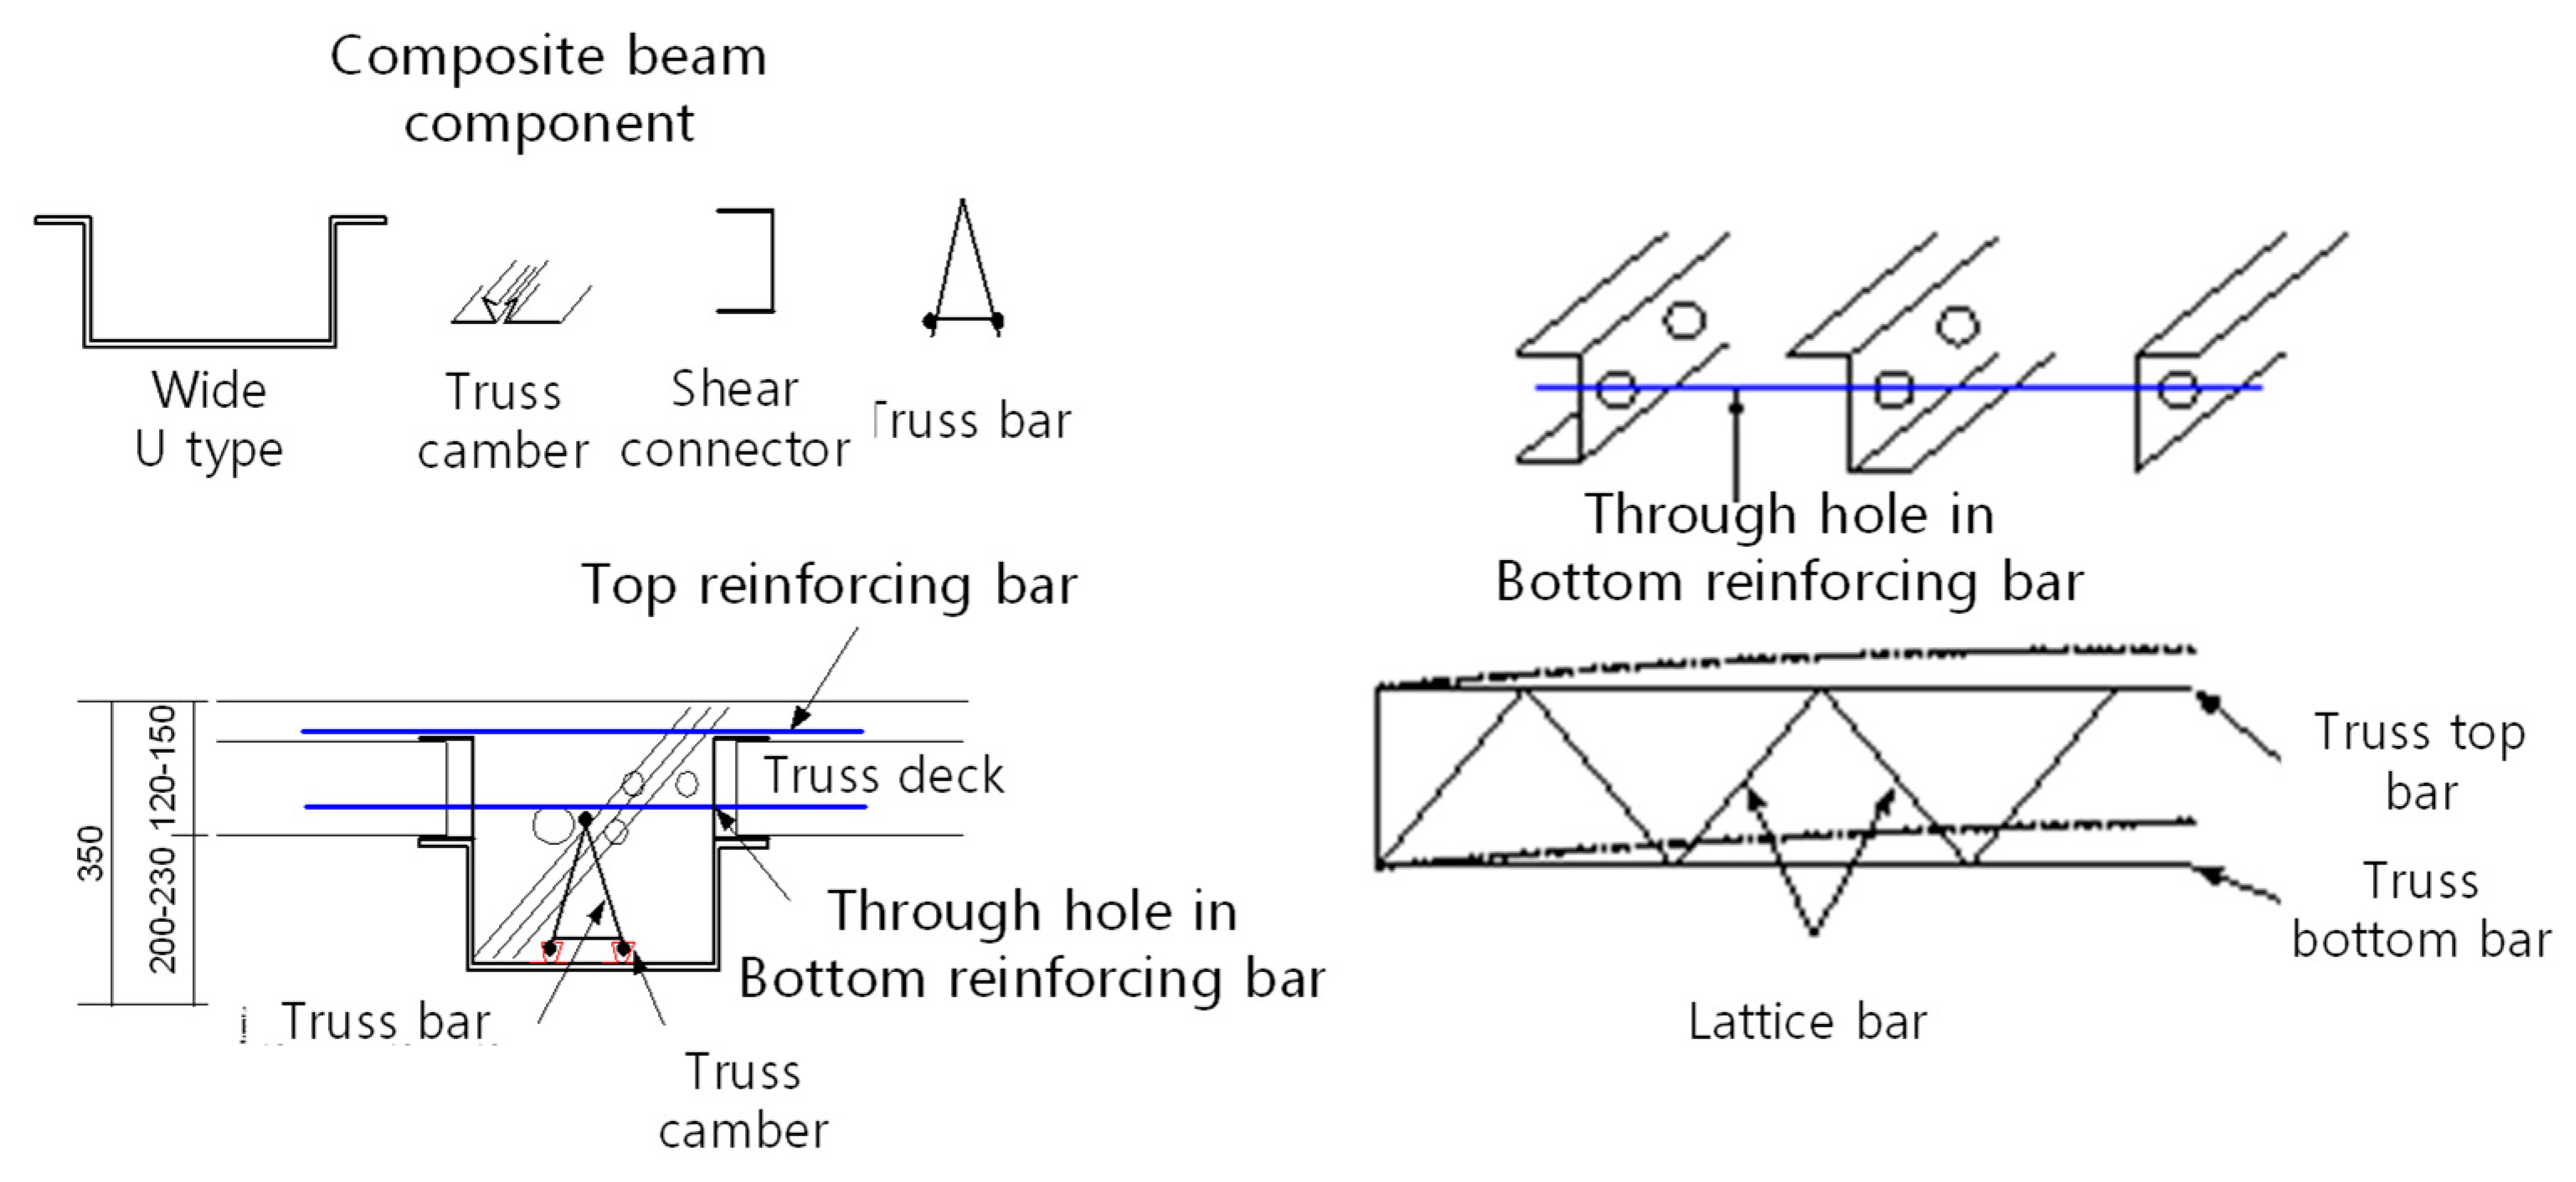
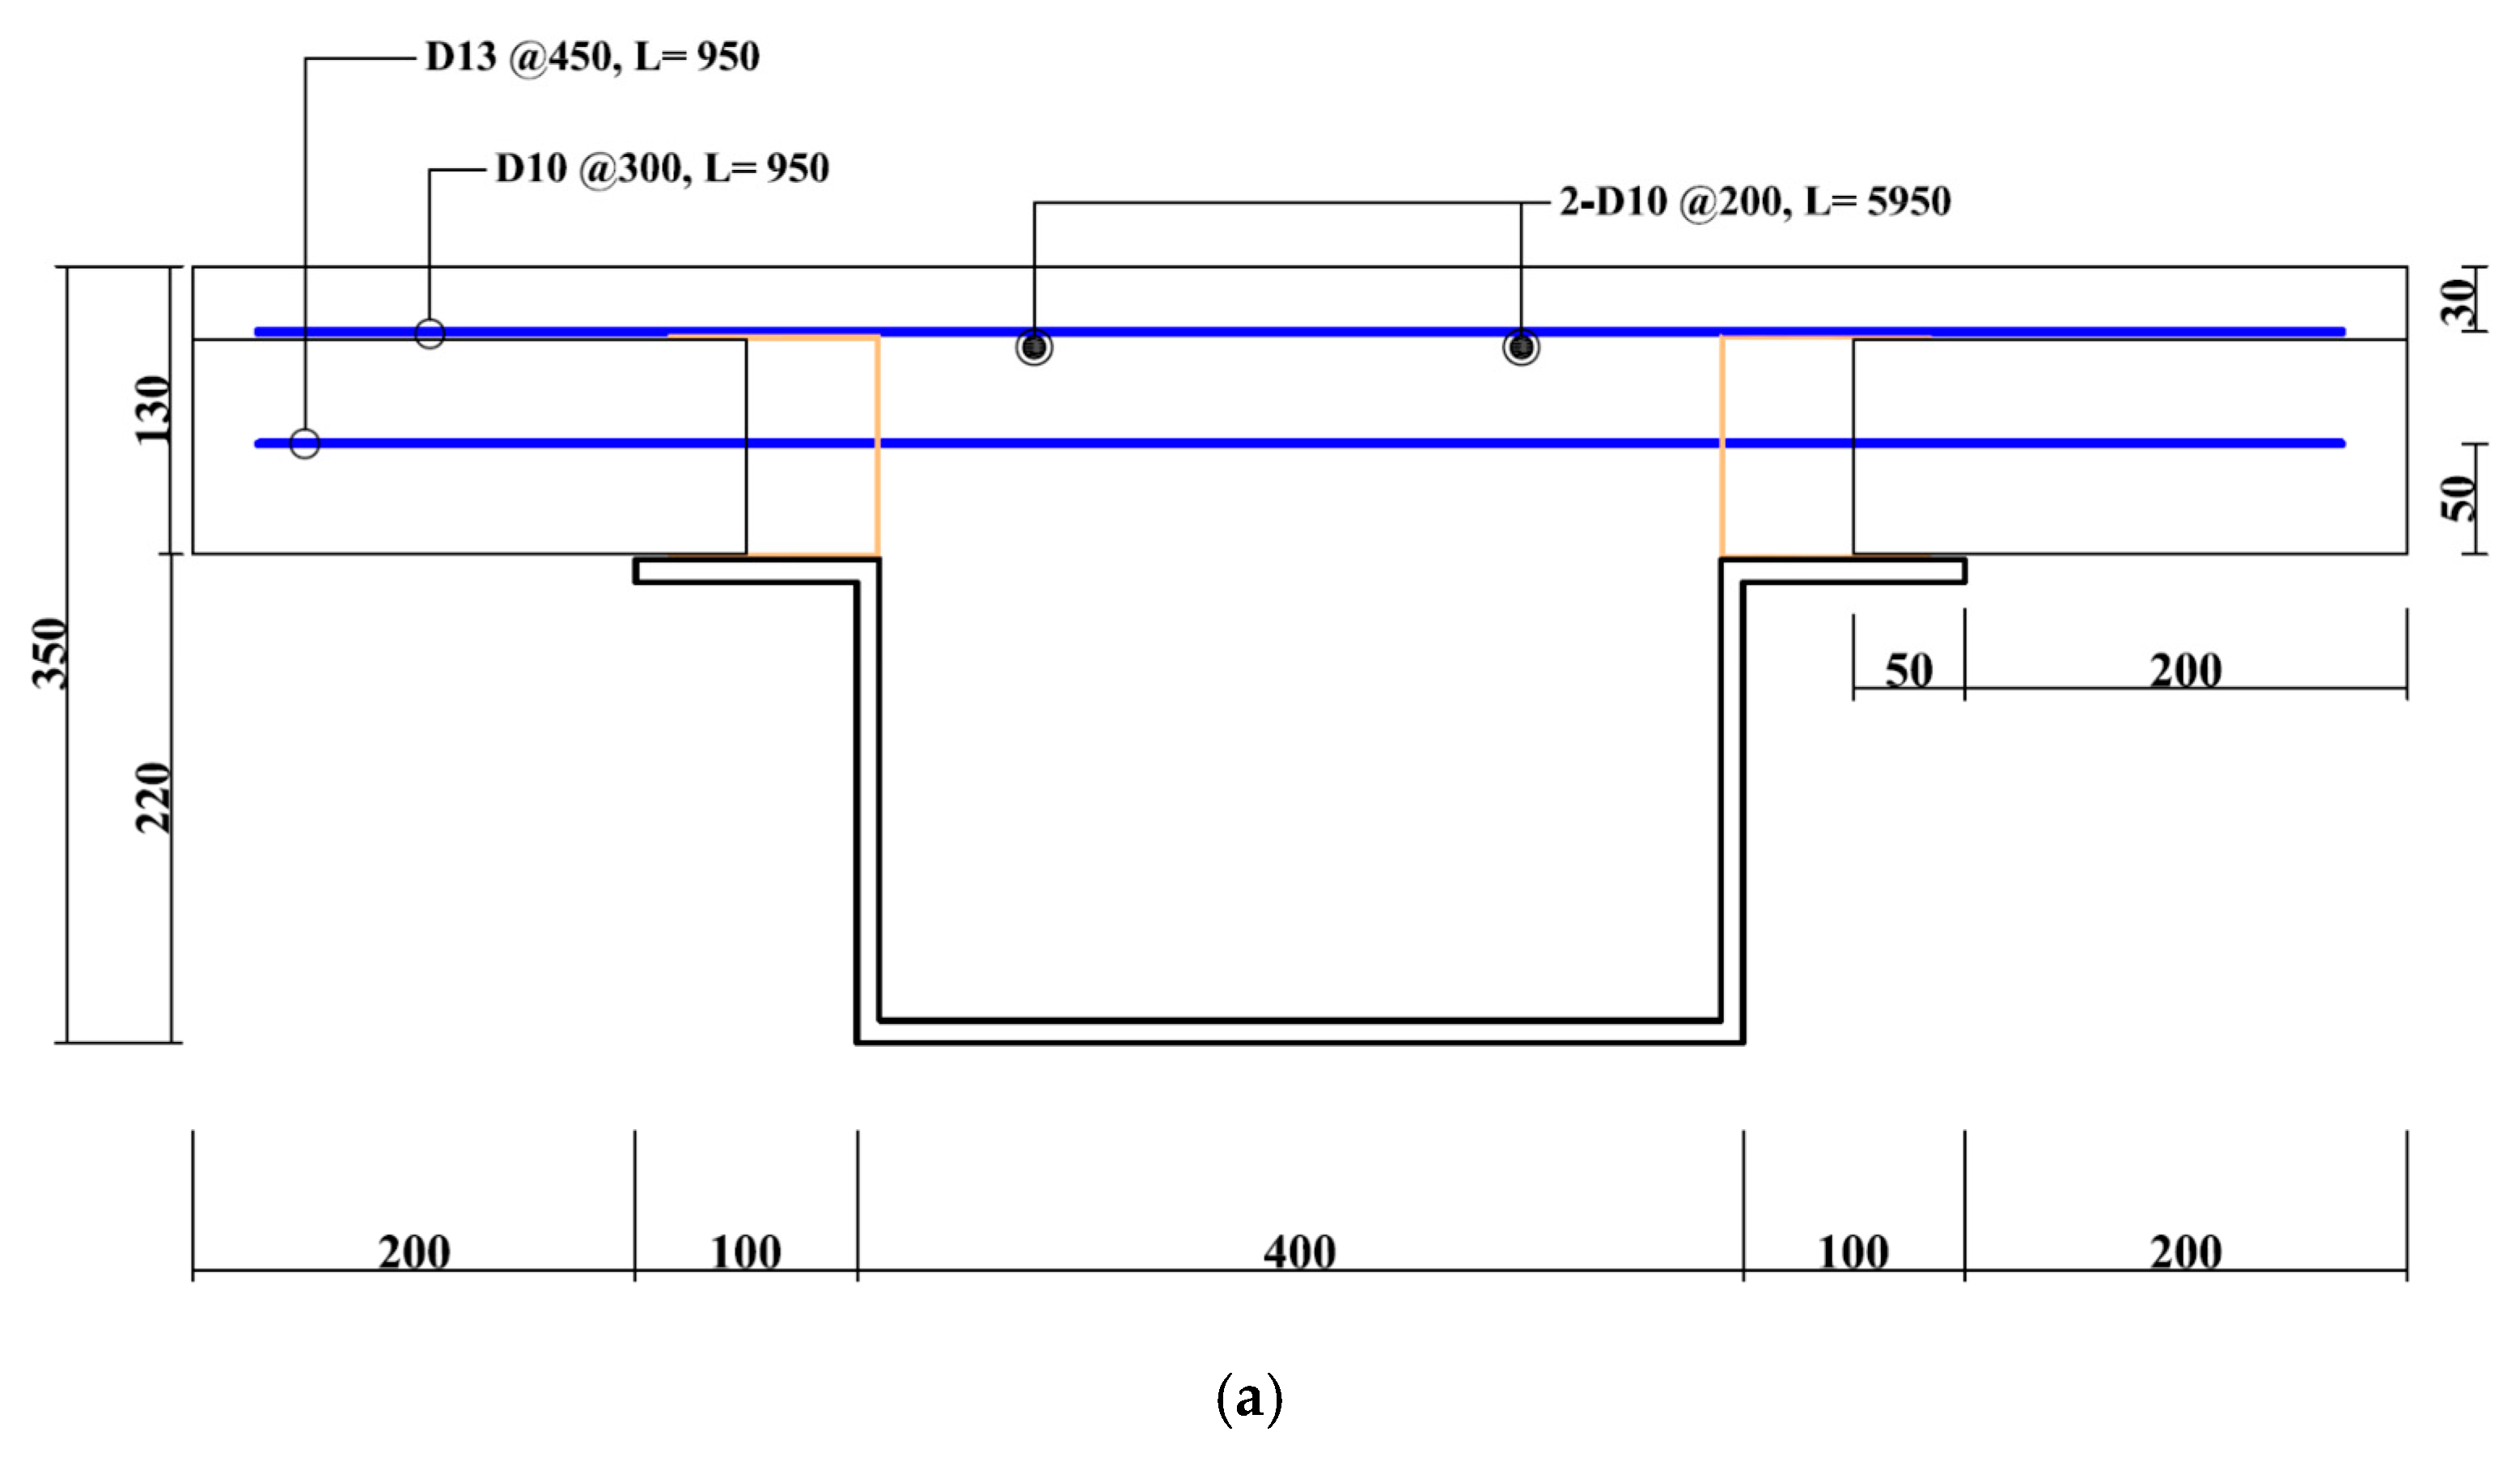
2. Novel Wide Composite Beams for Construction of Parking Structures
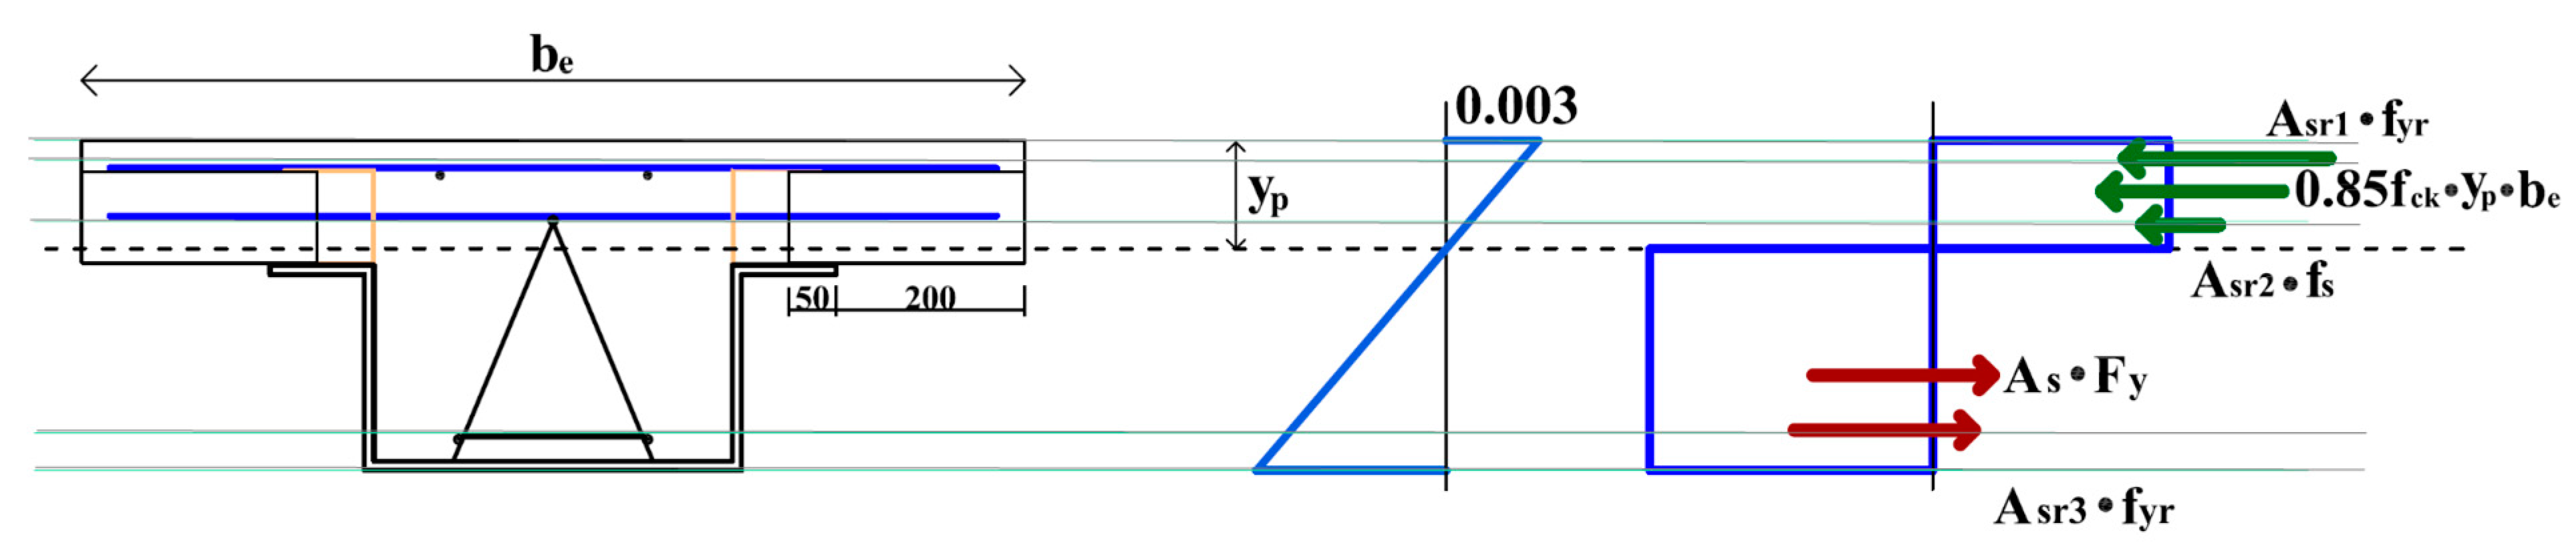
3. Theoretical Flexural Strength of the Novel Wide Composite Beam
4. Flexural Performance of the Wide Composite Beam
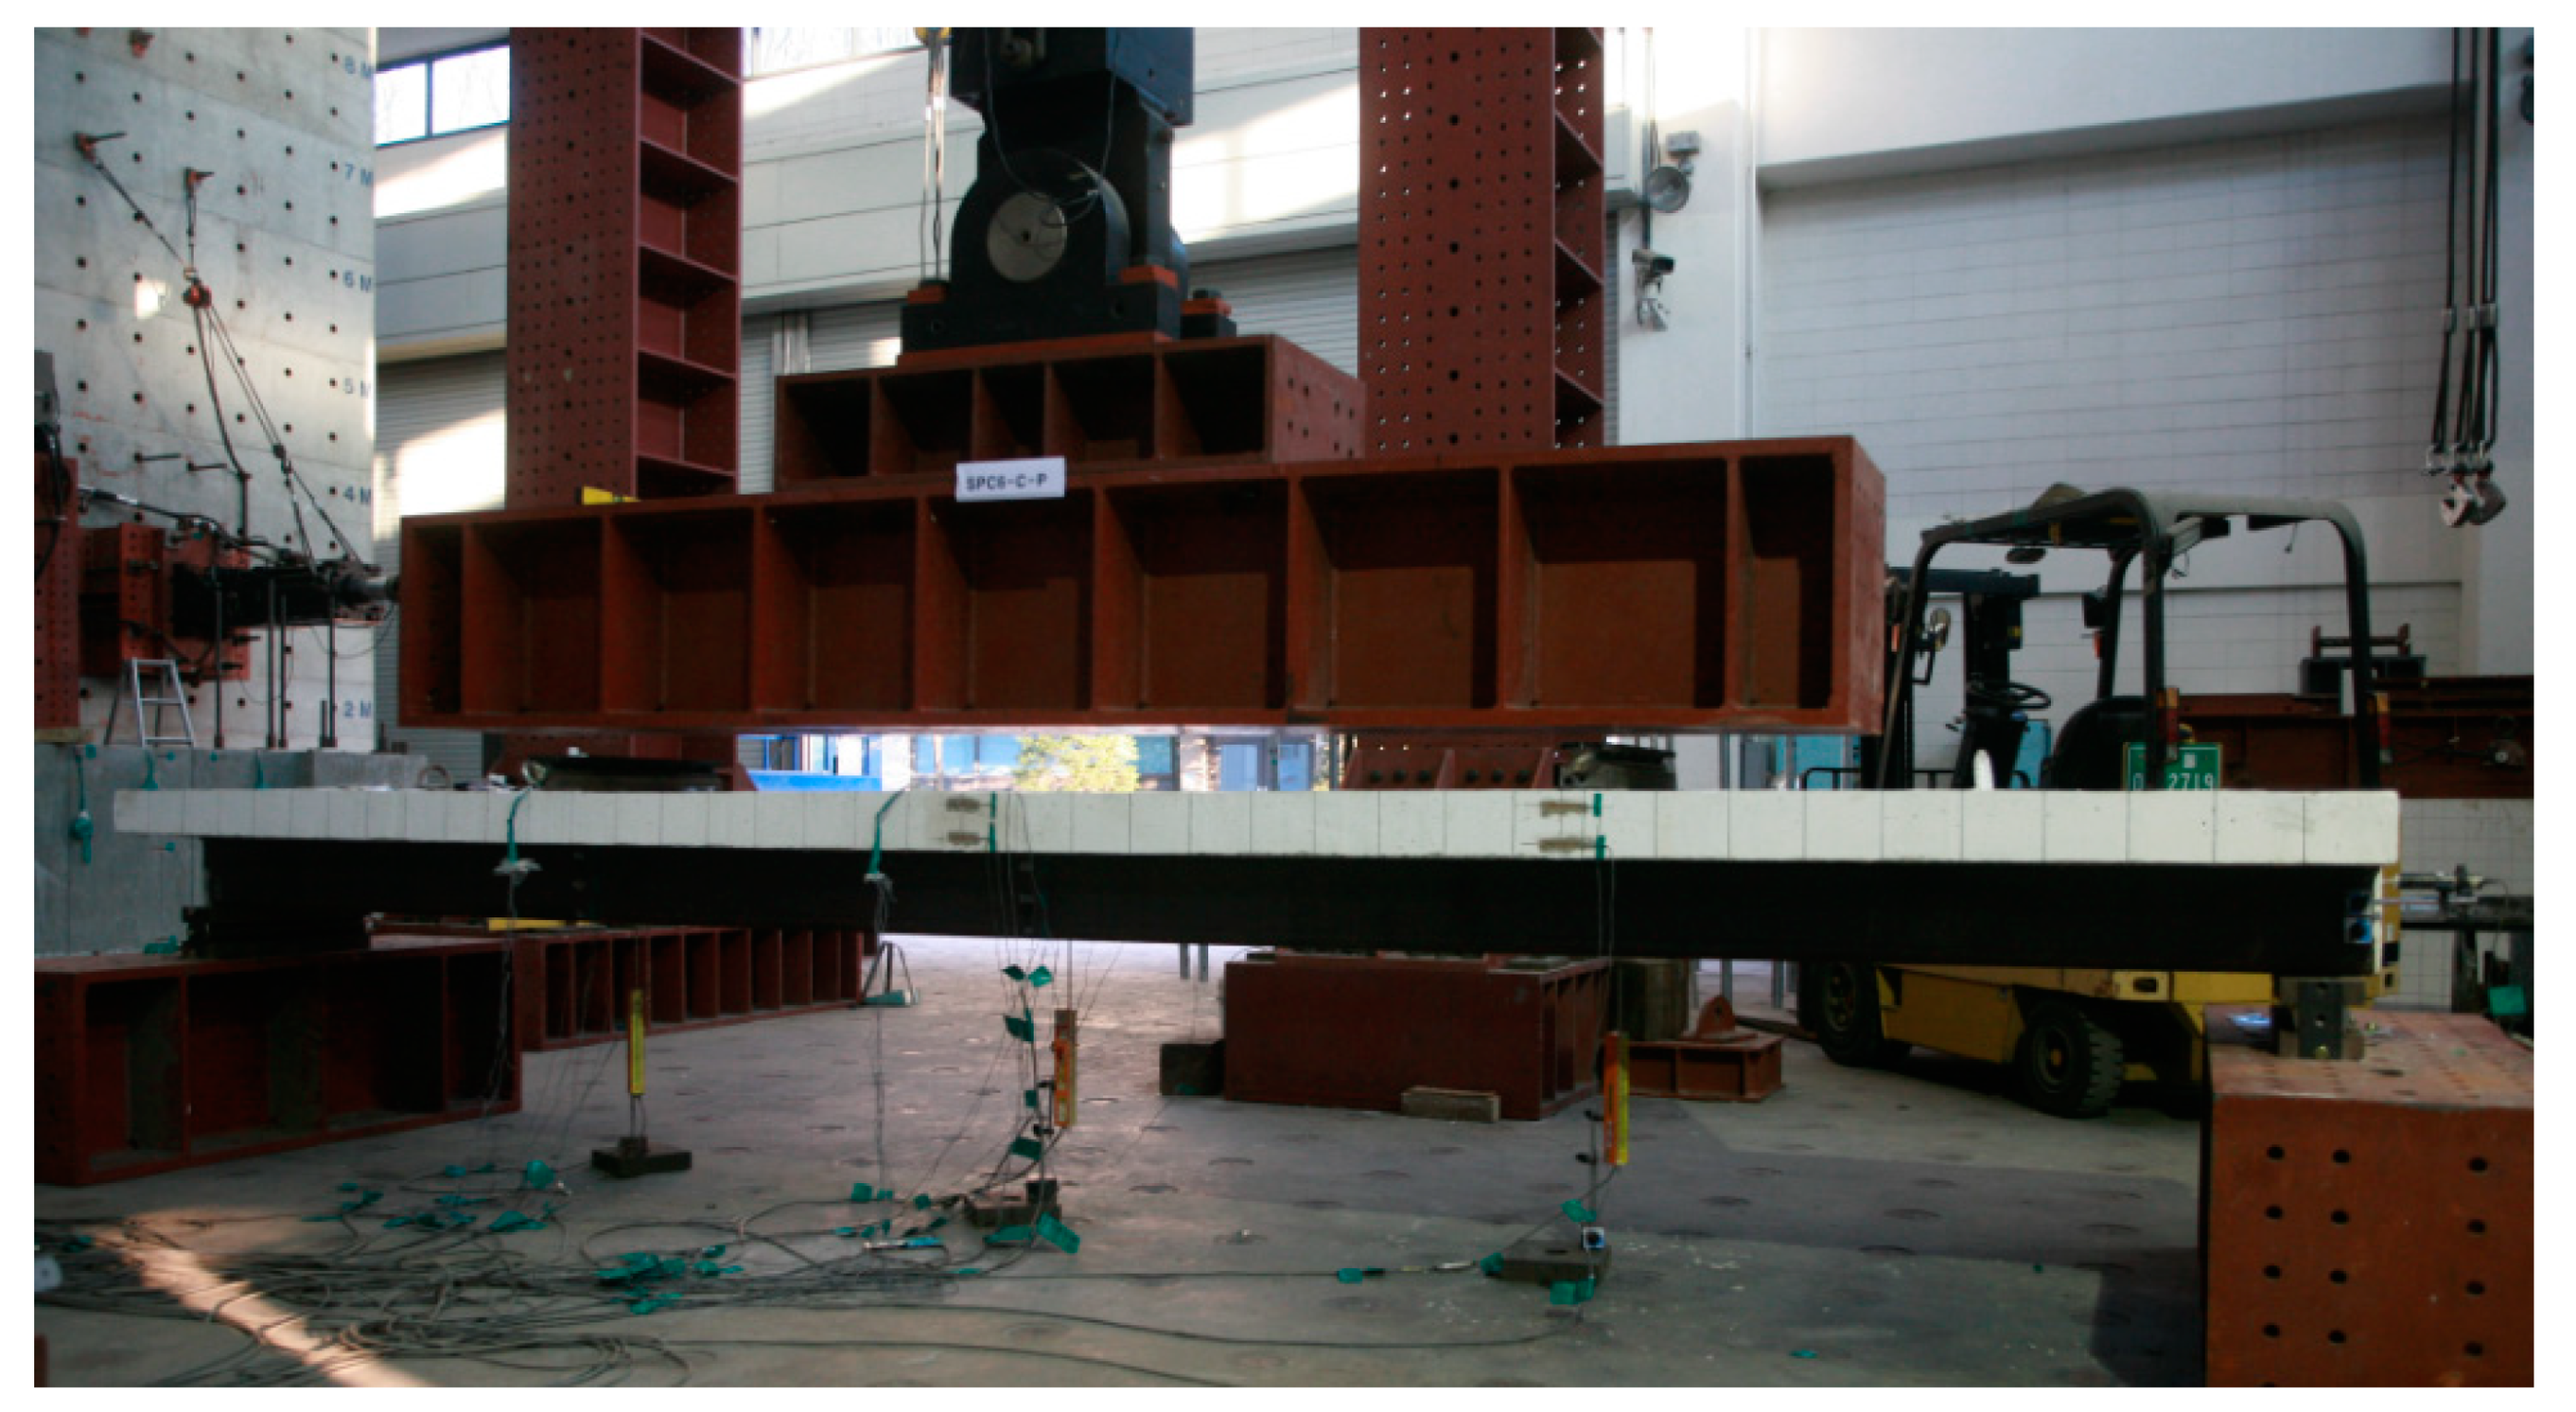
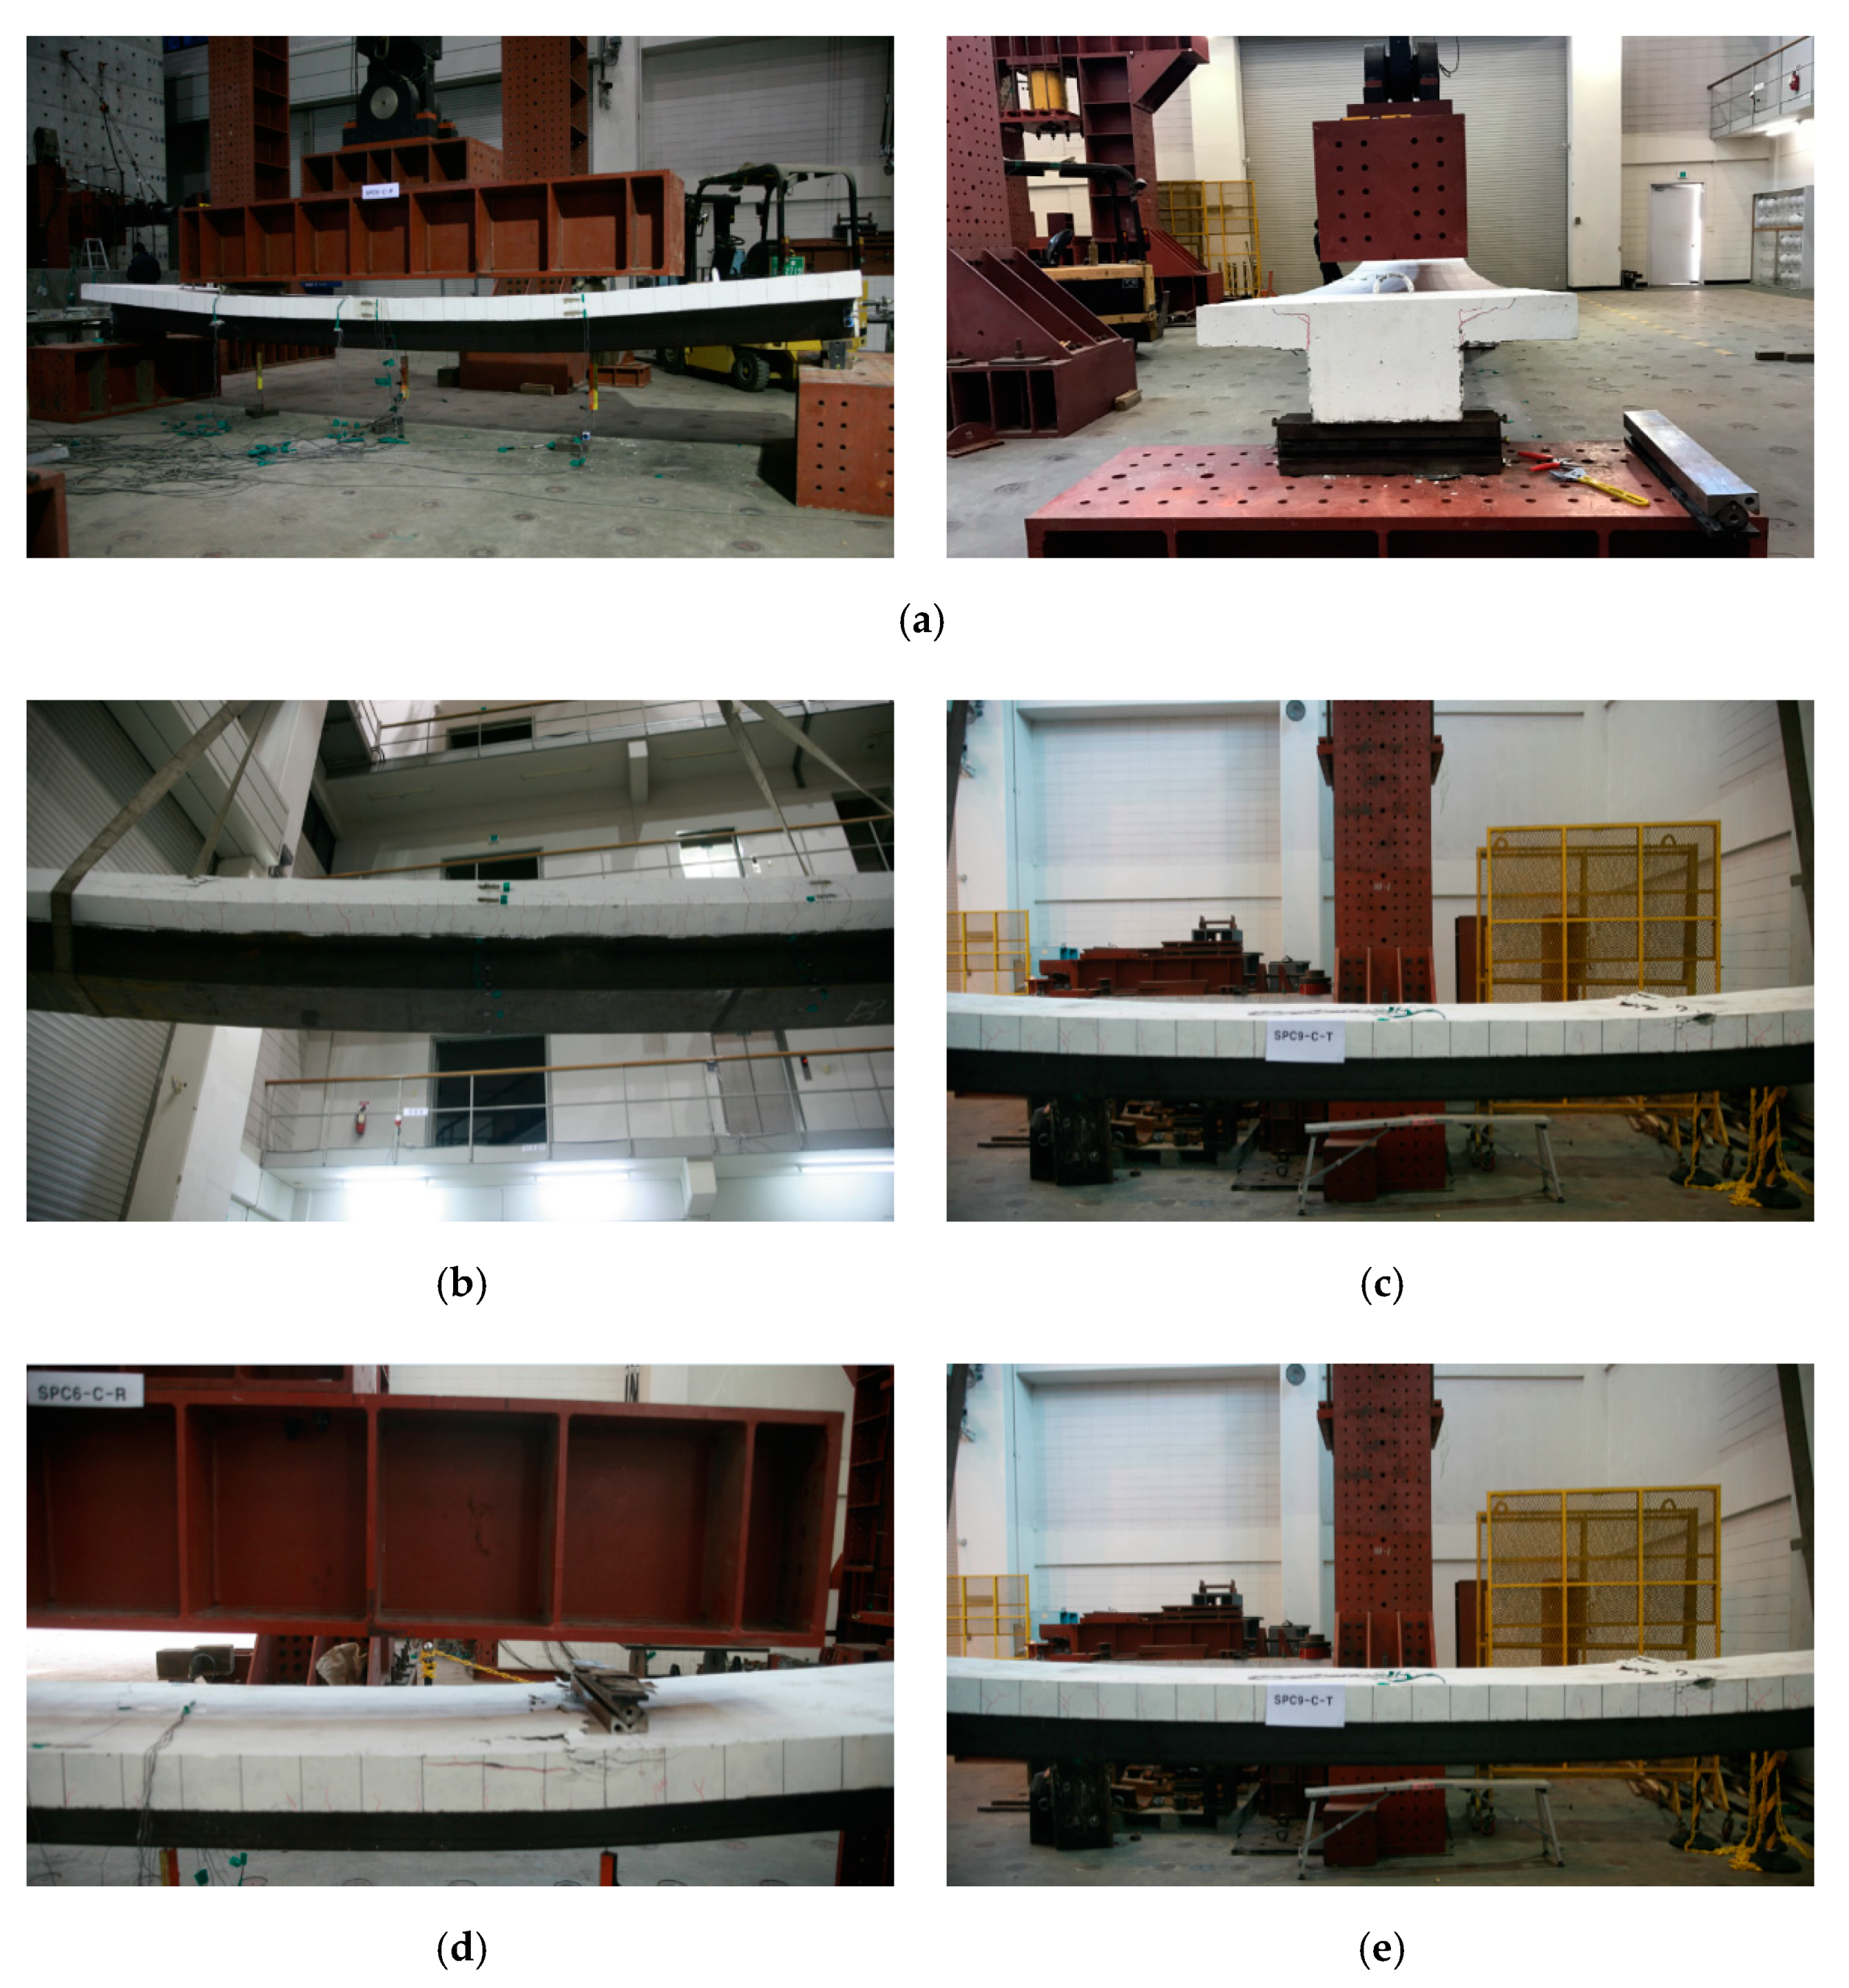
4.1. The Specimens and Test Setup
4.2. Test Results
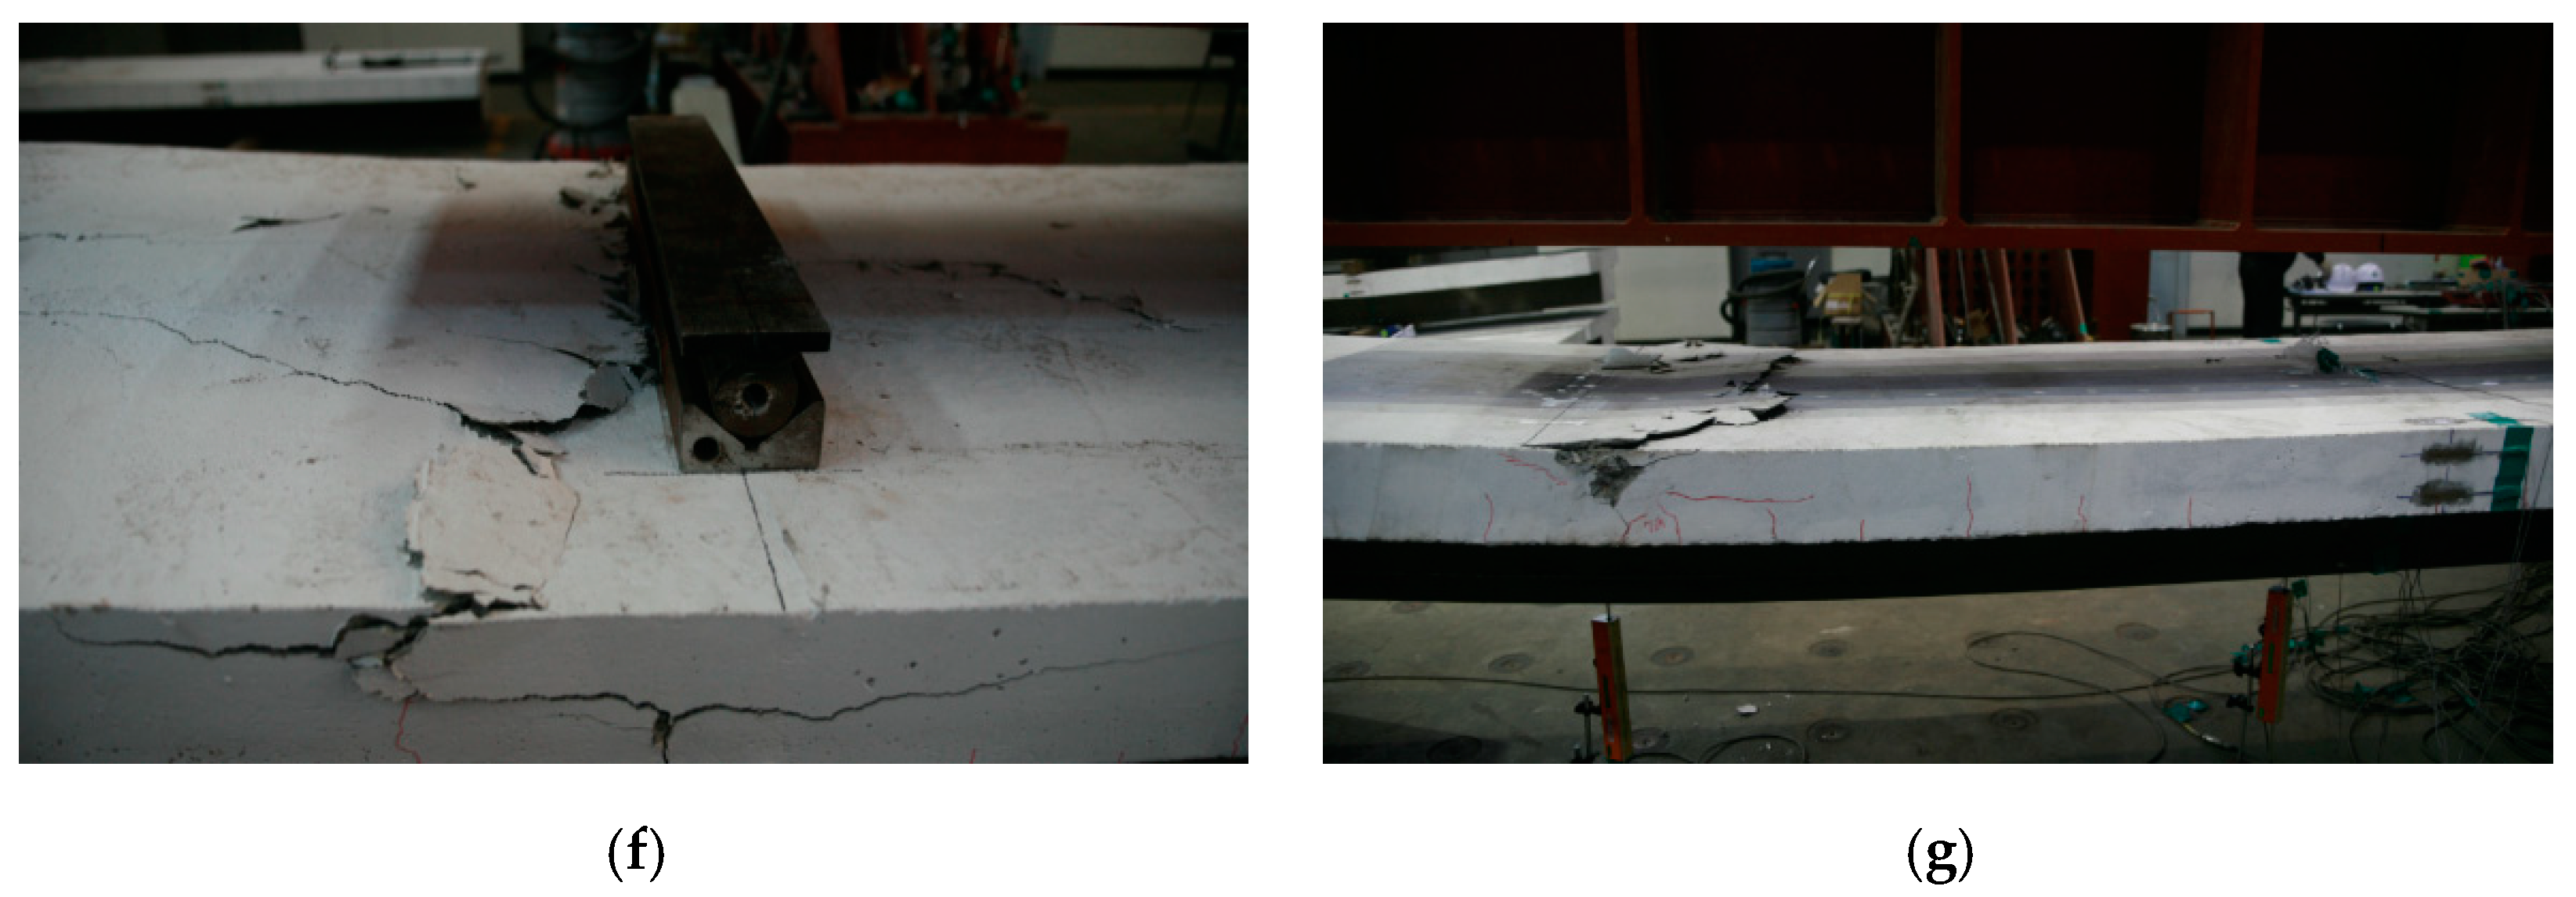
4.2.1. Failure Mode and Load-Displacement Relationship
4.2.2. Normal Bending Strain Distributions
4.2.3. Deflection Analysis
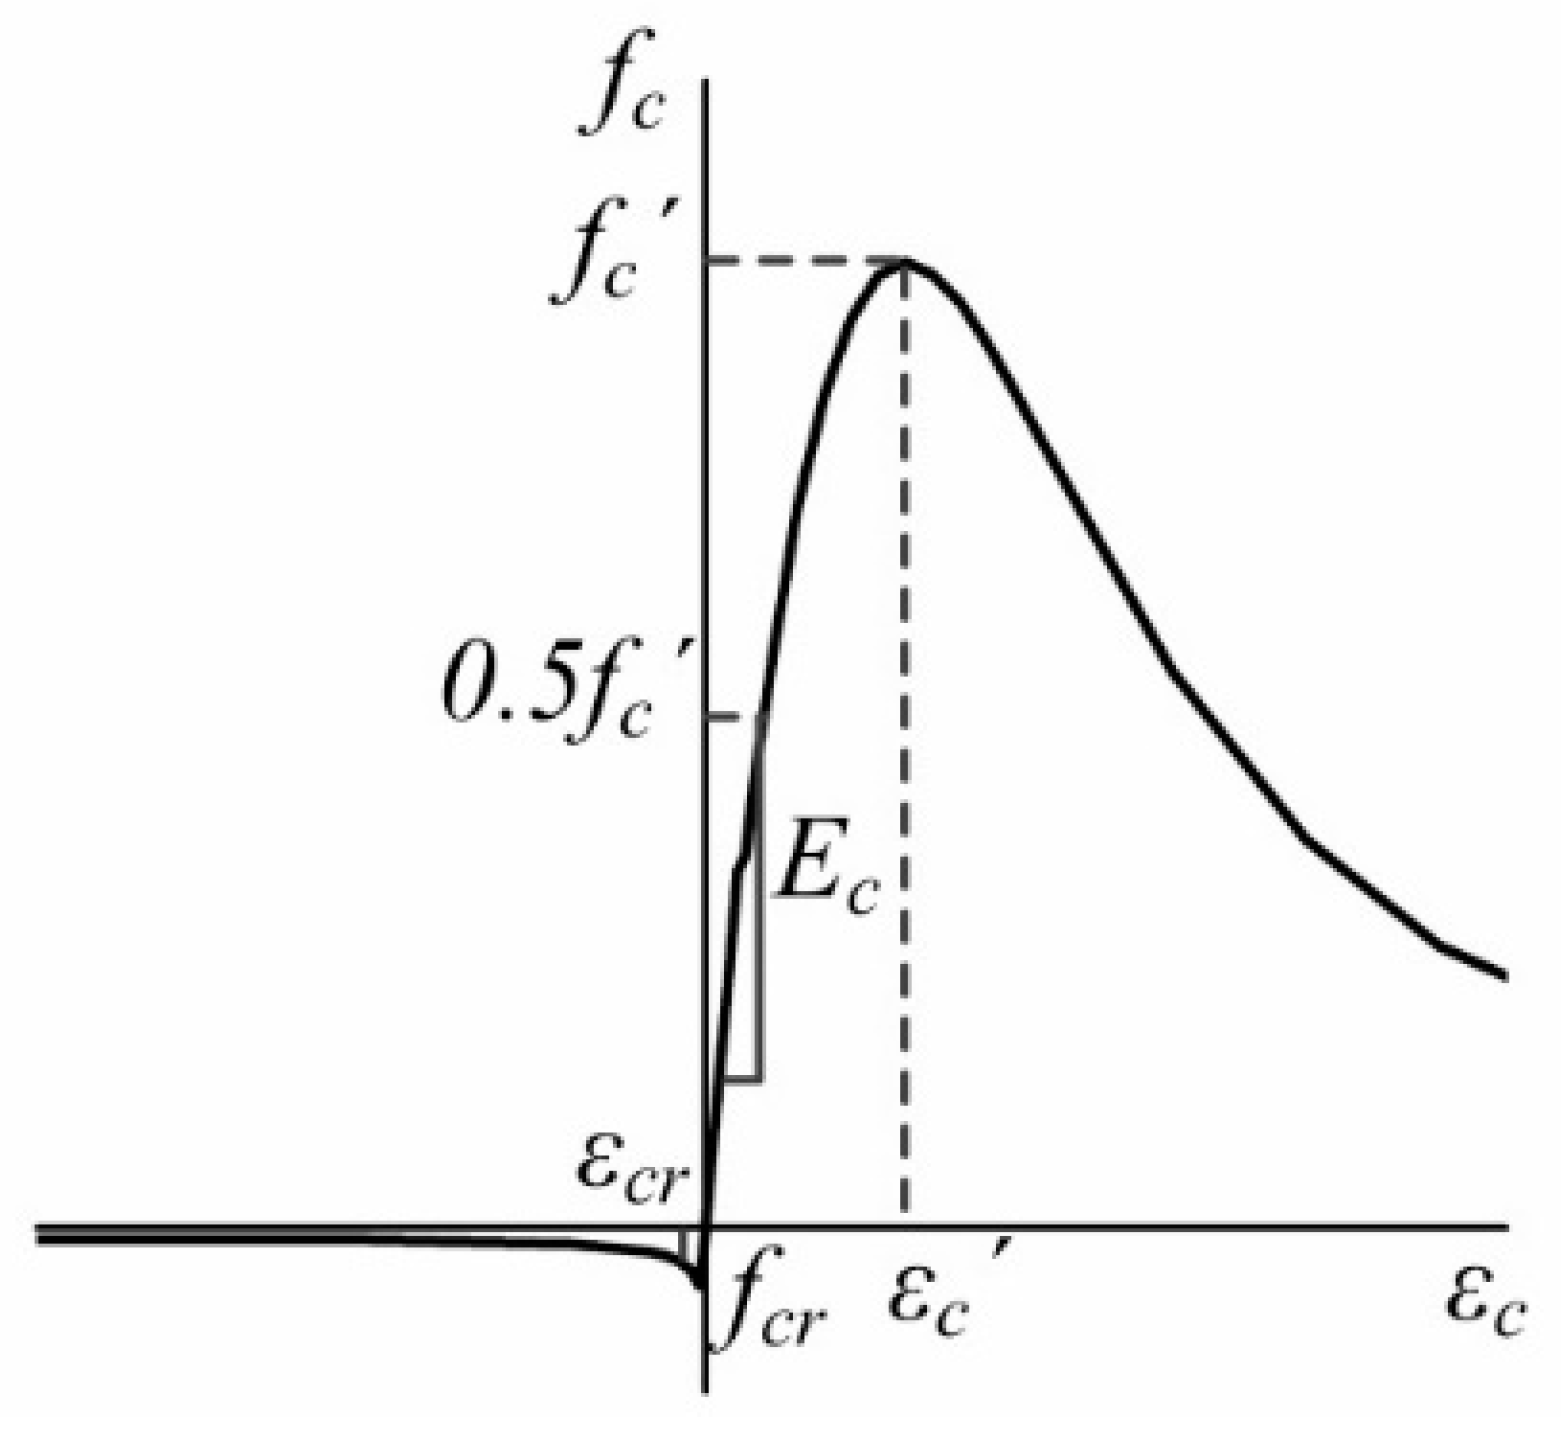
5. Finite Element Analysis of Wide Composite Beams
5.1. Model Description
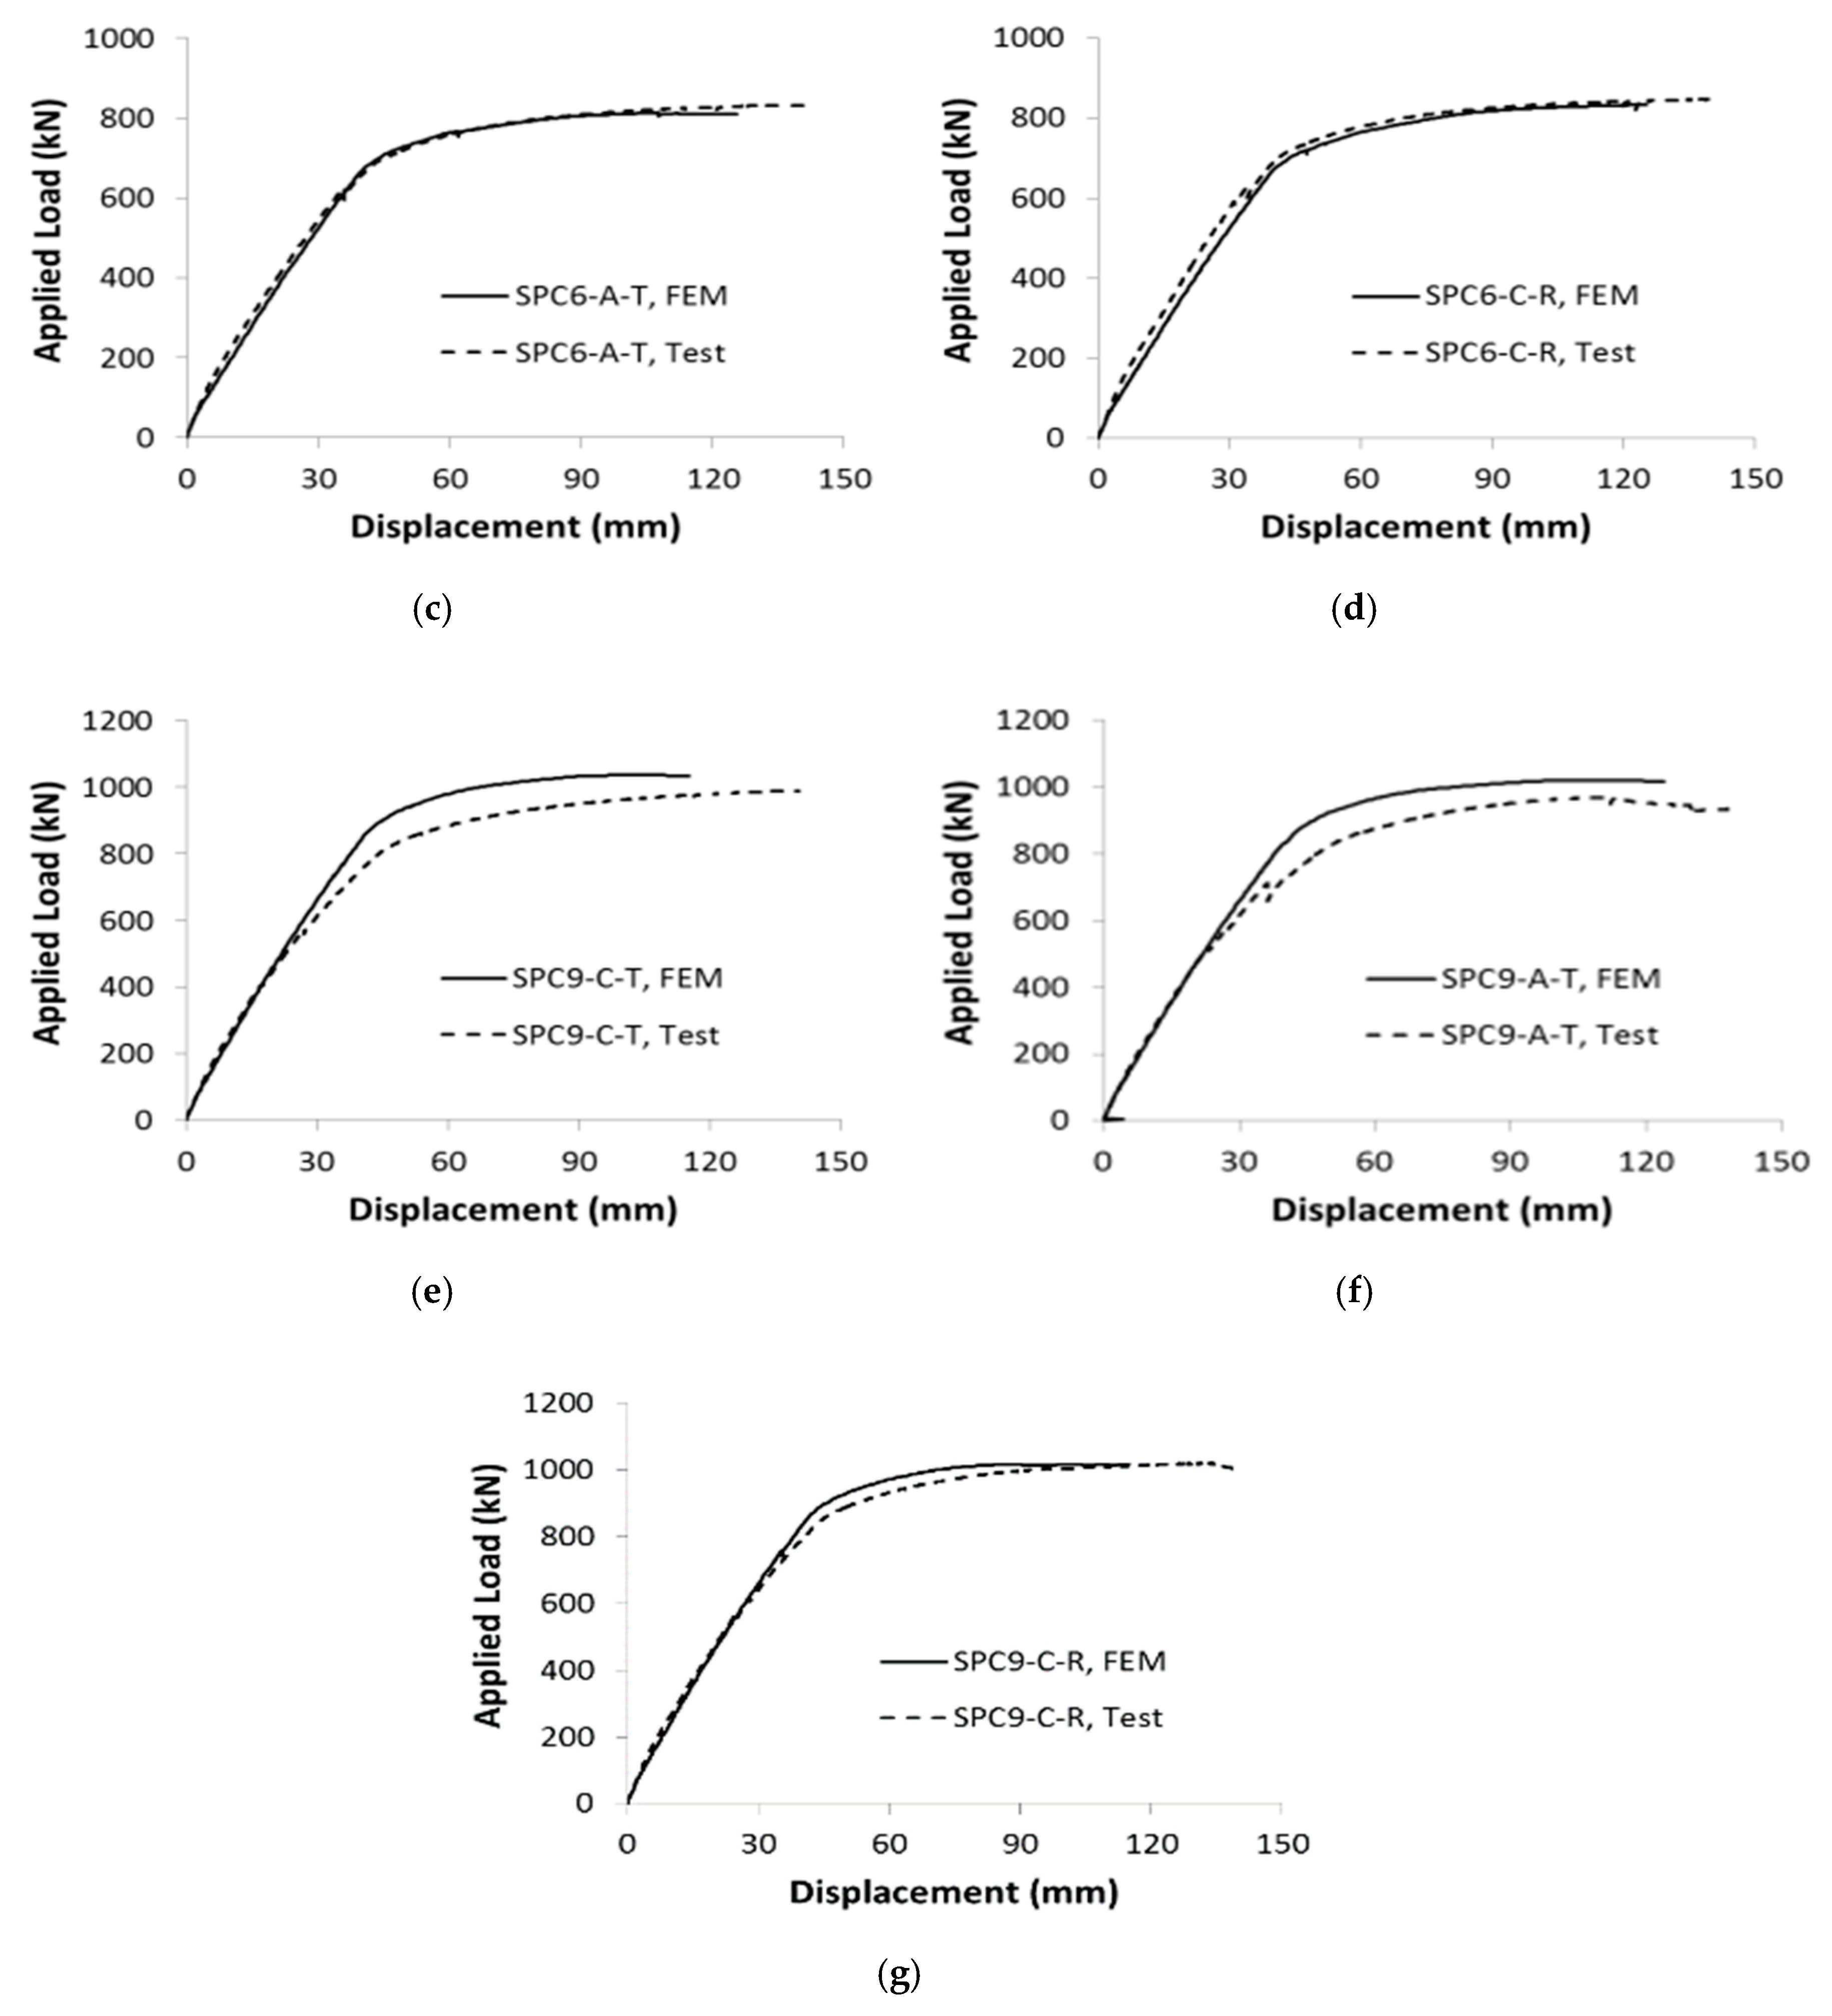
5.2. Results
6. Conclusions
- (1)
- Flexural strength rose by 20% when steel thickness increased from 6- to 9-mm;
- (2)
- The shape of the slab-supporting components (the angle (A) or channel (C)) had a negligible effect on the flexural strength; these components lay near the PNA;
- (3)
- The truss bar affected flexural strength because the bottom reinforcing bars enhanced beam tensioning. However, the truss bar shape minimally affected flexural strength, because the top bar lay near the PNA and experienced only a low compressive strain;
- (4)
- During early loading, the neutral axis initially moved upward but then fell as loading increased, because tensile stresses developed during compression;
- (5)
- The results of FEA were in good agreement with the test results. The section plastic moments did not trigger global or local instability.
- (6)
- The novel wide composite beam system proposed in this research can reduce construction costs and resources by reducing the floor height and realizing the long span. Also, it is possible to improve constructability and shorten the construction period since major components are manufactured in the factory and assembled in the field. It should be noted that the proposed system appears to be a suitable candidate for technology minimizing on-site construction work that can reduce greenhouse gas emissions.
Author Contributions
Funding
Acknowledgments
Conflicts of Interest
Data Availability
References
- Hoesch Building System (HBS). Hoesch Addictive Floor. Hoeschbausysteme Gmbh, 2019. Available online: www.hoesch-bau.com (accessed on 20 December 2019).
- Darko, D.; Boris, A.; Ivan, L. Composite Structures according to Eurocode 4 (Worked Examples); Ernst & Sohn, A Wiley Brand: Berlin, Germany, 2015; pp. 797–824. [Google Scholar]
- Pachpor, P.D.; Gupta, L.M.; Deshpande, N.V. Analysis and design of Cellular Beam and its verification. IERI Procedia 2014, 7, 120–127. [Google Scholar] [CrossRef]
- Tsavdaridis, K.D.; D’Mello, C.; Hawes, M. Experimental Study of Ultra Shallow Floor Beams with Perforated Steel Sections. In Proceedings of the Nordic Steel Construction Conference (NSCC), Malmø, Sweden, 2–4 September 2009; pp. 312–319. [Google Scholar]
- Delta Composite Beam (DCB). Delta Composite Beam (Technical Manual). Peikko Group Corporation, 2014. Available online: www.peikko.com (accessed on 20 December 2019).
- Nadasky, P. Steel-Concrete Composite Beams for Slim Floors–Specific Design Features in Scope of Steel Frames Design. Procedia Eng. 2012, 40, 274–279. [Google Scholar] [CrossRef] [Green Version]
- Gschwindner, L.F. Load and Resistance Factor Design of Steel Structures; Prentice-Hall: Upper New Jersey River, NJ, USA, 1994. [Google Scholar]
- Mohan, G.; Upadhyay, A.; Kaushik, S. Simplified design of composite slabs using slip block test. J. Adv. Concr. Technol. 2005, 3, 403–412. [Google Scholar]
- Namdeo, A.H.; Laxmikant, M.G.; Girish, N.R. Design of composite slabs with profiled steel decking: A comparison between experimental and analytical studies. Int. J. Adv. Struct. Eng. 2012, 3, 1–15. [Google Scholar]
- European Committee for Standardization (ECS). Design of Concrete Structures—Part 1-1: General Rules and Rules for Buildings; Eurocode 2: Brussels, Belgium, 2004. [Google Scholar]
- ACI 318. Building Code Requirement for Structural Concrete and Commentary; American Concrete Institute: Farmington Hills, MI, USA, 2014. [Google Scholar]
- AIJ. Design Code of Reinforced Concrete Buildings; Architectural Institute of Japan: Tokyo, Japan, 2018; p. 340. [Google Scholar]
- BS 5950. Part 4: Structural use of steelwork in building. In Code of Practice for Design of Composite Slabs with profiled Steel Sheeting; British Standards Institution: London, UK, 1994. [Google Scholar]
- Chen, S. Load-carrying capacity of composite slabs with various end constraints. J. Constr. Steel Res. 2003, 59, 385–403. [Google Scholar] [CrossRef]
- Calixto, J.; Lavall, A. Behavior and strength of composite slabs with ribbed decking. J. Constr. Steel Res. 1998, 46, 211–212. [Google Scholar] [CrossRef]
- AISC 303-10. AISC Code of Standard Practice for Steel Buildings and Bridges; American Institute of Steel Construction: Chicago, IL, USA, 2010. [Google Scholar]
- Korea Building Code (KBC). Korea Building Code and Commentary; Architectural Institute of Korea: Seoul, Korea, 2016. [Google Scholar]
- ABAQUS. ABAQUS Analysis User’s Manual Version 6.9-2; Dassault Systems Simulia ORP; ABAQUS: Providence, RI, USA, 2010. [Google Scholar]
- Saenz, L.P. Discussion of ‘Equation for the stress-strain curve of concrete’ by P. Desayi, and S. Krishnan. ACI Struct. J. 1964, 61, 1229–1235. [Google Scholar]
- Hsu, T.T.C.; Mo, Y.-L. Unified Theory of Concrete Structures, 2nd ed.; John Wiley & Sons, Inc.: Hoboken, NJ, USA, 2010. [Google Scholar]
- Lee, J.; Fenves, G.L. Plastic-damage model for cyclic loading of concrete structures. J. Eng. Mech. ASCE 1998, 124, 892–900. [Google Scholar] [CrossRef]


| No. | Specimen | Specimen Parameters | Material Properties | ||||||||
|---|---|---|---|---|---|---|---|---|---|---|---|
| Steel Thickness of U Shape [mm] | Slab Support Shape | Truss Type | Concrete Compressive Strength [MPa] | Reinforcing Bar Yield Strength [MPa] | Steel Yield Strength [MPa] | ||||||
| D10 | D13 | D16 | 4.5T | 6T | 9T | ||||||
| 1 | SPC6-C-P | 6.0 |  | Non | 25.1 | 469 | 445 | 424 | 440 | 422 | 402 |
| 2 | SPC6-C-T | |  | ||||||||
| 3 | SPC6-A-T |  | | ||||||||
| 4 | SPC6-C-R | |  | ||||||||
| 5 | SPC9-C-T | 9.0 | | | |||||||
| 6 | SPC9-A-T | | | 24.6 | |||||||
| 7 | SPC9-C-R | | | ||||||||
| Specimen | Theoretical Strength (kN) | Strength (kN) | Displacement (mm) | Ductility Ratio | ||||
|---|---|---|---|---|---|---|---|---|
| 1 | SPC6-C-P | 675.71 | 538.82 | 741.42 | 37.46 | 146.96 | 0.73 | 0.25 |
| 2 | SPC6-C-T | 769.03 | 692.87 | 826.80 | 43.62 | 126.18 | 0.84 | 0.35 |
| 3 | SPC6-A-T | 769.03 | 666.20 | 832.18 | 40.68 | 134.58 | 0.80 | 0.30 |
| 4 | SPC6-C-R | 770.72 | 695.42 | 848.09 | 40.42 | 142.92 | 0.82 | 0.28 |
| 5 | SPC9-C-T | 932.22 | 831.84 | 989.56 | 48.16 | 145.56 | 0.84 | 0.33 |
| 6 | SPC9-A-T | 836.38 | 842.17 | 970.06 | 52.30 | 108.78 | 0.87 | 0.48 |
| 7 | SPC9-C-R | 937.85 | 873.86 | 1019.72 | 47.74 | 132.64 | 0.86 | 0.36 |
| Specimen | Strength Increase Ratio | Main Parameter | ||
|---|---|---|---|---|
| Yield Strength | Maximum Strength | |||
| 2 | SPC6-C-T | 1.20 | 1.20 | Thickness of the U-shaped steel region (6.0 mm) |
| 5 | SPC9-C-T | |||
| 3 | SPC6-A-T | 1.26 | 1.17 | |
| 6 | SPC9-A-T | Thickness of the U-shaped steel region (9.0 mm) | ||
| 4 | SPC6-C-R | 1.26 | 1.2 | |
| 7 | SPC9-C-R | |||
| 2 | SPC6-C-T | 0.96 | 1.01 | Shape of slab support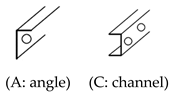 |
| 3 | SPC6-A-T | |||
| 5 | SPC9-C-T | 1.01 | 0.98 | |
| 6 | SPC9-A-T | |||
| 1 | SPC6-C-P | 0.78 | 0.90 | Truss type |
| 2 | SPC6-C-T | 1 | 1 | |
| 4 | SPC6-C-R | 1.00 | 1.03 | |
| 5 | SPC9-C-T | 1 | 1 | |
| 7 | SPC9-C-R | 1.05 | 1.03 | |
| 100 (kN) | 200 (kN) | 300 (kN) | 400 (kN) | 500 (kN) | 600 (kN) | 700 (kN) | 800 (kN) | 900 (kN) | Max (kN) | |
|---|---|---|---|---|---|---|---|---|---|---|
| SPC6-C-P | 210 | 230 | 232 | 230 | 230 | 214 | 212 | - | - | 267 |
| SPC6-C-T | 204 | 218 | 224 | 225 | 225 | 224 | 222 | 225 | - | 234 |
| SPC6-A-T | 197 | 212 | 220 | 221 | 221 | 220 | 222 | 242 | - | 253 |
| SPC6-C-R | 198 | 215 | 224 | 225 | 225 | 225 | 225 | 231 | - | 246 |
| SPC9-C-T | 202 | 212 | 220 | 221 | 221 | 220 | 218 | 208 | 203 | 214 |
| SPC9-A-T | 195 | 201 | 207 | 210 | 213 | 212 | 209 | 193 | 191 | 199 |
| SPC9-C-R | 199 | 208 | 219 | 220 | 220 | 221 | 220 | 218 | 217 | 219 |
| Dead Load | Live Load | Load Conversion | Theoretical Values | Theoretical Values (Stiffness 75%) | Test Values | |
|---|---|---|---|---|---|---|
| SPC6-C-P | 6.60 | 4.0 | 61.48 | 2.05 | 2.73 | 2.32 |
| SPC6-C-T | 6.62 | 61.60 | 1.93 | 2.57 | 2.12 | |
| SPC6-A-T | 6.62 | 61.60 | 1.93 | 2.57 | 2.12 | |
| SPC6-C-R | 6.63 | 61.54 | 1.92 | 2.57 | 2.23 | |
| SPC9-C-T | 6.80 | 62.64 | 1.76 | 2.35 | 1.99 | |
| SPC9-A-T | 6.80 | 62.64 | 1.82 | 2.43 | 2.01 | |
| SPC9-C-R | 6.80 | 62.64 | 1.76 | 2.35 | 1.93 |
© 2019 by the authors. Licensee MDPI, Basel, Switzerland. This article is an open access article distributed under the terms and conditions of the Creative Commons Attribution (CC BY) license (http://creativecommons.org/licenses/by/4.0/).
Share and Cite
Choi, Y.-C.; Choi, D.-S.; Park, K.-S.; Lee, K.-S. Flexural Performance Evaluation of Novel Wide Long-Span Composite Beams Used to Construct Lower Parking Structures. Sustainability 2020, 12, 98. https://doi.org/10.3390/su12010098
Choi Y-C, Choi D-S, Park K-S, Lee K-S. Flexural Performance Evaluation of Novel Wide Long-Span Composite Beams Used to Construct Lower Parking Structures. Sustainability. 2020; 12(1):98. https://doi.org/10.3390/su12010098
Chicago/Turabian StyleChoi, Yun-Chul, Doo-Sung Choi, Keum-Sung Park, and Kang-Seok Lee. 2020. "Flexural Performance Evaluation of Novel Wide Long-Span Composite Beams Used to Construct Lower Parking Structures" Sustainability 12, no. 1: 98. https://doi.org/10.3390/su12010098