1. Introduction
In modern investing, algorithmic trading is getting more and more attention from individual and institutional traders. “Algorithmic trading is a method of executing orders using automated pre-programmed trading instructions accounting for variables such as time, price, and volume” (
https://en.wikipedia.org/wiki/Algorithmic_trading). It considers market observable variables such as time, price, and volume, and sends instructions to the market based on a preset algorithm. Algorithmic trading, on the one hand, can prevent traders from frequently repeating observations and manually sending trading instructions; on the other hand, it can also prevent traders’ decisions from being disturbed by subjective emotions. According to a May 2019 report from Research and Markets, “The researchers forecast the global algorithmic trading market size to grow from USD 11.1 billion in 2019 to USD 18.8 billion by 2024, at a CAGR of 11.1% during 2019–2024. The major growth drivers of the algorithmic trading market include the increasing demand for fast and effective order execution, and reducing transaction costs” (
https://www.researchandmarkets.com/reports/4770543/).
With the development of new technologies such as machine learning, the current algorithmic trading not only includes automatic sending of transaction instructions, but also includes the automatic decision-making of the algorithm in terms of transaction time, transaction objects, and number of transactions. Quantitative stock selection, as an important part of in algorithmic trading, focuses on using various algorithms to select stock combinations in order to achieve a benchmark return rate.
Quantitative stock selection is a popular academic research area. Fama and French (1993) [
1], Lakonishok (1994) [
2], and Song (1994) [
3] established a linear model of stock excess returns, and proposed that the excess returns can be well explained by current stock prices, book value of equity, and earnings per share. Compared with the classic linear multi-factor models, the machine learning model pays more attention to the prediction ability of the model. It can capture more detailed market signals and obtain more stable excess returns by constructing a nonlinear relationship between the prediction target and the factors. Jigar Patel et al. (2015) [
4] studied and compared the performance of the four prediction models artificial neural network (ANN), support vector machine (SVM), random forest (RF), and Naive-Bayes. Their results show that the overall performance of the random forest model is better than the other three prediction models. Liu et al. (2017) [
5] proposed a convolutional neural network and long-short-term memory (CNN-LSTM) model to analyze the quantitative strategy of the stock selection. In their study, the CNN-LSTM neural network model could be successfully applied to the formulation of quantitative strategies and achieve better returns than basic momentum strategies and benchmark indexes. Li and Zhang (2018) [
6] used the XGBoost model to establish a dynamic weighted multi-factor stock selection strategy. They used the XGBoost machine learning method to predict the information coefficients (ICs) of various factors. The empirical results showed that the XGBoost model is effective in predicting the ICs, and the dynamic weights based on the XGBoost model can improve the performance of multi-factor stock selection strategies. Yang and Chen (2019) [
7] combined stock forecasting and stock selection to form a new hybrid stock selection method. Based on the research sample of the A-share stock market in China, they showed that the novel hybrid method is superior to the traditional methods in market returns. Chen and Ge (2019) [
8] studied the stock price movement prediction based on LSTM networks, and compared the attention LSTM (AttLSTM) model with the LSTM model. Their results verify the effectiveness of the attention mechanism in the LSTM-based prediction method.
Although a lot of works on quantitative models and processes have been done, there are still some areas that can be improved. First of all, in the setting of prediction targets, previous studies often used the stock return or whether the price is up or down as the prediction target, but the return rate often contains some noise, and the setting of the two classifications (up or down) does not catch much of the existing information. Secondly, in factor selection, previous studies often selected factors statically, but factors are usually valid for a certain period of time, and may not be valid after that. Therefore, the entire strategy design needs to select factors dynamically, e.g., eliminating failed ones, and introducing effective ones.
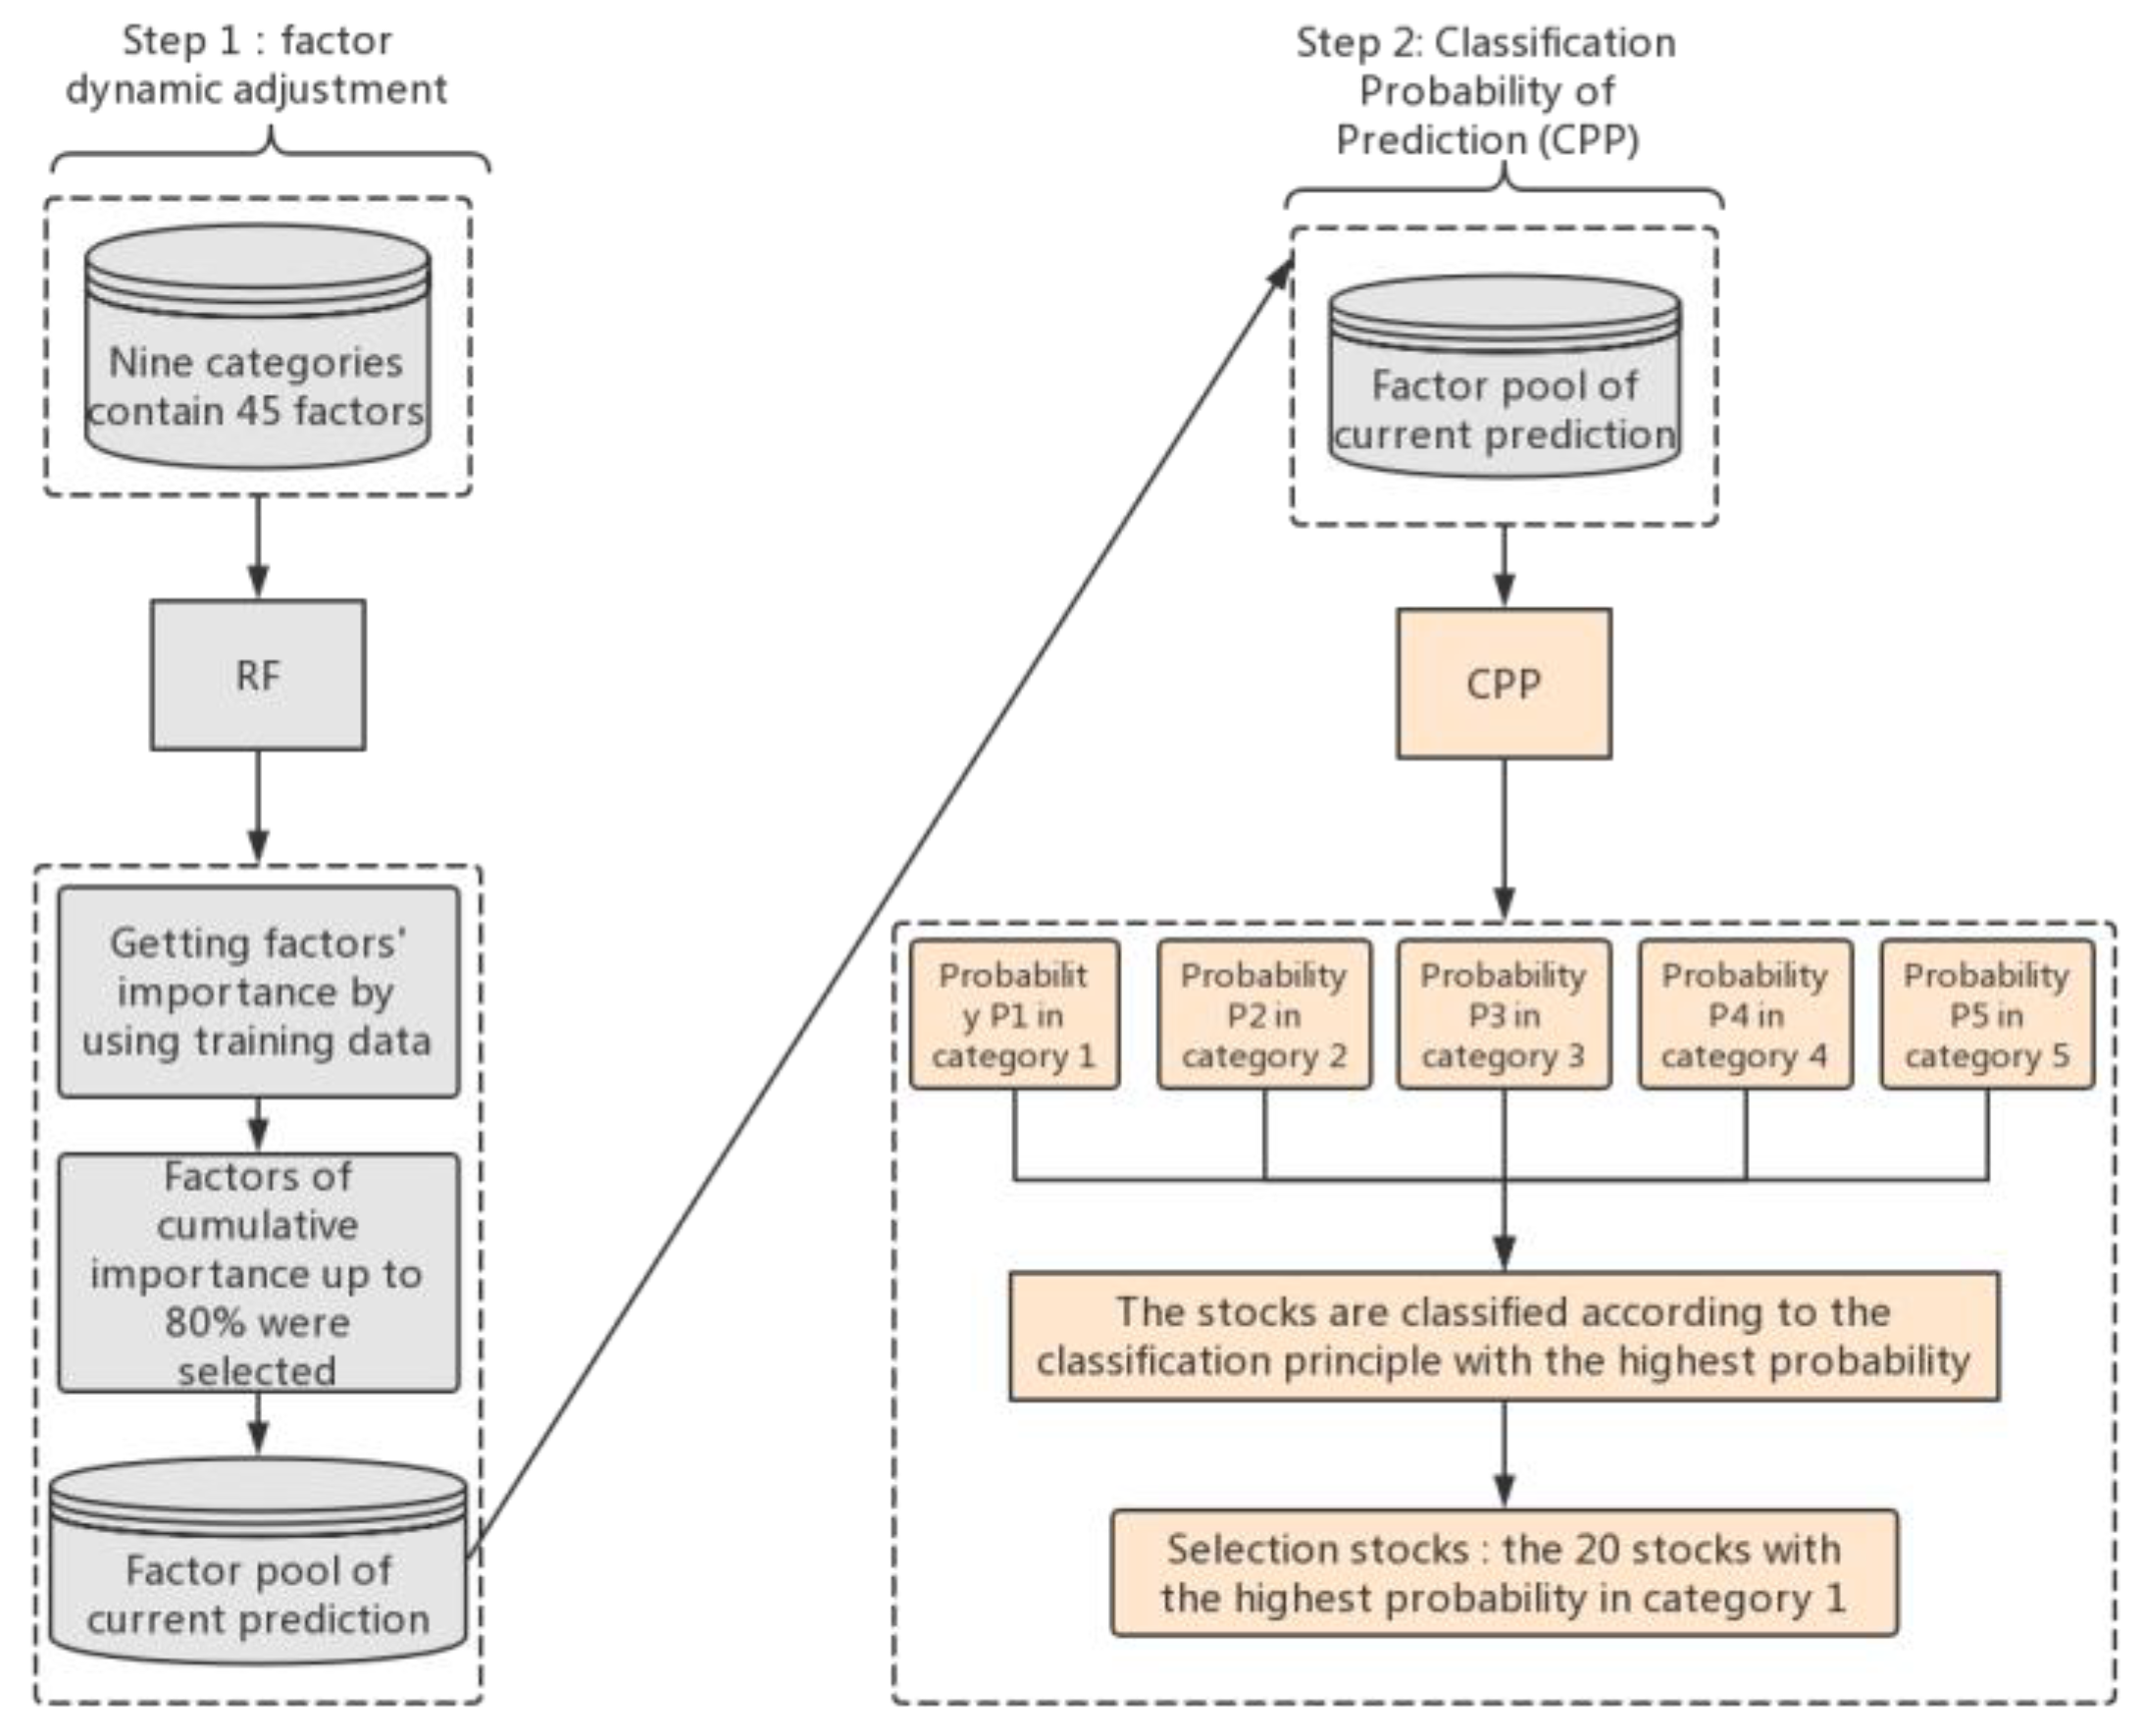
In this paper, we propose a sustainable quantitative stock selection strategy using RF to dynamically adjust the factors to predict the importance of the training set for each period. The factors are sorted in descending order. The cumulative importance of the selected factors must reach 80% to ensure that the factors selected in each period are the most important factors. Then, we use the XGBoost or RF model to classify each stock into five fixed yield ranges. For each yield range, we sort the stocks in descending order of probability, and take the top 20 most likely stocks into the stock pool for purchase. We call this a classification probability of prediction (CPP) strategy. The back-testing results from November 2013 to December 2019 show that the stock selection strategy of the XGBoost or RF CPP method can significantly outperform the Chinese Stock Index 300 (CSI 300) index. Moreover, we find that the XGBoost CPP performs better than the RF CPP method in terms of returns. Finally, the proposed strategy is a sustainable investment strategy in the sense that it works well over a long time period that consists of bear market, bull market, and volatile market periods.
2. The Basic Idea of CPP Quantitative Stock Selection Strategy Design
The general steps of the CPP quantitative stock selection strategy design were as follows (see also
Figure 1).
The first step was to use all stocks in the Chinese A-share market (exclude special treated “ST” stocks and new stocks listed less than 60 days) as the stock pool, and classify the stock based on their monthly rate of return. In particular, we classified each stock into five ranges (see
Table 1). We considered nine broad categories: quality factors, fundamental factors, emotional factors, growth factors, risk factors, stock factors, momentum factors, technical factors, and style factors. Then, we selected 45 factors from 9 categories as the initial factor pool. The factors in this article came from JoinQuant’s factor library.
Table 2 shows the 45 factors in the model factor pool of this article. These factors were dynamically screened into the model by the random forest (RF) model.
In the second step, the training and test sets were constructed by recombining the factors and yield intervals of each period. In particular, the period i−3 factor was combined with the monthly rate of return for period i−2, the period i−2 factor was combined with the monthly rate of return for period i−1, and the period i−1 factor was combined with the monthly rate of return of the period i. All together were combined to construct the training set of the period i. The factors of the period i and the monthly rate of return of the period i+1 constructed the test set of period i. See
Figure 2 for illustration.
In the third step, we used an RF model to predict the importance of factors for each training set, and sort the importance in descending order. We chose the most important factors to ensure that the cumulative importance of the selected factors reached 80%. As the factors had their own validity periods, the IC values of the factors in different periods were not completely unchanged. As shown in
Figure 3 and
Figure 4, the IC values of the factors ATR14 and EBIT have changed in different periods. Therefore, the factors applicable to different time periods are also different. For this reason, we used dynamic factor selection to select the most important factor in the current period and improve the accuracy of stock selection.
The fourth step was to use XGBoost CPP method to predict the classification (the previous month’s factor predicts the monthly yield range), and classify each stock into five yield ranges based on the factors dynamically selected in the third step. The stocks in the group yield range were sorted in descending order of probability, and the top 20 stocks with the highest probability were taken into the buying stock pool. On the last trading day of each month, the position was adjusted. When the position was adjusted, the stocks that were not in the buying stock pool are sold, and new stocks in the buying stock pool were bought. Then, we looped into the training set for the next period.
The CPP quantitative stock selection strategy with dynamic factor adjustment has some obvious advantages. The core of quantitative investments is the model, and the core of the model is the factor. This is particularly true in the neutral Alpha strategy with huge market capacity. Therefore, how to find a stable and effective factor becomes the first step in developing a mature profitable quantitative strategy. The random forest (RF) model is an ensemble learning method for classification, regression, and other tasks (
https://en.wikipedia.org/wiki/Random_forest). The RF model can not only effectively correct the overfitting problem in the decision tree model, but also give the importance of each input variable (importance). In 1995, Ho proposed the RF algorithm [
9], and some scholars extended the algorithm and conducted subsequent research (see, e.g., Breiman [
10] and Lin and Jeon [
11]). In this paper, we used the RF model to predict the importance of the factors in the training set, and rank the importance of the factors in descending order. Then, we selected the cumulative importance of the factors to reach 80%, ensuring that the factors in each period were the optimal choices. By doing that, we enhanced the impacts of the factors.
To the best our knowledge, most quantified stock selection strategies based on machine learning use the regression method to accurately predict the future return of the stock, and then buy stocks with high predicted returns. The fitted stock selection method seems to be more accurate than the multi-class probability prediction stock selection method, but its fault tolerance is relatively low. Once a prediction error occurs, it will have a greater impact on the overall return. Moreover, the noise in the yield is usually large, and the probability of regression errors is usually high. Therefore, it is easy to cause a large maximum retracement. The proposed multi-class probability prediction stock selection strategy is not to select the stock with the highest predicted return rate, but to select the stock with the highest probability of return in this range after the determined expected return range. Although some of the benefits are sacrificed in this way, the accuracy rate and fault tolerance rate are both improved, and with the increase of the accuracy rate, some of the sacrificed benefits will also be made up.
3. Back-test Analysis of CPP Quantitative Stock Selection Strategy
In this section, we conduct 74 back-testing analyses of market data from November 2013 to December 2019. The data source was from the JoinQuant quantization platform.
The goal of the stock selection was to achieve a high return, and we did not limit the investment strategies to any particular investment style. Therefore, it was natural to use the overall market return as the benchmark. In this paper, we chose the CSI 300 index as the benchmark.
3.1. Dynamic Factor Adjustment Analysis
Among the 45 factors, the style category was most likely to be selected (see
Table 3). The liquidity factor (liquidity) had a probability of being selected as high as 98.65%. The market value factor (size) was selected with probability 94.59% and the beta factor (beta) was selected with probability 68.92%. There were three growth type factors in the top ten factors, where the net asset growth rate (net_asset_growth_rate) had a selection probability of 95.95%, the net profit growth rate (net_profit_growth_rate) had a selection probability of 79.73%, and the price-earnings (P/E) ratio relative to the earnings growth ratio (PEG) had a selection probability of 71.62%. There were two risk type factors in the top ten. In particular, the 20-day annualized return variance (Variance20) was selected with a probability of 95.95%, the 20-day Sharpe ratio (sharpe_ratio_20) was selected with a probability of 74.32%. Finally, there was one emotion factor and one momentum factor among the top ten factors, where the trading volume shock (VOSC) was selected with a probability of 93.24%, and Price1M was selected with a probability of 90.54%.
The market value factor considered here is not the same as the traditional market value factor. It refers to the natural logarithm of the company’s total market value. The formula of liquidity factor is given by:
where STOM is the stock turnover rate in one month, given by the logarithm of the sum of stock turnover rates in the past 21 days; STOQ is the average turnover rate in the past three months, given by the logarithm of the average STOM in the past three months; and STOA is the average turnover rate in the past 12 months, given by the logarithm of the average STOM in the past 12 months. The formula for net asset growth rate is given by:
3.2. Back-testing Revenue
In this section, we compare and analyze the benefits under different back-testings. See
Table 4 for parameter settings.
3.2.1. XGBoost Classification Prediction and XGBoost regression Prediction
In 2015, the XGBoost model was proposed by Chen et al. [
12], which is optimized for fast parallel tree construction. “It has gained much popularity and attention recently as the algorithm of choice for many winning teams of machine learning competitions (
https://en.wikipedia.org/wiki/XGBoost)”. Because of the XGBoost model’s good performance, we chose the XGBoost model to predict the stock’s return rate.
The core model of this paper is the XGBoost multi-class prediction model, and the model parameters are shown in
Table 5. We used the XGBoost multi-class prediction model to perform back-testing from November 2013 to December 2019. A total of 74 class predictions were carried out. The comprehensive evaluation of the prediction is shown in
Table 6. Among them, accuracy, sensitivity C1, and precision C1 are defined similar to those for the two-class classification. The specific formulas are given by Equations (3)–(5), where
is given in
Table 7.
The stock selection criterion is to hold stocks that are predicted to be in the first category and are ranked in the top 20 in probability. Therefore, sensitivity C1 and precision C1 are more important for evaluating the prediction ability. Among them, sensitivity C1 represents the proportion of stocks that can be correctly predicted in the first category of stocks, and precision C1 represents the proportion of stocks that are truly in the first category. In the 74 predictions, the mean value of sensitivity C1 was 75.4% and the standard deviation was 7.8%; the mean value of precision C1 was 62.1% and the standard deviation was 10.3%. The average accuracy of the 74 predictions was 51.7% and the standard deviation was 7.9%. Although the overall accuracy was not very high, this indicator had little effect on the overall performance in terms of back-testing returns. We believe that the precision C1 indicator is the most important of the three indicators. The higher value of this indicator indicates that the model can screen out high-yield stocks with a high probability.
Next, the comparison between XGBoost classification prediction and XGBoost regression prediction was performed. In XGBoost classification prediction, we used the XGBoost model to predict the return rate range of each period of the back-testing stage; that is, to carry out multi-class prediction. In XGBoost regression prediction (parameters are given in
Table 8), we predicted the return rate value of each period of the back-testing stage, that is, regression the yield, and holding the 20 stocks with the highest predicted returns. Both methods use the RSRS index (relative strength of resistance support) stop-loss module to stop the loss.
As shown in
Figure 5 and
Table 9, the performance of the quantitative stock selection strategy based on the XGBoost multi-class prediction was much better than the CSI 300 Index in the back-testing interval from November 2013 to December 2019. In terms of the annualized yield, Sharpe ratio, maximum retracement, and Calmar ratio, the performances of the XGBoost multi-class prediction method were significantly better than the quantitative stock selection strategy based on XGBoost regression and XGBoost two-class classification in the same period. Therefore, we believe that the quantitative stock selection strategy of XGBoost multi-class probability prediction has a better back-testing performance.
3.2.2. Back-testing Revenue of Different Models
Next, in order to compare the combined back-testing effects of different models and stop-loss modules, we compared the performances of different combinations of the XGBoost and random forest decision-making models (parameters of the RF model are given by
Table 10) with the RSRS index (relative strength of resistance support) stop-loss module and the MACD (moving average of similarities and differences) stop-loss module. The back-testing results are given in
Figure 6 and
Table 11.
As shown in
Figure 6 and
Table 11, the back-testing benefit of the combination of the XGBoost model and the RSRS index stop loss module was higher than that of the random forest model. This indicates that, under the timing given by the RSRS index stop loss module, the XGBoost multi-class probability prediction is more accurate than the random forest model. However, under the timing given by the MACD stop loss module, the return of the XGBoost model was lower than that of the random forest model. In the case of the same machine learning model, the effect of the RSRS index stop loss module is significantly stronger than the MACD stop loss module. Therefore, we decided to choose the combination of XGBoost model and RSRS index stop loss module as the main model of CPP quantitative stock selection strategy.
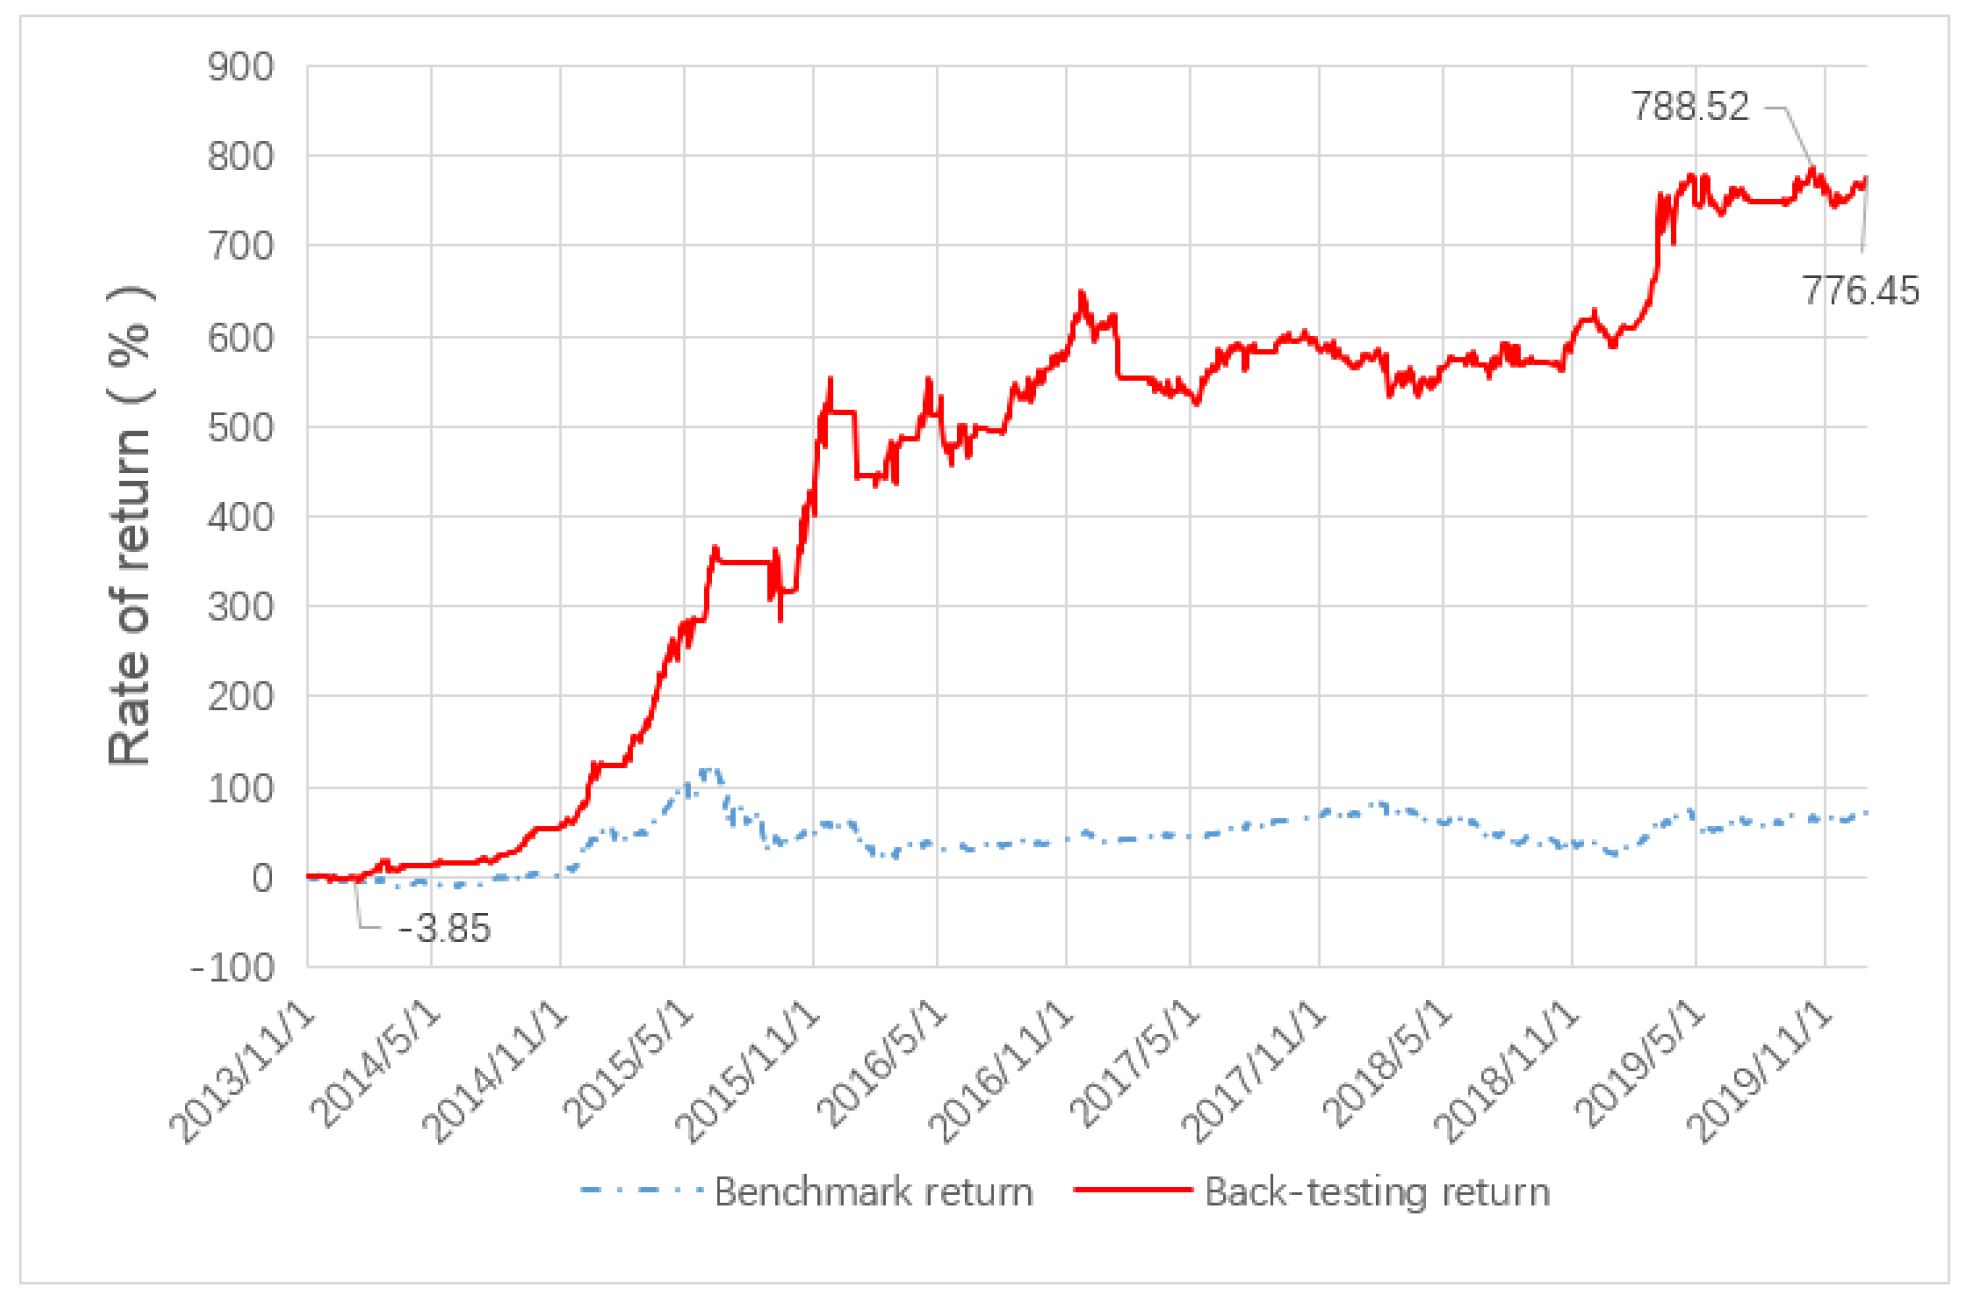
For the CPP quantitative stock selection strategy proposed in this paper, the annualized return reached 57%, the Sharpe ratio was 2.21, the maximum drawdown was 21%, the Calmar ratio was 2.71, and the win rate was 63.5%. The return of the strategy reached the lowest value of −3.85% on 10 January 2014, and reached the highest point on 14 October 2019 when cumulative gain of the strategy was 788.52%. Since 19 December 2013, the cumulative returns of CPP’s quantitative stock selection strategy have been better than the CSI 300 Index over the same period.
3.2.3. CPP Quantitative Stock Selection Back-Testing Income
After determining that the main model is a combination of the XGBoost multi-class forecast and the RSRS index stop loss module, this paper conducted back-testing in the back-testing interval from 1 November 2013 to 31 December 2019, and the results were given in
Figure 7 and
Table 12.
In different periods of the market, the applicable strategies will be different, and it is difficult for a strategy to perform well in all periods. The CPP quantitative stock selection strategy has different levels of excess returns at different time periods. As shown in
Table 12 and
Figure 7, from 1 November 2013 to 31 August 2014, a horizontal price movement period (volatile market) before the bull market, the CPP quantitative stock selection strategy achieved an excess yield of 30.29% during this 10-month period. From 1 September 2014 to 31 May 2015, the CPP quantitative stock selection strategy achieved an excess return of 94.4%. From 1 June 2015 to 31 December 2015, after the stock market crashed sharply, the CPP quantitative stock selection strategy achieved an excess return of 80.58%. From 1 January 2016 to 31 December 2019, another horizontal price movement period (volatile market), the CPP quantitative stock selection strategy achieved an excess return of 86.63%. As we can see, the proposed CPP quantitative stock selection strategy is a sustainable investment strategy that works well over an extensive period that covers bull market, bear market, and volatile market states.
4. Conclusions
In this paper, we used a random forest model to dynamically select factors for the training set in each period to ensure that the factors that could be selected in each period were the optimal factors in the current period. At the same time, the classification probability prediction (CPP) of stock returns was performed. This method can effectively take into account the accuracy of income prediction and avoid the interference of noise in the rate of return. Historical back-testing shows that the CPP quantitative stock selection strategy based on dynamic factor adjustment performs better than the traditional machine learning stock selection methods, and can outperform the CSI 300 Index over the same period in most back-testing periods. It is a sustainable investment strategy in the sense that, no matter in a bull market, a bear market, or a volatile market state, the CPP quantitative stock selection strategy based on dynamic factor adjustments can achieve better excess returns.
It should be noted that all the results in this article were derived from historical data back-testing, and the results may be different from the results of actual investments. As we used the historical data for back-testing, we did not consider the impacts of the market liquidity, and the impacts of this strategy on the decisions of other market participants, etc. Therefore, there is no guarantee that the strategy works for real market investments. We are not responsible for any loss caused by implementing the strategy.


