Article

Cluster Analysis of Haze Episodes Based on Topological Features

by
Nur Fariha Syaqina Zulkepli
*,
Mohd Salmi Md Noorani
,
Fatimah Abdul Razak
,
Munira Ismail
and
Mohd Almie Alias
Department of Mathematical Sciences, Universiti Kebangsaan Malaysia, Bangi 43600, Selangor, Malaysia
*
Author to whom correspondence should be addressed.
Sustainability 2020, 12(10), 3985; https://doi.org/10.3390/su12103985
Submission received: 12 March 2020 / Revised: 24 March 2020 / Accepted: 29 March 2020 / Published: 13 May 2020

Abstract

:
Severe haze episodes have periodically occurred in Southeast Asia, specifically taunting Malaysia with adverse effects. A technique called cluster analysis was used to analyze these occurrences. Traditional cluster analysis, in particular, hierarchical agglomerative cluster analysis (HACA), was applied directly to data sets. The data sets may contain hidden patterns that can be explored. In this paper, this underlying information was captured via persistent homology, a topological data analysis (TDA) tool, which extracts topological features including components, holes, and cavities in the data sets. In particular, an improved version of HACA was proposed by combining HACA and persistent homology. Additionally, a comparative study between traditional HACA and improved HACA was done using particulate matter data, which was the major pollutant found during haze episodes by the Klang, Petaling Jaya, and Shah Alam air quality monitoring stations. The effectiveness of these two clustering approaches was evaluated based on their ability to cluster the months according to the haze condition. The results showed that clustering based on topological features via the improved HACA approach was able to correctly group the months with severe haze compared to clustering them without such features, and these results were consistent for all three locations.

1. Introduction

Haze occurs in Southeast Asia including Malaysia almost every year. It is a phenomenon related to the weather where there is a presence of solid and liquid particles, smoke, and vapor in the atmosphere, which leads to an atmospheric visibility of less than 10 km [1,2]. Over the years, air pollution in Malaysia has been dominated by the occurrence of haze episodes and has caused negative health impacts to humans such as asthma attacks, chronic bronchitis, and acute respiratory infection [3]. During such haze episodes, particulate matter ( PM 10 ) was found as a dominant pollutant because its concentrations exceeded other pollutants ( O 3 , SO 2 , CO , and NO 2 ) [4,5]. Severe haze episodes were reported by the Department of Environment (DOE) Malaysia in 2005, 2013, 2014, and 2015 [6]. August 2005, June 2013, March 2014, September 2015, and October 2015 were the specific months affected by the occurrences of haze. During those months, the concentrations of PM 10 greatly exceeded the Malaysian Ambient Air Quality Guideline (MAAQG), which provided a safe level at 150 μ g   m 3 for a 24-hour average of PM 10 concentration [7].
Cluster analysis is a useful method to partition objects from data sets into different groups (clusters). Therefore, objects with similar information are placed into the same groups and are kept distinct from one another [8,9]. A few examples of clustering methods include hierarchical, k-means, and density-based methods [8]. One of the clustering techniques used for air quality studies is hierarchical agglomerative clustering analysis (HACA). The term ‘hierarchical’ refers to the process of clustering with clusters that are grouped in each step consisting of clusters that are previously clustered. Meanwhile, the term ‘agglomerative’ indicates that the clusters formed at the beginning of the clustering process are the observations that will continually cluster together until it ends up with a single cluster containing all observations [8,10].
Application of HACA is commonly used for identifying air pollution behavior in air quality monitoring stations based on their locations. Studies done by [9,11,12,13,14,15,16] showed the effectiveness of HACA in categorizing the air pollution behavior according to air quality monitoring stations. In addition, several studies used HACA to cluster air quality data based days, months, and years of air pollution episodes. For example, in their work [17], Beaver and Palazoğlu grouped ozone episodes by days and analyzed the relationship between clusters formed by HACA. Mutalib et al. [18] used HACA on air pollutant parameters to cluster them by months and years and validated the times of the haze episodes occurred. Based on their results, the months and years for haze episodes were located in different clusters and stood apart from the clusters consisting of months and years without haze episodes. Related studies on the application of cluster analysis on air pollution have been studied by Dotse et al. [5], Ignaccolo et al. [19], and Qiao et al. [20]. The aforementioned literature applied HACA directly based on the available air pollution data. Hidden features contained in data sets that had not yet been explored might provide an adverse effect in the cluster analysis. Thus, this study fills a research gap by extracting the hidden features, and the effectiveness of clustering with and without such features are investigated.
Persistent homology is a tool in topological data analysis (TDA) used to extract qualitative features or specifically known as topological features from data sets, and such features are formed across multiple scales [21,22]. Topological features which are the hidden features in the data sets are described by the numbers of components and holes. The points in the data sets are gradually joints up by lines drawn between them and this process will yield components and holes that approximate the shape of the data. The transitions from points in data sets to components and holes provide new kinds of information for data structures in the topological sense that were not readily available in the data [23]. Furthermore, the robustness of persistent homology in addressing noise, high-dimensionality, and incomplete data provide new insights in addressing the complexity of data [22]. Exploration of persistent homology has been done in various fields such as identification of breast cancers [24], robotics [25], and brain networks [26] (see [22] and references therein).
Figure 1 illustrates the clusters formed from four distinct objects based on their topological features. In traditional data clustering, based on distance measures, the four distinct objects formed singleton clusters [27,28]. However, from the topological point of view, two clusters are formed according to their topological features; one hole (cluster 1) and two holes (cluster 2). Cluster 1 shows two objects, a circle and a square, with each object featuring a hole. Similarly, in cluster 2, the two objects are grouped together since they exhibit existence of two holes, respectively. Motivated by this idea of clustering, this paper intends to investigate the effectiveness of clustering with and without topological information. Recently, studies related to the exploration of persistent homology with cluster analysis had been done by Wubie et al. [29] for liver transplant data, and Islambekov and Gel [30] for water quality data. To the best of our knowledge, the exploration of cluster analysis with topological information, specifically HACA with persistent homology in air quality studies, has not been done. Therefore, the effectiveness of clustering with and without topological information of haze episodes, which is a common issue in air quality studies, is assessed through this study.
HACA, a traditional approach of clustering was applied directly to the PM 10 data. The results of the traditional HACA were compared with improved HACA (HACA with persistent homology). A few steps needed to be completed to improve the HACA approach. Firstly, the daily average data was transformed into a point cloud data, and persistent homology was applied to the point cloud data. Secondly, an analysis of topological features was performed and multidimensional data was created [28]. Finally, HACA was performed on the multidimensional data and the results were compared to those of traditional HACA. The effectiveness of these techniques was observed based on its ability to cluster between the months with severe haze episodes and without haze. To validate the consistency of the results, the PM 10 data was extracted from three different air quality monitoring stations (Klang, Petaling Jaya, Shah Alam) affected during haze episodes and the results were analyzed for each station.

2. Materials and Methods

2.1. Data Preparation

The daily average PM 10 data used in this work was obtained from the Department of Environment (DOE) Malaysia. In this study, the analysis was done from January 2000 to December 2015. Nevertheless, the results pertaining to selected years with haze episodes and the other years are provided in supplementary materials. For the traditional HACA approach, the daily average PM 10 was transformed into monthly average data. As for the improved HACA approach, the daily average was partitioned according to months, and Takens’s theorem [31] was applied to transform the data into a higher dimensional data. Based on Takens’s theorem, a series x 1 ,   x 2 , ,   x n was represented as a vector with m components, which was formally described as x n ( m , τ ) = ( x n ,   x n + τ , ,   x n + ( m 1 ) τ ) where τ represented the time delay and m was the embedding dimension. This process was required to extract holes from the data, which existed in at least two-dimensional data. The data was transformed using τ = 1 and m = 3 in this study. Different settings of these values were unsuitable to be compared between the months for this study. The values had been used by a previous work done by Umeda [32], while the dimension m = 3 had been used by Khasawneh and Munch [33] as well as Khasawneh et al. [34] to study the holes of data.
Haze episodes were selected from 2005, 2013, 2014, and 2015 [6]. This study focused predominantly on August 2005, June 2013, March 2014, and September and October 2015 [35,36,37,38]. The episodes were analyzed from three distinct air quality monitoring stations, chiefly Klang, Petaling Jaya, and Shah Alam located in the Klang Valley, which is known as the polluted area [39]. Figure 2 shows the map of the chosen air quality monitoring stations. Klang and Shah Alam are located in urban area, whereas Petaling Jaya is in industrial area. These stations are expected to have high PM 10 concentrations due to industrialization and economic activities [39]. Table 1 displays the descriptive statistics of PM 10 in the selected months that experienced severe haze. Malaysian Ambient Air Quality Guideline (MAAQG) had stated that the conventional requirement for human health against the pollutant PM 10 is at 150 μ g   m 3 for a 24-hour average concentration [7,39]. As shown in Table 1, all the maximum values of concentration PM 10 had far exceeded MAAQG’s assertions and this was the reason why those months were chosen. The total number of observations involved in this study was 17,532 (5844 observations × 3 stations) with 0.2% of missing data. Therefore, the mean substitution method [40] was applied for the missing values in this study.

2.2. Hierarchical Agglomerative Clustering Analysis (HACA)

The similarity of relationships among the observations in the data sets can be obtained using hierarchical agglomerative clustering analysis (HACA) [41]. In the beginning, HACA initialized the N observations as N singleton clusters, and the dissimilarity between distances of the clusters was calculated. Two of the closest clusters were placed together to form a single cluster; this single cluster formation is the basic rule of clustering in HACA. For the next cluster, new sets of distances were calculated based on the choice of linkage methods. There are several choices of linkage methods such as single linkage, complete linkage, and average linkage. This study used the complete linkage method, which defines the distance between two clusters as the maximum distance between the members. The reason for using this linkage was to separate, and compact the clusters well [8]. The rule for choosing the two closest members was still applied after new sets of distance were produced. This process was repeated until one cluster was formed containing all the observations. The result of HACA was then displayed in a tree diagram known as the dendrogram, which illustrated the combined clusters from the beginning until the end of the clustering process. The dissimilar distances between clusters in N observations were calculated using the Euclidean distance (see the equation (1)), where w i h and w j h were respectively the hth variable value of the z-dimensional variables for both observations i and j.
D i j = h = 1 z ( w i h w j h ) 2 .
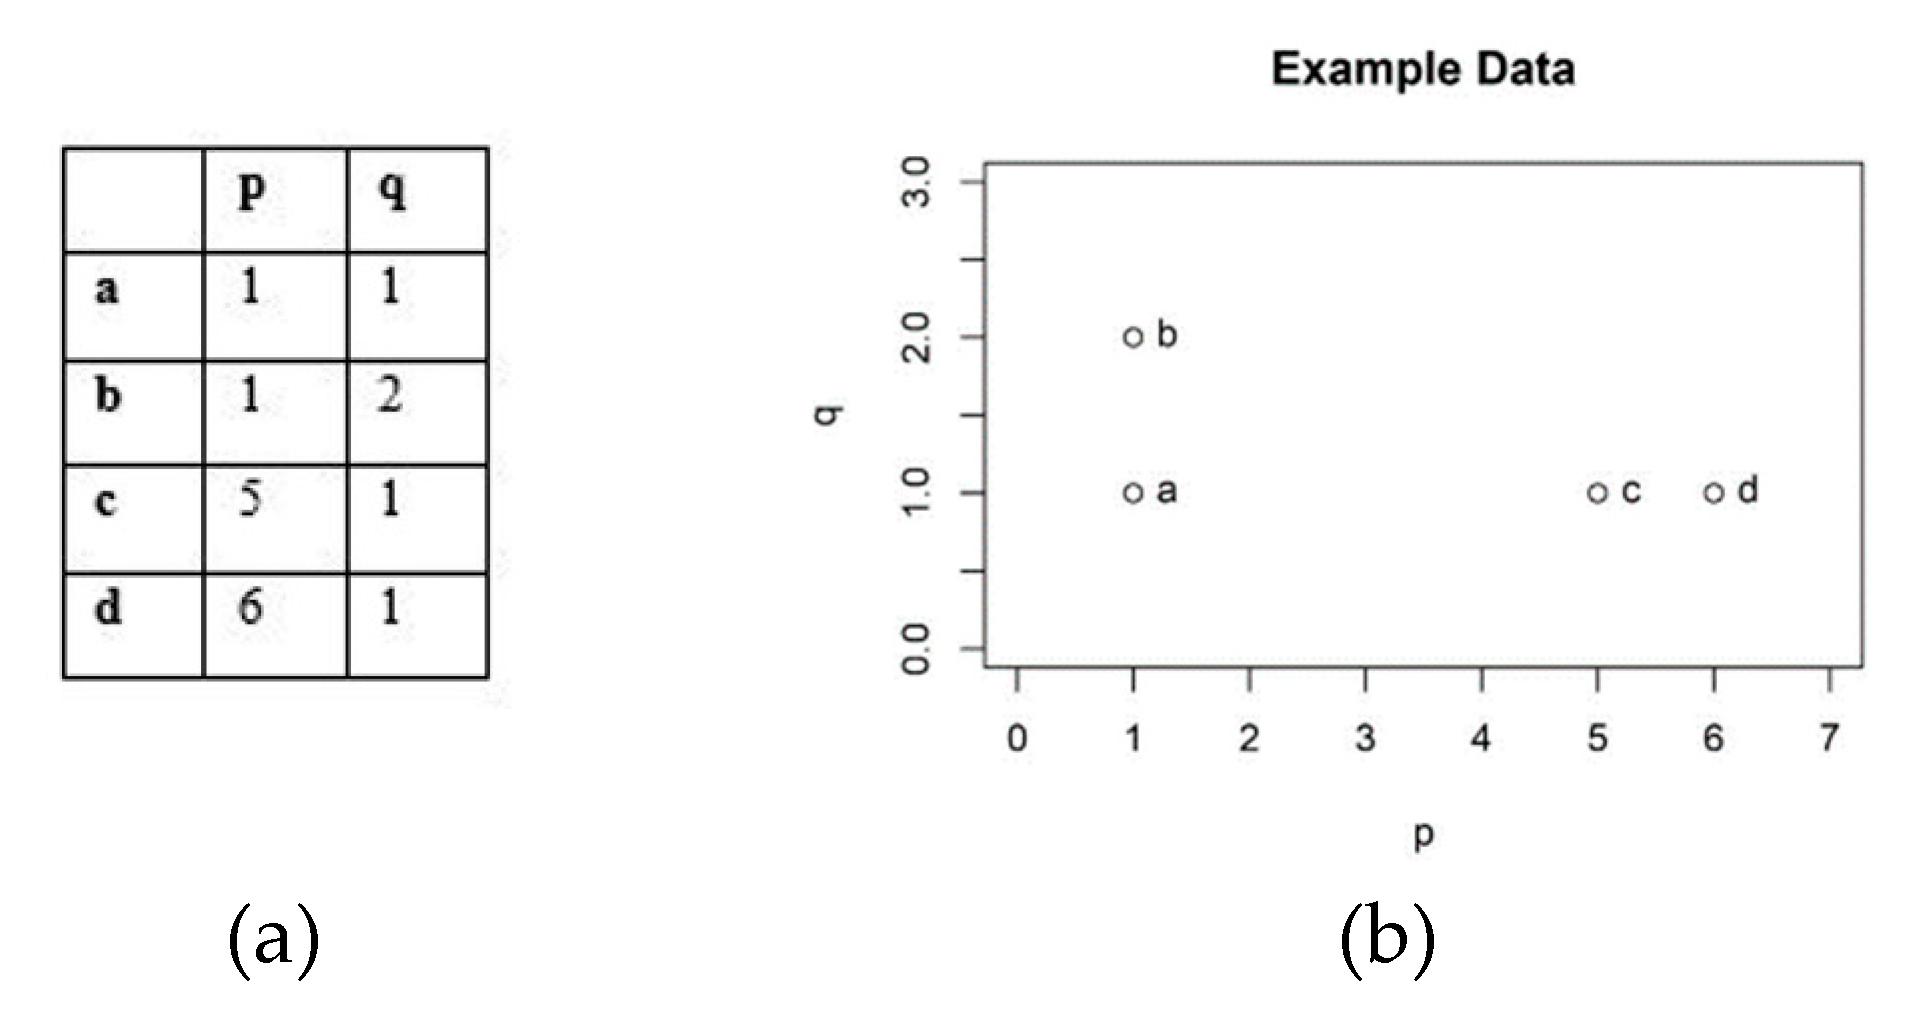
This produced the dissimilarity matrix, N × N matrix with Dij representing the dissimilarity distance between two z-dimensional points: w i = ( w i 1 , w i 2 , , w i z ) and w j = ( w j 1 , w j 2 , , w j z ) . It must be noted that for the same observations in which i = j , the distance was Dij = 0. Figure 3 shows an example of data with four observations ( N = 4 ) , a, b, c, and d and two variables ( z = 2 ), p and q were used to illustrate HACA calculations.
The dissimilar distances between the observations a, b, c, and d were calculated using the Euclidean distance. For instance, the distance between the first and second observations, a and b was equal to D12 = ( 1 1 ) 2 + ( 1 2 ) 2 = 1. For the distance between the same observations was D11 = ( 1 1 ) 2 + ( 1 1 ) 2 = 0. The dissimilarity distance matrix was 4 × 4 for the data in Figure 3, as shown in Figure 4a. Two clusters were formed with a and b in the same cluster while c and d were from the other cluster. This was because they had a minimum distance of D12 = D34 = 1. Complete linkage was used to determine the next cluster. The distance between the two clusters was determined by the distance between the two farthest-apart members Therefore, it was the distance between the second and the fourth observations, b, and d, respectively, which was D24 = 5.10. This was the final step of the HACA process where a cluster was formed from the linkage consisting of all observations: a, b, c, and d, and the closest members were placed in the same cluster. The results of HACA was displayed in the dendrogram, as shown in Figure 4b. This began with four observations, which formed four singleton clusters. Then some links that joined those clusters with a height equivalent to the dissimilar distance, which joined the two closest clusters. From the HACA example above, it was apparent that the clusters were determined by the distance calculated based on the value of the data. It was a very straightforward calculation without any alteration to the data. However, other characteristics including topological features can be extracted from the data and this information can provide a new direction for the HACA technique. Thus, this study was conducted to investigate the effectiveness of combining HACA with topological features.

2.3. Persistent Homology

Persistent homology was applied to the point cloud data produced by applying Takens’s theorem on time series data of PM 10 . A point cloud data was represented by the unordered sequence of points in Euclidean m-dimensional space m [42]. In this study, a point cloud is formed by transforming a 1-dimensional daily time series PM 10 , x 1 ,   x 2 , ,   x n where n is the number of days in a particular month by using Takens’s theorem with time delay τ = 1 and embedding dimension m = 3 and yield 3-dimensional data (in 3 ). For instance, the first row of the time series data represented by x 1 is transformed to x 1 = ( x 1 ,   x 2 ,   x 3 ) , second row with x 2 = ( x 2 ,   x 3 ,   x 4 ) and so on. Topological features were obtained by applying persistent homology on simplicial complexes constructed from point cloud data. Construction of a simplicial complex was done using simplices as building blocks with several rules applied in the process of construction. Since this study used point cloud data with dimension 3, low-dimensional ( 0 k 3 ) values of k-simplices was used to build up simplicial complexes with 0-simplices representing points or vertices, 1-simplices representing lines or edges, 2-simplices representing triangles and 3-simplices representing tetrahedra (Figure 5). The first rule in the construction is to draw a circle with radius ε for each point in a point cloud. Second, when the radius increased with two circles intersecting with each other, a line is drawn connecting two points. These rules build the simplices and the combination of simplices yields a simplicial complex. The radius of the circles is also known as the filtration value and the evolution of topological features is captured for each filtration stage. To construct simplicial complexes in this study, Vietoris-Rips (VR) complexes were used where the distance of any two vertices in k-simplices must be less than or equal to 2 ε [23].
Figure 6 shows an example of simplicial complexes formation and topological features extracted from the formation. For 0 k 2 , the k-dimensional topological features represented the components, holes, and cavities, respectively. However, this study only considered components and holes. These features were represented by a barcode shown in Figure 6b. The difference between birth, b, and death, d points, ( d b ) quantified the lifetime of topological features. The lifetime of the features was represented by the lines in the barcode and their birth, b, and death, d points of each feature were represented by the left and the right end of the line. Another representation of topological features known as the persistence diagram was shown in Figure 6c. It is a representation displayed in the two-dimensional graph with the x-axis representing the birth values and the y-axis representing death values. The diagonal line in the persistence diagram consisted of ( x , x ) points, that existed for the stability of the persistence diagram and this was discussed more in [43]. Based on Figure 6a, at the initial stage ( ε = 0 ), 10 points (0-simplices) formed a circle shape and at this stage, 10 components were represented by the black lines in a barcode (Figure 6b). The filtration value, ε was increased to 0.1, while 10 circles were drawn for each point with the 10 black lines increased in length. By entering another filtration stage at ε = 0.4 , the circles intersected with each other and lines were drawn connecting to the closest points. This caused the destruction of four components, with the remaining ones remaining connected at ε = 1.14 . At this stage, there was only one component left, and it was the final one while another feature (hole) appeared, and was represented by the red line in the barcode. The hole continues to exist until the growing circles close the hole. A persistence diagram (Figure 6c) presents a simple representation of the barcode with each point representing feature coordinates ( b , d ) .

2.4. Analysis of Topological Features

The barcode and persistence diagram contained the same information about topological features extracted by persistent homology. Since the persistence diagram is a simple representation of barcodes, the analysis was conducted using persistence diagrams. Summary statistics (summation, average, maximum) of the lifetimes of all the topological features were calculated for each persistence diagram, which represented each month in this study. A set persistence diagram, α m consisted of the n features elements with α m j = ( b j , d j ) , comprised the birth point b j and death point d j ( j = 1 ,   2 , ,   n ) . For k-dimensional topological features, dimensions k = 0 and k = 1 were considered, particularly components (0-dimensional features) and holes (1-dimensional features).
The statistical formula to calculate the total lifetimes of topological features in each persistence diagram was shown in Equation (2) [28,44]. A persistence diagram with short-lived features contributed to a small value of summation.
sum k = j = 1 n ( d j b j ) .
The lifetimes of topological features were further analyzed by calculating their average, as shown in Equation (3) [28,44,45]. The value of average depicted the behavior of topological features, which helped distinguish between the persistence diagrams with short and longer lifetimes of topological features.
avg k = j = 1 n ( d j b j ) n .
We found a feature that had maximum lifetimes [28,44,45] and when compared to other features, it was one of the favorable features in analyzing topological features, since it was interpreted as the significant one. The maximum the lifetime of the topological features was calculated using Equation (4) for each persistence diagram.
max k = max α m j α m ( d j b j ) .
For each persistence diagram, a multidimensional data with a column represented the summary statistics, and each row represented the months that were created for components and holes. Cluster analysis (HACA) was applied to the multidimensional data, which was the improved HACA. The results were then compared to the traditional HACA.

2.5. HACA with Persistent Homology

The illustration of comparison between the traditional HACA and the improved HACA methods was done using series, T 1 , T 2 , and T 3 (Equations (5)–(7)), as utilized by Pereira and Mello [28]. Additionally, Pereira and Mello [28] used k-means clustering to compare the clustering with and without topological information, whereas this work used HACA to obtain the clustering result. According to them, clustering based on topological features yielded two clusters in which series T 1 and T 3 were clustered together while T 2 stood alone. This was due to their characteristics where T 1 and T 3 were periodic sine waves, while T 2 was a damped sine wave. Different results were produced from the clustering without topological features. Despite their differences in physical properties, series T 1 and T 2 were clustered together and series T 3 was labeled a singleton cluster. Based on their findings, the HACA technique was applied with and without topological features and the finding was then validated.
T 1 ( x ) = sin ( 2 π x ) .
T 2 ( x ) = e x cos ( 2 π x ) .
T 3 ( x ) = sin ( 4 π x + π / 2 ) .
Figure 7 shows the series T 1 , T 2 , and T 3 for π / 2 with their persistence diagrams, respectively, and the comparison between the traditional HACA and the improved HACA. The first step in the improved HACA approach involved applying Takens’s theorem on the series with a time delay, τ = 1 and embedding dimension m = 3 . Next, the topological features, components, and holes were extracted from the transformed series. Thirdly, an analysis of topological features was done on the persistence diagrams, and the multidimensional data were created. Finally, HACA was applied to this multidimensional data. The results were compared by applying HACA directly on the series. In a similar vein to Pereira and Mello [28], the improved HACA yielded two clusters, whereby the first and third series ( T 1 and T 3 ) clustered together and the second series ( T 2 ) was a singleton cluster. Based on these findings, clustering with topological features was more efficient since its ability in clustering the series according to its physical characteristics with T 1 and T 3 were periodic sine waves, whereas T 2 was a damped sine wave.

3. Results and Discussions

This study applied two approaches to investigate the effectiveness of the techniques on PM 10 data for selected severe haze episodes that occurred in 2005, 2013, 2014, and 2015. The comprehensive results of HACA for the year 2000 until 2015 are provided in supplementary materials. The PM 10 data was analyzed from the three air quality monitoring stations (Klang, Petaling Jaya, and Shah Alam). Additionally, the consistencies of the results were observed for each station. For the traditional approach, HACA was applied on the monthly average of PM 10 . A few steps were carried out to apply the improved approach of HACA. Firstly, the daily average PM 10 was transformed into higher dimensional data according to the months via Takens’ theorem with a time delay of τ = 1 , and the embedding dimension m = 3 . This step generated point cloud data where each point cloud represented the transformed month data. Secondly, persistent homology was applied on each point cloud starting from filtration the value, ε = 0 until maximum filtration value, ε max = 700 . Thirdly, the analysis of topological features for components and holes was performed using summary statistics in Section 2.4 and the multidimensional data were created. Finally, HACA was applied to the multidimensional data. Computations of HACA and persistent homology were completed using R-package stats [46] and R-package TDA [47], respectively.
Figure 8 illustrates persistence diagrams between a month with haze (August 2005) and a month without haze (December 2005). Decembers often receive abundant rainfall during the Northeast monsoon in Malaysia [48]. This rainfall helps to eliminate particles from the earth’s surface [49]. The death points (vertical axis) of components (black dots) and holes (red triangles) for months with haze were higher than of months without haze. In Figure 8b, the features ‘died’ at the early filtration stage features compared to features in Figure 8a. This suggested that the months without haze had short lifetimes of topological features. Therefore the computations were able to distinguish between haze and without haze conditions. At the final filtration stage, only one component (small square) was left and this feature would exist for any other filtration value. In analyzing the topological feature, this feature was excluded for all persistence diagrams to avoid dominance against other features. The analysis of topological features was conducted for all persistence diagrams. Then HACA was applied based on this analysis.
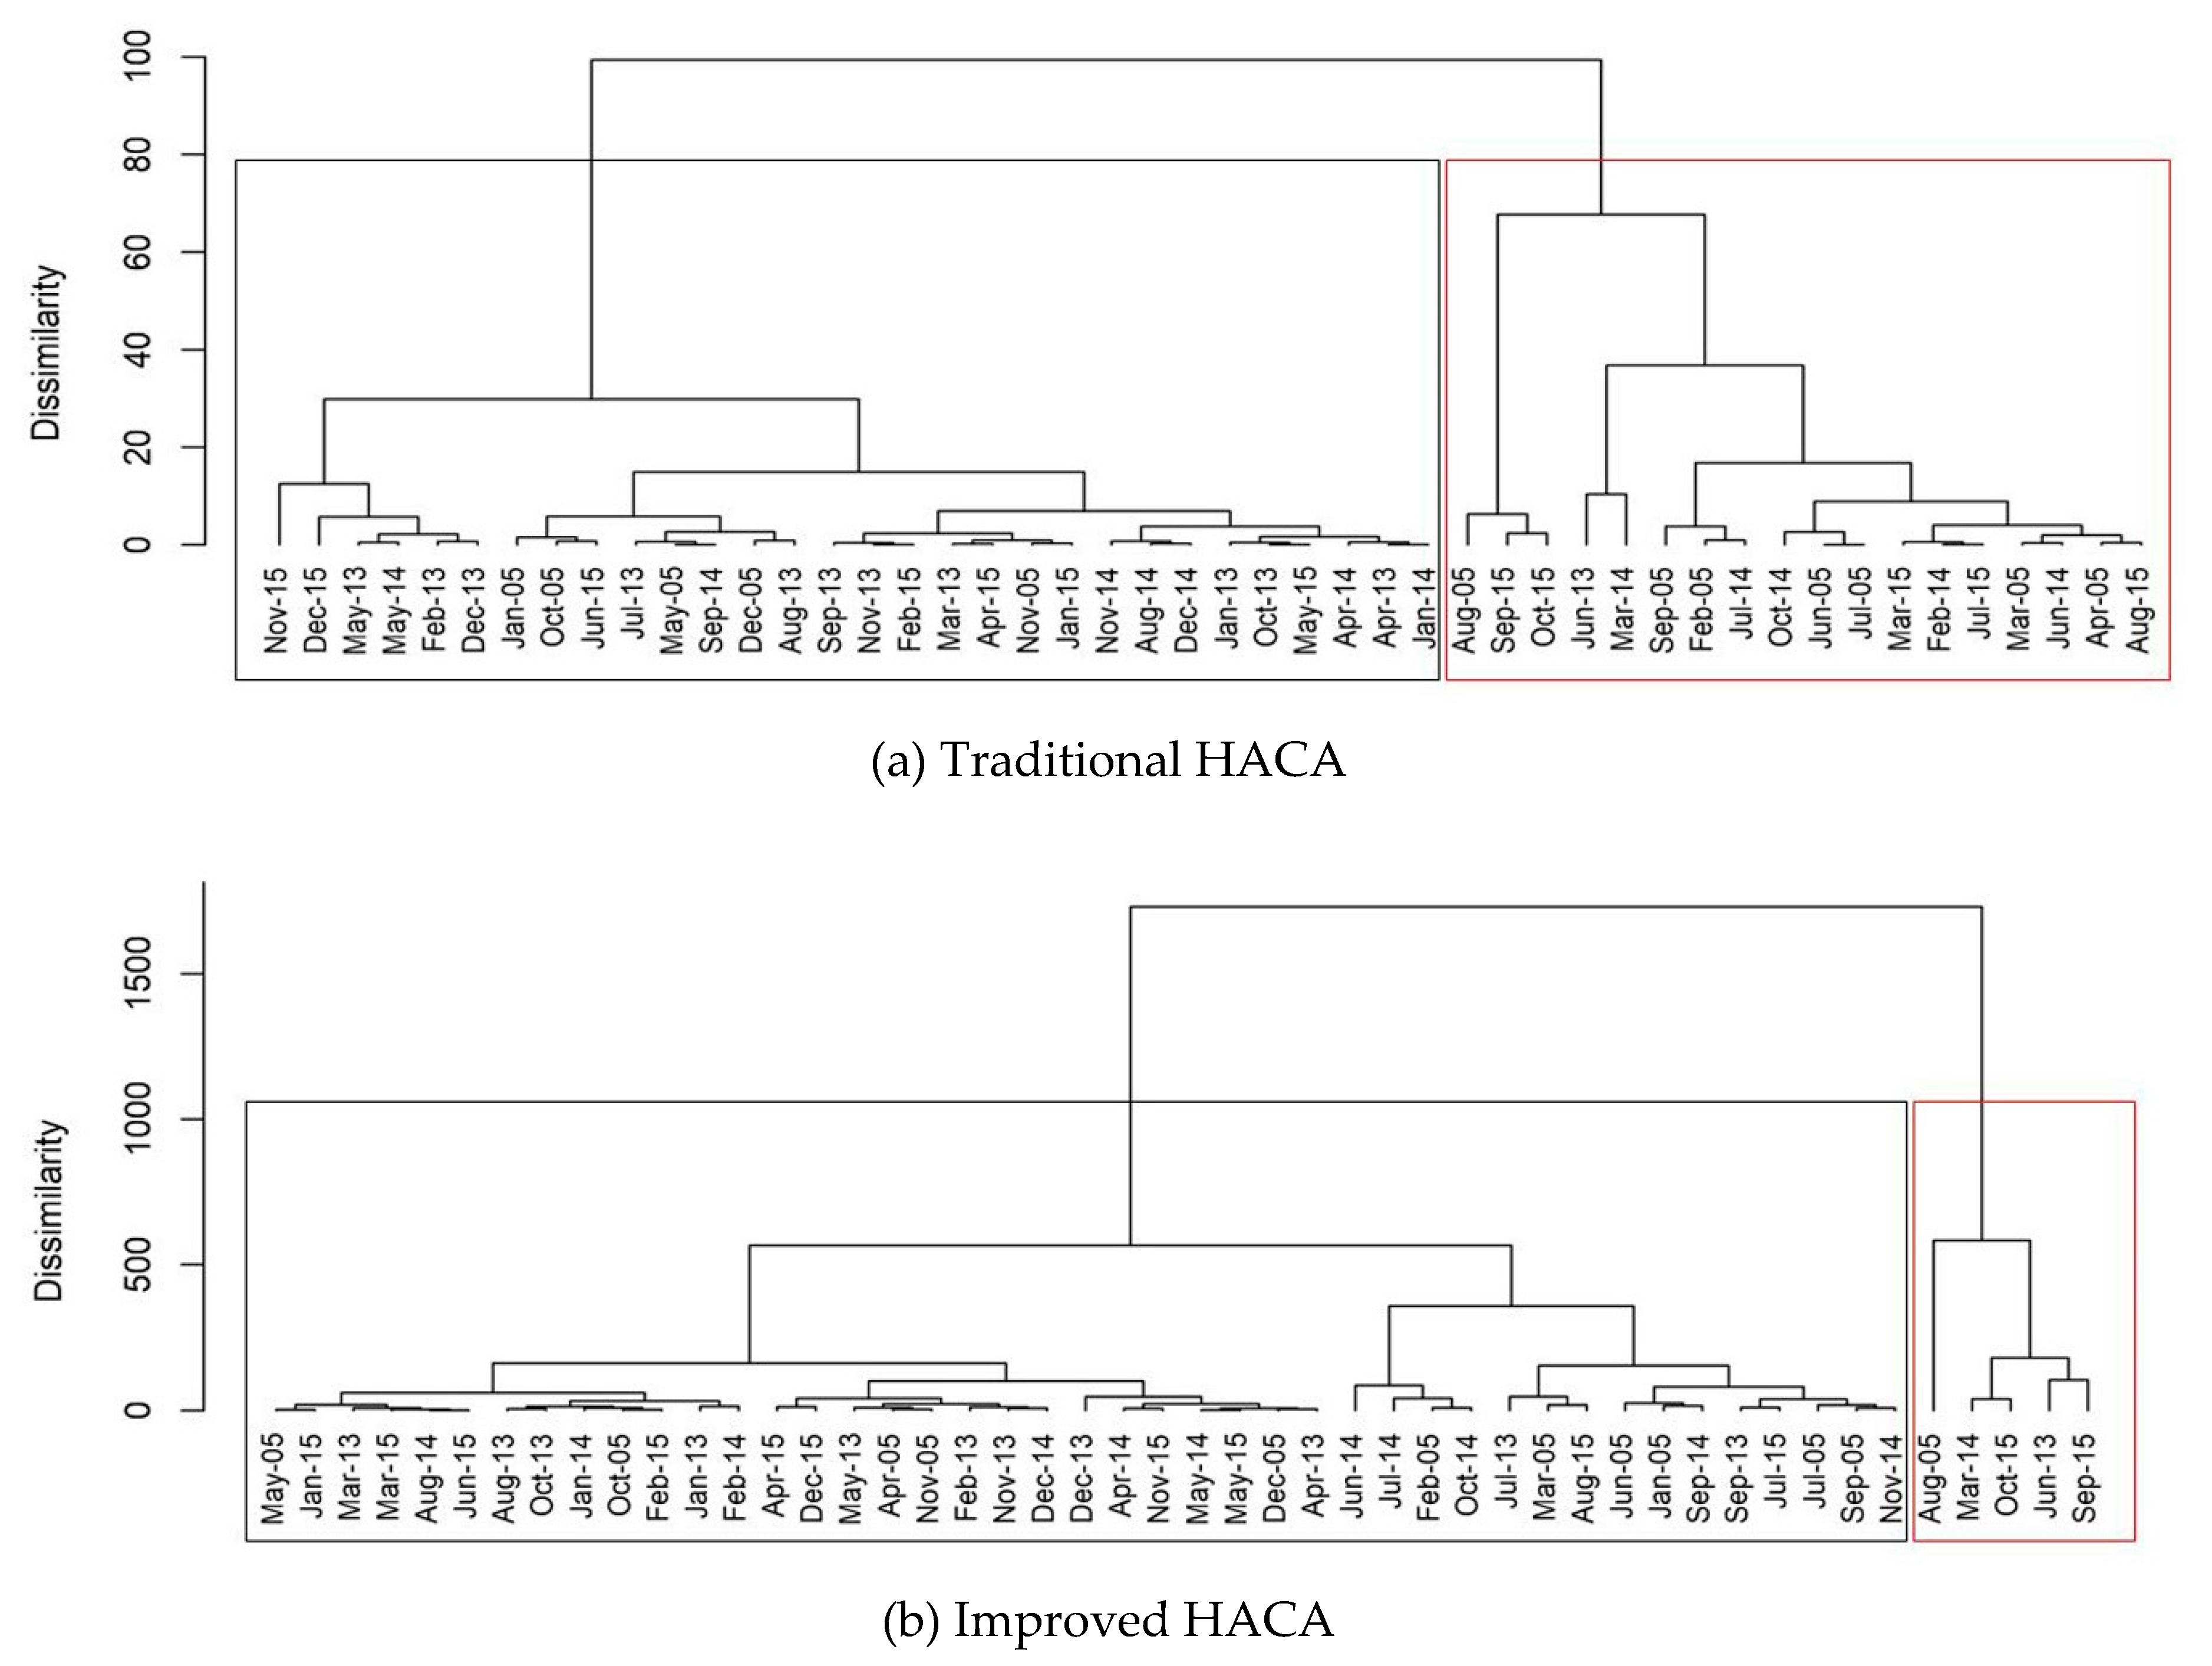
The results of HACA for the two approaches were displayed in dendrograms alongside the similarity between months observed. Figure 9 shows dendrograms (traditional HACA and improved HACA) for Klang station. The vertical line in the dendrograms represented the dissimilarity in distance between clusters. When the dissimilarity values were higher, the differences between the clusters were more pronounced. From the clusters formed by the traditional HACA approach, two clusters were selected with one of the clusters consisting of various months with haze. In 2005, a short period of haze occurred in February, and on July 2014, the 24-hour concentration had exceeded MAAQG in a few days of that month [37,38]. In the traditional HACA approach, the months with haze belonged to the same cluster, but in the improved HACA method, the months with haze were separated between two clusters. Through the improved HACA approach, the severe haze months (August 2005, June 2013, and March 2014) and moderate haze months (February 2005, July 2014, September 2015, and October 2015) were successfully divided into two clusters.
Further investigations of the two techniques were done by observing cluster members in the other two air quality monitoring stations (Petaling Jaya and Shah Alam). Figure 10 presents the results of dendrograms for Petaling Jaya station. Two clusters were formed via two approaches with the differences between cluster members. In the traditional HACA, the months with haze were mixed up with months without haze, but in the improved HACA technique, the months with haze were placed in the same cluster. The cluster consisting of months with haze (Figure 10b) showed that August 2005 is the most dissimilar compared to other months with haze. This is because the severity of the haze for that particular month was higher compared to other months with haze because in that month, the maximum concentration PM 10 was at 482 μ g   m 3 (Table 1), which was the highest concentration value. The behavior of topological features for months with the haze that persisted longer helped to cluster the months correctly. Interpretation of dendrograms would be a challenge since the HACA is an unsupervised technique without labels tagged to the observation in advance [50]. The topological features characterization of months with and without haze provided more information on the possible outcomes, which provided the idea for dendrogram interpretations.
Figure 11 shows the dendrograms for the Shah Alam station where two clusters were selected for each dendrogram. The months with severe haze (August 2005, June 2013, March 2014, September 2015, and October 2015) were placed in the same cluster and August 2005 showed the highest dissimilarity distance when compared to the other clusters (Figure 11b). This result differed from the traditional HACA clustering where August 2005 was similar to February 2005, and the two months merged to form a cluster (Figure 11a). The highest reading of PM 10 concentration in August 2005 was 587 μ g   m 3 (Table 1), and it was the highest reading of that year. February 2005 was a month with moderate haze, since the highest concentration of PM 10 was at 229 μ g   m 3 . Supposedly, August 2005 should initially be a month which was most dissimilar to the other months with severe haze; nevertheless, it was successfully characterized by the improved HACA. Figure 9, Figure 10 and Figure 11 revealed that the clustering techniques based on the topological features demonstrated better-resulting clusters, which were able to distinguish between the months with and without haze.
However, there were few cases that the improved HACA was unable to cluster the months with haze correctly at the Klang station. Based on the full results of the Klang station’s clustering process from January 2000 until December 2015 (supplementary materials), the traditional HACA was able to cluster February 2002 and March 2002 as the months with haze and this was not achieved by the improved HACA. However, the improved HACA was able to cluster August 2002 and February 2005 as the months with moderate haze occurrences and the traditional HACA was unable to cluster these. These cases were only observed at Klang station, whereas other stations showed consistent results for the years 2000 until 2015.

4. Conclusions

This study had applied two approaches, the HACA on its own (traditional HACA) and the HACA with persistent homology (improved HACA) to cluster months with and without haze using the PM 10 data. Selected haze episodes that occurred in 2005, 2013, 2014, and 2015 were the main focus of this study. Through the traditional HACA approach, the daily average PM 10 had been transformed to the monthly average without extracted qualitative features. For the improved HACA approach, higher-dimensional data was required and the daily average PM 10 was converted into three-dimensional data via the Takens’s theorem. The persistent homology was used to extract the topological features (qualitative features) such as components and holes. The analysis of the topological features was done by computing the summary statistics. As a result, the multidimensional data were created. The HACA had been applied to the data and the results were compared to the traditional HACA technique. Based on the results, the months with haze were well separated between clusters based on the similarity of the topological features compared to the process of clustering without extracting the features. The consistency of the results had been observed between three distinct air quality monitoring stations (Klang, Petaling Jaya, and Shah Alam) that were involved in this study. For each station, the improved HACA approach was able to cluster the months with haze and without haze effectively, and the interpretation of the results was in line with the original PM 10 concentration behavior. The main contribution of this study had been highlighted through the effectiveness of the improved version of the HACA based on the topological features to cluster months with and without haze. This finding has provided a new approach in the study of environmental time series. In particular, more refined and useful results have been obtained in the cluster analysis of the haze-related time series when coupled with qualitative information extracted from the data sets. As for the future direction of this work, we believe it is possible to apply the combination of cluster analysis and persistent homology to other environmental time series in the quest to better understand other environmental phenomena such as flood, tidal wave, and typhoon events.

Supplementary Materials

The following are available online at https://www.mdpi.com/2071-1050/12/10/3985/s1, Table S1. Clusters members (months) resulted from the method HACA on its own (traditional HACA) and HACA with topological properties (improved HACA) in Klang station for year 2000 until 2015, Table S2. Clusters members (months) resulted from the method HACA on its own (traditional HACA) and HACA with topological properties (improved HACA) in Petaling Jaya station for year 2000 until 2015, Table S3. Clusters members (months) resulted from the method HACA on its own (traditional HACA) and HACA with topological properties (improved HACA) in Shah Alam station for year 2000 until 2015.

Author Contributions

Conceptualization, N.F.S.Z. and M.S.M.N.; methodology, N.F.S.Z., M.S.M.N. and F.A.R.; software, N.F.S.Z.; validation, N.F.S.Z., M.S.M.N., F.A.R., M.I. and M.A.A.; formal analysis, N.F.S.Z.; investigation, N.F.S.Z.; writing—original draft preparation, N.F.S.Z.; writing—review and editing, N.F.S.Z., M.S.M.N., F.A.R., M.I. and M.A.A.; visualization, N.F.S.Z.; supervision, M.S.M.N., F.A.R., M.I. and M.A.A.; project administration, F.A.R.; funding acquisition, M.S.M.N. All authors have read and agree to the published version of the manuscript.

Funding

This research was funded by Ministry of Education Malaysia Grant FRGS/1/2019/STG06/UKM/01/3.

Acknowledgments

The authors would like to express their utmost gratitude to the Department of Environment (DOE) of Malaysia and Mohd Talib Latif from Faculty of Science and Technology, Universiti Kebangsaan Malaysia for their permission and guidance in utilizing air quality data for this study.

Conflicts of Interest

The authors declare no conflict of interest.

References

  1. De Pretto, L.; Acreman, S.; Ashfold, M.J.; Mohankumar, S.K.; Campos-Arceiz, A. The link between knowledge, attitudes and practices in relation to atmospheric haze pollution in Peninsular Malaysia. PLoS ONE 2015, 10, e0143655. [Google Scholar] [CrossRef] [PubMed] [Green Version]
  2. Sulong, N.A.; Latif, M.T.; Khan, M.F.; Amil, N.; Ashfold, M.J.; Wahab, M.I.A.; Chan, K.M.; Sahani, M. Source apportionment and health risk assessment among specific age groups during haze and non-haze episodes in Kuala Lumpur, Malaysia. Sci. Total Environ. 2017, 601, 556–570. [Google Scholar] [CrossRef] [PubMed]
  3. Afroz, R.; Hassan, M.N.; Ibrahim, N.A. Review of air pollution and health impacts in Malaysia. Environ. Res. 2003, 92, 71–77. [Google Scholar] [CrossRef]
  4. Payus, C.; Abdullah, N.; Sulaiman, N. Airborne particulate matter and meteorological interactions during the haze period in Malaysia. Int. J. Environ. Sci. Dev. 2013, 4, 398–402. [Google Scholar] [CrossRef] [Green Version]
  5. Dotse, S.Q.; Dagar, L.; Petra, M.I.; De Silva, L.C. Influence of Southeast Asian Haze episodes on high PM10 concentrations across Brunei Darussalam. Environ. Pollut. 2016, 219, 337–352. [Google Scholar] [CrossRef]
  6. Department of Environment (DOE), Chronology of Haze Episodes in Malaysia. Available online: https://www.doe.gov.my/portalv1/en/info-umum/info-kualiti-udara/kronologi-episod-jerebu-di-malaysia/319123 (accessed on 25 November 2018).
  7. Latif, M.T.; Othman, M.; Idris, N.; Juneng, L.; Abdullah, A.M.; Hamzah, W.P.; Khan, M.F.; Sulaiman, N.M.N.; Jewaratnam, J.; Aghamohammadi, N.; et al. Impact of regional haze towards air quality in Malaysia: A review. Atmos. Environ. 2018, 177, 28–44. [Google Scholar] [CrossRef]
  8. Everitt, B.S.; Landau, S.; Leese, M.; Stahl, D. Cluster Analysis; John Wiley & Sons Ltd.: Chichester, UK, 2011. [Google Scholar]
  9. Liu, J.; Li, W.; Wu, J. A framework for delineating the regional boundaries of PM 2.5 pollution: A case study of China. Environ. Pollut. 2018, 235, 642–651. [Google Scholar] [CrossRef]
  10. Müllner, D. Modern Hierarchical, Agglomerative Clustering Algorithms. 2011. Available online: https://arxiv.org/abs/1109.2378 (accessed on 27 November 2018).
  11. Pires, J.C.M.; Sousa, S.I.V.; Pereira, M.C.; Alvim-Ferraz, M.C.M.; Martins, F.G. Management of air quality monitoring using principal component and cluster analysis—Part I: SO2 and PM10. Atmos. Environ. 2008, 42, 1249–1260. [Google Scholar] [CrossRef]
  12. Lu, W.Z.; He, H.D.; Dong, L.Y. Performance assessment of air quality monitoring networks using principal component analysis and cluster analysis. Build. Environ. 2011, 46, 577–583. [Google Scholar] [CrossRef]
  13. Austin, E.; Coull, B.A.; Zanobetti, A.; Koutrakis, P.A. framework to spatially cluster air pollution monitoring sites in US based on the PM2. 5 composition. Environ. Int. 2013, 59, 244–254. [Google Scholar] [CrossRef]
  14. Azid, A.; Juahir, H.; Ezani, E.; Toriman, M.E.; Endut, A.; Rahman, M.N.A.; Yunus, K.; Kamarudin, M.K.A.; Hasnam, C.N.C.; Saudi, A.S.M.; et al. Identification source of variation on regional impact of air quality pattern using chemometric. Aerosol Air Qual. Res. 2015, 15, 1545–1558. [Google Scholar] [CrossRef] [Green Version]
  15. Isiyaka, H.A.; Azid, A. Air quality pattern assessment in Malaysia using multivariate techniques. Malays. J. Anal. Sci. 2015, 19, 966–978. [Google Scholar]
  16. Song, J.; Guang, W.; Li, L.; Xiang, R. Assessment of air quality status in Wuhan, China. Atmosphere 2016, 7, 56. [Google Scholar] [CrossRef] [Green Version]
  17. Beaver, S.; Palazoğlu, A. A cluster aggregation scheme for ozone episode selection in the San Francisco, CA Bay Area. Atmos. Environ. 2006, 40, 713–725. [Google Scholar] [CrossRef]
  18. Mutalib, S.N.S.A.; Juahir, H.; Azid, A.; Sharif, S.M.; Latif, M.T.; Aris, A.Z.; Zain, S.M.; Dominick, D. Spatial and temporal air quality pattern recognition using environmetric techniques: A case study in Malaysia. Environ. Sci. Process. Impacts 2013, 15, 1717–1728. [Google Scholar] [CrossRef]
  19. Ignaccolo, R.; Ghigo, S.; Giovenali, E. Analysis of air quality monitoring networks by functional clustering. Environmetrics 2008, 19, 672–686. [Google Scholar] [CrossRef]
  20. Qiao, Z.; Wu, F.; Xu, X.; Yang, J.; Liu, L. Mechanism of Spatiotemporal Air Quality Response to Meteorological Parameters: A National-Scale Analysis in China. Sustainability 2019, 11, 3957. [Google Scholar] [CrossRef] [Green Version]
  21. Carlsson, G. Topology and data. Bull. Amer. Math. Soc. 2009, 46, 255–308. [Google Scholar] [CrossRef] [Green Version]
  22. Otter, N.; Porter, M.A.; Tillmann, U.; Grindrod, P.; Harrington, H.A. A roadmap for the computation of persistent homology. EPJ Data Sci. 2017, 6, 17. [Google Scholar] [CrossRef] [Green Version]
  23. Edelsbrunner, H.; Harer, J. Computational Topology: An Introduction; American Mathematical Society: Providence, RI, USA, 2010. [Google Scholar]
  24. Nicolau, M.; Levine, A.J.; Carlsson, G. Topology based data analysis identifies a subgroup of breast cancers with a unique mutational profile and excellent survival. Proc. Natl. Acad. Sci. USA 2011, 108, 7265–7270. [Google Scholar] [CrossRef] [Green Version]
  25. Bhattacharya, S.; Ghrist, R.; Kumar, V. Persistent homology for path planning in uncertain environments. IEEE Trans. Robot. 2015, 31, 578–590. [Google Scholar] [CrossRef]
  26. Petri, G.; Expert, P.; Turkheimer, F.; Carhart-Harris, R.; Nutt, D.; Hellyer, P.J.; Vaccarino, F. Homological scaffolds of brain functional networks. J. R. Soc. Interface 2014, 11, 20140873. [Google Scholar] [CrossRef] [Green Version]
  27. Zomorodian, A.J. Topology for Computing; Cambridge University Press: Cambridge, UK, 2005. [Google Scholar]
  28. Pereira, C.M.; de Mello, R.F. Persistent homology for time series and spatial data clustering. Expert Syst. Appl. 2015, 42, 6026–6038. [Google Scholar] [CrossRef]
  29. Wubie, B.A.; Andres, A.; Greiner, R.; Hoehn, B.; Montano-Loza, A.; Kneteman, N.; Heo, G. Cluster Identification via Persistent Homology and Other Clustering Techniques, with Application to Liver Transplant Data; Springer International Publishing: Cham, Switzerland, 2018; pp. 145–177. [Google Scholar]
  30. Islambekov, U.; Gel, Y.R. Unsupervised space–time clustering using persistent homology. Environmetrics 2019, 30, e2539. [Google Scholar] [CrossRef] [Green Version]
  31. Takens, F. Detecting strange attractors in turbulence. In Lecture Notes in Mathematics Dynamical Systems and Turbulence, Warwick; Springer: Berlin/Heidelberg, Germany, 1980; pp. 366–381. [Google Scholar]
  32. Umeda, Y. Time series classification via topological data analysis. Trans. Jpn. Soc. Artif. Intell. 2017, 32, D-G72_1-12. [Google Scholar] [CrossRef] [Green Version]
  33. Khasawneh, F.A.; Munch, E. Stability determination in turning using persistent homology and time series analysis. In Proceedings of the ASME 2014 International Mechanical Engineering Congress Exposition, Montreal, QC, Canada, 14–20 November 2014; p. V04BT04A038. [Google Scholar]
  34. Khasawneh, F.A.; Munch, E.; Perea, J.A. Chatter Classification in Turning Using Machine Learning and Topological Data Analysis. IFAC-PapersOnLine 2018, 51, 195–200. [Google Scholar] [CrossRef]
  35. Enviro Knowledge Centre. Malaysia Environmental Quality Report 2015. Available online: https://enviro.doe.gov.my/ (accessed on 25 November 2018).
  36. Enviro Knowledge Centre. Malaysia Environmental Quality Report 2013. Available online: https://enviro.doe.gov.my/ (accessed on 25 November 2018).
  37. Enviro Knowledge Centre. Malaysia Environmental Quality Report 2014. Available online: https://enviro.doe.gov.my/ (accessed on 25 November 2018).
  38. Enviro Knowledge Centre. Malaysia Environmental Quality Report 2005. Available online: https://enviro.doe.gov.my/ (accessed on 25 November 2018).
  39. Abdullah, A.M.; Samah, M.A.A.; Jun, T.Y. An overview of the air pollution trend in Klang Valley, Malaysia. Open Environ. Sci. 2012, 6, 13–19. [Google Scholar] [CrossRef] [Green Version]
  40. Pigott, T.D. A review of methods for missing data. Educ. Res. Eval. 2001, 7, 353–383. [Google Scholar] [CrossRef] [Green Version]
  41. McKenna, J.E., Jr. An enhanced cluster analysis program with bootstrap significance testing for ecological community analysis. Environ. Model. Softw. 2003, 18, 205–220. [Google Scholar] [CrossRef]
  42. Ghrist, R. Barcodes: The persistent topology of data. Bull. Amer. Math. Soc. 2008, 45, 61–75. [Google Scholar] [CrossRef] [Green Version]
  43. Kerber, M.; Morozov, D.; Nigmetov, A. Geometry helps to compare persistence diagrams. J. Exp. Algorithmics 2017, 22, 1–4. [Google Scholar] [CrossRef] [Green Version]
  44. Zulkepli, N.F.S.; Noorani, M.S.M.; Razak, F.A.; Ismail, M.; Alias, M.A. Topological characterization of haze episodes using persistent homology. Aerosol Air Qual. Res. 2019, 19, 1614–1624. [Google Scholar] [CrossRef] [Green Version]
  45. Mittal, K.; Gupta, S. Topological characterization and early detection of bifurcations and chaos in complex systems using persistent homology. Chaos Interdiscip. J. Nonlinear Sci. 2017, 27, 051102. [Google Scholar] [CrossRef]
  46. R Core Team. R: A language and Environment for Statistical Computing. R Foundation for Statistical Computing. Available online: https://www.R-project.org/ (accessed on 25 January 2017).
  47. Fasy, B.T.; Kim, J.; Lecci, F.; Maria, C.; Rouvreau, V. Statistical Tools for Topological Data Analysis. 2017. Available online: https://cran.rproject.org/web/packages/TDA/TDA.pdf (accessed on 25 January 2017).
  48. Wong, C.L.; Venneker, R.; Uhlenbrook, S.; Jamil, A.B.M.; Zhou, Y. Variability of rainfall in Peninsular Malaysia. Hydrol. Earth Syst. Sci. Discuss. 2009, 6, 5471–5503. [Google Scholar] [CrossRef] [Green Version]
  49. Soleiman, A.; Othman, M.; Samah, A.A.; Sulaiman, N.M.; Radojevic, M. The occurrence of haze in Malaysia: A case study in an urban industrial area. Pure Appl. Geophys. 2003, 160, 221–238. [Google Scholar] [CrossRef]
  50. Saxena, A.; Prasad, M.; Gupta, A.; Bharill, N.; Patel, O.P.; Tiwari, A.; Er, M.J.; Ding, W.; Lin, C.T. A review of clustering techniques and developments. Neurocomputing 2017, 167, 664–681. [Google Scholar] [CrossRef] [Green Version]
Figure 1. Clusters formed from four distinct objects based on their topological features. (a) Cluster 1 consisting objects with one hole. (b) Cluster 2 consisting objects with two holes.
Sustainability 12 03985 g001
Figure 2. Map of the selected air quality monitoring stations (Klang, Petaling Jaya, and Shah Alam).
Sustainability 12 03985 g002
Figure 3. (a) Example data for hierarchical agglomerative clustering analysis (HACA) application. (b) Graph showing the position of the observations a, b, c, and d in (a).
Sustainability 12 03985 g003
Figure 4. (a) Dissimilarity distance calculated using example data. (b) A dendrogram showing clusters merged according to (a).
Sustainability 12 03985 g004
Figure 5. Low-dimensional ( 0 k 3 ) simplices and a simplical complex.
Sustainability 12 03985 g005
Figure 6. Simplicial complexes and topological features formations. (b) Topological features in (a) are displayed in a barcode. (c) A simpler representation of topological features displayed in a persistence diagram. Components are represented by black lines and black dots. Hole is represented by a red line and a red triangle.
Sustainability 12 03985 g006
Figure 7. The first, second, and third series ( T 1 , T 2 , and T 3 ) series (ac) and their respective persistence diagrams (df). Results of traditional HACA (g) and improved HACA (h).
Sustainability 12 03985 g007
Figure 8. Persistence diagrams for month with haze (a) and month without haze (b). Black dots represent components and red triangles represent holes.
Sustainability 12 03985 g008
Figure 9. Dendrograms for months in 2005, 2013, 2014, and 2015 for air quality monitoring station in Klang. Red, blue, and black squares represent months with severe, moderate, and no haze, respectively.
Sustainability 12 03985 g009
Figure 10. Dendrograms for months in 2005, 2013, 2014, and 2015 for the air quality monitoring station in Petaling Jaya. Red and black squares represent months with severe and no haze, respectively.
Sustainability 12 03985 g010
Figure 11. Dendrograms for months in 2005, 2013, 2014, and 2015 for air quality monitoring station in Shah Alam. Red and black squares represent months with severe and no haze, respectively.
Sustainability 12 03985 g011
Table 1. Descriptive statistics of the PM 10 ( μ g   m 3 ) data for months with severe haze.
MonthStatisticStation
KlangPetaling JayaShah Alam
Aug-05Max590482587
Min364326
Mean140119115
Jun-13Max581370362
Min362021
Mean1228483
Mar-14Max448303279
Min473336
Mean1389595
Sep-15Max337295301
Min594949
Mean141123135
Oct-15Max326320346
Min522442
Mean159126147