Abstract
Water scarcity has seriously threatened the sustainable development of Zhangjiakou City, an arid agricultural area in North China, and the ecological security of its neighboring areas. In this study, a system dynamics model is established based on variable sensitivity analysis and is employed to simulate water demand (2015–2035) in four designed alternative development scenarios in Zhangjiakou City. The results show that: (1) the variables related to irrigation farmland are the main driving factors of water demand, especially the area and water use quota. (2) The total water demand will rise continually in the current development scenario and economic priority scenario, and the proportion of agricultural water demand will drop to 67% and 63%, respectively. It will decline continually in the water-saving priority scenario and balanced development scenario, and the proportion of agricultural water demand will drop to 56% and 57%, respectively. (3) Water consumption per ten thousand yuan of GDP will fall to around 20 m3 in 2035 in each scenario, indicating that the reduction of water demand only by slowing down economic growth cannot improve the efficiency of water use. The research results will be beneficial to extract feasible strategies and policies for balancing economic development and water conservation.
1. Introduction
The relationships between human and natural systems are bi-directional [1]. The impact of human activities on natural systems is changing the way we view and manage the earth’s resources [2,3]. With the challenges of population expansion, rapid urbanization, and climate change, water resources, as irreplaceable resources for human-nature systems, are becoming increasingly scarce [4]. This will not only significantly affect regional sustainable development but also poses a serious threat to the well-being of future generations [5,6,7]. The contradiction between water supply and water demand has become a global challenge facing human beings for a long time and will continue to be so in the future—especially in developing countries and regions with large population sizes and dry climates [8].
The research on water resources can be roughly summarized into two categories [9]: surface and ground hydrology, and sustainable utilization of water resources [10,11,12]. First, studies of surface water and groundwater are mostly related to climate change, overexploitation of groundwater, and the impact of water supply projects on the hydrological environment. Hagemann, et al. [13] studied the Colorado River basin using a model of multiple global climate-hydrological and found that climate change was not the only factor affecting the hydrological cycle. Hashemy Shahdany, et al. [14], taking the Zayandeh-Rud River basin in Iran as a case, discussed the effect of improving operational performance in irrigation canals to overcome groundwater overexploitation. Zhang [15] evaluated the environmental impactions of the South-to-North Water Diversion Project and concluded that it is necessary for the Chinese government to establish a long-term environmental monitoring network. Second, the evaluation methods of sustainable use of water resources mainly include water poverty index (WPI), water stress index (WSI), and water resources carrying capacity (WRCC). WPI, first used by Sullivan [16], is measured using five components “resources”, “access”, “capacity”, “use”, and “environment”. It has been widely used as a holistic tool to assess water resources available at different scales from countries [17,18,19] to districts and basins [20,21]. WSI can be used to assess the extent of water scarcity faced by the region’s society, economy, and environment systems. Utilizing this tool, Han and Ruan [22] selected nine indicators from these three systems and conducted a comparative analysis of the water resources pressure in 31 administrative regions of mainland China. WRCC refers to the maximum human activity level that available water resources can support without causing ecological and environmental degradation while maintaining an adequate standard of living [23]. A number of studies have been carried out in this aspect, especially in areas where there is a negative gap between water supply and water demand [24,25,26].
In recent years, the interaction of social, environmental, and water systems has become more intense and complex due to the explosive water demand [5,27,28,29]. In this context, to better understand the dynamic relationships of the coupled human-environmental system, the system dynamics (SD) model is becoming more and more popular in water resources planning and management as many other models based on linear causality cannot provide the mental and structural framework to solve complex problems in multiple systems [30,31,32]. SD was initially proposed by Forrester [33] for simulating industrial and urban dynamics. It not only enables users to understand the extent to which each variable affects the system and subsystem but also has the ability to capture the interaction of various model components [34]. According to Zomorodian, Lai, Homayounfar, Ibrahim, Fatemi, and El-Shafie [34], the application of SD in water resources mainly falls into two categories: predictive simulation models and descriptive integrated models. The former focuses on the water resources system itself but lacks mutual feedback from economic, ecological, and social subsystems [35,36,37]. The latter focuses on the impact of factors from various subsystems on the water supply and demand systems, such as climate change, urbanization, economic development, and population growth [13,38,39].
There has been a body of studies on the SD model in water resources simulation at various scales, from regional [6,40,41,42,43,44] to national and global [9,30,45]. However, most of the studies have not been closely integrated with the policies and plans of local governments, resulting in poor feasibility of the research results and weak guidance for local sustainable development practices. Therefore, Zhangjiakou, a city with extremely scarce water resources, was selected as the case area in this study to make up this gap.
Zhangjiakou City has less than 400 m3 of water per capita per year, which has not only severely constrained the economic development but also threatened regional ecological security, due to it is the geo-ecological barrier and water sources for the capital Beijing. In 2017, it was identified as “the water conservation function zone and ecological environment support zone of the capital city (two zones)” by the central government of China. In 2019, the Chinese government further formulated a medium-term plan for the development of Zhangjiakou City (2019–2035), referred to as the “Two Zones Planning”, which placed strict and specific restrictions on water consumption and water use efficiency in various sectors, including agriculture, industry, and households. Moreover, the 2022 Winter Olympic Games will be jointly held in Beijing and Zhangjiakou, making the task of water-saving and water efficiency improvement more important and urgent for the local policymakers. Therefore, the research objectives of this study are as follows: (1) Identify and analyze the impact of different factors on the water demand of Zhangjiakou City. (2) Establish a system dynamics model to simulate the water demand of various departments in Zhangjiakou City from 2020 to 2035 under the four development scenarios. (3) Estimate the pressure on water resources under the four development scenarios. The research results are expected to provide specific and feasible guidance for the implementation of the “Two Zones Planning”, and to contribute to the sustainable use of water resources in Zhangjiakou City and its surrounding areas. In addition, the research also aims to increase researchers’ awareness of integrating with local development policies when simulating water demand, thereby enhancing the practicality of the research results.
2. Study Area and Data Sources
2.1. Study Area
Shown in Figure 1, Zhangjiakou is a prefecture-level city in northwestern Hebei province, China, with a population of 4.69 million on 36,862 km2, divided into 16 counties (districts), and twelve of them are poverty-stricken areas, with a poverty population of 113,700, accounting for 28.5% of Hebei province. In 2015, the city’s gross domestic product (GDP) was 135.85 billion yuan, ranking the eighth of eleven cities in Hebei Province, and the per capita GDP was 23.6% lower than the provincial average level.
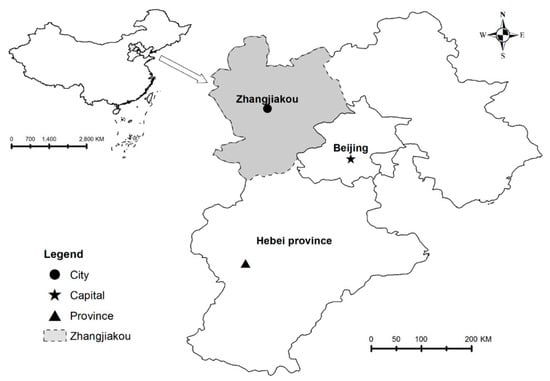
Figure 1.
The location of Zhangjiakou City.
It is also an arid and semiarid region with an average annual precipitation of only 409 mm, while the annual average evaporation is as high as 1315 mm. The per capita water resources are about 350 m3, less than one-fifth of the national level, making it one of the most severe water scarcity cities in China, which is seriously threatening regional sustainable development. In addition, in terms of wind and water, Zhangjiakou City is located upstream of the capital Beijing. More than 50% water of the Miyun Reservoir (the drinking water source) and more than 90% water of the Guanting Reservoir (former drinking water source) in Beijing come from the Chaobai River and Yongding River. The upstream of these two rivers is in Zhangjiakou City. That is, the area of about 25,000 km2 located in Zhangjiakou and Beijing is considered a complete ecological unit, sharing groundwater, surface water, and atmospheric circulation, which cannot be divided by administrative divisions. Therefore, the ecological environment protection of Zhangjiakou City, especially water conservation, is also crucial to the sustainable development of Beijing.
In 2015, the city’s total water consumption was 938 million m3, of which agricultural water was 703 million m3, accounting for 75%, which is 10% higher than the national average level. In the meantime, irrigation farmland increased by 50,167 ha from 2005 to 2015, with an increase of 28%, resulting in a rising demand for agricultural water, which is inconsistent with the urgent need for water-saving. The irrigation water use of different farmland in 2015 can be seen in Table 1. It is obvious that irrigated land used the most water, accounting for 53% of the total water consumption in Zhangjiakou City.

Table 1.
Irrigation water use of Zhangjiakou City in 2015.
2.2. Data Sources
The basic socio-economic data mainly come from the Zhangjiakou Economic Yearbooks (2006–2016) [46], including urban and rural populations, output values of various sectors, and so on. Water resources, irrigation farmland, and livestock are collected from the Water Resources Bulletins (2005–2016) [47], including water supply, water consumption and water efficiency in various sectors, and the areas of different irrigation land. In addition, the data required for the simulation phase (2015–2035), except the initial values same as 2015, such as urbanization rates, economic development rates, and water quotas for various departments involved in the model, are set according to government reports, “Two Zones Planning” and local standards “Norm of water intake (2016)” of Hebei Province.
3. Methodology
3.1. System Dynamics Simulation
The SD model consists of four types of variables: state variables, rate variables, auxiliary variables and constants, and a series of equations reflecting the relationship between these variables. As shown in Figure 2, the simulation process can be summarized as five steps: (1) determine the research objective; (2) establish the model, determine the system boundary and the causal relationship between the variables; (3) model validation, qualitative and quantitative test; (4) scenario simulation, determine the control variables (sensitivity analysis) and set different development scenarios; (5) analysis of results.
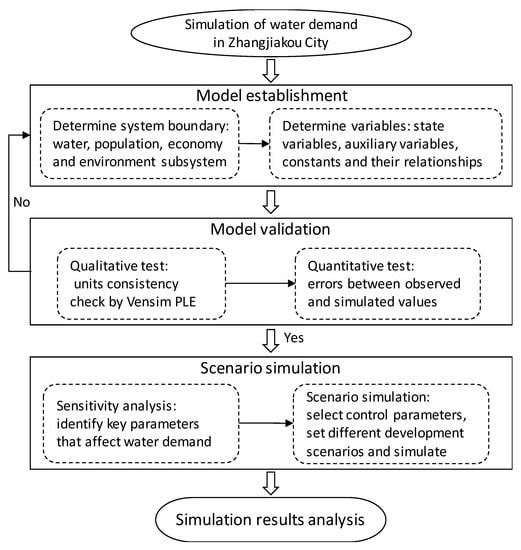
Figure 2.
The modeling process of system dynamics.
3.2. Zhangjiakou System Dynamics Model
3.2.1. Water Use Structure
The water cycle usually consists of water supply, water use, as well as wastewater treatment and reuse. Figure 3 simply shows the causal relationship between them in Zhangjiakou City. Water resources include local water and inbound water, while the available water resources need to be reduced by outbound water and environmental flows. Environmental flow refers to the amount of water that is necessary to maintain the ecological and environmental services of rivers and lakes. In this study, it is estimated by introducing the environmental flow coefficient based on relevant statistical data from previous years, that is, what percentage of the total water needs to be reserved for the river’s own ecological environment. The environmental flow coefficient is set to 0.20 for the extremely wet year, 0.25 for the average climatic year, and 0.30 for the extremely wet year, as shown in Table S1. Water use mainly includes five sectors from the three subsystems of population, economy, and ecological environment, that is, domestic, agriculture, industry, urban public, and eco-environment. Finally, some of the wastewater from the population and economic subsystems can be reused after treatment. All of these components are dynamically interrelated with each other.
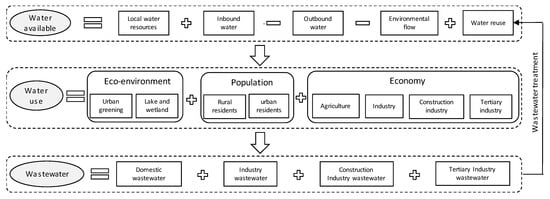
Figure 3.
Relationships of water resource subsystem and other subsystems in Zhangjiakou City.
3.2.2. Establishment of Model
Based on the development status and “Two Zones Planning”, Vensim-PLE, a classical software of system dynamics, is used to establish the simulation model of water demand in Zhangjiakou City (abbreviated as ZSD), as shown in Figure 4. The simulation is from 2005 to 2035, and the modeling time step is 1 year, where the strategic planning time is from 2015–2035. It consists of four subsystems: population, economic, agriculture (irrigation land, forestry and animal husbandry) and water (water supply, water demand, and water pollution and reuse), including 8 status variables, 7 rate variables, 39 auxiliary variables, 8 table functions (lookup) and 30 constants, as well as 54 equations. The variables and their relationships can be found in Table S1.
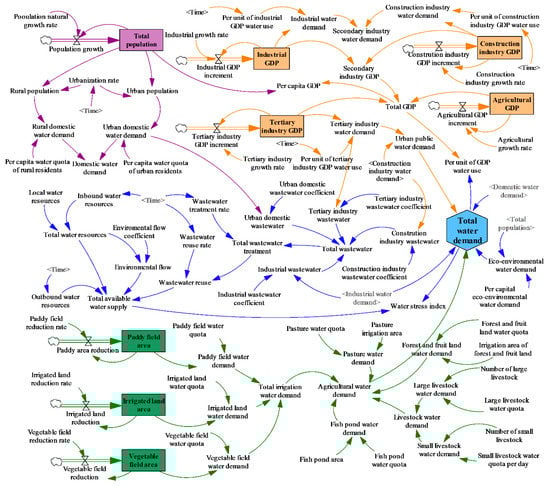
Figure 4.
System dynamics model of Zhangjiakou City.
3.3. Model Evaluation and Sensitive Factors Identification
3.3.1. Model Evaluation
In this study, the absolute relative error (ARE) is employed for model performance validation.
where Ri and Si represent the observed value and the simulated value of variable i, respectively.
3.3.2. Sensitive Factors Identification
In order to identify which variables (constants) in the ZSD model have greater impacts on the water demand, we use the “univariate” method in the sensitivity analysis function of Vensim DSS, that is, the value of each variable is changed independently, while the values of others are held constant. Sensitivity analysis not only helps us to select key variables for scenario setting scientifically but also to improve the understanding of the relationships between input and output variables in the SD model, which will contribute to the formulation of policies [43].
3.4. Water Stress Index (WSI)
There have been many methods for regional water stress assessment. The ratio of water demand to water availability can be a relatively straightforward reflection of whether the amount of water resources is surplus or deficit. Therefore, it is used in this study to measure the pressure of water resources in different development scenarios. The formula is:
where TWD and TAW represent the total water demand and the total available water, respectively. When WSI is greater than 1, it means water resources are in a state of deficiency; when WSI is less than 1, it means water resources are in the surplus state; when WSI is equal to 1, it means water resources supply and demand are just balanced.
4. Results
4.1. Model Validation
In order to conduct the model validation, the water demand from 2005–2015 is simulated, with 2005 as the base year. Table 2 shows the absolute relative errors (AREs) between the simulated and observed values for 2010 and 2015. The AREs of most variables are within 10%, indicating that the ZSD model has a good performance to reflect the behavior of the simulated system. Here, the ARE of industrial GDP is greater than 10% in 2015, which is because the industrial GDP used in the Zhangjiakou Economic Yearbook (2016) is very likely a mistake. According to the annual government report, the industrial growth rate in 2015 was 4.2%, however, the industrial GDP in the Zhangjiakou Economic Yearbook (2016) was 44.17 billion yuan, even lower than 47.56 billion yuan in 2014. If this is adjusted according to the industrial growth rate in the government report, the industrial GDP in 2015 should be 49.56 billion yuan.
Table 2.
Absolute relative errors of the main variables between the simulated and observed values.
4.2. Sensitivity Analysis
Based on the ZSD model and other studies on water demand simulation [9,48,49], twelve constant variables that may have the largest impacts on the total water demand are selected, as shown in Figure 5. To identify the extent of the impacts, these 12 variables are further analyzed using the sensitivity analysis function in Vensim DSS. The initial value of each variable is the same as the observed value in 2015, and its value range is determined through historical data and relevant plannings (especially the “Two Zones planning”). The results are shown in Figure 5, where yellow, green, blue, and gray represent confidence intervals of 0–50%, 50–75%, 75–95%, and 95–100%, respectively. The greater the bandwidth in the graph, the more sensitive the total water demand is to the variables.
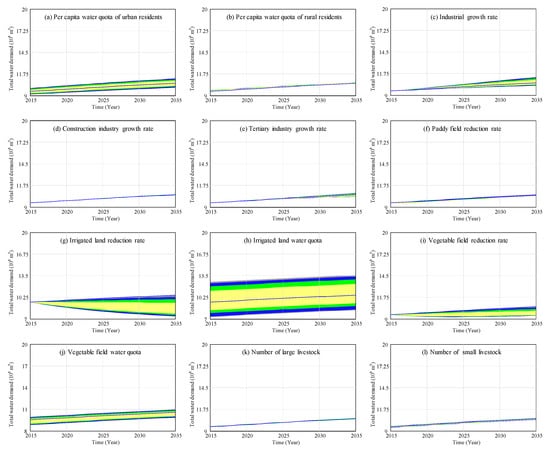
Figure 5.
Sensitivity analysis for twelve constant variables.
It is obvious that these variables have very different impacts on total water demand, which can be divided into four categories:
(1) Per capita water quota. The urbanization rate of Zhangjiakou City was 52% in 2015, and the proportion of the urban population will further increase as the urbanization process continues. In addition, the per capita water quota for urban residents is 50–140 m3/day, while it is only 40–60 m3/day for rural residents. Therefore, the total water demand is more sensitive to the per capita water quota of urban residents than to that of rural residents.
(2) GDP growth rate. The sensitivities of total water demand to the growth rate of GDP of different sectors from large to small are industry, tertiary industry, and construction. There are two main reasons: First, the output values are significantly different, and the output value of the construction industry is much smaller than that of the industrial and tertiary industry. Second, the water consumption per unit of industrial output value is 12–23 m3 per 10,000 yuan, while it is less than 3 m3 per 10,000 yuan for the tertiary industry and construction industry.
(3) Irrigation area and water quota. Although the irrigated land and the vegetable field have the same ranges of water quota, both are 1500–4500 m3/ha, and the irrigated land area reduction rate range (−0.05, 0) is smaller than the vegetable field area reduction rate range (−0.1, 0), but the total water demand is more sensitive to the area reduction rate and water quota of irrigated land than to those of the vegetable field. This is because the area of irrigated land is much larger than that of the vegetable field. In 2015, the area of irrigated land was 4.8 times that of vegetable fields.
(4) The number of livestock. The proportion of livestock water consumption is relatively small, which was only 3.4% in 2015, so the total water demand is less sensitive to the number of livestock, whether it is large livestock or small livestock.
In general, irrigated land has the greatest impact on total water demand due to the large amount of water use of irrigated land, which was 497 million m3 in 2015, accounting for 53%, resulting in the total demand for water resources being most sensitive to the two variables related to it.
4.3. Scenarios Simulation
4.3.1. Scenarios Setting
In line with the planning period of the two districts of Zhangjiakou City, the simulation time of water demand is 2015–2035, with 2015 as the base year. For most variables, the initial values are derived from the Economic Yearbooks and the Water Resources Bulletins, and for the rest of the variables, they are set based on historical data or reference to relevant government plans, as shown in Table S1.
Based on the sensitivity analysis, the 15 variables shown in Table 3 are selected as control variables to set four development scenarios: current development scenario (CDS), economic priority scenario (EPS), water-saving priority scenario (WPS), and balanced development scenarios (BDS). The main characteristics of each scenario are as follows: (1) In CDS, except for the urbanization rate and industrial GDP water quota, the other variables are consistent with 2015. (2) In EPS, the economic growth rates are higher than the CDS. Moreover, due to the current low per capita water use and inadequate irrigation of farmland, the per capita water quota and the water quota for all types of irrigated farmland are also set higher than the current situation. (3) In WPS, the economic growth rates and urbanization rates are lower than CDS, and the areas of the three types of irrigated farmland are rapidly reduced. (4) In BDS, the economic growth rates are between EPS and WPS, and the reduction rates of the three types of irrigated farmland are lower than WPS. The values of these 15 variables in each scenario are shown in Table 3.
Table 3.
Values of control variables in four development scenarios.
4.3.2. Simulation Results
(1) Population subsystem
With a natural population growth rate of 3.07‰, the total population of Zhangjiakou City will increase from 4.69 million in 2015 to 4.99 million in 2035. Meanwhile, the urbanization rate is also rising, resulting in domestic water use will increase in every scenario. Domestic water demands from large to small in 2035 are EPS (191 million m3), BDS (174 million m3), WPS (154 million m3), and CDS (143 million m3), as shown in Figure 6a. The gap in domestic water demand between urban and rural will further expand, and the ratio of them will increase from 2.0–2.4 in 2015 to 4.5–6.0 in 2035, as shown in Figure 6b.
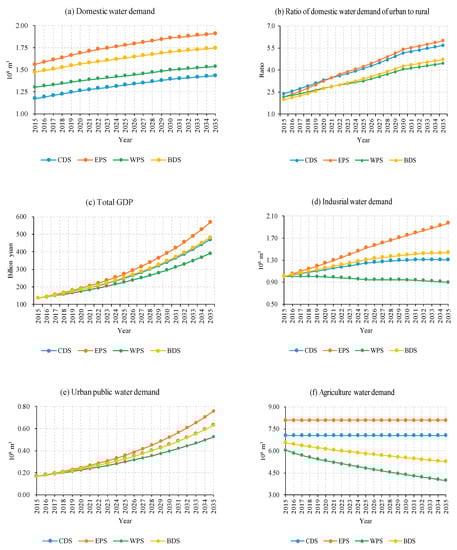
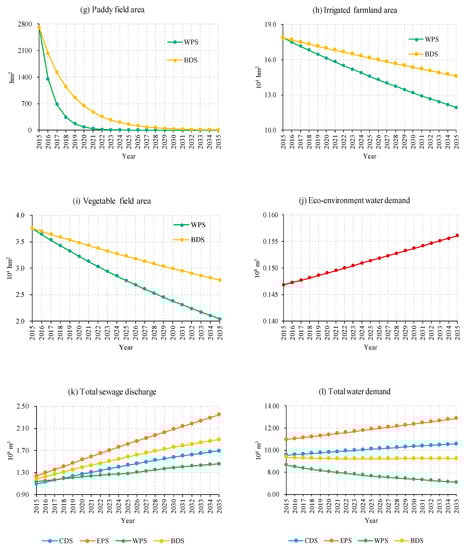
Figure 6.
The simulation results of four development scenarios.
(2) Economic subsystem
The growth rates of total GDP from high to low are EPS (7.4%), BDS (6.5%), CDS (6.4%) and WPS (5.4%), resulting the total GDP will reach 567 billion yuan, 482 billion yuan, 471 billion yuan, and 390 billion yuan, respectively, as shown in Figure 6c. The structure of contribution rates of primary, secondary and tertiary industries to GDP will change from 18%:40%:42% in 2015 to 10%:32%:58% (CDS, EPS, and WPS) and 10%:34%:56% (BDS) in 2035.
The industrial water demands from high to low are EPS (197 million m3), BDS (143 million m3), CDS (130 million m3), and WPS (90 million m3) in 2035, as shown in Figure 6d. It shows a declining trend only in WPS. The urban public water demands increase in each scenario, from high to low are EPS (76 million m3), BDS (63 million m3), CDS (63 million m3), and WPS (52 million m3) in 2035, as shown in Figure 6e.
(3) Agricultural subsystem
In CDS and EPS, agricultural water demands remain at 704 million m3 and 808 million m3, of which the proportions of farmland irrigation are 91.2% and 91.5%, respectively, as shown in Figure 6f.
In WPS, the area of paddy fields, irrigated land, and vegetable fields decreased at an average annual rate of 50%, 2%, and 3%, respectively, resulting in a reduction in agricultural water demand from 604 million m3 to 399 million m3, and the proportion of water demand for farmland irrigation will drop from 90.3% to 85.3%, as shown in Figure 6g–i.
In BDS, the paddy fields, irrigated land, and vegetable fields are reduced at an average annual rate of 25%, 1%, and 1.5%, respectively, while the number of livestock is increased to ensure that the GDP growth rate of the primary industry remains unchanged. At this time, the agricultural water demand will decrease from 656 million m3 to 527 million m3, and the proportion of water demand for farmland irrigation will drop from 90.0% to 87.7%.
(4) Ecological environment subsystem
Since the per capita ecological environment water demand is set to 3.13 m3 in the four scenarios, the ecological environment water demand increased from 14.7 million m3 to 15.6 million m3 with the increase of population in each scenario, as shown in Figure 6j.
The total amount of wastewater discharged is increasing in every scenario, from high to low are EPS (235 million m3), BDS (190 million m3), CDS (169 million m3), and WPS (146 million m3) in 2035, as shown in Figure 6k. The wastewater mainly comes from urban domestic water and industry sectors, and the proportion of them will drop from 93–94% to 83–85% with the change of GDP.
(5) Total water demand
As displayed in Figure 6l, in CDS and EPS, the total water demand will increase from 954 million m3 and 1097 million m3 to 1057 million m3 and 1288 million m3, and the proportion of agricultural water demand will drop to 67% and 63%, respectively.
In WPS and BDS, the total water demand will drop from 866 million m3 and 936 million m3 to 710 million m3 and 924 million m3, and the proportion of agricultural water demand will drop to 56% and 57%, respectively.
4.3.3. Water Stress Index
In the water supply subsystem, the amount of inbound water and outbound water from 2015 to 2035 are set according to the “Two Zones Planning” of Zhangjiakou City. The total water resources of the extremely wet year, the average climatic year, and the extremely dry year were set as the maximum value of 17.01, the average value of 14.51, and the lowest value of 11.42 from 2008 to 2016, respectively. In addition, due to the over-exploitation of water resources in Zhangjiakou City, from the perspective of sustainable development, the environmental flow coefficients of the extremely wet year, the average climatic year and the extremely dry year are set to 0.2, 0.25 and 0.3, respectively, which are slightly higher than the proportion of unused water in Zhangjiakou City for many years.
As shown in Figure 7, in general, the water stress indexes in the four scenarios from high to low are EPS, CDS, BDS, and WPS. In the extremely wet year, the water stress indexes of the four development scenarios are between 0.5 and 1, indicating the water resources are in the state of surplus. In the average climatic year, the water stress indexes of CDS and EPS will rise continually, and it is going to exceed 1 in CDS and is always greater than 1 in EPS. The water stress indexes in WPS and BDS are between 0.6 and 1.0 and will decline continually. In the extremely dry year, the water stress indexes of CDS, EPS, and BDS are always greater than 1, while it is less than 1 after 2019 in WPS.
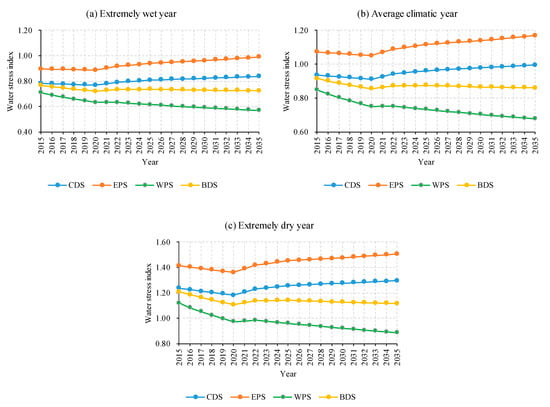
Figure 7.
Water stress index of four development scenarios.
5. Discussion
5.1. Comparison with the “Two Zones Planning”
The industrial growth rates of Zhangjiakou City in this study are set between 3.6–5.6%, slightly lower than 6% in the “Two Zones Planning” as it has been declining in recent years, from 5.9% in 2014 to 2% in 2017, making it very difficult to keep an average annual growth rate of 6% until 2035. Nevertheless, considering that the current GDP of Zhangjiakou City is lagging behind in eleven cities in Hebei Province and facing the requirements of economic growth, we still set the industrial growth rate higher than 2017.
In 2015, the industrial water quota of Zhangjiakou City was 22.8 m3, while the national average level was 58.3 m3, which means that Zhangjiakou City’s industrial water efficiency has been at the leading level in the country, even exceeding some developed countries. Therefore, the average annual rate of water consumption per ten thousand yuan industrial GDP in this study is set around 3%, which is lower than that of the “Two Zones Planning” (6%). In fact, in terms of industrial water conservation, the current focus should be on how to adjust the industrial layout and structure to mitigate the contradiction of the water resources distribution and industrial water demands.
The irrigated land is planned to reduce 64,667 ha (36.2%) by 2022 in the “Two Zones Planning”. The area of irrigated land, according to the sensitivity analysis, is indeed the biggest factor affecting the demand for water resources. However, the reduction rate of irrigated land should not be so fast because it is a very important factor to guarantee food security and residents’ income. Therefore, in this study, we make a modest adjustment of the reduction rate of irrigated land. The area of irrigated land will be reduced by 59,333 ha and 32,667 ha by 2035 in WPS and BDS, respectively.
In terms of water resources efficiency, the total GDP in the “Two Zones Planning” will increase from 136.35 billion yuan in 2015 to 407.50 billion yuan in 2035, resulting in a decrease in water consumption per ten thousand yuan GDP from 68.79 m3 in 2015 to 21.66 m3 in 2035. At the same time, the proportion of unused water resources will also drop from 41% in 2015 to 56% in 2035. Although it will indeed save water resources, will it cause a waste of water supply capacity? As shown in Figure 8, the water demand for per ten thousand yuan GDP in the four scenarios varied from 63 m3 to 80 m3 in 2015, and the difference will become smaller and smaller over time, reaching from 18 m3 to 23 m3 in 2035. This means no matter which scenario is chosen, the water demand per ten thousand yuan GDP will eventually fall to about 20 m3 in 2035 as the economy grows. If lower water demand is achieved only by slowing economic growth, the water resources efficiency will not be improved, and it may also result in the waste of water supply capacity. Therefore, Zhangjiakou City should choose a coordinated development model to balance economic development and water conservation.
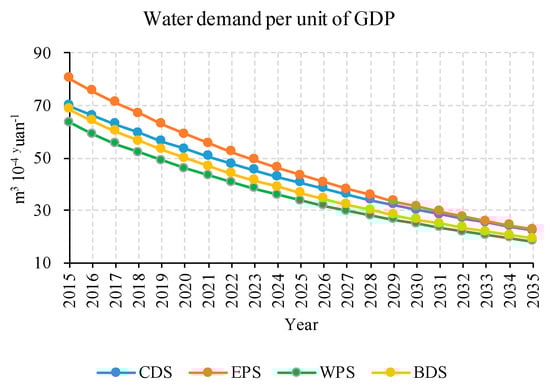
Figure 8.
Water demand per unit of GDP.
5.2. Policy Suggestions for Sustainable Water Use
In general, Zhangjiakou City should take the water resources carrying capacity as the primary consideration for regional economic development and ecological security. In order to promote the structural adjustment and optimization of water use, it is vital to carry out the assessment of the current status of water resources carrying capacity on county scale from the perspectives of total water use, water use efficiency, and water pollution. In the meantime, the management concept should shift from the water supply side to the water demand side, and from extensive water use to intensive water use.
Reduction of agricultural water use. According to the sensitivity analysis, the agricultural water-related indicators are most sensitive to the total water demand in Zhangjiakou City. That is to say, the agricultural sector has the largest water-saving potential. Therefore, there is a need to reduce the area of irrigated farmland. In this process, the correlation between the crop structure, food production, and agricultural income, as well as other factors must be considered to achieve maximum benefits. In addition, it is also essential to strictly control the planting area of high-water-consumption crops, vigorously promote water-saving renovation, and develop high-efficiency water-saving irrigation measures, such as large-scale sprinkler irrigation, micro-irrigation, and high-standard pipe irrigation.
Targeted control of industrial water use. On the one hand, it is crucial to strictly limit the entry of high-water-consuming industries and enterprises, and focus on the promotion of water-saving technologies in high-water-consuming industries such as thermal power, building materials, and food, to ensure the continuous decrease of the total industrial water consumption. On the other hand, comprehensive strategies should be adopted in future water management, such as industrial transformation and upgrading, optimization of industrial layout, upgrading of water-saving technology, and strengthen long-term water consumption planning and quota management.
Urban public and ecological water conservation. First, the water-saving technological transformation of key water use sectors should be accelerated, such as schools, hospitals, hotels, restaurants, car washes, and ski resorts. Second, the government needs to actively promote the construction of recycled water utilization projects. For example, the water recycling systems should be set up in new communities and give priority to the use of recycled water and rainwater in urban greening, municipal environmental sanitation, and ecological landscapes. In addition, it is also important to optimize the layout of urban pipeline networks, replace severely aged water supply pipeline facilities, and reduce water leakage during water supply.
5.3. Limitations of This Study
Although the system dynamics model is well-known for its nonlinear simulation, this feature is primarily reflected in the relationship between different subsystems. In most studies, only the flow variables can change the stock variables. For example, industrial GDP can only be influenced by the growth rate of industrial GDP in ZSD, and the value of the growth rate of industry GDP has to be set to a constant, making it becomes a linear simulation process. This is actually impossible in reality, especially in the case of a long simulation period with a lot of uncertainties. In addition, since the agriculture GDP is closely related to the area of the irrigated farmland, in theory, they should be linked in the system dynamics model, but we failed to achieve it due to lack of data, as agriculture consists of crop farming, forestry, and animal husbandry, and there are both irrigation farmland and rain-fed farmland in crop farming, and the areas of various crops are changing every year. It is very difficult to find data that can support us in obtaining contribution rates of different types of irrigation farmland to the agriculture GDP and the inherent relationship between them. Therefore, the changes in irrigation farmland areas are not linked to the agriculture GDP as in other studies [31,34]. Despite these drawbacks, however, the simulation results can still reflect the water demand relatively accurately in different development scenarios and provide a practical guide to the policymakers.
6. Conclusions
In this study, a complex system dynamics model (ZSD) reflecting the relationships between the water resources subsystem and other subsystems in Zhangjiakou City, such as population, economy, and environment subsystem, is established by using Vensim PLE, a system dynamics software. Then the ZSD model is employed to simulate water demand (2015–2035) in four designed alternative development scenarios. The main conclusions are as follows:
(1) According to the sensitivity analysis, the variables related to irrigation farmland are the main driving factors of water demand, especially the area and the average water consumption of irrigated land. Therefore, reducing the area of irrigated farmland and improving the efficiency of agricultural irrigation water will be the main direction of water-saving in Zhangjiakou City. However, it is vital to consider various factors to decide at what degree to reduce the area of irrigation farmland, such as agricultural output value and farmers’ income.
(2) The total water demand will rise continually in CDS and EPS, and the proportion of agricultural water demand will drop to 67% and 63%, respectively. Meanwhile, it will decline continually in WPS and BDS, and the proportion of agricultural water demand will drop to 56% and 57%, respectively.
(3) In the extremely wet year, the water stress indexes of the four scenarios are between 0.5 and 1.0, which means that water resources are sufficient. In the average climatic year, the water stress indexes will rise continually in CDS and EPS, and it is always greater than 1.0 in EPS, while the water stress indexes will decline continually in WPS and the BDS, changing between 0.6 and 1.0. In the extremely dry year, the water stress indexes are only less than 1.0 in WPS after 2019.
(4) Regardless of which development model is chosen, the water demand for per ten thousand yuan GDP will eventually fall to around 20 m3 in 2035. Therefore, reducing water demand only by slowing down economic growth cannot improve the efficiency of water use, and even results in inefficiency of water supply capacity.
Supplementary Materials
The following are available online at https://www.mdpi.com/2071-1050/12/10/3996/s1, Table S1: Variables and equations in the ZSD model.
Author Contributions
This manuscript is the result of the research of W.M. under the supervision of D.Y. and C.O., and the advising of L.M. and F.W. All authors designed the study, developed the methodology, discussed the results and W.M. wrote the paper. All authors have read and agreed to the published version of the manuscript.
Funding
This research was funded by the National Major Science and Technology Program for Water Pollution Control and Treatment [grant number 2017ZX07101001], the National Natural Science Foundation of China [grant number 41690142, 41601600], the Fundamental Research Funds for the Central Universities [grant number SWU019047], and the China Scholarship Council [grant number 201704910850].
Acknowledgments
We sincerely appreciate the editors and anonymous reviewers for their efforts and insightful comments towards improving this manuscript.
Conflicts of Interest
The authors declare no conflict of interest.
References
- Srinivasan, V.; Seto, K.C.; Emerson, R.; Gorelick, S.M. The impact of urbanization on water vulnerability: A coupled human–environment system approach for Chennai, India. Glob. Environ. Chang. 2013, 23, 229–239. [Google Scholar] [CrossRef]
- Winz, I.; Brierley, G.; Trowsdale, S. The Use of System Dynamics Simulation in Water Resources Management. Water Resour. Manag. 2008, 23, 1301–1323. [Google Scholar] [CrossRef]
- Yang, D.; Gao, X.; Xu, L.; Guo, Q. Constraint-adaptation challenges and resilience transitions of the industry–environmental system in a resource-dependent city. Resour. Conserv. Recycl. 2018, 134, 196–205. [Google Scholar] [CrossRef]
- Jiang, Y. China’s water security: Current status, emerging challenges and future prospects. Environ. Sci. Policy 2015, 54, 106–125. [Google Scholar] [CrossRef]
- Brown, C.M.; Lund, J.R.; Cai, X.; Reed, P.M.; Zagona, E.A.; Ostfeld, A.; Hall, J.; Characklis, G.W.; Yu, W.; Brekke, L. The future of water resources systems analysis: Toward a scientific framework for sustainable water management. Water Resour. Res. 2015, 51, 6110–6124. [Google Scholar] [CrossRef]
- Kotir, J.H.; Smith, C.; Brown, G.; Marshall, N.; Johnstone, R. A system dynamics simulation model for sustainable water resources management and agricultural development in the Volta River Basin, Ghana. Sci. Total Environ. 2016, 573, 444–457. [Google Scholar] [CrossRef] [PubMed]
- Yang, D.; Cai, J.; Hull, V.; Wang, K.; Tsang, Y.P.; Liu, J. New road for telecoupling global prosperity and ecological sustainability. Ecosyst. Health Sustain. 2017, 2. [Google Scholar] [CrossRef]
- Zhang, P.; Zou, Z.; Liu, G.; Feng, C.; Liang, S.; Xu, M. Socioeconomic drivers of water use in China during 2002–2017. Resour. Conserv. Recycl. 2020, 154. [Google Scholar] [CrossRef]
- Sun, Y.; Liu, N.; Shang, J.; Zhang, J. Sustainable utilization of water resources in China: A system dynamics model. J. Clean. Prod. 2017, 142, 613–625. [Google Scholar] [CrossRef]
- Döll, P.; Fiedler, K. Global-scale modeling of groundwater recharge. Hydrol. Earth Syst. Sci. 2008, 12, 863–885. [Google Scholar] [CrossRef]
- David, R.B.; Tobin, G.A. Understanding water policy sustainability: A case study in San Francisco and San Jose California. Environ. Sci. Policy 2017, 78, 167–172. [Google Scholar] [CrossRef]
- Larson, K.L.; White, D.D.; Gober, P.; Harlan, S.; Wutich, A. Divergent perspectives on water resource sustainability in a public–policy–science context. Environ. Sci. Policy 2009, 12, 1012–1023. [Google Scholar] [CrossRef]
- Hagemann, S.; Chen, C.; Clark, D.B.; Folwell, S.; Gosling, S.N.; Haddeland, I.; Hanasaki, N.; Heinke, J.; Ludwig, F.; Voss, F.; et al. Climate change impact on available water resources obtained using multiple global climate and hydrology models. Earth Syst. Dyn. 2013, 4, 129–144. [Google Scholar] [CrossRef]
- Shahadany, S.H.; Firoozfar, A.; Maestre, J.M.; Mallakpour, I.; Taghvaeian, S.; Karimi, P. Operational performance improvements in irrigation canals to overcome groundwaterr overexploitation. Agric. Water Manag. 2018, 204, 234–246. [Google Scholar] [CrossRef]
- Zhang, Q. The South-to-North Water Transfer Project of China: Environmental Implications and Monitoring Strategy. JAWRA J. Am. Water Resour. Assoc. 2009, 45, 1238–1247. [Google Scholar] [CrossRef]
- Sullivan, C. Calculating a water poverty index. World Dev. 2002, 30, 1195–1210. [Google Scholar] [CrossRef]
- Jemmali, H. Water Poverty in Africa: A Review and Synthesis of Issues, Potentials, and Policy Implications. Soc. Indic. Res. 2018, 136, 335–358. [Google Scholar] [CrossRef]
- Jemmali, H.; Matoussi, M.S. A multidimensional analysis of water poverty at local scale: Application of improved water poverty index for Tunisia. Water Policy 2013, 15, 98–115. [Google Scholar] [CrossRef]
- Jemmali, H.; Sullivan, C.A. Multidimensional Analysis of Water Poverty in MENA Region: An Empirical Comparison with Physical Indicators. Soc. Indic. Res. 2014, 115, 253–277. [Google Scholar] [CrossRef]
- Manandhar, S.; Pandey, V.P.; Kazama, F. Application of Water Poverty Index (WPI) in Nepalese Context: A Case Study of Kali Gandaki River Basin (KGRB). Water Resour. Manag. 2012, 26, 89–107. [Google Scholar] [CrossRef]
- Van Ty, T.; Sunada, K.; Ichikawa, Y.; Oishi, S. Evaluation of the state of water resources using Modified Water Poverty Index: A case study in the Srepok River basin, Vietnam—Cambodia. Int. J. River Basin Manag. 2010, 8, 305–317. [Google Scholar] [CrossRef]
- Han, Y.P.; Ruan, B.Q. Study on Water Resources Pressure of Regional Development in China. J. Sichuan Teach. Coll. Nat. Sci. 2002, 23, 219–224. [Google Scholar] [CrossRef]
- Naimi Ait-Aoudia, M.; Berezowska-Azzag, E. Water resources carrying capacity assessment: The case of Algeria’s capital city. Habitat Int. 2016, 58, 51–58. [Google Scholar] [CrossRef]
- Ren, C.; Guo, P.; Li, M.; Li, R. An innovative method for water resources carrying capacity research--Metabolic theory of regional water resources. J. Environ. Manag. 2016, 167, 139–146. [Google Scholar] [CrossRef]
- Yang, J.F.; Lei, K.; Khu, S.; Meng, W. Assessment of Water Resources Carrying Capacity for Sustainable Development Based on a System Dynamics Model: A Case Study of Tieling City, China. Water Resour. Manag. 2015, 29, 885–899. [Google Scholar] [CrossRef]
- Li, N.; Yang, H.; Wang, L.C.; Huang, X.J.; Zeng, C.F.; Wu, H.; Ma, X.X.; Song, X.T.; Wei, Y.N. Optimization of industry structure based on water environmental carrying capacity under uncertainty of the Huai River Basin within Shandong Province, China. J. Clean. Prod. 2016, 112, 4594–4604. [Google Scholar] [CrossRef]
- Choi, S.; Lee, S.O.; Park, J. A comprehensive index for stream depletion in coupled human-water systems. J. Hydro-Environ. Res. 2017, 16, 58–70. [Google Scholar] [CrossRef]
- Blair, P.; Buytaert, W. Socio-hydrological modelling: A review asking “why, what and how?”. Hydrol. Earth Syst. Sci. 2016, 20, 443–478. [Google Scholar] [CrossRef]
- Ghodsvali, M.; Krishnamurthy, S.; de Vries, B. Review of transdisciplinary approaches to food-water-energy nexus: A guide towards sustainable development. Environ. Sci. Policy 2019, 101, 266–278. [Google Scholar] [CrossRef]
- Duran-Encalada, J.A.; Paucar-Caceres, A.; Bandala, E.R.; Wright, G.H. The impact of global climate change on water quantity and quality: A system dynamics approach to the US–Mexican transborder region. Eur. J. Oper. Res. 2017, 256, 567–581. [Google Scholar] [CrossRef]
- Fang, C.; Cui, X.; Li, G.; Bao, C.; Wang, Z.; Ma, H.; Sun, S.; Liu, H.; Luo, K.; Ren, Y. Modeling regional sustainable development scenarios using the Urbanization and Eco-environment Coupler: Case study of Beijing-Tianjin-Hebei urban agglomeration, China. Sci. Total Environ. 2019, 689, 820–830. [Google Scholar] [CrossRef]
- Ghashghaie, M.; Marofi, S.; Marofi, H. Using System Dynamics Method to Determine the Effect of Water Demand Priorities on Downstream Flow. Water Resour. Manag. 2014, 28, 5055–5072. [Google Scholar] [CrossRef]
- Forrester, J.W. Industrial Dynamics: A major breakthrough for decision makers. Harv. Bus. Rev. 1958, 36, 37–66. [Google Scholar]
- Zomorodian, M.; Lai, S.H.; Homayounfar, M.; Ibrahim, S.; Fatemi, S.E.; El-Shafie, A. The state-of-the-art system dynamics application in integrated water resources modeling. J. Environ. Manag. 2018, 227, 294–304. [Google Scholar] [CrossRef] [PubMed]
- Teegavarapu, R.S.V.; Simonovic, S.P. Simulation of Multiple Hydropower Reservoir Operations Using System Dynamics Approach. Water Resour. Manag. 2014, 28, 1937–1958. [Google Scholar] [CrossRef]
- Safavi, H.R.; Darzi, F.; Mariño, M.A. Simulation-Optimization Modeling of Conjunctive Use of Surface Water and Groundwater. Water Resour. Manag. 2009, 24, 1965–1988. [Google Scholar] [CrossRef]
- Hoekema, D.J.; Sridhar, V. A System Dynamics Model for Conjunctive Management of Water Resources in the Snake River Basin. JAWRA J. Am. Water Resour. Assoc. 2013, 49, 1327–1350. [Google Scholar] [CrossRef]
- Qi, C.; Chang, N.B. System dynamics modeling for municipal water demand estimation in an urban region under uncertain economic impacts. J. Environ. Manag. 2011, 92, 1628–1641. [Google Scholar] [CrossRef]
- Gao, W.; Hong, B.; Swaney, D.P.; Howarth, R.W.; Guo, H. A system dynamics model for managing regional N inputs from human activities. Ecol. Model. 2016, 322, 82–91. [Google Scholar] [CrossRef]
- Jeong, H.; Adamowski, J. A system dynamics based socio-hydrological model for agricultural wastewater reuse at the watershed scale. Agric. Water Manag. 2016, 171, 89–107. [Google Scholar] [CrossRef]
- Liu, H.; Benoit, G.; Liu, T.; Liu, Y.; Guo, H. An integrated system dynamics model developed for managing lake water quality at the watershed scale. J. Environ. Manag. 2015, 155, 11–23. [Google Scholar] [CrossRef]
- Sahin, O.; Stewart, R.A.; Porter, M.G. Water security through scarcity pricing and reverse osmosis: A system dynamics approach. J. Clean. Prod. 2015, 88, 160–171. [Google Scholar] [CrossRef]
- Susnik, J.; Vamvakeridou-Lyroudia, L.S.; Savic, D.A.; Kapelan, Z. Integrated System Dynamics Modelling for water scarcity assessment: Case study of the Kairouan region. Sci. Total Environ. 2012, 440, 290–306. [Google Scholar] [CrossRef]
- Wei, T.; Lou, I.; Yang, Z.; Li, Y. A system dynamics urban water management model for Macau, China. J. Environ. Sci. 2016, 50, 117–126. [Google Scholar] [CrossRef]
- Kelly, C.; Onat, N.C.; Tatari, O. Water and carbon footprint reduction potential of renewable energy in the United States: A policy analysis using system dynamics. J. Clean. Prod. 2019, 228, 910–926. [Google Scholar] [CrossRef]
- The People’s Government of Zhangjiakou City. Zhangjiakou Economic Year Book; China Statistics Press: Beijing, China, 2006–2016. [Google Scholar]
- Zhangjiakou Water Resource Bureau. Zhangjiakou Water Resource Bulletin; Zhangjiakou Water Resource Bureau: Zhangjiakou, China, 2006–2016. [Google Scholar]
- Li, T.; Yang, S.; Tan, M. Simulation and optimization of water supply and demand balance in Shenzhen: A system dynamics approach. J. Clean. Prod. 2019, 207, 882–893. [Google Scholar] [CrossRef]
- Wei, S.; Yang, H.; Song, J.; Abbaspour, K.C.; Xu, Z. System dynamics simulation model for assessing socio-economic impacts of different levels of environmental flow allocation in the Weihe River Basin, China. Eur. J. Oper. Res. 2012, 221, 248–262. [Google Scholar] [CrossRef]


© 2020 by the authors. Licensee MDPI, Basel, Switzerland. This article is an open access article distributed under the terms and conditions of the Creative Commons Attribution (CC BY) license (http://creativecommons.org/licenses/by/4.0/).