Abstract
Alleviating poverty is a critical problem in many developing countries such as China. In this paper, we consider a poverty-alleviation supply chain composed of one supplier in a poor area and one producer helping the supplier reduce poverty by fulfilling Corporate Social Responsibility (CSR). Our work aims at examining the impacts of government subsidies and Corporate Social Responsibility (CSR) on the poverty-alleviation operations. Four game-theoretic models are constructed and analyzed to investigate the impacts of coefficients of government subsidies and CSR cost sharing on the supplier’s and producer’s profits, social welfare growth, CSR level, wholesale price, output of the supplier, and retail price. Our findings suggest that the most effective poverty-alleviation mechanism in most cases is the combination of government subsidies and market efforts. Contrary to common beliefs that companies have to sacrifice profit for social responsibility, we show that poverty alleviation is reconcilable with profit maximization and social welfare improvement, and companies can achieve a win-win situation of both poverty alleviation and profitability. Our work provides new insights for sustainable poverty alleviation and socially sustainable operations.
1. Introduction
Poverty is one of the most pressing social problems around the world, especially in developing countries, and China is no exception. In China, poverty alleviation begins with the concept of alleviating absolute poverty to meet the level of the minimum living needs [1]. With the solution of food and clothing problems, the concept of reducing relative poverty is put forward to improve the poor’s ability to benefit, increase the development capital, and narrow the gap between the rich and the poor [2]. The gap between industry and agriculture has been expanded due to the separation of industry and agriculture, and the policy for agriculture to support industry. According to the China Statistical Yearbook 2019, after forty years of reform and opening up (1978–2018), the proportion of agricultural added value to China’s Gross Domestic Product has dropped from 27.7% to 7.2%. Income disparity between farmers and urban residents is still growing. The level of labor force employed in agriculture is still slow. According to the range of relative poverty line which is from 2300 to 2862 RMB (from 325 to 404 US dollars, approximately), there are 161 million people in relative poverty [3]. The country will remain in relative poverty in the foreseeable future after eliminating absolute poverty by 2020 [2]. Therefore, poverty alleviation will continue to be one of the important tasks of the Chinese government.
Our work is motivated by the poverty alleviation practice of the Chinese government and companies. Industrial poverty alleviation based on the resources advantage and market demand is to improve the self-development ability of the poor, and achieve common prosperity [4]. The government invests in cultivating characteristic industries and attract enterprises to participate in poverty alleviation. Enterprises are also actively socially responsible to help the poor to develop characteristic industries. The local poor population is encouraged to engage in the characteristic industries. Consequently, stable employment guarantees a stable income, and poverty is reduced. It has been reported that a significant amount of government funds has been allocated towards industrial poverty alleviation in China. For example, as per the 12th Five Year Plan, Guizhou Province has invested 6.9 billion Chinese yuan (about 974 million US dollars) toward industrial poverty alleviation. Depending on local needs, the funds were used to support ten industries, including traditional Chinese medicine, walnuts and grassland animal husbandry, to help that province alleviate poverty. As a result, more than 50 million farmers have overcome poverty. Since 2011, Henan Province has invested funds to develop 1389 industrial poverty alleviation projects, including high-efficiency breeding and agricultural product processing, to help nearly 370,000 poor people. On the other hand, companies have also played an important role in poverty alleviation. Apple Inc. takes market-oriented poverty alleviation and value sharing as its focus, and has fulfilled its Corporate Social Responsibilities (CSR) by investing in developing kiwi fruit, tea and other characteristic agricultural industries to help more than ten thousand farmers located in Shimian County, Hanyuan County and other counties of Sichuan Province move out of poverty. Apple is one of the examples where companies not only make profits but also benefit society by helping to reduce poverty [5,6,7]. However, in reality, companies’ CSR efforts are often not productive because they strategically set businesses against social responsibility, while they are actually interdependent [6,7]. Hau L. Lee shows that in a poverty-alleviation supply chain, a producer can both earn profit and help poor suppliers reduce poverty [8]. Therefore, supply chains engaged in CSR can create shared value that not only alleviates poverty but also brings about new opportunities for companies [9]. For example, by combining poverty alleviation and the company’s main business, Muyuan Food Co., Ltd. has taken the poverty reduction initiative and used poor farmers as their pork suppliers. This practice has helped 55 counties reduce poverty, as well as helping Muyuan gain a good reputation and achieve sustainable development (http://www.muyuanfoods.com). In addition to companies’ spontaneous efforts, the government can also directly intervene to enable the producer in the poverty-alleviation supply chain to actively fulfill CSR to help more poor people [10]. Consequently, poverty-alleviation supply chains can be purely market-driven, purely government-led, or a combination of both. It is therefore interesting to study the impacts of different mechanisms and their effectiveness, which is the focus of this paper.
More specifically, our work adopts Amartya Sen’s [11] work on redefining poverty from the perspective of capability. He argued that if the poor can acquire more capabilities, then they will have more opportunities to participate in economic activities and obtain more profit to help them move out of poverty [12]. Accordingly, we model a poverty-alleviation supply chain engaged in CSR composed of one supplier in a poor area and one producer. The producer refers to any company participating in poverty alleviation by fulfilling CSR, and the supplier refers to any new type of agricultural business, such as a family farm, farmer cooperative, or any agribusiness. The producer fulfills CSR by investing funds and helping the supplier cut costs toward the goal of sustainable development. The supplier supplies products for the producer and may share part of the CSR cost of the producer. A cost-sharing mechanism is considered motivational and market-oriented. A profitable supplier can drive local poverty alleviation and prosperity. The government may subsidize the producer according to their CSR level to stimulate the producer to fulfill CSR. As a result, four poverty-alleviation supply chain models are established with and without government subsidies and CSR cost sharing. In the following sections, we explore the impacts of government subsidies and CSR cost sharing on the poverty-alleviation supply chain. It is commonly assumed that the producer is in a dominant position as the leader and the supplier is in a subordinate position as the follower. The poverty-alleviation supply chain is depicted in Figure 1.
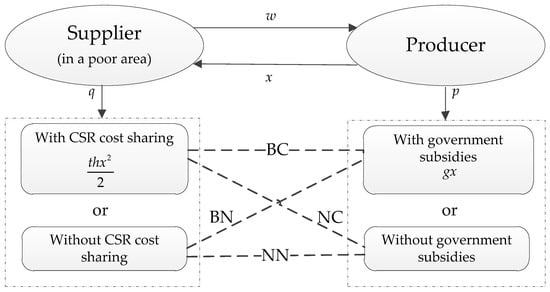
Figure 1.
Four models in the poverty-alleviation supply chain.
Our work attempts to address the following questions:
- What are the impacts of CSR cost sharing and/or government subsidies on poverty alleviation? Is it true that the higher the government subsidies or CSR cost sharing, the more effective poverty alleviation becomes?
- Which poverty alleviation mechanisms among the four are more effective?
- Is poverty alleviation reconcilable with profit maximization and social welfare improvement?
The remainder of our work proceeds as follows. Section 2 reviews the literature. Section 3 presents the model settings and notations, and investigates the four models and equilibrium results. Section 4 presents the analysis and comparison of the four models. Section 5 presents some managerial insights. The conclusions are provided in Section 6.
2. Literature Review
Our work is discussed in association with three streams of the literature: sustainable supply chain management and poverty alleviation; sustainable supply chain management and CSR; sustainable supply chain management with government policies and/or cost sharing.
2.1. Sustainable Supply Chain Management and Poverty Alleviation
Sustainable supply chain management emphasizes the harmonious development of economic, environmental and social responsibilities [13,14,15]. Previous literature on sustainable supply chains is mainly dominated by green/environmental issues which have been studied very well, such as green supply chains and closed-loop supply chains [16,17,18,19,20,21,22,23,24]. Our work instead focuses on the social issues of sustainable supply chains, referred to as socially responsible supply chains. Poverty is a pressing issue in global sustainable development [25]. A case study showed that the supply chain was a powerful means to addressing the poverty issue by incorporating impoverished communities into sustainable supply chains through which the poor obtained ‘capabilities’ [26,27,28]. Regarding operations management, how to design the supply chain to alleviate poverty is an important question. An increasing number of sustainable supply chains use the poor as the upstream suppliers of products. Some research studied the information acquisition and communication issues to reduce transaction costs and provided stylized models of emerging poverty-alleviation supply chains [29]. Other research studied the impact of information on economic value creation for farmers facing an uncertain pricing market. The results showed that both private and public signals would improve farmers’ welfare under certain conditions [30]. Another stream of research established a green poverty-alleviation supply chain by considering the green level and the manufacturer’s microfinances for the poor supplier and examined different power structures using game-theoretic models. An optimal coordination mechanism was developed to take initiative to help poor suppliers with proper microfinance interest rates [31]. Shan and Yang [32] studied a photovoltaic (PV) poverty-alleviation supply chain in China, which was composed of PV enterprises, poor households and the government. By applying a tripartite evolutionary game, four evolutionary stable strategies were obtained, and a more appropriate choice was found to reduce poverty.
2.2. Sustainable Supply Chain Management and CSR
The idea that business has societal obligations was proposed by a visionary businessperson in 19th-century Britain [33]. With the development of the economy, resource shortages and environmental deterioration, nongovernmental organizations (NGOs) and the public called for enterprises to undertake more environmental and social responsibilities. For instance, climate change, poverty, hunger, etc., are aspects of CSR. Some multinational corporations such as Unilever argue that businesses should absolutely undertake CSR to contribute to solving social issues such as poverty, climate change and water shortages [23]. Social issues are related to the supply chain in that the multiple suppliers of the focal company can directly affect the focal company’s reputation [34,35]. Sustainable supply chain management is a systemic way to address the issue of sustainability [26]. Moreover, such management is necessary to exert pressure on a focal company within the supply chain to take responsible supply chain actions [36]. It was shown that implementing sustainable supply chain can improve enterprises’ performance [37]. In the literature, CSR is either modeled in the form of consumer surplus [38,39,40], or in the form of a decision variable [41,42,43,44]. Raj et al. [45] considered both environmental effort and CSR, and constructed a sustainable supply chain with supplier as the leader, and a buyer as the follower. They discussed five contracts to analyze the optimal levels of greening and CSR, the optimal retail price and the maximized profits. The results showed that coordinating mechanisms could improve the levels of greening and CSR, and linear two-part tariff (LTT) perfectly coordinated the sustainable supply chain. Liu et al. [44] studied a supply chain dominated by a retailer with CSR and government subsidies. Their results showed that a higher CSR level could improve the performance of the whole supply chain and social welfare. It was a sensible choice for the leader of a supply chain to fulfill CSR for sustainable development. However, the higher cost the retailer spent on fulfilling CSR, the lower the CSR level. Therefore, the government needs to subsidize the retailer to actively fulfill CSR.
2.3. Sustainable Supply Chain Management with Government Policies and/or Cost Sharing
The government plays a key role in sustainable supply chains, which can develop public policies, such as tax policy and green public procurement [46], to affect supply chains. The government can also provide incentives for supply chain enterprises to actively engage in poverty alleviation by undertaking CSR [23]. In the poverty-alleviation supply chain, the government usually provides subsidies to help reduce poverty. A multiple case study on the dairy supply chain in India was conducted [28]. The results showed that buyers’ development strategies could not only develop suppliers’ capabilities but also improve the performance of buyers and suppliers, thus achieving the goal of poverty alleviation. A sustainable supply chain with product sustainability was constructed by the supplier and the focal company, which were all subsidized by the government [47]. Using differential games, three dimensions of sustainability were analyzed. The results indicated that government subsidies could productively improve product sustainability. The profit-sharing rate of the supply chain had an important impact on the profits of supply chain members and product sustainability. Government subsidies had a greater impact on improving the three dimensions of sustainability than did incentives. Relatively speaking, it was the best choice for the whole supply chain and sustainability that the focal company obtained the most profits. In the same study [44], by establishing a three-stage Stackelberg game model with a government, a retailer as the leader and n suppliers as the followers, the authors considered CSR with or without government subsidies to identify the impacts of government subsidies on the profits of supply chain members, the CSR level and social welfare. Their results showed that the CSR level was positively correlated with the profit of the whole supply chain. Government subsidies were not always productive for promoting supply chain members to fulfill CSR and improving the profit of the whole supply chain and social welfare unless they were within a certain range. In another study [48], the government was the leader and two supply chains, one of which was green and the other was non-green, were followers. The impacts of the rates of government subsidies and taxes on competitive supply chains were explored. The results showed that market demands, products’ green degree and the profits of each supply chain member and the government increased with increasing subsidy rates to a certain threshold. However, government pollution costs decreased. The higher tax rate could improve the profits of the green supply chain and the government, and the green product’s price. The non-green supply chain’s profit and government pollution costs decreased. Interestingly, the products’ green degree had no relation to tax rate variations.
Cost sharing within the supply chain is regarded as an incentive mechanism. In the poverty-alleviation supply chain, the producer invests to help the poor (the supplier). In other words, the producer helps the poor (the supplier) cut costs. The supplier can also share the producer’s costs with the aim to motivate the endogenous power of poverty alleviation. In a contract-farming supply chain, wholesale price and cost-sharing contracts were studied under a firm-farmer structure [49]. The results showed that a cost-sharing contract was beneficial for both firms and farms if the cost-sharing proportion was below a threshold level.
2.4. Our Contributions
Table 1 frames our work in the government subsidies, CSR and cost-sharing literature context, revealing that poverty is still an emerging research area in sustainable supply chains, although most of the previous literature has studied sustainable supply chains. There has been little work in the literature that simultaneously considers CSR, government subsidies and cost sharing. Our work primarily contributes to the socially responsible operations regarding the poverty-alleviation supply chain and crossover studies on CSR and sustainable supply chains [10,23,29,50]. Further, our work considers the above three elements in the poverty-alleviation supply chain, which has not been done in the literature. Therefore, our work emphatically discusses how to achieve sustainable poverty alleviation and the impact of government subsidies and CSR cost sharing on the poverty-alleviation supply chain. Our findings reveal that appropriate CSR cost sharing and government subsidies can improve the profits of the supplier and producer, as well as social welfare. Excessive government subsidies or cost sharing are not conducive to reducing poverty. The CSR level, wholesale price, output of the supplier and retail price in the NC and BN models are closely related to government subsidies and CSR cost sharing. The combination of government subsidies and market efforts is the most effective poverty alleviation mechanism in most cases. The choice of market-oriented or government-led poverty alleviation depends on the supplier’s cost sharing capability. Our work thus provides references for government and companies to be reconcilable with poverty alleviation and profit maximization. Our work also complements the modeling research on poverty alleviation and sustainable supply chains.

Table 1.
Summary of the literature review.
3. The Models
3.1. Model Settings and Notations
Our work is motivated by Sodhi and Tang [29] and poverty problems in practice. We consider a poverty-alleviation supply chain composed of one supplier and one producer. The supplier is in a poor area, accepts the producer’s investment to develop local products and then sells them to the producer at unit wholesale price . The supplier is the price-taker because of their weaker market power. The supplier’s cost is , similar to that in Niu et al. [49]. The first part denotes the planting cost of the unit product input by the supplier, such as the costs of seeds, chemical fertilizer and pesticides. is the cost coefficient of the planting cost of the unit product, and . The second part denotes the effort cost of the unit product, such as the time and effort spent by the supplier. is the cost coefficient of the effort cost of the unit product; is large due to the lack of advanced production technology, and ; is the output of the supplier, all of which will be supplied to the producer. The producer takes the initiative to fulfill CSR to alleviate poverty, investing in the supplier and providing training to cut the supplier’s cost. is the CSR level of the producer. The higher the CSR level is, the larger the investment needed for poverty alleviation. We assume that the CSR cost for poverty alleviation is , where is the CSR cost coefficient and captures the decreasing marginal effect of CSR, , similar to Ni et al. [51]. CSR also affects the supplier’s cost , similar to Tang et al. [52]. For instance, the producer provides ‘raw material’ to the supplier, such as seeds, seedlings and pesticides, to cut the supplier’s cost. Without loss of generality, our work presupposes . The producer sells the product to the consumer at retail price set by the producer. Similar to Li et al. [53] and Raj et al. [45], our work considers a linear market demand function as follows: , where is the initial market share, is the coefficient of price sensitivity and is the coefficient of consumer social responsibility sensitivity, . According to the market demand function, we obtain . To encourage the producer to take initiative to engage in poverty alleviation by fulfilling CSR, the government subsidizes the producer according to the CSR level , where is the total government subsidies and is the coefficient of government subsidies, . The higher the CSR level is, the more government subsidies have been made. To make the supplier’s profit be positive and negative definite of a Hessian matrix under which the decision problem in each model has the maximum value, our work assumes , and . Then . Consumers are willing to pay more for CSR products [54], , similar to Liu et al. [44]. Then for the feasibility and convenience of calculation, our work assumes , and .
The producer as Stackelberg leader first decides the CSR level , and the wholesale price , then the supplier as Stackelberg follower decides the output of the product . Four models with and without government subsidies and CSR cost sharing are built to analyze the poverty-alleviation supply chain. For notational convenience, the subscript refers to the NN model without government subsidies and CSR cost sharing, refers to the NC model without government subsidies and with CSR cost sharing, refers to the BN model with government subsidies and without CSR cost sharing and refers to the BC model with government subsidies and CSR cost sharing. The subscript represents the supplier and represents the producer.
represents the profit, represents the profit margin, represents consumer surplus and represents social welfare. The superscript represents the optimal decision.
3.2. NN Model
This is a benchmark model. By a backward induction approach, the supplier determines the output in response to the producer’s decisions regarding the level of CSR and wholesale price . That is, the supplier obtains their optimal profit by maximizing , given and Therefore, the profit function of the supplier is as follows:
To maximize , the optimal decision in reaction to and is given by
The supplier will respond with their profit as in Equation (2). The producer is the Stackelberg leader, who obtains their optimal profit by maximizing and . Therefore, the profit function of the producer is as follows:
By substituting Equation (2) into Equation (3), we solve the producer’s profit function and obtain the optimal level of CSR and the wholesale price . The objective function is jointly concave in and when . Therefore, we obtain the optimal decision pair and as follows:
Substituting and given by Equation (4) into Equation (2) and previous market demand function, we address the Stackelberg equilibrium in the following proposition:
Proposition 1.
The Stackelberg equilibrium of the supply chain in the NN model is
From the optimal decisions of the supplier and the producer involved in the Stackelberg equilibrium, we obtain the following property:
Property 1.
The optimal decisions in the NN model have the following properties:
(1),,, and. A greater sensitivity of consumers to CSR will impel the producer to fulfill more CSR and increase the wholesale price and the retail price. As a result, the supplier increases output to obtain more profit
(2),,, and. A higher cost of CSR will reduce incentives to fulfill CSR and lower the wholesale price. Therefore, the supplier will reduce output because of the low wholesale price, which is adverse to poverty alleviation. Thus, the producer will lower the retail price to recover costs as soon as possible.
An increasing number of consumers are paying attention to CSR. They are willing to pay extra money to buy poverty-alleviation products to support suppliers. Obviously, consumers’ sensitivity to CSR makes the demand increase and induces the producer to take on more CSR to alleviate poverty. Therefore, it is an advisable choice for the producer to fulfill CSR to alleviate poverty. The producer will benefit from the higher CSR level and most importantly, the supplier will also benefit from the increased output.
When the CSR cost is high, the producer will lower the CSR level to reduce cost. The wholesale price given to the supplier will be lowered. Consequently, the supplier’s output will decrease. Ultimately, the supplier’s profit will decrease, which is unfavorable for poverty alleviation.
We obtain the profits of the supplier and the producer, respectively, by inputting the Stackelberg equilibrium solutions to the objective functions (1) and (3) as follows:
As commonly defined in the literature [55,56,57], consumer surplus is
Inputting the equilibrium solutions to Equation (7), we obtain the equilibrium consumer surplus:
Social welfare represents the total profits of the supplier and the producer and the consumer surplus which is given as follows:
3.3. NC Model
Poverty alleviation needs not only the effort of the producer’s CSR but also the effort of the supplier’s own. In practice, the supplier shares part of the producer’s CSR costs, which will motivate the supplier’s poverty-alleviation effort. For example, China Resources has invested in helping the poor in Haiyuan County as the supplier, by developing the beef cattle breeding industry using a model of development-oriented poverty alleviation. The retail price per high quality Simmental cow is approximately 10,000 RMB (about 1412 US dollars), and China Resources has committed a large investment to introducing Simmental cows to the Haiyuan people. However, the supplier (a small family farm) also needs to raise 2000 RMB (about 282 US dollars) independently. To put this in perspective, it is equivalent to saying that the poor (the supplier) share some CSR costs. Delightfully, because of this strategy by China Resources, more than 24,000 Haiyuan people have steadily lifted themselves out of poverty (http://www.crc.com.hk/).
In view of this, it is necessary to consider a cost-sharing model. We suppose that the supplier shares the CSR cost . Then, the producer’s CSR cost is ; is the proportion of the supplier’s CSR cost sharing, . Therefore, the profit functions of both the supplier and the producer are as follows:
We solve the problem similarly to the NN model and show the Stackelberg equilibrium in the following proposition:
Proposition 2.
The Stackelberg equilibrium in the NC model is
Property 2.
The optimal decisions in the NC model have the following properties:
(1),,and. Similarly to the NN model, a greater sensitivity of consumers to CSR motivates the producer to fulfill more CSR. The consumer would like to pay a higher price for poverty-alleviation products. As a result, the producer will benefit more from the higher retail price. Furthermore, the supplier will strive to produce more and obtain more profit because of the higher wholesale price;
(2),,and. The impact of CSR costs on the CSR level, wholesale price, output and retail price is the same as that in the NN model, and thus, it is not necessary to go into detail.
Substituting the Stackelberg equilibrium solutions into the objective functions Equation (7) and Equations (10) and (11), we obtain the consumer surplus, the profits of both the supplier and the producer and social welfare as follows:
In this section, comparing NN and NC models, we mainly discuss the impact of on the supplier’s profit, the producer’s profit and social welfare.
Proposition 3.
We obtain the supplier’s profit growth, the producer’s profit growth and social welfare growth as follows:
Corollary 3.
By solving Equation (14), we obtain the impact ofon the profits of both the supplier and the producer, and social welfare by comparing NN and NC models as follows:
(1) If, then; otherwise,. The profit of the supplier is improved if the supplier can share the producer’s CSR cost. However, the fraction of cost sharing should be moderate, or the supplier’s profit will suffer losses;
(2) There is alwaysregardless of whatis;
(3) If, then; otherwise,. Social welfare is improved if the supplier can share the producer’s CSR cost.
Proof.
See Appendix A. □
3.4. BN Model
Poverty alleviation is an important part of the government’s livelihood work. Governments take various measures to relieve poverty. Government subsidies are necessary to guarantee poverty alleviation. The government will give the producer some subsidies to increase the producer’s poverty-alleviation funds and encourage the producer to engage in poverty alleviation by fulfilling CSR. In many places in China, an enterprise will receive government subsidies if it participates in poverty alleviation. The higher the CSR level, the more subsidies the producer will obtain. Accordingly, we assume that the producer will receive government subsidies . Therefore, in the BN model, the profit functions of both the supplier and the producer are as follows:
We solve the problem similarly to the NN model and show the Stackelberg equilibrium in the following proposition:
Proposition 4.
The Stackelberg equilibrium in the BN model is
Property 3.
The optimal decisions in the BN model have the following properties:
,,and. The impact of CSR costs on the CSR level, wholesale price, output and retail price is the same as that in the NN and NC models, and thus, it is not necessary to go into detail.
Substituting Equation (17) into Equations (7), (15) and (16), we obtain the consumer surplus, the profits of both the supplier and the producer and social welfare as follows:
In this section, we mainly discuss the impact of on the supplier’s profit, the producer’s profit and social welfare by comparing BN and NN models. We claim that government subsidies are effective when the total subsidy amount is smaller than the supplier’s profit growth or social welfare growth.
Proposition 5.
We obtain the supplier’s profit growth, the producer’s profit growth and social welfare growth as follows:
We useto represent the government subsidies, which are shown as follows:
Corollary 2.
We obtain the following corollaries:
(1) It is obvious thatand;
(2) If, then; otherwise,. It shows that government subsidies beyond a certain range make the supplier’s profit growth be less than government subsidies. Therefore, we observe that proper government subsidies make the supplier’s profit growth be more than government subsidies, which is effective and favorable to poverty alleviation;
(3) If, then; otherwise,. It shows that government subsidies beyond a certain range make social welfare growth be less than government subsidies. Therefore, we observe that proper government subsidies are effective and favorable to social welfare growth.
Proof.
See Appendix B. □
3.5. BC Model
In practice, poverty alleviation needs not only government subsidies but also the supplier’s own efforts to reduce poverty. Therefore, we suppose that on the one hand, the supplier shares part of the producer’s CSR costs to arouse the supplier’s efforts in reducing poverty; on the other hand, the government subsidizes the producer to promote it to fulfill CSR to alleviate poverty. Consequently, the profit functions of both the supplier and the producer are as follows:
We solve the problem similarly to the NN model and show the Stackelberg equilibrium in the following proposition:
Proposition 6.
The Stackelberg equilibrium in the BC model is
Property 4.
The optimal decisions in the BC model have the following properties:
,,and. The impact of CSR costs on the CSR level, wholesale price, output and retail price is the same as that in the NN, NC and BN models, and thus, it is not necessary to go into detail.
Substituting Equation (23) into Equations (7), (21) and (22), we obtain the consumer surplus, the profits of both the supplier and the producer and social welfare as follows:
In this section, we analyze the impacts of and on the supplier’s profit, the producer’s profit and social welfare to achieve Pareto improvement by comparing BC and BN models.
Proposition 7.
We obtain the supplier’s profit growth, the producer’s profit growth and social welfare growth as follows:
Corollary 3.
We obtain the following corollaries:
(1) It is obvious that;
(2) If, then; otherwise,. The results show that the supplier shares part of the CSR cost to achieve Pareto improvement of the supplier’s profit. The proportion that the supplier shares of the producer’s CSR cost should be within a certain range. Otherwise, the supplier cannot achieve Pareto improvement;
(3) If, whereand, then; otherwise,. The results show that social welfare will achieve Pareto improvement when the supplier shares part of the CSR cost. Similarly to the supplier’s profit, the proportion that the supplier shares of the producer’s CSR cost should be within a certain range.
Proof.
See Appendix C. □
4. Analysis and Comparison
In the previous sections, we study the Stackelberg equilibrium in four poverty-alleviation supply chain models. In this section, we compare the equilibrium results from the two perspectives of the coefficients of government subsidies, , and cost sharing, .
4.1. Comparison of the CSR Level, Wholesale Price, Output of the Supplier and Retail Price
Corollary 4.
From the perspective ofand, we find the following:
(1) When the coefficient of cost sharing is predetermined, if, then,,and. If, then,,and. We find that when the coefficient of government subsidies is larger than a certain threshold, the wholesale price is increased, the supplier would like to produce more with the help of CSR. The retail price is higher and the producer can actively fulfill CSR to alleviate poverty. The strategy of the BN model is better than that of the NC model. When the coefficient of government subsidies is more than zero and less than or equal to the certain threshold, the strategy of the NC model is better than that of the BN model. Generally, the strategy of the BC model is the best for poverty alleviation;
(2) When the coefficient of government subsidies is predetermined, if, then,,and. If, then,,and. We find that when the coefficient of cost sharing is larger than a certain threshold, the supplier makes an effort to raise production. The producer will offer a higher wholesale price to the supplier. The retail price is higher and CSR level will increase. The strategy of the NC model is better than that of the BN model. When the coefficient of cost sharing is less than or equal to the certain threshold, then the strategy of the BN model is better than NC model. The strategy of the BC model is always the best for poverty alleviation.
Proof.
See Appendix D. □
4.2. Numerical Analysis of the Profits of the Supplier and the Producer and Social Welfare
We use specific numerical examples to find more managerial insights. We will investigate the profits of the supplier and the producer and social welfare. The parameters are , , , , and . We analyze the poverty-alleviation supply chain in view of the coefficients of CSR cost sharing, , and government subsidies, . For the purpose of comparing and analyzing, we find that and . We suppose that and .
When , according to the change in , we obtain the following property:
Property 5.
From different conditions of CSR cost sharing, we find the following:
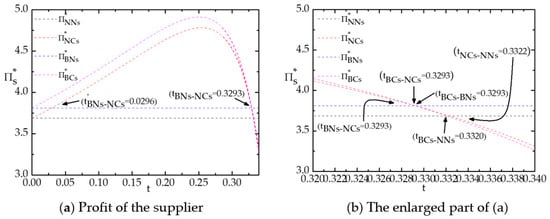
(1) As shown in Figure 2, if, then. If, then. If, then. If, then. If, then . If, then. Note that the last case does not make sense for our work, and thus, it will not be discussed. When the supplier can share only a small part of the CSR costs, the government-led poverty alleviation (BN) model could effectively improve the supplier’s profit. When the supplier is able to share more of the CSR costs, the market-oriented poverty alleviation (NC) model is better. Obviously, there is an effective CSR cost sharing interval in which the market-oriented poverty alleviation (NC) model is better than the government-led poverty alleviation (BN) model. There is an optimal CSR cost-sharing value. Exceeding the optimal CSR cost-sharing value, the supplier’s profit decreases until it is equal to that in the government-led poverty alleviation (BN) model. That is, the impact of CSR cost sharing on the incentives for the supplier gradually declines. Until the supplier’s CSR cost sharing reaches a certain value in the NC, BN and BC models, the supplier obtains the same profit in three models. After that, with the increase in CSR cost sharing, the government-led poverty alleviation (BN) model is better. As cost sharing continues to increase, the supplier’s profit continues to decrease in the BN model and becomes even worse than that in the NN model.
Figure 2.
Impact of on the supplier’s profit.
However, in general, the supplier obtains the most profit with the combination of government-led and market-oriented alleviation (BC model) in most cases;
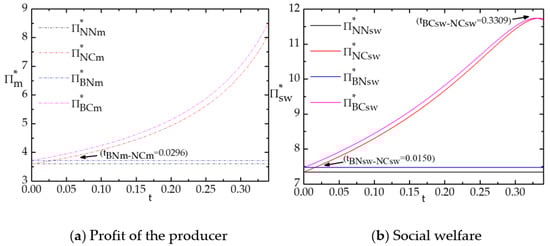
(2) As shown in Figure 3a, if, then. If, then. We know that if the supplier shares a fraction of the CSR costs, then compared with the producer’s profit in the market-oriented poverty alleviation (NC) model, the producer will obtain more profit in the government-led poverty alleviation (BN) model. In contrast, it is obvious that the producer will obtain more profit under the market-oriented poverty alleviation (NC) model with the increase in CSR costs shared by the supplier. However, the producer will earn the most profit with the combination of government-led and market-oriented alleviation (BC model);
Figure 3.
Impact of on the producer’s profit and social welfare.
(3) If, then. If, then. If, then. As shown in Figure 3b, when the supplier has a much weaker ability to share CSR costs, social welfare is higher in the government-led poverty (BN) model than that in the market-oriented poverty alleviation (NC) model. Once the supplier’s cost-sharing ratio exceeds a certain value, the market-oriented poverty alleviation (NC) model has a great advantage. However, the combination of the government and the market (BC model) is the best in most cases. Then, with the increase in, social welfare is the best in the market-oriented poverty alleviation (NC) model.
As shown in Figure 2 and Figure 3, it is clear that CSR cost sharing has a great impact on profits. The less cost sharing there is, the more the producer, social welfare and especially the supplier will earn in the government-led poverty alleviation (BN) model. Therefore, it is realistic that government subsidies would be essential for relieving poverty when the supplier has almost no cost-sharing capability. When the supplier has a certain ability to share the CSR costs, market-oriented poverty alleviation (NC) model obviously plays a greater role in poverty relief. In addition, the combination of government-led and market-oriented alleviation (BC model) is the best choice for the supplier, the producer and social welfare in most cases.
4.3. Numerical Analysis of the Effects of Government Subsidies
Property 6.
We attempt to investigate the impacts ofandon the poverty-alleviation supply chain.
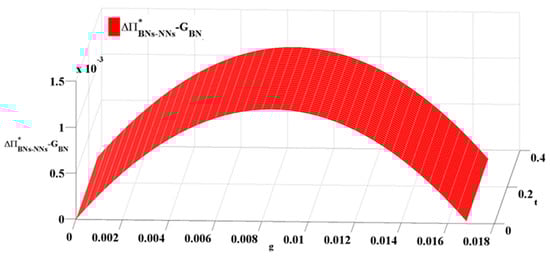
(1) As shown in Figure 4, compared with the NN model, when, government subsidies are lower than the supplier’s profit growth in the BN model. Government subsidies can positively improve the supplier’s profit. There is an optimal government subsidy for the supplier’s profit growth. Over this optimal government subsidy, with the increase in, the supplier’s profit growth decreases until zero.
Figure 4.
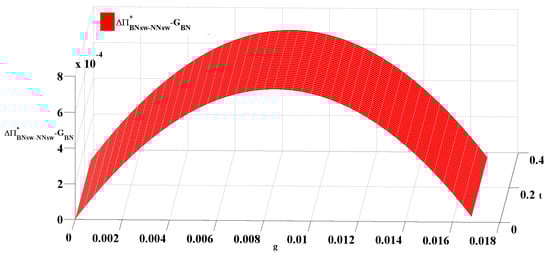
Impact of and on .
(2) As shown in Figure 5, similarly to the data in Figure 4, compared with the NN model, social welfare growth in the BN model is higher than government subsidies. Considering Figure 4 and Figure 5, it can be seen that government subsidies can improve not only the supplier’s profit but also social welfare. There is an optimal government subsidy. Over this optimal government subsidy, social welfare growth decreases until zero. In this case, government subsidies will have no effect on poverty alleviation.
Figure 5.
Impact of and on .
4.4. Numerical Analysis of the CSR Level, Wholesale Price, Output of the Supplier and Retail Price
As shown in Figure 6, we find that the CSR level is optimal in the BC model and minimal in the NN model, regardless of the values of and . However, with the change in and , the CSR level gradually changes. Over a certain range, the CSR level in the NC model is higher than that in the BN model. The results in Figure 6 are the same as those in Corollary 4.
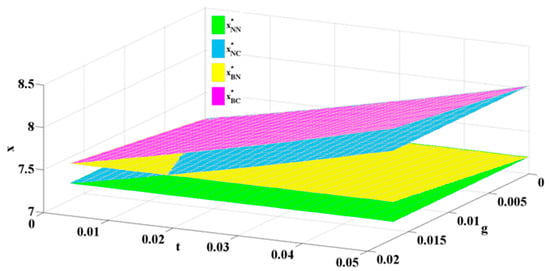
Figure 6.
Corporate Social Responsibility (CSR) levels. Impact of and on the CSR level.
As shown in Figure 7, the wholesale price is the highest in the BC model and the lowest in the NN model, regardless of what and are. However, with the change in and , the wholesale price gradually changes. Over a certain range, the wholesale price is higher in the NC model than that in the BN model. The results of Figure 8 are the same as those in Corollary 4.
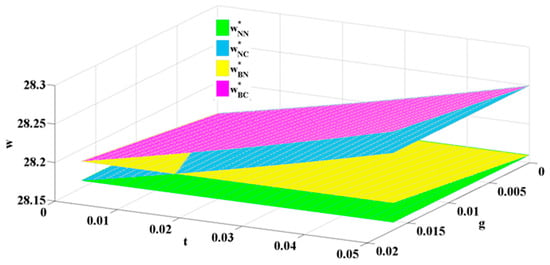
Figure 7.
The wholesale price. Impact of and on the wholesale price.
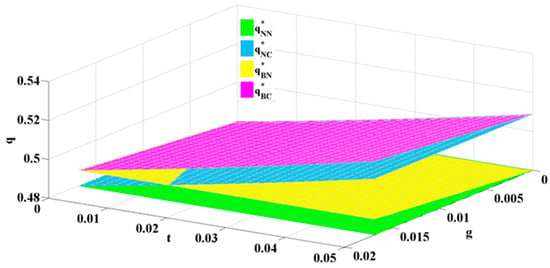
Figure 8.
The output of the supplier. Impact of and on the output of the supplier.
As shown in Figure 8, the output of the supplier is the maximum in the BC model and the minimum in the NN model, regardless of the values of and . However, with the change in and , the output of the supplier gradually changes. Over a certain range, the output of the supplier in the NC model is higher than that in the BN model. The results in Figure 8 are the same as those in Corollary 4.
As shown in Figure 9, the retail price of the producer is the highest in the BC model and the lowest in the NN model, regardless of the values of and . Comparing the BN model with the NC model, when and are within a certain range, the retail price is higher in the BN model than in the NC model. Once and are beyond the range, the NC model is the best for the producer. The results in Figure 9 are the same as those in Corollary 4.
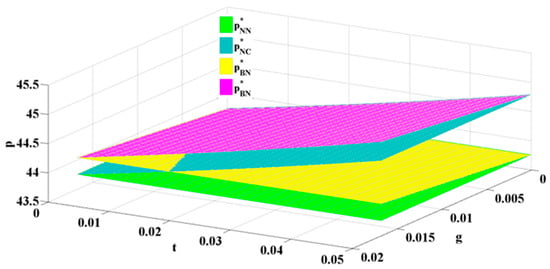
Figure 9.
The retail price. Impact of and on the retail price.
Finally, we will compare our work with previous studies. Our findings confirm that government subsidies for CSR within a certain range would improve the profits of supply chain members and social welfare [44]. However, our work extends this research by considering poverty alleviation and cost sharing. Our research also confirms that appropriate cost sharing can increase profits of supply chain members [49]. However, our work discusses the supplier’s cost sharing, not the producer’s cost sharing. Besides, we also extend the research by considering the impact of the government subsidies and CSR on the poverty-alleviation supply chain. Our insights confirms the results of the case study done by Yawar & Seuring [28]. Our work uses mathematical model to extend the study by considering government, CSR and social welfare, and enriches socially sustainable operations.
5. Managerial Insights
Based on the above analyses, our work provides some managerial insights for the government, for suppliers who suffer poverty and for enterprises that participated in poverty alleviation initiatives.
(1) For the government: The government plays an important role in solving absolute poverty. With the transformation from absolute poverty to relative poverty after 2020, the government will play a guiding role in the poverty-alleviation supply chain. How to establish a reasonable incentive mechanism to sustainable poverty alleviation is a key question. From the perspective of the producer, the government should provide different incentives, such as subsidies and various supporting policies, to motivate the producer to participate in the poverty-alleviation supply chain. Appropriate government subsidies are not only advantageous to activating the market mechanism but can also save the government money. From the perspective of the supplier, the government needs to stimulate the supplier’s endogenous impetus for poverty alleviation by education and mass media campaigns. The help-the-poor policies are first targeted at the supplier who is willing to eliminate poverty. In terms of poverty alleviation models, the government should focus on investigating the supplier’s financial capacity. When the supplier can share only a small part of the costs (less than 0.0296), the government should play the leading part in poverty alleviation (BN model). When the supplier can share more costs (between 0.0296 and 0.3293), the government should let the market play the leading part (NC model). However, in general, the government should leave room for the market-oriented effort to play a major role in reducing poverty with a series of supporting policies.
(2) For the supplier in a poor area: In the poverty-alleviation supply chain, the supplier should enhance the capability of CSR cost sharing, participate in supply chains and look for market entry opportunities under the guidance of the government. The supplier will obtain more profit with government-led poverty alleviation when the supplier has almost no cost sharing capability (less than 0.0296). The supplier may borrow from banks or join with other suppliers to share more of the cost to improve profit in the market-oriented poverty alleviation mechanism (between 0.0296 and 0.3293). At the same time, the supplier should actively improve production capacity through training and learning new technologies to change ideas from ‘wanting me to eliminate poverty’ to ‘I want to eliminate poverty’. As a result, the supplier will obtain more profit from the market and help the local poor to eliminate poverty. In other words, no pain, no gain.
(3) For the producer: The producer needs the government subsidies when the supplier’s capability for cost sharing is weak (less than 0.0296). When the supplier shares more costs (no less than 0.0296), the producer will get a higher profit in the market-oriented poverty alleviation mechanism. Therefore, the producer may inspire the supplier to share more costs by shared revenue. The producer should combine poverty alleviation with their core businesses by making the poor their sustainable supplier to reduce procurement cost. As a result, the producer can establish a good enterprise image, gain competitive advantage and achieve sustainable development. Accordingly, the producer not only fulfills CSR but also gains profit. It is a win-win situation of social value and economic value.
6. Conclusions
Poverty is a global problem. In China, the issue of solving relative poverty is a long-term problem. We explored this issue by embedding the producer into the supply chain with the supplier in a poor area. The producer helps the supplier cut costs by performing CSR. Four supply chain models for poverty alleviation are proposed from the perspectives of government subsidies and CSR cost sharing. Subsequently, we seek to find an optimal poverty alleviation model from the perspective of CSR cost sharing. We also analyze the impacts of government subsidies and CSR cost sharing on the supplier’s profit growth, social welfare growth, CSR level, wholesale price, output of the supplier and retail price. Some valuable findings are as follows:
(1) Appropriate government subsidies could increase the supplier’s profit and improve poverty and social welfare. There is an optimal government subsidy. Excessive government subsidies are not useful for sustainable poverty alleviation (Figure 4 and Figure 5);
(2) The supplier’s appropriate CSR cost sharing can motivate the supplier to reduce poverty. There is also an optimal CSR cost-sharing value. Excessive CSR cost sharing is not conducive to poverty alleviation. The choice of market-oriented (NC model) or government-led (BN model) poverty alleviation is determined by the capability of the supplier’s CSR cost sharing (Figure 2).
(3) The CSR level, wholesale price, output of the supplier and retail price are the highest in the BC model and the lowest in the NN model which is independent of CSR cost sharing and government subsidies. However, the comparison of the CSR level, wholesale price, output of the supplier and retail price in the NC and BN models are closely related to government subsidies and CSR cost sharing (Figure 6, Figure 7, Figure 8 and Figure 9).
(4) The combination of government-led poverty alleviation and market-oriented poverty alleviation (BC model) is the most efficient model in most cases. Poverty alleviation is reconcilable with profit maximization and social welfare improvement in the poverty-alleviation supply chain. That is, the co-creation of social value (poverty alleviation and social welfare) and economic value (the producer’s profit) can be achieved (Figure 2 and Figure 3).
Our work enriches the content of poverty-alleviation supply chains in the context of relative poverty and provides references for the government’s decision making regarding sustainable poverty alleviation and provides new insights for socially sustainable operations management. Government subsidies and CSR cost sharing have an important impact on poverty alleviation. Furthermore, the impact of consumers’ sensitivity to poverty alleviation, and how the supplier shares more CSR costs to obtain more profit are left to future research.
Author Contributions
Conceptualization, K.K. and X.L.; Formal analysis, X.L.; Supervision, K.K.; Writing—original draft preparation, X.L.; writing—review and editing, K.K., X.L., W.S., Y.M. and X.W. All authors have read and agreed to the published version of the manuscript.
Funding
This research was funded by the National Natural Science Foundation of China, grant number 71640013 and the National Social Science Foundation of China, grant number 17CGL004.
Acknowledgments
The authors particularly gratefully acknowledge the editors and reviewers for the constructive comments and helpful suggestions.
Conflicts of Interest
The authors declare no conflict of interest.
Appendix A
Proof of Corollary 1.
Solving
, we obtain that or . Therefore, if , then , that is ; otherwise, .
According to . and , we obtain , that is .
Solving , we obtain that or . Therefore, if , then , that is ; otherwise, . □
Appendix B
Proof of Corollary 2.
According to
and , we obtain and , in other words, and .
Solving , we obtain that or . Therefore, if , then , that is ; otherwise, .
Solving , we obtain that or . Therefore, if , then , that is ; otherwise, . □
Appendix C
Proof of Corollary 3.
According to
, and , we obtain , that is .
Solving , we obtain that or . Therefore, if , then ; otherwise, .
Solving , we obtain that or , where , . Therefore, if , then ; otherwise, . □
Appendix D
Proof of Corollary 4.
According to
, , , , and , we get that
Solving , , and , we get the solutions about the coefficients of government subsidies and the coefficient of cost sharing: respectively, and . Therefore, from the perspective of government subsidies, if , then , , and . If , then , , and . From the perspective of cost sharing, if , then , , and
If , then , , and . □
References
- Organisation for Economic Co-operation and Development. Public Expenditure on Income Maintenance Programmes; Organisation for Economic Co-operation and Development: Paris, France; OECD: Paris, France; Washington, DC, USA, 1976; p. 69. [Google Scholar]
- Tang, L. The Evolution of China’s Poverty Alleviation and Development Policy (2001–2015), 1st ed.; Zuo, C., Ed.; Springer Nature Singapore Pte Ltd.: Singapore, 2019; pp. 65–111. [Google Scholar]
- Sun, J. China’s Poverty Alleviation Strategy and the Delineation of the Relative Poverty Line after 2020: An Analysis Based on Theory, Policy and Empirical Data. Chin. Rural Econ. 2020, 10, 98–113. [Google Scholar]
- Wanh, C. The research context and theme content of Chinese industrial poverty alleviation since 21st century. China Popul. Environ. 2017, 27, 145–154. [Google Scholar] [CrossRef]
- Burke, L.; Logsdon, J.M. How corporate social responsibility pays off. Long Range Plan. 1996, 29, 495–502. [Google Scholar] [CrossRef]
- Porter, M.E.; Kramer, M.R. The competitive advantage of corporate philanthropy. Harv. Bus. Rev. 2002, 80, 57. [Google Scholar]
- Kramer, M.R.; Porter, M.E. Strategy and society: The link between competitive advantage and corporate social responsibility. Strat. Dir. 2007, 23, 78–92. [Google Scholar] [CrossRef]
- Lee, H.L. Don’t tweak your supply chain-rethink it end to end. Harv. Bus. Rev. 2010, 88, 9. [Google Scholar]
- Lee, H.L.; Tang, C.S. Socially and Environmentally Responsible Value Chain Innovations: New Operations Management Research Opportunities. Manag. Sci. 2018, 64, 983–996. [Google Scholar] [CrossRef]
- Tang, C.S. Socially responsible supply chains in emerging markets: Some research opportunities. J. Oper. Manag. 2018, 57, 1–10. [Google Scholar] [CrossRef]
- Sen, A. Poverty: An Ordinal Approach to Measurement. Econometrica 1976, 44, 219. [Google Scholar] [CrossRef]
- Ansari, S.S.; Munir, K.; Gregg, T. Impact at the ‘Bottom of the Pyramid’: The Role of Social Capital in Capability Development and Community Empowerment. J. Manag. Stud. 2012, 49, 813–842. [Google Scholar] [CrossRef]
- Elkington, J. Partnerships from Cannibals with Forks: The Triple iottom line of 2 1 st-Century Business. Environ. Qual. Manag. 1998, 8, 37–51. [Google Scholar] [CrossRef]
- Govindan, K.; Cheng, T. Sustainable supply chain management: Advances in operations research perspective. Comput. Oper. Res. 2015, 54, 177–179. [Google Scholar] [CrossRef]
- Brandenburg, M.; Govindan, K.; Sarkis, J.; Seuring, S. Quantitative models for sustainable supply chain management: Developments and directions. Eur. J. Oper. Res. 2014, 233, 299–312. [Google Scholar] [CrossRef]
- Brandenburg, M.; Gruchmann, T.; Oelze, N. Sustainable Supply Chain Management—A Conceptual Framework and Future Research Perspectives. Sustainability 2019, 11, 7239. [Google Scholar] [CrossRef]
- Ahi, P.; Searcy, C. A comparative literature analysis of definitions for green and sustainable supply chain management. J. Clean. Prod. 2013, 52, 329–341. [Google Scholar] [CrossRef]
- Georgiadis, P.; Besiou, M. Environmental and economical sustainability of WEEE closed-loop supply chains with recycling: A system dynamics analysis. Int. J. Adv. Manuf. Technol. 2009, 47, 475–493. [Google Scholar] [CrossRef]
- Kleindorfer, P.; Singhal, J.; Van Wassenhove, L.N. Sustainable Operations Management. Prod. Oper. Manag. 2009, 14, 482–492. [Google Scholar] [CrossRef]
- Sarkis, J.; Zhu, Q.; Lai, K.-H. An organizational theoretic review of green supply chain management literature. Int. J. Prod. Econ. 2011, 130, 1–15. [Google Scholar] [CrossRef]
- Seuring, S.; Sarkis, J.; Müller, M.; Rao, P. Sustainability and supply chain management–An introduction to the special issue. J. Clean. Prod. 2008, 16, 1545–1551. [Google Scholar] [CrossRef]
- Sodhi, M.S.; Tang, C.S. Corporate social sustainability in supply chains: A thematic analysis of the literature. Int. J. Prod. Res. 2017, 56, 882–901. [Google Scholar] [CrossRef]
- Tang, C.S.; Zhou, S.X. Research advances in environmentally and socially sustainable operations. Eur. J. Oper. Res. 2012, 223, 585–594. [Google Scholar] [CrossRef]
- Malik, M.; Abdallah, S. Sustainability Initiatives in Emerging Economies: A Socio-Cultural Perspective. Sustainability 2019, 11, 4893. [Google Scholar] [CrossRef]
- Silvestre, B.S.; Ţîrcă, D.M. Innovations for sustainable development: Moving toward a sustainable future. J. Clean. Prod. 2019, 208, 325–332. [Google Scholar] [CrossRef]
- Hall, J.; Matos, S. Incorporating impoverished communities in sustainable supply chains. Int. J. Phys. Distrib. Logist. Manag. 2010, 40, 124–147. [Google Scholar] [CrossRef]
- Bendul, J.C.; Rosca, E.; Pivovarova, D. Sustainable supply chain models for base of the pyramid. J. Clean. Prod. 2017, 162, S107–S120. [Google Scholar] [CrossRef]
- Yawar, S.A.; Seuring, S. The role of supplier development in managing social and societal issues in supply chains. J. Clean. Prod. 2018, 182, 227–237. [Google Scholar] [CrossRef]
- Sodhi, M.S.; Tang, C.S. Supply-Chain Research Opportunities with the Poor as Suppliers or Distributors in Developing Countries. Prod. Oper. Manag. 2013, 23, 1483–1494. [Google Scholar] [CrossRef]
- Chen, Y.-J.; Tang, C.S. The Economic Value of Market Information for Farmers in Developing Economies. Prod. Oper. Manag. 2015, 24, 1441–1452. [Google Scholar] [CrossRef]
- Kang, K.; Zhao, Y.; Ma, Y.; Li, Z. Green supply chain poverty alleviation through microfinance game model and cooperative analysis. J. Clean. Prod. 2019, 226, 1022–1041. [Google Scholar] [CrossRef]
- Shan, H.; Yang, J. Sustainability of photovoltaic poverty alleviation in China: An evolutionary game between stakeholders. Energy 2019, 181, 264–280. [Google Scholar] [CrossRef]
- Smith, N.C. Corporate Social Responsibility: Whether or How? Calif. Manag. Rev. 2003, 45, 52–76. [Google Scholar] [CrossRef]
- Hoejmose, S.U.; Roehrich, J.K.; Grosvold, J. Is doing more doing better? The relationship between responsible supply chain management and corporate reputation. Ind. Mark. Manag. 2014, 43, 77–90. [Google Scholar] [CrossRef]
- Roberts, S. Supply Chain Specific? Understanding the Patchy Success of Ethical Sourcing Initiatives. J. Bus. Ethic 2003, 44, 159–170. [Google Scholar] [CrossRef]
- Klassen, R.; Vereecke, A. Social issues in supply chains: Capabilities link responsibility, risk (opportunity), and performance. Int. J. Prod. Econ. 2012, 140, 103–115. [Google Scholar] [CrossRef]
- Schinckus, C.; Akbari, M.; Clarke, S. Corporate Social Responsibility in Sustainable Supply Chain Management: An Econo-Bibliometric Perspective. Theor. Econ. Lett. 2019, 9, 247–270. [Google Scholar] [CrossRef]
- Panda, S. Coordination of a socially responsible supply chain using revenue sharing contract. Transp. Res. Part E 2014, 67, 92–104. [Google Scholar] [CrossRef]
- Panda, S.; Modak, N.M.; Basu, M.; Goyal, S. Channel coordination and profit distribution in a social responsible three-layer supply chain. Int. J. Prod. Econ. 2015, 168, 224–233. [Google Scholar] [CrossRef]
- Modak, N.M.; Panda, S.; Mishra, R.; Sana, S. A three-layer supply chain coordination in socially responsible distribution system. Tékhne 2016, 14, 75–87. [Google Scholar] [CrossRef]
- Ni, D.; Li, K.W. A game-theoretic analysis of social responsibility conduct in two-echelon supply chains. Int. J. Prod. Econ. 2012, 138, 303–313. [Google Scholar] [CrossRef]
- Hsueh, C.-F. Improving corporate social responsibility in a supply chain through a new revenue sharing contract. Int. J. Prod. Econ. 2014, 151, 214–222. [Google Scholar] [CrossRef]
- Hsueh, C.-F. A bilevel programming model for corporate social responsibility collaboration in sustainable supply chain management. Transp. Res. Part E 2015, 73, 84–95. [Google Scholar] [CrossRef]
- Liu, Y.; Quan, B.-T.; Xu, Q.; Forrest, J.Y.-L. Corporate social responsibility and decision analysis in a supply chain through government subsidy. J. Clean. Prod. 2019, 208, 436–447. [Google Scholar] [CrossRef]
- Raj, A.; Biswas, I.; Srivastava, S. Designing supply contracts for the sustainable supply chain using game theory. J. Clean. Prod. 2018, 185, 275–284. [Google Scholar] [CrossRef]
- Cheng, W.; Appolloni, A.; Zhu, Q.; D’Amato, A. Green Public Procurement, missing concepts and future trends–A critical review. J. Clean. Prod. 2018, 176, 770–784. [Google Scholar] [CrossRef]
- Hou, G.; Wang, Y.; Xin, B. A coordinated strategy for sustainable supply chain management with product sustainability, environmental effect and social reputation. J. Clean. Prod. 2019, 228, 1143–1156. [Google Scholar] [CrossRef]
- Madani, S.R.; Rasti-Barzoki, M. Sustainable supply chain management with pricing, greening and governmental tariffs determining strategies: A game-theoretic approach. Comput. Ind. Eng. 2017, 105, 287–298. [Google Scholar] [CrossRef]
- Niu, B.; Jin, D.; Pu, X. Coordination of channel members’ efforts and utilities in contract farming operations. Eur. J. Oper. Res. 2016, 255, 869–883. [Google Scholar] [CrossRef]
- Sodhi, M.S. Conceptualizing Social Responsibility in Operations Via Stakeholder Resource-Based View. Prod. Oper. Manag. 2015, 24, 1375–1389. [Google Scholar] [CrossRef]
- Ni, D.; Li, K.W.; Tang, X. Social responsibility allocation in two-echelon supply chains: Insights from wholesale price contracts. Eur. J. Oper. Res. 2010, 207, 1269–1279. [Google Scholar] [CrossRef]
- Tang, C.S.; Wang, Y. The Impact of Input-vs. Output-Based Farm Subsidies on Farmer Welfare and Income Inequality in Developing Economies. Available online: https://ssrn.com/abstract=3182548 (accessed on 21 May 2018).
- Li, X.; Li, Y. Chain-to-chain competition on product sustainability. J. Clean. Prod. 2016, 112, 2058–2065. [Google Scholar] [CrossRef]
- Phillips, D.Z. Does It Pay to Be Good? Interv. Ethics 1992, 110–124. [Google Scholar] [CrossRef]
- Sinayi, M.; Rasti-Barzoki, M. A game theoretic approach for pricing, greening, and social welfare policies in a supply chain with government intervention. J. Clean. Prod. 2018, 196, 1443–1458. [Google Scholar] [CrossRef]
- Hong, Z.; Guo, X. Green product supply chain contracts considering environmental responsibilities. Omega 2019, 83, 155–166. [Google Scholar] [CrossRef]
- Nielsen, I.; Majumder, S.; Sana, S.S.; Saha, S. Comparative analysis of government incentives and game structures on single and two-period green supply chain. J. Clean. Prod. 2019, 235, 1371–1398. [Google Scholar] [CrossRef]


© 2020 by the authors. Licensee MDPI, Basel, Switzerland. This article is an open access article distributed under the terms and conditions of the Creative Commons Attribution (CC BY) license (http://creativecommons.org/licenses/by/4.0/).