Abstract
The Chinese government set up a redline for water resources in 2011, mandating water withdrawals and management criteria to the year 2030. ‘How much water is required to produce sufficient crop to feed a 1.6 billion population in 2030?’ becomes a crucial question to be addressed. The objectives of this study are to: (1) document crop water use and productivity from 1998 to 2017 and (2) define the redline water withdrawal for crop use (REWCU) to 2030. The study inversely inferred REWCU from broadly-defined available water for crop use (BAWCU) and associated parameters. Of all BAWCU, 66.3% had been consumed by crops, in which rainfall-derived water consumption accounted for 71.7% of it, while the irrigation-derived water consumption represented the remaining 28.2%. Of all the rainfall that was available for crop use, 72.1%, or the rainfall depletion rate, had been actually consumed by crop evapotranspiration (ET). Likewise, 55.2%, or the irrigation depletion rate, had been consumed by crops. Crop water productivity (CWP) measured by crop yield per unit ET was computed for six major crop categories. Five broad scenarios have been formulated—business as usual, optimistic, deliberative optimistic, pessimistic, and deliberative pessimistic—under lower, higher, and average population and crop projections, respectively. The projected REWCU was 4166.30 × 108 m3, and the projected agricultural water withdrawal was 4629.22 × 108 m3 to 2030, representing 66.1% of the projected nationwide redline total water withdrawal (RETWW) of 7000 × 108 m3. The study used CWP and BAWCU to inversely infer REWCU since they reflect diverse biophysical and management factors and can be used as reliable proxies. Both methodology and research results may offer references and support when making nation- and region-wide water-for-food decisions by crop and water administrations.
1. Introduction
Crop production requires immense water use and consumption. Limited water supply will severely constrain high-yield and quality crop outputs. Economic growth and urbanization would squeeze agricultural water withdrawals, due to ever-increasing inter-sector claims and competition from manufacturers, cities, and other value-added water use sectors [1,2]. Addressing delicate equilibriums and trade-offs among food, water, and ecosystems has already been and will be a major hurdle to cross for Chinese researchers and policy makers.
Most of the previous studies regarding China’s water for food have been focused principally on water for irrigation. However, the emerging mindset innovation in global water management communities in the most recent 30 years have rendered a suite of novel ideas and concepts available for approaching water for food, and water for life [3,4]. Of particular attention are green water and blue water [5,6,7], net/effective irrigation efficiency or beneficial irrigation efficiency [8,9], water productivity and its inverse, water footprints [10,11], and virtual water flows accompanying global and regional food trade [12]. An integrated analytical framework has thus been called for to address complicated water and food problems and challenges presented to China, and to the globe as well [13,14].
China’s water for food has been receiving ever increasing attention [10]. Some literature focused on footprints of green, blue, and grey waters [15,16], while some attempted to document historical irrigation water changes based on multiple-year irrigation district datasets [17]. Few, if not at all, studies attempted to answer explicitly a research question such as ‘how much water is required for crop production in the years to come?’. Therefore, the current research intended to close such a gap, the distinction of which is that it adopted an inverse inference approach to derive crop water consumption and its two components, i.e., green water and blue water. Crop water productivity (CWP) herein in this research is defined as the economic yield of a particular crop or an aggregate of crops divided by the water depleted in producing it as measured by actual evapotranspiration. CWP has been widely used to measure ‘crop per drop’ and it is a comprehensive reflector of diverse biophysical and management elements [9] and can be used as a reliable proxy in assessing water withdrawal requirements for crop production.
The Chinese population is projected to peak at around 1.6 billion in 2030 and decline afterwards [18]. Producing enormous and diversified amounts of food (i.e., cereals, vegetables, dairies, meats, eggs, fruits etc.) demanded by such a huge population would require an enormous amount of water had water use efficiency and productivity not considerably been improved [19]. In 2013, the Chinese State Council issued a directive stipulating the strictest water use, in which the concept of the ‘redline’ for water withdrawal and use efficiency was first proposed and officially proclaimed by the Chinese central government [20]. The ‘redline’ encompasses three groups of indicators: available water for withdrawal; water use efficiencies; and criteria for controlling water quality. According to the directive, the target water withdrawal to the year 2030 is set at 7000 × 108 m3, which is also termed redline for total water withdrawal (RETWW). However, the inter-sector split of the RETWW had not been explicitly defined, thus giving rise to such questions as ‘What is the lower- and upper-bound water requirements for crop production to 2030 under the quadruple squeeze of manufacturing, urbanization, ecosystem conservation, and environmental protection?’. It is the major research and policy making question presented to China’s security of food, water, and ecosystems. Hence, the paper proposed an integrated analytical framework incorporating key concepts and ideas in paradigm shifts in global water research and management communities in the most recent thirty years. Proceeding from a newly-proposed concept of broadly-defined available water for crop use (BAWCU), the research set up a procedure to determine redline water withdrawal for crop use (REWCU) in China to 2030. Hence, the objectives of the current research are to (1) track the trajectory of Chinese crop production and its associated water use and consumption in the recent twenty years from 1998 to 2017 and (2) to define and propose a redline water withdrawal for crop production in China to 2030 conditioned by a nationwide and all-sector-wide redline water withdrawal.
2. Materials and Methods
2.1. Developing Redline of Water Withdrawal for Crop Use (REWCU)
Water withdrawal for agriculture represented some 70% of total water withdrawal for human use at a global level, varying with countries of differing biophysical and socio-economic conditions [21]. The share of agriculture water withdrawal in China has been continuously declining from 69.3% in 1998 to 62.3% in 2017. Most parts of agricultural water withdrawal have been consumed in cropland irrigation, varying with provinces from 62.2% to 98.2%, with a nationwide average of 86.0% [22]. Traditional assessment on agriculture water use had been always focusing on irrigated water (e.g., irrigation efficiencies of varying forms, such as the ratio of water delivered to water depleted). However, the effective rainfalls that are directly received by cropland have been playing a crucial role in determining crop outputs at both farmers’ field and region levels. That part of water had been nevertheless neglected in assessing total water available for crop use in forming the final biomass and economic yield. The irrigated water is counted as blue water and the rainfall water entering into cropland soil as green water. Hence, green water played no less important roles in crop production, not only for a rain-fed system, but for an irrigated system as well. The split of blue/green water will be presented in detail in the next paragraph.
Falkenmark first proposed ‘green water and blue water’ to address the eco-hydrologic aspect in water withdrawal for food and for ecosystems [23]. Such a splitting scheme of water broadens the traditional blue-water-centric concept of water resources and highlights green water components in agricultural water assessment. The water resources by convention consider solely the annually renewed overland runoff to surface streams and lakes (i.e., surface flow) upon rainfall and snowmelt events, and the water percolated from the bottom of the soil profiles to aquifers, less the overlaps of the two. That is, all water flowing through earth surfaces and soil profiles to collect in natural or artificial water bodies and aquifers is taken as ‘blue water’, since it can be readily recognized by the human naked eye and looks ‘blue’. Blue water can be directly withdrawn for human use. In addition, any rainfall and snowmelt infiltrating and being retained in the soil profile that could be taken up by roots for plant transpiration and soil evaporation (evapotranspiration, or ET combined) is considered as ‘green water’, since it maintains plant physiological functions of growth and development, and the eco-hydrological functions and services of terrestrial ecosystems (i.e., forests and woodlands, grasses and pastures, wetlands, barren lands etc.). ‘Blue water’ can be sub-split into ‘blue water flow’, either as surface streamflow or ground water flows, and ‘blue water reservoir’, either as water stored in natural lakes/ponds or as water stored in artificial lakes (i.e., reservoirs). ‘Green water’ can be thus sub-split into ‘green water flows’, as either transpiration through stomata of plant leaves or as evaporation from plant canopies and/or soil surfaces, and ‘green water reservoir’, as water stored in soil profiles readily available for uptake of plant roots at a later time.
Splitting water into ‘blue’ and ‘green’ is not of epistemological but of practical significance. Both ‘blue’ and ‘green’ water are keys to sustaining crop growth in agricultural ecosystems. Hence, both green and blue components have to be incorporated into the new generation of agricultural water assessment and evaluation. Following suit of ‘green and blue water’, a newly defined concept herein defined embraced both irrigated ‘blue’ water on cropland and effective ‘green’ precipitation falling straightforwardly on cropland. Broadly-defined available water for crop use (BAWCU) is thus defined as irrigated water delivered to cropland (i.e., the blue water part) plus effective rainfall or snowmelt upon the precipitation event minus surface runoff and the percolation out of the soil profile. BAWCU and its associated parameters 8.
Redline of water withdrawal for crop use (REWCU) is defined as the minimally required water that would be allocated to crop production. REWCU is herein defined in its narrower sense and refers solely to the blue water part of agricultural water withdrawal (i.e., irrigation for major crop categories defined in this research). Its broader sense, however, should comprise both blue and green parts. The redline herein proposed and calculated is based on crop water use and productivity by six major broad crop categories grown in China, i.e., grains, vegetables, oils, sugars, fruits, and cotton. In essence, the REWCU definition is founded upon the theoretical foundation of the blue/green water split and the practical toolkit offered by BAWCU and its associated set of parameters, as can be referred to in the Supplementary Materials. For instance, the blue water component of redline was derived from an inverse inference method based on the blue water contribution rate (BWCR), blue water depletion rate (BWDR), and CWP. As shown in Equation (S12), CWP is the quotient of the crop’s economic yield to the water consumed as measured by actual evapotranspiration in the yield formation (kg m−3). Such a definition of CWP reflects the embodiment of a wide array of biophysical (i.e., climate, crop variety, and cropland quality) and socio-economic (i.e., cropping system and management) factors. Hence, it makes sense to some extent to inversely infer the redline based on BAWCU associated parameters, i.e., BWCR and BWDR, and CWP. To define REWCU is to ensure the minimal water withdrawal for crop use, by taking both green and blue components into account, with the objective of obtaining a higher degree of self-reliance on domestic supply for major agricultural production and 100% self-reliance on domestic supply for edible grain crops in particular. The major working procedures to develop REWCU can also be referred to in the Supplementary Materials.
2.2. Study Area and Data
The study area covered mainland China at the administrative province levels, except Hong Kong and Macao Special Administrative Regions, of which thirteen provinces have major grain production (i.e., granary provinces) and the rest of the provinces have a lesser grain production (i.e., non-granary provinces), were identified. The 13 granary provinces are: Heilongjiang (HLJ), Jilin (JIL), Liaoning (LIN), Inner Mongolia or Nei Mengu (i.e., NMG), Hebei (HEB), Henan (HEN), Shandong (SHD), Jiangsu (JIS), Anhui (ANH), Jiangxi (JIX), Hubei (HUB), Hunan (HUN), and Sichuan (SIC). The rest are non-granary provinces. The granary provinces form an apparent geographic continuum from the Northeast tip (i.e., HLJ) to the southwest hinterland (i.e., SIC) of mainland China, covering a wide array of climatic and biome zones.
The data come mainly from public-domain data platforms, from both China and the globe. A wide array of biophysical data required by hydrological modeling exercises had been collected and processed through Chinese public-domain science data platforms. The socio-economic data associated with water and food came from related administrative and research institutions (i.e., China Meteorological Bureau, Hydrological Bureau of China Ministry of Water Rresources, China Statistics Bureau, China Ministry of Agriculture and Rural Affairs, Chinese Academy of Sciences etc.). The data that had been collected, compiled, and processed contains: water use and consumption at national, basin, and province levels; Chinese agriculture statistics including area under sowing and crop output; irrigation monitoring datasets including irrigation quota for major crops; crop growth monitoring data including dates and duration of key phenology stages for major crops; cropping system data delineating cropping zoning; and a soil moisture monitoring dataset.
3. Results and Discussion
The redline definition for crop production is of major importance to ensure food security in China, at both a nationwide and province-wide level. REWCU refers chiefly to the minimum-required blue water for crop production, which consists of both parts of green water (i.e., effective precipitation received by cropland) and blue water (irrigation delivered to cropland). The redline herein defined is primarily based on five broad crop categories in China, which represents overwhelmingly the majority of nationwide grain crop production and hence the majority of water consumption.
The blue water part in the redline was derived principally from BWCR, BWDR, and CWP. CWP herein refers to the economic yield of grain crops divided by actual evapotranspiration consumed in yield formation as measured by kg m−3, which reflected the combination of a wide array of biophysical variables (i.e., climate, variety/cultivar, soil and land quality etc.) and socio-economic factors (i.e., cropping system and management). The redline for blue water was thus inversely inferred from the aforementioned indicators. More explicitly, total water consumption under a given amount of crop outputs can be obtained by inverting the value of CWP. In addition, the water consumption that is derived from blue water can be attained by multiplying the total water consumption and BWCR, the resulting value of which is divided by BWDR and the gross blue water that would be available for crop use will be gotten. Hence, in theory, the higher the CWP is, along with the lower BWCR and higher BWDR, the lower the REWCU. In addition, the green water part of a more generalized REWCU will be touched upon in future studies for its complexity due to its reliance on rainfall patterns and cropland distribution.
3.1. Crop Outputs and Associated Water Withdrawal, Consumption and Productivity in 1998–2017
The year 1998 witnessed the then peak of gross grain crop outputs, albeit followed by a five-year successive slumping interval. However, from 2004 onward, grain crop output had been resuming its increasing trend as observed by a twelve-year successive skyrocketing. The sowing area under grain crops from 1998 onwards had observed a first-fall-then-increase trajectory, with an overall slight increase from 113,787.4 × 103 hm2 in 1998 to 117,989.06 × 103 hm2 in 2017. The corresponding share of grain crop acreage in gross crop acreage slightly dropped from 73.08% in 1998 to 70.94% in 2017. Meanwhile, other major crops had been changing greatly. Sowing area under vegetables and its share in total crop sowing acreage had been increasing dramatically, with its share improving from 7.08% in 1998 to 13.28% in 2017, almost doubling. For oil crops, it fluctuated from 8.74% to 7.95%, and sugar, 1.21% to 0.93%, and cotton, 3.62% to 1.92%.
The gross grain outputs in the same period had also observed a similar trajectory, from 51,229.53 × 104 Mg in 1998 to 66,160.72 × 104 Mg in 2017, of which the output of four major grain crops (i.e., rice, maize, wheat, and soybean) also follow suit of gross grain output. The share of four grains increased slightly from 89.12% in 1998 to 91.61% in 2017.
Water withdrawal for agriculture had been keeping almost constant from 3766.3 × 108 m3 in 1998 to 3766.4 × 108 m3 in 2017, albeit some obvious inter-year fluctuations in the twenty-year interval. Water withdrawal for agricultural use had fluctuated slightly in the 20 years and had been roughly consistent with both overall water availability and crop production. It first declined from 1998 to 2003, then from 2004 onwards increased a little and kept slight inter-annual variations. The share of agriculture in gross water withdrawal, however, had been continuously declining from 69.3% in 1998 to 62.3% in 2017, meanwhile China’s crop production had been elevating, suggesting a significant improvement in water use efficiencies and productivities.
3.2. Trajectory of BAWCU and Its Associated Parameters in 1998–2017
As already defined, BAWCU consists of two components, i.e., irrigated blue on cropland, and precipitated green on cropland. The relative share of cropland precipitation and irrigation had been varying from 40% to 60%, with an average green water share of 57.9% and blue water share of 42.1%. The maximum share of cropland precipitation was 60.5% in 2012, with the corresponding minimum blue water share of 39.5%. The maximum share of cropland irrigation was 46.2% in 2009, with the corresponding minimum green water share of 53.8%. BAWCU at both nation- and province-wide levels consists of barely less than 60% of green water and a bit more than 40% of blue water, indicating an equally important role played by green water as well as blue water in ensuring China’s food security. The province-wide BAWCU observed that green water share in most provinces all exceeded 50%, with the only exception of Xinjiang, Gansu, Qinghai, and Ningxia that sit in semi-arid and arid Northwest China (Figure 1). The BAWCU composition reinforced the important role played in available water that could and would be utilized by crop production, and BAWCU dynamics revealed also the material foundation for crop production over past twenty years in China.
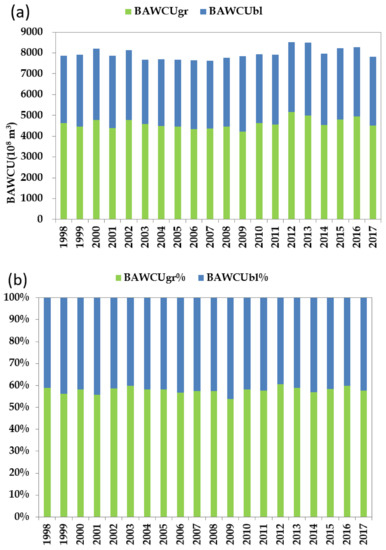
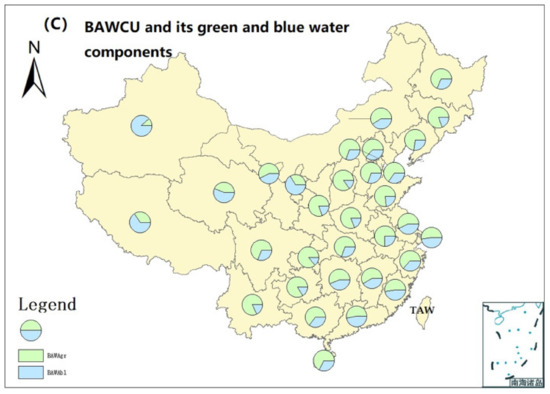
Figure 1.
(a) Chinese nationwide broadly-defined available water for crop use (BAWCU) 1998 to 2017, with its cropland effective rainfall component (BAWCUgr), and cropland irrigation component (BAWCUbl); (b) Share of green water (BAWCUgr%) and blue water (BAWCUir%) in BAWCU. (c) Chinese provincial level BAWCU and its cropland rainfall (green) and cropland irrigation (blue) components.
3.2.1. Green Water and Blue Water Contribution Rate
In this and the next subsection, the contribution and depletion rates of green/blue water will be presented and discussed since they are BAWCU-associated parameters that are keys to defining REWCU. As already defined, the share of green water in grain outputs refers chiefly to the effective-precipitation-derived evapotranspiration in gross evapotranspiration consumed in crop production. Likewise, the share of blue water in crop outputs thus refers to the irrigation-derived evapotranspiration in gross evapotranspiration. The green water contribution rate (GWCR) in crop outputs averaged over the twenty years was 0.717, and the blue water contribution rate (BWCR) was 0.283. Hence, the ratio of green to blue water in crop production was approximately 7:3, as compared to a global average of 8:2 for all countries in the world. As for the province-wide share of green and blue water in grain output averaged over the twenty years, most of the provinces had observed above-50% values in BWCR, with Xinjiang observing the maximum of 82.9% and Guizhou the minimum of 18.29%. Most notable is that green water contributed to more than half of the grain outputs, except Jiangsu, where the blue water share only barely exceeded 50%, suggesting a weighting proportion of green water in grain outputs in granary provinces (Figure 2) As compared to the green/blue composition in BAWCU of 6:4, the blue and green water contribution rate was 7:3, which is consistent with the potential water available for crop use. In addition, regional variations in GWCR and BWCR also reflect regional variations in the green/blue water split in BAWCU, that is, the higher the green water in BAWCU is, the higher the GWCR is, as shown in Figure 1c and Figure 2. For those provinces with BWCR exceeding GWCR, three categories might be roughly identified. The first category belongs to extreme dry climatic zones, such as Xinjiang and Ningxia; the second belongs to main grain production provinces, such as Jiangsu; the third belongs to developed metropolitan crop production types with sophisticated irrigation systems, such as Shanghai, Tianjin, and Beijing(Figure 2). Nevertheless, the overall pattern of Chinese GWCR and BWCR is that green water contributed more to crop production than blue water.
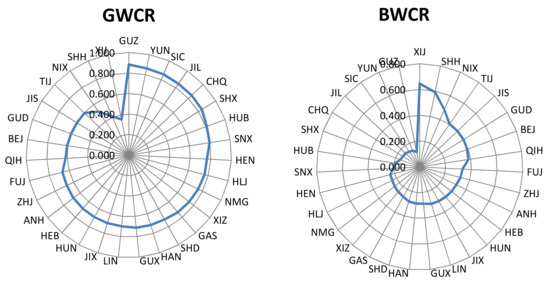
Figure 2.
Green water contribution rate (GWCR) and blue water contribution rate (BWCR) to crop production in Chinese provinces averaged over 1998–2017. The average GWCR is 70.1% and BWCR is 29.9%, approximately with a ratio of 7:3 of green/blue.
3.2.2. Green Water and Blue Water Depletion Rate in Crop Production
The blue water depletion rate (BWDR) refers principally to the irrigation-derived evapotranspiration divided by irrigation delivered to cropland, while the green water depletion rate (GWDR) is the precipitation-derived evapotranspiration divided by effective precipitation falling on cropland. The provincial level GWDR was, on the whole, higher than that of BWDR, indicating an already-high level of rainfall water use efficiency in most granary provinces, as well as in some non-granary provinces. Also notable is that water-short granary provinces such as HEB, NMG, SHD, and HEN had already observed a BWDR approaching 0.70 or beyond. The rest of the granary provinces all exceeded 0.50. GWDR in most provinces still have substantial room for improvement (Figure 3).
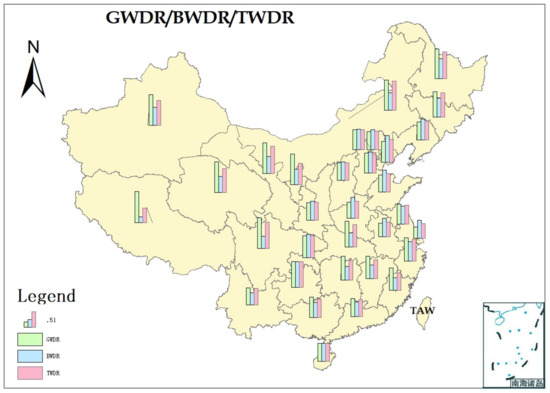
Figure 3.
Chinese provincial level green water depletion rate (GWDR) and blue water depletion rate (BWDR) to crop outputs. GWDR refers to rainfall-derived evapotranspiration divided by effective rainfall entering into soil on croplands, BWDR refers to irrigation-derived evapotranspiration divided by gross irrigation delivered to croplands. TWDR refers to all evapotranspiration consumed in crop production divided by BAWCU.
3.2.3. Water Consumption and Productivity of Major Crop Categories
Water consumption herein refers principally to the evapotranspiration actually consumed in biomass/economic yield formation. Crop water productivity is thus measured by economic yield divided by evapotranspiration. The paper herein reported CWP for five broad crop categories (i.e., grain crops, vegetable crops, oil crops, sugar crops, fruits, cotton), which represent approximately 97.0% of total sowing areas in the country. The total water consumption as measured by actual evapotranspiration in yield formation has fluctuated from 6867.8 × 108 m3 in 1998 to 7057.3 × 108 m3 in 2017 (Figure 4).
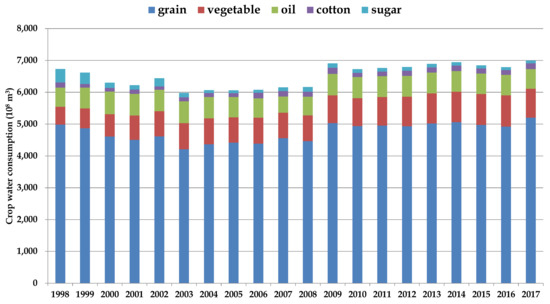
Figure 4.
Chinese crop-specific and total crop water consumption from 1998 to 2017.
CWP for grain crops had increased from 0.989 kg m−3 in 1998 to 1.257 kg m−3 2017, increasing by 27.1%. Water footprint (WFP) is the inverse of CWP and the corresponding value was 1011.12 m3 Mg−1 and 795.7 m3 Mg−1, respectively. Other crops, such as vegetables, oils, sugars, and cotton, had also increased by 18.41%, 46.89%, 27.77%, and 35.04%, respectively, as shown in Table 1.

Table 1.
Chinese crop-specific crop water productivity (CWP) statistics from 1998 to 2017.
3.3. Determining REWCU to the Year 2030
REWCU Determination Based on BAWCU Parameters and CWP
The research used a twenty-year trajectory in China’s crop production and its associated water consumption to project future REWCU. The twenty years of crop production can be split clearly into two sub-periods, i.e., 1998–2003, and 2004–2017. The first period had followed a gradual declining trend in crop outputs, while the second resumed the increasing trend. The year of 1998 had witnessed an unprecedented historical grain crop output, however, followed immediately by a falling year of 1999. Such a relatively prolonged sub-period of a dropping in grain outputs had alerted the Chinese central government, and a wide array of policies and administrative directives had been issued to halt that trend, in which the redline for arable land acreage (i.e., 18 yimu, or 120,000 × 103 hm2), was proposed, defined, and strictly observed. Since 2004, China’s grain outputs had been continuing to increase to 2017, albeit a slight decline in 2016. The first sub-period was thus considered as an abnormal interval. Hence, water for food in this sub-period was dropped out in the formulation of baseline scenarios of water for food to 2030. The research used the mean, maximum, and minimum in the sub-period of 2004–2017 to represent the CWP situations to 2030, which seem more sensible projections based on the past trajectory. The multiple-year BWCR, GWCR, BWDR, and GWDR were subjected to descriptive statistics, i.e., maximum, minimum, and average values, while projection of BWDR and GWDR were also calculated based on their twenty-year trajectories, respectively. Both BWCR and GWCR are subjected to diverse biophysical, managerial, and socio-economic factors involved in crop production, hence, the average values of them in the past twenty years are assumed to reflect the past and projection to the next ten or twenty years. CWP of major crop categories were also subjected to descriptive statistics, with projections to 2030 based on their past twenty-year trajectories. All related settings on above parameters can be referred to Supplementary Materials Table S1.
Based on an authoritative research conducted by the Chinese Academy of Engineering in 2000 [17] (Table 2), the Chinese population will be projected to reach 1.51 billion under the lower scenario (LS) or 1.61 billion under the higher scenario (HS) in 2030, with an average of 1.56 billion (average of low and high scenario, ALH), as shown in Table 2. Correspondingly, outputs of major crop categories were also projected based on per capita diet needs.
Table 2.
Projection on the Chinese population and its major crop demands in 2030 with a low scenario (LS), a high scenario (HS), and the average of the LS and HS (ALH) (after and modified according to [17].
Through combining past twenty-year trajectories and projections in BAWCU-associated parameters, CWP, and projections of population and crop production requirements, the current research developed five scenarios of crop production and their respective water consumption and withdrawal requirements under different situations of CWP and BWDR for six major crop categories, as shown in Table 3. Five broad scenarios were formulated to take the aforementioned factors into account, i.e., business as usual (BAU), optimistic (OPM), deliberative optimistic (DOM), pessimistic (PEM), and deliberative pessimistic (DPM). Scenario BAU assumed that the year of 2030 has similar conditions in BAWCU-related parameters and CWP. The BAWCU-related parameters and CWP of 2017 would be kept unchanged up to year 2030, hence, the CWP and BWDR of all crop categories in 2030 were set at the same value of those in 2017. OPM assumed that the situations in 2017 would develop linearly into 2030 with an average annual increasing rate that has already been attained in the past twenty years from 1998 to 2017, therefore, CWP of grain crops was set as 1.481 kg m−3 based on 1.257 kg m−3 in 2017, and BWDR was set as 0.624 based on its value in 2017. Scenario DOM assumed that the maximum BWDR and CWP that have occurred in the period 1998–2017 would also take place in 2030, with CWP and BWDR being set as 1.257 kg m−3 and 0.582 for grain crops, for instance. PEM assumed that the worst situations in both BWDR and CWP would occur, while scenario DPM dampens that gloomy picture by assuming that the average-level BWDR and CWP over the past twenty years would be projected to 2030. Under each broad scenario, three sub-scenarios were divided with respect to low (LS), high (HS), and average (ALH) scenarios of projected population and crop production to 2030. Hence, in total, 15 scenarios were formulated in the current research, as shown in Table 3. As in Table S1, only five sub-scenarios were presented, i.e., five major scenarios with ALH.
Table 3.
Scenario formulation and calculation on crop water consumption and requirements to 2030.
Under scenario BAU-ALS, water withdrawal requirements (WWR) for major crop categories were 4172.91 × 108 m3. Under OPM, WWR were 3325.8 × 108 m3, while DOM were 4159.69 × 108 m3. WWR under PEM were 5908.10 × 108 m3, and that under DPM 4931.05 × 108 m3. If assumed that the most optimistic and pessimistic would least likely occur, then when defining REWCU, WWR under the remaining three scenarios would be averaged to reflect a more likely occurring combined scenario. Hence, by averaging over BAU-ALS, DOM-ALS, and DPM-ALS, WWR of 2030 would most likely be 4421.22 × 108 m3. That is the most probable REWCU in 2030. When considering the past twenty-year trajectory and trend in share of irrigation in agricultural water withdrawal (AWW), i.e., 90.0%, the projected AWW would be around 4900 × 108 m3. Moreover, when taking the redline for total water withdrawal (TWW) for 2030 (i.e., 7000 × 108 m3) into account, the share of AWW in TWW would be 70%, in contrast to the averaged 65% in the past twenty years. When only taking BAU-ALS and DOM-ALS into account, REWCU and AWW and AWW/TWW would be 4166.30 × 108 m3, 4629.22 × 108 m3, and 66.1%, respectively.
4. Implications for China
China’s water for food is of great concern for both researchers and policy makers in the country, however, most of the recent research regarding crop water requirements had focused the study on irrigation response of single-handedly specific crops [24] to climate change [25] at a region or river basin scale [26,27] across various climate zone in China [28]. Most of the currently available research regarding China’s future water for food had tackled the problem with the coefficient of irrigation water use, along with an irrigation quota for crops [29]. However, a few, if not at all, redline-related studies used a single-handedly past-based projection to define the redline, e.g., the annual deficit for agricultural water withdrawal at a nationwide scale in China is 3000 × 108 m3, and the AWW since 1997 had been stabilizing roughly around 3700 × 108 m3. Considering the future water demands and water saving potentials, the redline of AWW will possibly range over 3700 × 108 m3 to 3900 × 108 m3, with an average of 3800 × 108 m3 [27,30]. Though such a projection gave a similar value to that of this study, the methodology used by this study has incorporated more factors into the projection, such as CWP and BAWCU-related parameters, i.e., GWC, BWCR, GWDR, and BWDR. CWP or water footprints of major crop categories obtained in this study have been subjected to comparison with other similar studies regarding global [31] or Chinese [32] CWP or WFP research. The comparisons revealed that CWP or WFP obtained in this study had similar CWP or WFP with other studies. However, REWCU defined herein, though based on a sound theoretical foundation and rigorous calculations, still has uncertainties that need addressing in subsequent research. Besides defining nationwide redline water for crop production, its province-wide counterparts also need to be addressed, e.g., splitting nationwide values into province-wide ones. The China State Council stipulated that the efficient irrigation coefficient be 0.53 in 2015. Additionally, our calculation result of BWDR in 2015 was 0.562, even though the two indicators cannot be simply subjected to direct comparison. The effective irrigation coefficient refers to the efficiency of delivered irrigated water to cropland, while BWDR refers to the ratio of actual ET in water that has been delivered to cropland, which is more relevant to evaluate the relationship between irrigated water and its productive parts. Moreover, based on a twenty-year trajectory, BDWR in 2030 would be 0.624. The redline defined in the study has been compared with that obtained by Shi and Lu [18], projecting that crop irrigation water requirements of China to the year 2030 would be 4011 × 108 m3, a bit of lower than that of this study, i.e., 4166.30 × 108 m3. However, the distinction of this study is that it explicitly takes both green and blue water into its analytical framework, which could be expanded to embrace broader sensed agricultural water use and management in future research.
5. Conclusions
This study presented first time results on the minimal or redline water withdrawal requirements for China’s crop production to the year 2030, based on a green water and blue water approach developed within an agro-hydrological modeling framework and associated parameters, i.e., BAWCU, BWCR, GWCR, BWDR, GWDR, CWP or WFP etc. The results were consistent with other similar studies. The distinction of the study is that it adopted an approach incorporating a paradigm shift of water management in agriculture in the recent decade, and developed an inverse inference method to assess irrigation requirements for crop production, simply projecting the past trajectory into the future. However, even though such an inverse inference method has obtained a sensible outcome, it needs refining in terms of its underlying mechanisms, especially the attribution factors driving CWP and other BAWCU-related parameters.
Supplementary Materials
The following are available online at https://www.mdpi.com/2071-1050/12/10/4188/s1, Figure S1: Roadmap of redline definition, Figure S2: Three sets of indicator system for China’s nationwide redline for water resource development and use, which is stipulated by China State Council and supervised by China Ministry of Water Resources, Table S1: BAWCU related indicators and CWP for major crop categories in 1998-2017, and Methodology.
Author Contributions
The research of this paper was conducted by F.H., who contributed to the conceptualization, methodology, software, model running, calibration, validation, data curation, original draft preparation, and editing. B.L. contributed to conceptualization, reviewing and revising, supervision, and funding acquisition. All authors have read and agreed to the published version of the manuscript.
Funding
This research was co-funded by National Agricultural Technology Extension Services (NATES), China Ministry of Agriculture and Rural Affairs (CMARA), grant number 15198015, and National Key Research and Development Program of China, grant number 2016YFD0300801.
Acknowledgments
Thanks Yulan Shen, MS graduate student of CAU for her data collection and processing jobs related to the study.
Conflicts of Interest
The authors declare no conflict of interest. The funders had no role in the design of the study; in the collection, analyses, or interpretation of data; in the writing of the manuscript, or in the decision to publish the results.
References
- Strzepek, K.; Boehlert, B. Competition for water for the food system. Philos. Trans. R. Soc. B Biol. Sci. 2010, 365, 2927–2940. [Google Scholar] [CrossRef] [PubMed]
- Pereira, L.S. Water, agriculture and food: Challenges and issues. Water Resour. Manag. 2017, 31, 2985–2999. [Google Scholar] [CrossRef]
- Molden, D.; Oweis, T.; Steduto, P.; Bindraban, P.; Hanjra, M.A.; Kijne, J. Improving agricultural water productivity: Between optimism and caution. Agric. Water Manag. 2010, 97, 528–535. [Google Scholar] [CrossRef]
- Rockström, J.; Karlberg, L.; Wani, S.P.; Barron, J.; Hatibu, N.; Oweis, T.; Bruggeman, A.; Farahani, J.; Qiang, Z. Managing water in rainfed agriculture-the need for a paradigm shift. Agric. Water Manag. 2010, 97, 543–550. [Google Scholar] [CrossRef]
- Chukalla, A.D.; Krol, M.S.; Hoekstra, A.Y. Green and blue water footprint reduction in irrigated agriculture: Effect of irrigation techniques, irrigation strategies and mulching. Hydrol. Earth Syst. Sci. 2015, 19, 4877–4891. [Google Scholar] [CrossRef]
- Karimov, A.; Molden, D.; Khamzina, T.; Platonov, A.; Ivanov, Y. A water accounting procedure to determine the water savings potential of the Fergana Valley. Agric. Water Manag. 2012, 108, 61–72. [Google Scholar] [CrossRef]
- Kumar, M.D.; van Dam, J.C. Drivers of change in agricultural water productivity and its improvement at basin scale in developing economies. Water Int. 2013, 38, 312–325. [Google Scholar] [CrossRef]
- Jägermeyr, J.; Gerten, D.; Schaphoff, S.; Heinke, J.; Lucht, W.; Rockström, J. Integrated crop water management might sustainably halve the global food gap. Environ. Res. Lett. 2016, 11, 25002. [Google Scholar] [CrossRef]
- Huang, F.; Li, B. Assessing grain crop water productivity of China using a hydro-model-coupled-statistics approach. Part I: Method development and validation. Agric. Water Manag. 2010, 97, 1077–1092. [Google Scholar] [CrossRef]
- Huang, F.; Liu, Z.; Ridoutt, B.G.; Huang, J.; Li, B. China’s water for food under growing water scarcity. Food Secur. 2015, 7, 933–949. [Google Scholar] [CrossRef]
- Blatchford, M.; Karimi, P.; Bastiaanssen, W.G.M.; Nouri, H. From global goals to local gains—A framework for crop water productivity. ISPRS Int. J. Geoinform. 2018, 7, 414. [Google Scholar] [CrossRef]
- Hoekstra, A.Y.; Chapagain, A.K.; van Oel, P.R. Advancing water footprint assessment research: Challenges in monitoring progress towards sustainable development goal 6. Water 2017, 9. [Google Scholar] [CrossRef]
- Feng, H.; Baoguo, L. Assessing grain crop water productivity of China using a hydro-model-coupled-statistics approach. Part II: Application in breadbasket basins of China. Agric. Water Manag. 2010, 97, 1259–1268. [Google Scholar] [CrossRef]
- Rockström, J.; Karlberg, L. The quadruple squeeze: Defining the safe operating space for freshwater use to achieve a triply green revolution in the anthropocene. Ambio 2010, 39, 257–265. [Google Scholar] [CrossRef] [PubMed]
- Liu, J.; Yang, H. Spatially explicit assessment of global consumptive water uses in cropland: Green and blue water. J. Hydrol. 2010, 384, 187–197. [Google Scholar] [CrossRef]
- Zhuo, L.; Mekonnen, M.M.; Hoekstra, A.Y.; Wada, Y. Inter-and intra-annual variation of water footprint of crops and blue water scarcity in the Yellow River basin (1961–2009). Adv. Water Resour. 2016, 87, 29–41. [Google Scholar] [CrossRef]
- Sun, S.; Wu, P.; Wang, Y.; Zhao, X.; Liu, J.; Zhang, X. The temporal and spatial variability of water footprint of grain: A case study of an irrigation district in China from 1960 to 2008. J. Food Agric. Environ. 2012, 10, 1246–1251. [Google Scholar]
- Shi, Y.L.; Lu, L.S. (Eds.) China Agricultural Water Requirements and Water-Saving and Efficiency Agricultural Development; China Water Conservancy and Hydropower Press: Beijing, China, 2000. (In Chinese) [Google Scholar]
- Molden, D.; Frenken, K.; Barker, R.; Fraiture, C.; de Mati, B.; Svendsen, M.; Sadoff, C.; Finlayson, C.M.; Attapatu, S.; Giordano, M. Water for Food, Water for Life: A Comprehensive Assessment of Water Management in Agriculture; Earthscan: London, UK, 2007. [Google Scholar]
- China State Council. Directive on Implementing the Strictest Water Red-Line; Xinhua News Agency: Beijing, China, 2012.
- UNFAO. AQUASTAT. Available online: http://www.fao.org/nr/water/aquastat/data/query/results.html (accessed on 3 March 2020).
- China Ministry of Water Resources. China Annual Water Resources Bulletin; China Water Conservancy and Hydropower Press: Beijing, China, 2018.
- Falkenmark, M. Meeting water requirements of an expanding world population. Philos. Trans. R. Soc. London B 1997, 352, 929–936. [Google Scholar] [CrossRef]
- Wang, W.; Yu, Z.; Zhang, W.; Shao, Q.; Zhang, Y.; Luo, Y.; Jiao, X.; Xu, J. Responses of rice yield, irrigation water requirement and water use efficiency to climate change in China: Historical simulation and future projections. Agric. Water Manag. 2014, 146, 249–261. [Google Scholar] [CrossRef]
- Ye, Q.; Yang, X.; Dai, S.; Chen, G.; Li, Y.; Zhanga, C. Effects of climate change on suitable rice cropping areas, cropping systems and crop water requirements in southern China. Agric. Water Manag. 2015, 159, 35–44. [Google Scholar] [CrossRef]
- Yang, Y.; Yang, Y.; Moiwo, J.P.; Hu, Y. Estimation of irrigation requirement for sustainable water resources reallocation in North China. Agric. Water Manag. 2010, 97, 1711–1721. [Google Scholar] [CrossRef]
- Jiang, W.L. Research and propspects on agricultural water use threshhold that is to support food security. Agric. Prospects 2010, 9, 23–25. (In Chinese) [Google Scholar]
- Liu, B.; Zhao, W.; Chang, X.; Li, S.; Zhang, Z.; Du, M. Water requirements and stability of oasis ecosystem in arid region, China. Environ. Earth Sci. 2010, 59, 1235–1244. [Google Scholar] [CrossRef]
- Cao, X.; Wang, J.; Chen, X.; Gao, Z.; Yang, F.; Shi, J. Multiscale remote-sensing retrieval in the evapotranspiration of Haloxylon ammodendron in the Gurbantunggut desert, China. Environ. Earth Sci. 2013, 69, 1549–1558. [Google Scholar] [CrossRef]
- Luo, Q.Y.; Gao, M.J.; Jiang, W.L.; Tao, T.; Tang, Q. Study on resources threshold values based on agricultural comprehensive production capability security in China. Res. Agric. Mod. 2010, 4, 392–396. (In Chinese) [Google Scholar]
- Mekonnen, M.M.; Hoekstra, A.Y. Water footprint benchmarks for crop production: A first global assessment. Ecol. Indic. 2014, 46, 214–223. [Google Scholar] [CrossRef]
- Zhuo, L.; Mekonnen, M.M.; Hoekstra, A.Y. The effect of inter-annual variability of consumption, production, trade and climate on crop-related green and blue water footprints and inter-regional virtual water trade: A study for China (1978–2008). Water Res. 2016, 94, 73–85. [Google Scholar] [CrossRef]


© 2020 by the authors. Licensee MDPI, Basel, Switzerland. This article is an open access article distributed under the terms and conditions of the Creative Commons Attribution (CC BY) license (http://creativecommons.org/licenses/by/4.0/).