Abstract
The application of passive design strategies in ships, such as the use of superstructures with high thermal insulation, allows the energy demand of heating, ventilation, and air conditioning systems to be reduced. There is a knowledge gap in the scientific literature on the possibilities to thermally characterize superstructures. Knowing such possibilities would make a methodology available for the quality control of naval constructions and for the inspection of the appropriate state of insulations in existing ships. For this purpose, a total of three different typologies of ship superstructures were monitored, and the data obtained were analyzed by using various existing approaches for the thermal characterization of façades: the heat flow meter method and temperature measurement methods. The results showed that the heat flow meter method constitutes a valid methodology to obtain representative results. In addition, guaranteeing a thermal gradient dependent of the wall typology and placing probes in zones not influenced by thermal bridges ensure that representative results are achieved.
1. Introduction
The shipping industry is made up of two clearly different groups of ships according to their activity (cargo and passenger ships). Cargo ships constitute 90% of the goods transport on the planet [1], whereas passenger or tourist ships have greatly increased in recent years. It is estimated that approximately 10 million people annually travel on more than 230 cruise ships all around the world [2]. An essential aspect in both types of ships is that the crew or users are accommodated in accommodation spaces meeting certain thermal comfort features. For this purpose, naval architects are based on some aspects of design, such as the thermal insulation of bulkheads and the use of heating, ventilation, and air conditioning (HVAC) systems.
A characteristic aspect of the operation of ships is the need of burning fossil fuels for the energy consumption of the ship, thus generating greenhouse gas emissions and other types of emissions which cause the acidification of the water. As for merchant ships, it is estimated that emissions cause up to 3% of the overall carbon dioxide emissions [3,4], and the level of emissions is similar to that of countries such as Germany and Japan [5].
Currently, there is a wide regulatory framework of the emissions of ships to reduce the impact of the shipping industry [6]. In this regard, the body responsible for the regulation in the transport industry is the International Maritime Organization (IMO), which introduced two new effective policy mechanisms in the year 2013 to reduce greenhouse gas emissions in the shipping industry: the Ship Energy Efficiency Management Plan and the Energy Efficiency Design Index. The goal was to reduce greenhouse gas emissions by 80% with respect to the year 2010 to keep the overall temperature increase below 2 °C [7]. Regardless of these aspects, the design of ships with a better energy efficiency is of great interest to economic investors as the value of ships in the market is improved [8].
In relation to the energy consumption of ships, the energy demand to acclimate the internal spaces of the accommodation spaces is among the main energy demands in ships [9,10], with a higher incidence in ships with large accommodation spaces [11,12]. The main goal of these systems is to ensure that the thermal conditions inside ships are appropriate [13]. It is important to consider that both the crew and passengers are most of the time in their cabins, so the thermal comfort of internal spaces should be guaranteed [13,14,15]. The thermal comfort should not be undervalued by the designers of ships as it affects occupants’ satisfaction [16] and health [17], as well as the productivity of the crew [18].
The accommodation spaces of ships should therefore meet similar thermal conditions to those of buildings [19]. However, the energy demand and the environmental impact of a ship is different from those of buildings, so a fundamental goal is the reduction of the load required for HVAC systems.
For this purpose, a common practice is the use of highly insulating designs in the superstructures of accommodation spaces, thus better keeping appropriate internal thermal conditions and reducing the energy demand of HVAC systems. In this regard, there is a practice similar to that used in buildings by improving the thermal properties of the envelope, such as the thermal transmittance, regulated by the regulation in many countries of building energy efficiency [20]. An essential aspect of thermal properties is the possibility to thermally characterize the built elements as a methodology of quality control. In this sense, aspects such as execution defects, the lack of homogeneity of the insulating material or damages in walls could affect thermal properties [21,22,23]. Therefore, the use of thermal characterization methods could be an opportunity for engineers of quality control to verify whether superstructures have been built with respect to the project specifications, and whether, as for existing ships, their thermal performance is acceptable. Nevertheless, there is a lack of studies focused on the thermal characterization of superstructures of accommodation spaces in ships. This aspect is different with regard to the building sector, since the experimental methods of the thermal transmittance (e.g., the method from International Organization for Standardization (ISO) 9869-1 [24]) have been discussed in many research studies from the end of the 20th century [25,26,27] to nowadays [28,29,30,31]. In situ measurements have proved their usefulness to determine the current thermal performance of construction elements in existing buildings and as quality control in new buildings.
For this reason, this study makes a practical application of the methods to characterize the thermal transmittance used in the superstructures of accommodation spaces in ships. For this purpose, three different typologies of ship superstructures were monitored, and the data obtained were analyzed by using different approaches. Likewise, the effect of placing the probes in zones of the superstructures affected by thermal bridges was assessed. It is important to stress that this research is not focused on the insulating elements of engine rooms and of thermal engines of ships, although the methodological principles of this research could be applied to the bulkheads of these rooms provided that they are in contact with the external air and not with water.
The structure of this paper is as follows: Section 2 reviews the methods to characterize the thermal transmittance and correlations for the internal convective heat transfer coefficient used; Section 3 describes the methodology of the research by providing greater specifications of the case studies, as well as the criteria for placing the probes and for the data analysis; Section 4 analyses and discusses the results; and Section 5 summarizes the main conclusions of the study.
2. Methods to Characterize the Thermal Transmittance in Vertical Elements
2.1. The Heat Flow Meter Method and Temperature Measurement Methods
The methods to characterize the thermal transmittance in vertical elements could be grouped in two typologies [32,33]: the heat flow meter method and temperature measurement methods (e.g., the thermometric method and quantitative methods of infrared thermography).
The heat flow meter method is included in ISO 9869-1 [32]. Among the different data analysis procedures included in ISO 9869-1, the average method is among the most used. The average method considers that the average of the instantaneous values of heat flux and the average of the internal–external temperature differences reduces the oscillations and leads to a steady state:
where (W/m2) is the density of the heat flow rate per unit area, and and (K) are the external and internal ambient temperatures, respectively.
Therefore, the heat flow meter method is characterized by measuring the heat flux going through the vertical element. However, some research studies have reflected limitations in the heat flux measurement. Trethowen [34], Desogus et al. [35], Cesaratto et al. [36] and Cucumo et al. [37] reported the distortions generated in the heat flux by placing the plate. Another important aspect is the reduction of the error as it is not necessary to use the plate. In this regard, Peng and Wu [38] showed that the main contribution to the error in thermal transmittance results is due to the heat flux measurement. Cucumo et al. [37] indicated the significant influence of placing the plate to correctly measure the heat flux. Then, Cucumo et al. [39] determined that the deflections of the heat flux could be up to 30%. In another study, Meng et al. [40] established that the maximum error due to the placing of the plate could be up to 26%. It is important to stress that the greater the size of the heat flux plate, the lower the error associated with its placing [40]. Ficco et al. [31] showed and quantified an exhaustive list of different uncertainty contributions and the measurements to reduce the error. Some of the main error sources are related to the heat flux, such as the bad contact between the plate and the surface analyzed (with contributions between 2% and 5%) and the two-dimensionality of the heat flux (with contributions between 1% and 5%).
Due to this circumstance, a series of methods based on the measurement of different temperatures in the vertical element have emerged in recent years [32,33]. These methods are based on Equation (1) and should measure both the heat transfer by convection in the surface element and the radiation exchange between the internal surface and its surroundings (see Equation (2)).
where is the heat flux of the vertical element (W/m2), is the heat flux by convection (W/m2), and is the heat flux by radiation (W/m2).
where (dimensionless) is the emissivity of the element analysed, is the surface temperature of the element (K), and is the internal convective heat transfer coefficient (W/(m2·K)).
Both methods allow representative results to be obtained in a similar way to the results obtained in the laboratory [41], despite the limitations of both the heat flow meter method and the temperature measurement methods. However, it is necessary to guarantee the fulfilment of a series of factors when conducting tests. One of the main aspects is to ensure a high thermal gradient to obtain representative results. In this respect, Desogus et al. [35], Albatici and Tonelli [42], and Ficco et al. [31] established that guaranteeing a high gradient between the internal and external temperatures allows the error to be reduced in the measurement. For this purpose, the filtering of the data obtained ensures the use of data with a high thermal gradient [36,43]. Precipitations, snow, and moisture also significantly influence the u-value. Water has a higher thermal conductivity than the usual construction materials, so its presence could change the thermal behavior of the wall [44]. In this regard, the presence of moisture and freezing could imply considerable variations in the thermal transmittance value with respect to the same wall under normal conditions [29,44,45]. Finally, it is also necessary to consider the influence of the orientation on the thermal transmittance value. Ahmad et al. [46] showed that the walls facing south, east, and west present a greater heat flux than those facing north, thus obtaining deviations greater than 37.3%.
2.2. Expressions for the Convective Term
One of the main varieties of temperature measurement methods is due to the expression used to characterize . For this purpose, there are different values and expressions included in the scientific literature. ISO 6946 [47] establishes that the internal convective heat transfer coefficient has a value of 2.5 W/(m2·K) in typical vertical elements under construction and under typical conditions of using internal spaces (i.e., internal air-conditioned spaces, with a temperature close to 20 °C). A similar value is included in ISO 9869-1. This standard sets that the usual value assumed by the convective coefficient is 3.0 for vertical surfaces.
However, there are other types of expressions based on the correlations obtained by experimental tests. Previous studies have successfully evaluated the possibility of characterizing the convective heat transfer coefficient in walls [48]. For this study, the expressions included in the following publications were considered: (i) Alamdari and Hammond [49], (ii) Churchill and Chu [50], (iii) Holman [51], (iv) Fohanno and Polidori [52], (v) Earle [53], (vi) Giesecke [54], (vii) Khalifa and Marshall [55], and (viii) Wilkes and Peterson [56].
Alamdari and Hammond [49] used the correlation used by Churchill and Usagi [57] to develop an expression for the internal convective coefficient for walls located in rooms naturally ventilated under a turbulent and laminar flow (Equation (6)). This correlation is designed for all the possible options of the numbers of Prandtl and Rayleigh.
where (m) is the height of the element analyzed, and (K) is the difference between the internal surface temperature and the internal air temperature.
Another different proposal for the whole range of numbers of Prandtl and Rayleigh was provided by Churchill and Chu [50], who suggested a formulation for the natural convective coefficient in vertical elements (Equation (7)), although in this case, the equation is quite different from that proposed by Alamdari and Hammond.
On the other hand, Holman [51] (Equation (8)), Fohanno and Polidori [52] (Equation (9)), and Earle [53] (Equation (10)) developed specific correlations for uniformly heated internal surfaces of vertical elements. The expressions vary depending on the value of the number of Rayleigh, so, for this study, a laminar flow was considered as it is the most adapted to the case studies analyzed.
Finally, Giesecke [54] (Equation (11)), Fohanno and Polidori [55] (Equation (12)), and Wilkes and Peterson [56] (Equation (13)) proposed similar equations to those of Holman and Fohanno and Polidori, but without considering a characteristic dimension.
3. Methodology
In this study, both Equations (1) and (5) were used to analyze the possibilities of the thermal characterization of the vertical elements of ships. As for Equation (5), all convective coefficients described in Section 2.2 were used. Equations (14)–(23) represent the expressions of thermal transmittance for each value or correlation used for the convective coefficient.
The methodological framework of this research was established by the workflow included in Figure 1. First, a representative sample of 3 ships was selected. The accommodation spaces of these ships should have different insulation configurations in the respective superstructure, whose technical documentation on the disposition of the different materials’ layers was available (e.g., the project of the ship). Further, case studies with an acceptable conservation state were selected to guarantee no alterations in the thermal properties of the project data (e.g., the ageing of materials which could change the thermal conductivity value included in the project [31]). Therefore, ships whose accommodation spaces were recently built were selected: an offshore fishing boat, a suction dredger, and a tank ship (see Figure 2). Figure 3 indicates the constructive composition and the thermal properties of the 3 superstructures analyzed. It is important to stress that these superstructures correspond to accommodation spaces in contact with the air. This research is therefore not aimed at thermally characterizing the elements of the ship in contact with the water. To carry out the tests, a data logger (ALMEMO 2590-4AS) with thermocouples (T 190-2) and a plate (FQA018C) were used (see Table 1). Probes were placed according to the following criteria [32]: (i) a total of 3 sensors of internal surface temperature were placed at a height of 1.5 m, at a distance of 15 cm, and joint by a heat-conducting adhesive; (ii) the plate was also placed at a height of 1.5 m; and (iii) the thermocouples to measure the ambient temperature were put at a height of 1.5 m and horizontally separated from the wall at a distance of 30 cm. Figure 4 shows an example of how the probes were placed. Measurements were conducted during a period of 3 days in the case studies A and B, and of 7 days in the case study C. Tests were carried out when ships were not navigating, and the time of data acquisition was 5 min.
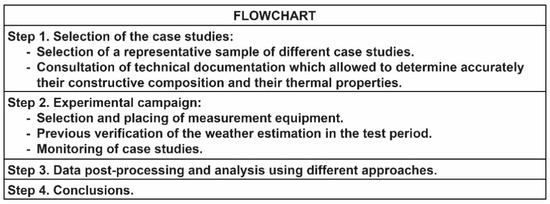
Figure 1.
Workflow of the research.
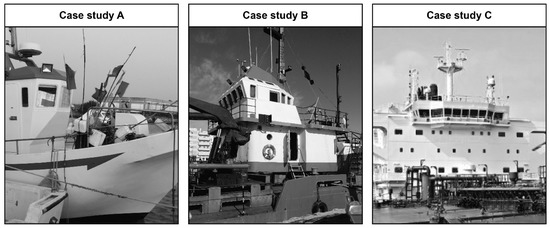
Figure 2.
Case studies that have been analyzed.
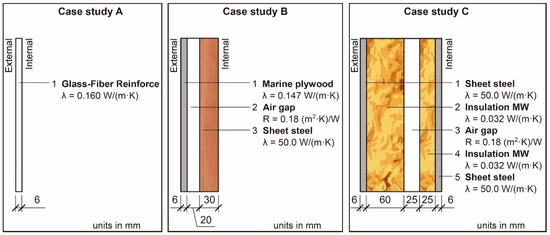
Figure 3.
Thermophysical properties of the superstructures analyzed.

Table 1.
Main technical specifications of the equipment employed.
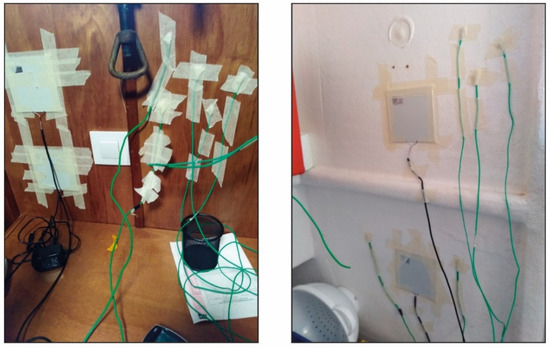
Figure 4.
The placing of probes in the case studies.
It is also worth stressing that before placing the probes, the possible presence of thermal bridges in the internal layer was assessed to avoid putting the probes near to them (e.g., steel studs for the placing of the layer of the internal finish). For this purpose, the infrared camera was used as Figure 5 shows. The emissivity was determined by the procedure of a contact thermometer indicated in ASTM E1933 [58]. As the range of the internal temperature in internal spaces did not present great variations, it could be considered that the emissivity did not vary [59], so the emissivity was only determined once during the test.

Figure 5.
Assessment of thermal bridges in the internal part of the accommodation space of case study 3.
Finally, the data post-processing and analysis were conducted in the environment of the statistical programming R. The results were obtained by using Equation (1) and the equations from Table 1. Likewise, due to the recommendations of several authors of filtering data when there is a high thermal gradient [34,60], this study analyzed, before obtaining the results, the filtering of data required to optimize the adjustment degree of the results with the reference value. For this purpose, the filtering of data with an increase of 0.5 °C was assessed. To guarantee a more detailed application of the Equations (14)–(23), it is supposed that the reflected apparent temperature was equal to the internal temperature used, thus guaranteeing that all equations use the same dataset.
To determine the validity of the results obtained by the different approaches for the method, the criterion from ISO 9869-1 was used. This criterion considers valid results of the experimental methods when there is a difference () lower than 20% between the value estimated by ISO 6946 and that obtained by the experimental method (Equation (24)). The theoretical value of ISO 6946 is obtained by Equation (25)).
where and ((m2·K)/W) are, respectively, the internal and external surface thermal resistances obtained by the tabulated values from the standard ISO 6946, and is the thermal conductivity of the material (mK/W).
4. Results and Discussion
As indicated in Section 3, data post-processing was performed using various criteria of data filtering according to the thermal gradient between the internal and the external temperature. Therefore, the thermal gradients obtained in the three tests were analyzed. Case study A obtained values of the thermal gradient lower than 2.5 °C, case study B obtained values lower than 5 °C, and case study C obtained values lower than 8 °C. For this reason, the criterion of data filtering varied in the three case studies:
- (1)
- As for case study A, a total of four different filtering was applied with the following limit values: 0.5, 1.0, 1.5, and 2.0 °C;
- (2)
- As for case study B, a total of nine different filtering was applied with the following limit values: 0.5, 1.0, 1.5, 2.0, 2.5, 3.0, 3.5, 4.0, and 4.5 °C;
- (3)
- As for case study C, a total of 14 different filtering was applied with the following limit values: 0.5, 1.0, 1.5, 2.0, 2.5, 3.0, 3.5, 4.0, 4.5, 5.0, 5.5, 6.0, 6.5, and 7.0 °C.
After the analysis, the thermal transmittance results were obtained with the various equations. Figure 6 shows the thermal transmittance results obtained with the various equations in the three case studies, as well as the theoretical value and the acceptability range of 20%. Further, Figure 7 represents the percentage deviations obtained with respect to the reference value in the three case studies. The results obtained in these three case studies presented different behaviors between the results of the heat flow meter method and the temperature measurement method. In this regard, the heat flow meter method was characterized by obtaining results within the limits of acceptability in the three case studies, whereas the behavior of Equations (14)–(23) was different: case study B did not obtain representative results, whereas case studies A and C obtained results with deviations lower than 20%. In the equations of the temperature measurement method obtaining valid results, the use of the equation for the convective coefficient of Giesecke and of Wilkes and Peterson allowed representative results to be obtained in case study A (with percentage deviations of −6.7% and −3.5%, respectively). Likewise, these two approaches for the convective term again obtained representative results in case study C, together with the equation of Khalifa and Marshall and the theoretical values included in ISO 6946 and ISO 9869−1 (in this case, percentage deviations oscillated between −17% and 15.6%). It is also important to stress that, in one case, the temperature measurement method obtained a more adjusted result than the heat flow meter method: in case study A, Equation (23) obtained a percentage deviation of −3.5%, whereas it was of −3.7% in the heat flow meter method. This is useful to prove that, although the heat flow meter method was characterized by obtaining a greater performance than the temperature measurement methods, the use of some equations of the latter could constitute a valid methodology for engineers responsible for the thermal assessment of superstructures when a heat flux plate is not available.

Figure 6.
Comparison of the thermal transmittance results obtained by the various approaches in the 3 case studies. The black line represents the reference value obtained by ISO 6946, and the shady zone and discontinuous lines represent the acceptability line and its limits, respectively.

Figure 7.
Heat map with the percentage deviation between the measured value and the reference value obtained by the various approaches in the 3 case studies. The grey color corresponds to percentage deviations greater than the limit value of acceptability (20%).
In addition, the increase in the data filtering implied a decrease in the thermal transmittance value obtained in the tests in most expressions. The application of the minimum filtering considered in the research (>0.5 °C) led to obtaining greater thermal transmittance values in most cases, except the equations of the temperature measurement method in case study A. In general terms, the use of a high data filtering led to obtaining more adjusted results in the heat flow meter method. Only in case study B, the use of a high data filtering generated an excessive increase in the percentage deviation with respect to the reference value because of the low number of instances of the dataset compiled fulfilling this filtering condition. This same aspect was found in most equations of the temperature measurement method obtaining representative results, since the use of a data filtering obtained more representative results. These results are in accordance with the criteria defined by some authors in the application of the methods in building façades [32,33]. However, the criterion of data filtering could vary according to the wall typology, so that walls with a high thermal transmittance (such as case study A) require a lower data filtering, whereas in walls with a low thermal transmittance, the criterion of data filtering should use a high thermal gradient.
Anyway, these results are useful to show the possibilities to thermally characterize the superstructures of accommodation spaces in ships, so the fulfilment of the technical features of the thermal properties of these elements could be checked. The results showed that the heat flow meter method constitutes one of the most appropriate options to be used due to the adjusted results obtained in the three case studies. The approach of the temperature measurement methods could also be used if there is adequate knowledge on the convective term most adapted to ship superstructures.
Based on these results, the possible influence of the thermal bridge on the performance of the test was analyzed. As mentioned in Section 3, tests were carried out in zones of the superstructures not influenced by thermal bridges, following the criteria defined in the research on thermal transmittance methods in buildings [32,33]. However, there is no evidence of how these thermal bridges influence the tests conducted in ship superstructures. For this purpose, a new test was performed in case study C, as it was the element in which the greatest influence of thermal bridges was found through infrared thermography (see Figure 8). Probes were placed in the junction zone between the bulkhead and the floor, as well as near to the corner. The test was carried out with the same duration of the monitoring of case study C and with the same probes. Figure 9 includes the results obtained by the various equations analyzed. The placing of probes in the zone near to the thermal bridge generated that none of the results could be considered as representative. In this regard, the most favorable result obtained a percentage deviation with respect to the reference value of 45.7% with the heat flow meter method. Furthermore, the increase of the error associated with the test was different according to the approach and equation used (see Figure 10). The heat flow meter method was characterized by obtaining a lower increase in the percentage deviation by placing the probes in the zone influenced by the thermal bridge, with an increase oscillating between 48.65% and 58.75%, whereas the temperature measurement methods obtained greater increases. In these methods, Equations (20) and (23), which obtained representative results in case studies A and C, were more influenced by placing the probes in the zone of the thermal bridge, with an increase in the percentage deviation which oscillated between 404.44% and 486.58%. Therefore, these results showed that the placing of probes in zones affected by the thermal bridge was implied in all cases to obtain non-representative results. The effect of the thermal bridge was greater in the temperature measurement methods than in the heat flow meter method, so a fundamental requirement to use thermal characterization methods in ship superstructures is that the probes are not placed in zones affected by thermal bridges, thus guaranteeing that the results are representative.
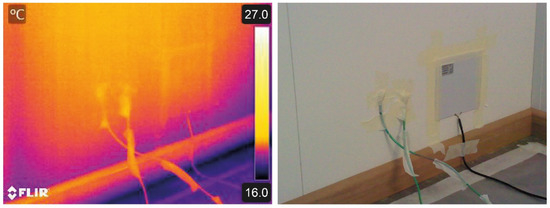
Figure 8.
The placing of probes to verify the effect of carrying out the test in the zone with a thermal bridge.

Figure 9.
Comparison of the thermal transmittance results obtained by the different approaches in the zone with thermal bridge of case study C. The black line represents the reference value obtained by ISO 6946, and the shady zone and discontinuous lines represent the acceptability line and its limits, respectively.

Figure 10.
Comparison of the percentage deviation between the measured value and the reference value obtained by the different approaches in the test carried out in the zone not influenced by the thermal bridge (continuous line) and the zone influenced (discontinuous line).
These results could be used to prove the possibility to use methods to characterize the thermal transmittance, which are commonly used in buildings, in the superstructures of accommodation spaces in ships. In addition, these results make it possible to apply other test methods highly used in buildings, such as the airtightness testing of windows by using the blower door [61].
5. Conclusions
This study assesses the possibility of the application of thermal characterization methods of buildings in the superstructures of accommodation spaces in ships. For this purpose, a total of three different typologies of ship superstructures were monitored, and the data obtained were analyzed by using various existing approaches for the thermal characterization of façades: the heat flow meter method (included in ISO 9869-1) and temperature measurement methods. Based on the results, the following conclusions were drawn:
- (1)
- The heat flow meter method was the approach presenting a greater potential of use in ships as it obtained results within the limits of acceptability in the three case studies monitored;
- (2)
- The temperature measurement methods had a variable behavior in the tests, although some case studies obtained representative results. In this regard, case study A obtained a low percentage deviation with respect to the reference value. Although these methods are not a methodology, such as the heat flow meter method, they could be an optional methodology for engineers responsible for assessing the thermal properties of ship superstructures. Given the influence of the equation used for the internal convective heat transfer coefficient, new studies should be conducted to determine the expression which is best adapted to this approach. In this regard, the approach through dimensionless numbers should be analyzed similarly to what has been done in the quantitative infrared thermography method in buildings [62];
- (3)
- The progressive increase in the data filtering in the post-processing led to a decrease in the thermal transmittance value obtained, thus achieving more adjusted results in the heat flow meter method. It was also found that the criterion of data filtering could vary according to the layers of the superstructure, so that superstructures with a high thermal transmittance require a lower thermal gradient (greater than 2 °C), and those with a low thermal transmittance require a higher thermal gradient (greater than 5 °C);
- (4)
- The effect of placing the probes in zones affected by the thermal bridge could lead to obtaining non-representative results. In this regard, the results obtained in this research have shown that placing the probes in the zone influenced by the thermal bridge of the junction of the bulkhead with the floor were not representative with any approach. There was an increase in the percentage deviation greater than 50% with respect to that obtained in the zone not influenced by the thermal bridge. Likewise, this effect influenced the temperature measurement methods more than the heat flow meter method, although the results were not valid in none of them. Therefore, a fundamental requirement to use these methods in ship superstructures is that probes are not placed in zones affected by thermal bridges. For this purpose, the infrared thermography could be an effective technique to find the most adequate zone to place probes, similarly to this research.
To conclude, the results obtained in this research could be useful for engineers of quality control to verify whether superstructures have been built with respect to the project specifications and whether, as for existing ships, their thermal performance is acceptable. In addition, a greater control of the existing superstructures would ensure that the thermal properties of the envelope of the accommodation spaces in ships are appropriate so that the consumption of HVAC systems is not high, guaranteeing that the environmental impact of ships is lower and facilitating the achievement of the decarbonization goals set for being fulfilled throughout the 21st century in the shipping industry.
Author Contributions
Conceptualization, D.B.-H. and J.M.; methodology, D.B.-H.; software, C.E.R.-J.; validation, D.B.-H. and C.E.R.-J.; formal analysis, F.J.B.R.; investigation, D.B.-H. and J.M.; resources, A.M.-R.; data curation, D.B.-H.; writing—original draft preparation, D.B.-H., J.M. and C.E.R.-J.; writing—review and editing, D.B.-H. and J.M.; visualization, D.B.-H.; supervision, A.M.-R. All authors have read and agreed to the published version of the manuscript.
Funding
This research received no external funding.
Conflicts of Interest
The authors declare no conflict of interest.
References
- International Maritime Organization. Maritime Facts and Figures. Available online: https://imo.libguides.com/c.php?g=659460&p=4655523 (accessed on 20 May 2020).
- Riola, J.M.; de Arboleya, M.G. Habitability and personal space in seakeeping behaviour. J. Marit. Res. 2006, 3, 41–54. [Google Scholar]
- International Maritime Organisation. Third International Maritime Organisation Greenhouse Gases Study; Technical Report; International Maritime Organisation: London, UK, 2014.
- Vergara, J.; McKesson, C.; Walczak, M. Sustainable energy for the marine sector. Energy Policy 2012, 49, 333–345. [Google Scholar] [CrossRef]
- Olivier, J.G.J.; Janssens-Maenhout, G.; Muntean, M.; Peters, J. Trends in Global CO2 Emissions; PBL Netherlands Environmental Assessment Agency: The Hague, The Netherlands, 2015. [Google Scholar]
- Armellini, A.; Daniotti, S.; Pinamonti, P.; Reini, M. Evaluation of gas turbines as alternative energy production systems for a large cruise ship to meet new maritime regulations. Appl. Energy 2018, 211, 306–317. [Google Scholar] [CrossRef]
- Anderson, K.; Bows, A. Executing a Scharnow turn: Reconciling shipping emissions with international commitments on climate change. Carbon Manag. 2012, 3, 615–628. [Google Scholar] [CrossRef]
- Adland, R.; Cariou, P.; Wolff, F.C. Does energy efficiency affect ship values in the second-hand market? Transp. Res. Part A Policy Pract. 2018, 111, 347–359. [Google Scholar] [CrossRef]
- Ancona, M.A.; Baldi, F.; Bianchi, M.; Branchini, L.; Melino, F.; Peretto, A.; Rosati, J. Efficiency improvement on a cruise ship: Load allocation optimization. Energy Convers. Manag. 2018, 164, 42–58. [Google Scholar] [CrossRef]
- Poulsen, R.T.; Sornn-Friese, H. Achieving energy efficient ship operations under third party management: How do ship management models influence energy efficiency? Res. Transp. Bus. Manag. 2015, 17, 41–52. [Google Scholar] [CrossRef]
- Yan, Y.; Zhang, H.; Long, Y.; Wang, Y.; Liang, Y.; Song, X.; Yu, J.J.Q. Multi-objective design optimization of combined cooling, heating and power system for cruise ship application. J. Clean. Prod. 2019, 233, 264–279. [Google Scholar] [CrossRef]
- Trivyza, N.L.; Rentizelas, A.; Theotokatos, G. Impact of carbon pricing on the cruise ship energy systems optimal configuration. Energy 2019, 175, 952–966. [Google Scholar] [CrossRef]
- Liu, H.; Lian, Z.; Gong, Z.; Wang, Y.; Yu, G. Thermal comfort, vibration, and noise in Chinese ship cabin environment in winter time. Build. Environ. 2018, 135, 104–111. [Google Scholar] [CrossRef]
- Ng, A.K.; Ölçer, A.I. A new human comfort model onboard a vessel based on Sugeno type fuzzy inference system. Ocean Eng. 2012, 55, 116–124. [Google Scholar] [CrossRef]
- Palella, B.I.; Quaranta, F.; Riccio, G. On the management and prevention of heat stress for crews onboard ships. Ocean Eng. 2016, 112, 277–286. [Google Scholar] [CrossRef]
- Karmann, C.; Schiavon, S.; Arens, E. Percentage of commercial buildings showing at least 80% occupant satisfied with their thermal comfort. In Proceedings of the 10th Windsor Conference: Rethinking Comfort, Windsor, UK, 12–15 April 2018. [Google Scholar]
- Salata, F.; Golasi, I.; Petitti, D.; de Lieto Vollaro, E.; Coppi, M.; de Lieto Vollaro, A. Relating microclimate, human thermal comfort and health during heat waves: An analysis of heat island mitigation strategies through a case study in an urban outdoor environment. Sustain. Cities Soc. 2017, 30, 79–96. [Google Scholar] [CrossRef]
- Tham, K.W.; Willem, H.C. Room air temperature affects occupants’ physiology, perceptions and mental alertness. Build. Environ. 2010, 45, 40–44. [Google Scholar] [CrossRef]
- Jang, M.S.; Koh, C.D.; Moon, I.S. Review of thermal comfort design based on PMV/PPD in cabins of Korean maritime patrol vessels. Build. Environ. 2007, 42, 55–61. [Google Scholar] [CrossRef]
- Bienvenido-Huertas, D.; Oliveira, M.; Rubio-Bellido, C.; Mar, D. A comparative analysis of the international regulation of thermal properties in building envelope. Sustainability 2019, 11, 5574. [Google Scholar] [CrossRef]
- Taylor, T.; Counsell, J.; Gill, S. Energy efficiency is more than skin deep: Improving construction quality control in new-build housing using thermography. Energy Build. 2013, 66, 222–231. [Google Scholar] [CrossRef]
- Rotilio, M.; Cucchiella, F.; De Berardinis, P.; Stornelli, V. Thermal transmittance measurements of the historical masonries: Some case studies. Energies 2018, 11, 2987. [Google Scholar] [CrossRef]
- Lucchi, E. Thermal transmittance of historical stone masonries: A comparison among standard, calculated and measured data. Energy Build. 2017, 151, 393–405. [Google Scholar] [CrossRef]
- International Organization for Standardization. Part 1: Heat flow meter method. In ISO 9869-1: 2014—Thermal Insulation—Building Elements–In Situ Measurement of Thermal Resistance and Thermal Transmittance; International Organization for Standardization: Geneva, Switzerland, 2014. [Google Scholar]
- McIntyre, D.A. In situ measurement of U-values. Build. Serv. Eng. Res. Technol. 1985, 6, 1–6. [Google Scholar] [CrossRef]
- Siviour, J.B.; Mcintyre, D.A. U-value meters in theory and practice. Build. Serv. Eng. Res. Technol. 1982, 3, 61–69. [Google Scholar] [CrossRef]
- Modera, M.P.; Sherman, M.H.; Sonderegger, R.C. Determining the U-Value of a Wall from Field Measurements of Heat Flux and Surface Temperatures. In Building Applications of Heat Flux Transducers; Bales, E., Bomberg, M., Courville, G.E., Eds.; ASTM International: West Conshohocken, PA, USA, 1985; pp. 203–219. ISBN 978-0-8031-4949-6. [Google Scholar]
- Bienvenido-Huertas, D.; Rubio-Bellido, C.; Pérez-Ordóñez, J.L.; Moyano, J. Optimizing the evaluation of thermal transmittance with the thermometric method using multilayer perceptrons. Energy Build. 2019, 198, 395–411. [Google Scholar] [CrossRef]
- Grubeša, I.N.; Teni, M.; Krstić, H.; Vračević, M. Influence of freeze/thaw cycles on mechanical and thermal properties of masonry wall and masonry wall materials. Energies 2019, 12, 1464. [Google Scholar] [CrossRef]
- Nardi, I.; Paoletti, D.; Ambrosini, D.; De Rubeis, T.; Sfarra, S. U-value assessment by infrared thermography: A comparison of different calculation methods in a Guarded Hot Box. Energy Build. 2016, 122, 211–221. [Google Scholar] [CrossRef]
- Ficco, G.; Iannetta, F.; Ianniello, E.; D’Ambrosio Alfano, F.R.; Dell’Isola, M. U-value in situ measurement for energy diagnosis of existing buildings. Energy Build. 2015, 104, 108–121. [Google Scholar] [CrossRef]
- Bienvenido-Huertas, D.; Moyano, J.; Marín, D.; Fresco-Contreras, R. Review of in situ methods for assessing the thermal transmittance of walls. Renew. Sustain. Energy Rev. 2019, 102, 356–371. [Google Scholar] [CrossRef]
- Teni, M.; Krstić, H.; Kosiński, P. Review and comparison of current experimental approaches for in-situ measurements of building walls thermal transmittance. Energy Build. 2019, 203, 109417. [Google Scholar] [CrossRef]
- Trethowen, H. Measurement errors with surface-mounted heat flux sensors. Build. Environ. 1986, 21, 41–56. [Google Scholar] [CrossRef]
- Desogus, G.; Mura, S.; Ricciu, R. Comparing different approaches to in situ measurement of building components thermal resistance. Energy Build. 2011, 43, 2613–2620. [Google Scholar] [CrossRef]
- Cesaratto, P.G.; De Carli, M.; Marinetti, S. Effect of different parameters on the in situ thermal conductance evaluation. Energy Build. 2011, 43, 1792–1801. [Google Scholar] [CrossRef]
- Cucumo, M.; De Rosa, A.; Ferraro, V.; Kaliakatsos, D.; Marinelli, V. A method for the experimental evaluation in situ of the wall conductance. Energy Build. 2006, 38, 238–244. [Google Scholar] [CrossRef]
- Peng, C.; Wu, Z. In situ measuring and evaluating the thermal resistance of building construction. Energy Build. 2008, 40, 2076–2082. [Google Scholar] [CrossRef]
- Cucumo, M.; Ferraro, V.; Kaliakatsos, D.; Mele, M. On the distortion of thermal flux and of surface temperature induced by heat flux sensors positioned on the inner surface of buildings. Energy Build. 2018, 158, 677–683. [Google Scholar] [CrossRef]
- Meng, X.; Yan, B.; Gao, Y.; Wang, J.; Zhang, W.; Long, E. Factors affecting the in situ measurement accuracy of the wall heat transfer coefficient using the heat flow meter method. Energy Build. 2015, 86, 754–765. [Google Scholar] [CrossRef]
- Lakatos, Á. Comprehensive thermal transmittance investigations carried out on opaque aerogel insulation blanket. Mater. Struct. 2016, 50, 50. [Google Scholar] [CrossRef]
- Albatici, R.; Tonelli, A.M. Infrared thermovision technique for the assessment of thermal transmittance value of opaque building elements on site. Energy Build. 2010, 42, 2177–2183. [Google Scholar] [CrossRef]
- Cesaratto, P.G.; De Carli, M. A measuring campaign of thermal conductance in situ and possible impacts on net energy demand in buildings. Energy Build. 2013, 59, 29–36. [Google Scholar] [CrossRef]
- Litti, G.; Khoshdel, S.; Audenaert, A.; Braet, J. Hygrothermal performance evaluation of traditional brick masonry in historic buildings. Energy Build. 2015, 105, 393–411. [Google Scholar] [CrossRef]
- Björk, F.; Enochsson, T. Properties of thermal insulation materials during extreme environment changes. Constr. Build. Mater. 2009, 23, 2189–2195. [Google Scholar] [CrossRef]
- Ahmad, A.; Maslehuddin, M.; Al-Hadhrami, L.M. In situ measurement of thermal transmittance and thermal resistance of hollow reinforced precast concrete walls. Energy Build. 2014, 84, 132–141. [Google Scholar] [CrossRef]
- International Organization for Standardization. ISO 6946:2007—Building Components and Building Elements—Thermal Resistance and Thermal Transmittance—Calculation Method; International Organization for Standardization: Geneva, Switzerland, 2007. [Google Scholar]
- Szodrai, F.; Lakatos, A. Effect of the air motion on the heat transport behaviour of wall structures. Int. Rev. Appl. Sci. Eng. 2017, 8, 67–73. [Google Scholar] [CrossRef][Green Version]
- Alamdari, F.; Hammond, G.P. Improved data correlations for buoyancy-driven convection in rooms. Build. Serv. Eng. Res. Technol. 1983, 4, 106–112. [Google Scholar] [CrossRef]
- Churchill, S.W.; Chu, H.H.S. Correlating equations for laminar and turbulent free convection from a horizontal cylinder. Int. J. Heat Mass Transf. 1975, 18, 1049–1053. [Google Scholar] [CrossRef]
- Holman, J.P. Heat Transfer, 6th ed.; McGraw-Hill, Inc.: New York, NY, USA, 1986; ISBN 0-07-029620-0. [Google Scholar]
- Fohanno, S.; Polidori, G. Modelling of natural convective heat transfer at an internal surface. Energy Build. 2006, 38, 548–553. [Google Scholar] [CrossRef]
- Earle, R.L.; Earle, M.D. Unit Operations in Food Processing; Pergamon Press: Oxford, UK, 1983. [Google Scholar]
- Giesecke, F.E. Radiant heating and cooling. ASHVE J. Heat. Pipe. Air Cond. 1940, 12, 484–485. [Google Scholar]
- Khalifa, A.J.N.; Marshall, R.H. Validation of heat transfer coefficients on interior building surfaces using a real-sized indoor test cell. Int. J. Heat Mass Transf. 1990, 33, 2219–2236. [Google Scholar] [CrossRef]
- Wilkes, G.B.; Peterson, C.M.F. Radiation and convection from surfaces in various positions. Trans. ASHVE 1938, 44, 513–520. [Google Scholar]
- Churchill, S.W.; Usagi, R. A general expression for the correlation of rates of transfer and other phenomena. AIChE J. 1972, 18, 1121–1128. [Google Scholar] [CrossRef]
- ASTM International. ASTM E1933-14, Standard Practice for Measuring and Compensating for Emissivity Using Infrared Imaging Radiometers; ASTM International: West Conshohocken, PA, USA, 2014. [Google Scholar]
- Maroy, K.; Carbonez, K.; Steeman, M.; Van Den Bossche, N. Assessing the thermal performance of insulating glass units with infrared thermography: Potential and limitations. Energy Build. 2017, 138, 175–192. [Google Scholar] [CrossRef]
- Bienvenido-Huertas, D.; Rodríguez-Álvaro, R.; Moyano, J.J.; Rico, F.; Marín, D. Determining the U-Value of Façades Using the Thermometric Method: Potentials and Limitations. Energies 2018, 11, 360. [Google Scholar] [CrossRef]
- Rodríguez-Jiménez, C.E.; Moyano, J.; Carretero-Ayuso, M.J.; Guillén-Lupiánez, M.I. Methodological proposal for on-site watertightness testing with wind pressure on facade windows. J. Perform. Constr. Facil. 2017, 32. [Google Scholar] [CrossRef]
- Bienvenido-Huertas, D.; Bermúdez, J.; Moyano, J.J.; Marín, D. Influence of ICHTC correlations on the thermal characterization of façades using the quantitative internal infrared thermography method. Build. Environ. 2019, 149, 512–525. [Google Scholar] [CrossRef]


© 2020 by the authors. Licensee MDPI, Basel, Switzerland. This article is an open access article distributed under the terms and conditions of the Creative Commons Attribution (CC BY) license (http://creativecommons.org/licenses/by/4.0/).