Abstract
Walking is the most natural form of moving in everyday life. However, the urban environment is not always safe for walking. Hence, it is appropriate to create pedestrian safety-oriented neighborhood environments to promote walkability. This study identifies factors that can affect the severity of pedestrian injuries by considering and comparing the individual characteristics of pedestrian crashes and the built environment of neighborhoods using a hierarchical model. The main results of this study are as follows. Those under 18 and over 65 years of age, which are recognized as vulnerable road users, are more affected by the neighborhood environments than other age groups. Parks, convenience stores, and restaurants are likely to play a significant role in reducing the severity of pedestrian injuries. However, for pedestrians under 18 years of age, convenience stores that students often visit after school are likely to increase the severity of pedestrian injuries. The severity of pedestrian injuries is likely to be lower at non-signalized crosswalks and intersections than at signalized crosswalks and intersections. The study is expected to contribute to existing literature on the topic and guide policy makers and planners to arrive at consensus approaches when making decisions on how to build pedestrian safety-oriented neighborhoods.
1. Introduction
Walking is the most basic physical activity among the various types of human mobility [1]. Increasing physical activity through walking not only reduces the risk of obesity, cardiovascular diseases, and depression, but also improves muscular and metabolic health [2,3]. Active walking can also help revitalize neighborhoods. Therefore, studies on walking have been conducted in various fields for a long time [4,5,6]. In particular, studies have been conducted to understand the role of the built environment in promoting physical activity through walking [3,4,5,6,7]. Walking takes place mainly on streets and in public community facilities, such as at shopping malls and libraries [7]. Therefore, to build spaces that promote and encourage walking, it is necessary to understand the correlation between walking and the built environment. In particular, for the elderly, certain features of the built environment affect their walking, such as proximity to various destinations, street connectivity, availability of paths for walking, and availability of public transportation facilities [8,9]. The creation of pedestrian-friendly infrastructure, such as well-maintained sidewalks, streetlights, benches, and street trees, has a positive effect on walking among the elderly [9]. Children are also more likely to be affected directly or indirectly by the built environment because they have less autonomy regarding their behavior [10]. Therefore, in the field of public health, it is important to understand how the built environment affects walking activities [11].
Accordingly, various studies have been conducted in South Korea to understand the correlation between walking and the built environment [12,13,14]. In addition, the South Korean government enacted the Pedestrian Safety and Convenience Enhancement Act in 2012 in an attempt to build pedestrian-friendly cities [15]. However, the urban environment is not always safe for walking. Since walking is affected by the safety and comfort of the surrounding environment [1], it is necessary to build a safe walking environment to promote walking. This is particularly critical for children, because a safe walking environment has a significant influence on their choices of means of transportation later in adulthood [16].
Korea’s walking safety, however, is very serious. As of 2016, South Korea had one of the highest rates of deaths per capita due to traffic accidents among member countries of the Organization for Economic Cooperation and Development (OECD) [17]. In particular, pedestrian–vehicle crashes in South Korea are very dangerous: 45% of traffic accident deaths involve pedestrians, a rate much higher than that in other countries in the OECD [17]. The issue of pedestrian–vehicle collisions involving the elderly is also serious. The number of pedestrian accident fatalities among the elderly in South Korea is approximately three times higher than that in other OECD countries [17]. Therefore, creating a safe walking environment to promote walkability is a policy with top priority in South Korea.
However, recent studies related to walking in South Korea tended to focus on identifying factors to improve walking [18,19,20]. In other words, while it is very necessary to build a safe walking environment that promotes walking, little research has been conducted on how factors that enhance walking affect pedestrian safety in South Korea. Moreover, although there are studies on walking by age group, few studies have examined how different age groups are vulnerable in terms of walking safety, even though walking activities vary by age. Responding to this gap in scholarship, this study identifies the individual characteristics of pedestrian crashes and the characteristics of the built environment in neighborhoods that affect the severity of pedestrian injuries by age group, using a hierarchical model to examine a hierarchy of data.
2. Literature Review
Studies on pedestrian–vehicle crashes have been mainly conducted in terms of the frequency of accidents and the severity of pedestrian injuries [21,22]. The focus on factors influencing pedestrian–vehicle crashes has largely been directed toward the environmental characteristics around the location of occurrence and the individual characteristics of the persons involved in the crash. Therefore, the literature review of this study examines the individual characteristics of pedestrian crashes and the built environmental characteristics that affect the severity of pedestrian injuries and walkability.
2.1. Individual Characteristics
The individual characteristics of pedestrian crashes that affect the severity of pedestrian injuries mainly comprise the characteristics of pedestrians, drivers, and crash events when pedestrian crashes occur. For pedestrian characteristics, the gender and age of pedestrians have been mainly considered. In terms of gender, pedestrian injuries have been found to be more severe for women than men in most previous studies [23,24,25,26]. Bae and Park [24] indicated that female pedestrians are 30% less likely to suffer a fatal injury in the event of a pedestrian–vehicle crash than male pedestrians. Verzosa and Miles [27], who conducted a study in Manila in the Philippines, showed that the probability of fatal injury in female pedestrian–vehicle crashes is 0.30 times lower than that in male pedestrian–vehicle crashes. Regarding the age of pedestrians, most studies have shown that the older the pedestrian, the more vulnerable the severity of pedestrian injuries [23,27,28,29]. Interestingly, Ulfarsson et al. [30] found that when an accident occurs due to a pedestrian’s fault, the younger the pedestrian, the higher the severity of the injury; in response, they argued that a campaign to prevent jaywalking needs to be conducted.
In regard to driver characteristics, the gender and age of drivers have been considered in the same way as pedestrian characteristics. Regarding gender, most previous studies found that the severity of pedestrian injuries is likely to be higher if the drivers are men rather than women [31,32,33]. Kim et al. [31] found that male drivers increase the probability of fatal and incapacitating injury by 32% and 25%, respectively. Ko and Park [33] showed that the odds for a fatal injury in pedestrian crashes by male drivers are 1.085 times higher than in those by female drivers.
Among the characteristics of crash events, heavy trucks have been found to increase the severity of pedestrian injuries [29,32]. Haleem et al. [29] found that a 1% increase in the truck increases the probability of severe injuries by 1.37%. However, Eluru et al. [34] conducted a study on the severity of pedestrian injuries in 60 regions of the United States and revealed that pick-up trucks have a negative correlation with the severity of pedestrian injuries.
Regarding weather characteristics, the worse the weather, the more serious the pedestrian injuries [24,33,34,35]. However, some studies asserted that the severity of pedestrian injuries tends to be low when the weather is bad [32,36]. In particular, Yu [36] argued that pedestrians are unlikely to walk and drivers tend to drive less because of poor visibility under inclement weather conditions. Lee and Lee [37], who examined factors influencing the severity of pedestrian injuries by driver’s age group in South Korea, found that drivers 20–30 years old and those over 60 years old are more likely to face a high severity of pedestrian injuries during inclement weather conditions.
In addition, factors such as drinking status [38], driving experience [32], time [39], road structure [40], vehicle age [41], and visibility [42] have been considered as individual characteristics of pedestrian crashes.
2.2. Built Environmental Characteristics Affecting Crashes
Various studies have been conducted to identify the built environmental characteristics of neighborhoods that affect walkability and the severity of pedestrian injuries [43,44,45,46]. These previous studies mainly focused on road, land use, and place factors.
Regarding road characteristics, intersections have been found to increase the severity of pedestrian injuries [34,35,42,47,48]. Heydari et al. [47] argued that proximity to a school is likely to reduce pedestrian safety at nearby intersections. Meanwhile, Xin et al. [48] indicated that 74.3% of elderly pedestrians are more likely to suffer severe injury in intersection-related crashes compared to pedestrians under age 30. However, Guo et al. [49] argued that the traffic situation at intersections tends to be more complicated than that at other roads, and thus vehicle speed may be reduced and the severity of pedestrian injuries is likely to be low. Moreover, research has long considered that intersections are a significant factor in promoting walkability [11,50,51]. Yang et al. [52] found that a higher number of intersections is related to a longer duration of walking for those aged 65 or older in Hong Kong. However, intersections were found to fail to promote walkability for the elderly in their study. Crosswalks have been found to be effective in reducing the severity of pedestrian injuries [29,33,39,53]. However, some studies have obtained a contrasting finding that crosswalks can increase the severity of pedestrian injuries [35,37]. Tay et al. [35] investigated the effect of crosswalks on the severity of pedestrian injuries in South Korea and indicated that crosswalks had a negative effect on the severity of pedestrian injuries. Lee and Lee [37] also indicated that the probability of causing a fatal injury in the pedestrian–vehicle crashes that occur at crosswalks is 1.480 times higher than in those that do not occur at crosswalks. Wang et al. [53] investigated pedestrian red-light violations at signalized crossings and injury severity resulting from pedestrian–vehicle crashes; they indicated that children under 11 years of age are likely to have a higher probability of pedestrian red-light violations and a higher likelihood of severe injuries. Thus, various results have been obtained regarding the effect of crosswalks on the severity of pedestrian injuries, depending on the subject of the study and the characteristics of the study area. In terms of walkability, crosswalks generally have a positive effect on walking [12,54]. Regarding vehicle speed, the faster the vehicle, the higher the severity of pedestrian injuries in most studies [28,29,32,37].
In regard to land use characteristics, Narayanamoorthy et al. [55] found that all residential, commercial, and industrial areas were vulnerable to severe pedestrian injuries regardless of land use type in Manhattan’s 285 census tracts in New York. In contrast, Kim et al. [31], who studied the severity of pedestrian injuries in North Carolina, found that commercial areas increase the probability of fatal injury by 14%. They insisted on the importance of creating a pedestrian-friendly environment in commercial areas for pedestrian safety. Meanwhile, most studies of land use characteristics have mainly focused on residential areas. They indicated that a higher residential density has a positive effect on walkability [50,56]. In contrast, Xu et al. [57] examined the factors affecting recreational physical activity time among 2,375 high school students in Nanjing, China, and found that higher residential density negatively affected recreational physical activity time.
Finally, as mentioned above, to promote walkability, it is necessary to create an environment where pedestrian safety is ensured. However, few studies examined how the factors for improving walkability affect pedestrian–vehicle collisions in South Korea. Therefore, in this study, place characteristics are also considered as factors influencing the severity of pedestrian injuries. Carr et al. [58], who examined the amenities affecting the walk score of 429 residential and non-residential areas in Rhode Island, showed that places related to daily activities, such as food vendors, grocery stores, parks, movie theaters, schools, libraries, fitness facilities, drug stores, and retail shops, all have a positive effect on walking. These results are the same as those obtained by Berke et al. [59], who analyzed grocery stores and restaurants; Moudon et al. [60], who analyzed grocery stores, restaurants, and retail shops; and Li et al. [11], who considered recreational facilities.
The literature review shows that various individual characteristics of pedestrian crashes and the neighborhood environmental characteristics affect the severity of pedestrian injuries. However, the literature review shows that even the same factors have different effects on the severity of pedestrian injuries according to regional and temporal characteristics. In addition, although it is necessary to create a safe pedestrian environment to promote walking, little research has been conducted on how factors that increase walkability affect pedestrian safety. Therefore, to create a pedestrian-friendly city, it is necessary to examine the correlation between factors promoting walkability and the severity of pedestrian injuries. In addition, pedestrians’ physical activities and routine activity areas differ according to their age. Therefore, even in similar accidents and pedestrian crashes occurring in similar environments, the severity of injury to pedestrians varies depending on their age. Accordingly, the main purpose of this study was to examine the differences, in relation to pedestrian age, between the individual characteristics of pedestrian crashes and the characteristics of the built environment of neighborhoods.
3. Data and Methods
3.1. Data
The data on pedestrian–vehicle crashes used in this study were obtained from the Traffic Accident Analysis System (TAAS), which manages and constructs all traffic accident data in South Korea [61]. Spatial data were established by age, as shown in Figure 1, Figure 2 and Figure 3, through the geographic information system (GIS) geocoding tool for pedestrian–vehicle crashes among all traffic accidents that occurred in Seoul over three years during 2015–2017. As the figures show, pedestrian injuries by age occurred widely in all areas of Seoul. Among the 24,826 pedestrian–vehicle collisions, pedestrians were reported as being under the age of 18 in 2472 cases and over the age of 65 in 5257 cases.
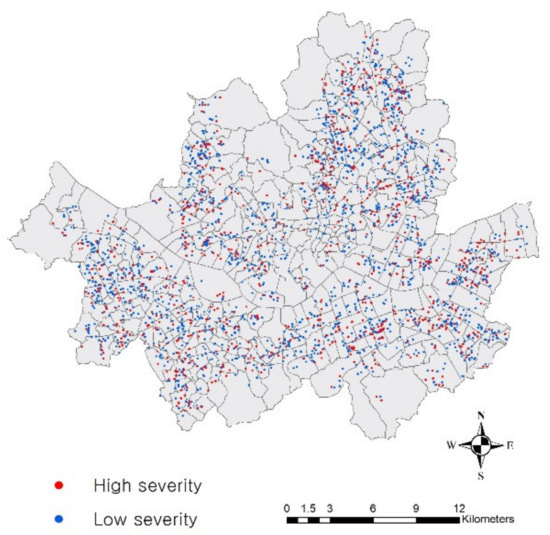
Figure 1.
Pedestrian–vehicle crashes for pedestrians under the age of 18.
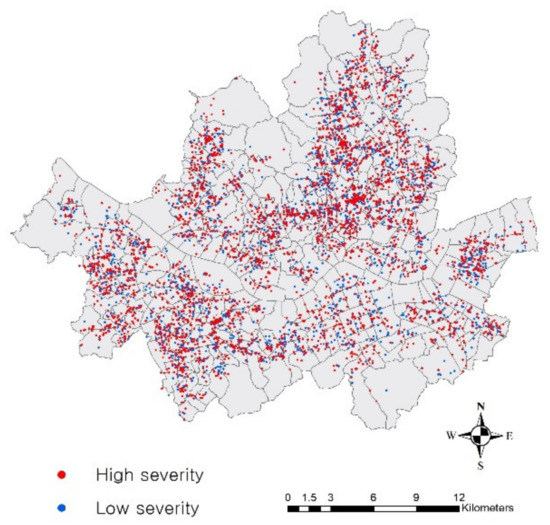
Figure 2.
Pedestrian–vehicle crashes for pedestrians over the age of 65.
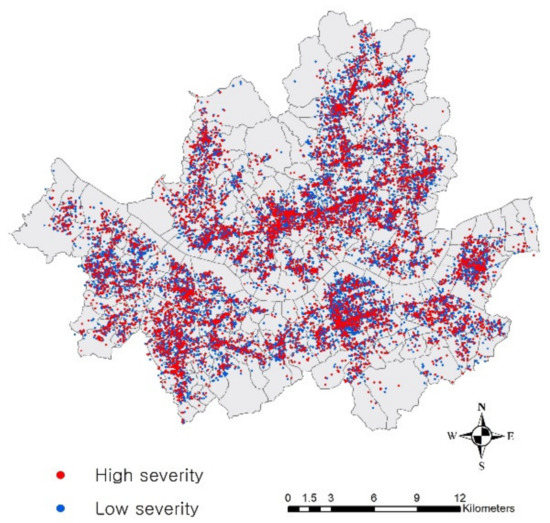
Figure 3.
Pedestrian–vehicle crashes for pedestrians aged 19–64.
To determine the factors that affect the severity of pedestrian injuries, fatal injury accidents were converted to 1 and 0 was allocated otherwise. For the individual characteristics of pedestrian crashes at the lower level, pedestrian factors, driver factors, and crash characteristics were classified using the attributes of pedestrian crash data provided by TAAS.
For neighborhood environmental characteristics at the upper level, road, land use, place, and safety zone characteristics were measured. For the data measurement and analysis of this study, a neighborhood is defined as an administrative district (so-called “hangjung-dong”) which is spatially similar to a census tract. Since administrative districts have different sizes, variables were measured by means of density, proportion, and average. For road characteristics, humps, signalized and non-signalized crosswalks, signalized and non-signalized intersections, and posted speed were considered. For land use characteristics, residential and commercial areas were considered. For place characteristics, parks, convenience stores, and restaurants, which were found to enhance walking in walkability-related studies, were considered. Lastly, this study considered school zones and silver zones, which are representative traffic policies for walking safety in South Korea. Road and place characteristics were evaluated by density measurement; the total number of each variable in a neighborhood was divided by the total area of the neighborhood (i.e., #/km2). Posted speed was defined by the average of the posted speed of all roads in a neighborhood. Land use characteristics were measured by the proportion of each land use type in a neighborhood. Finally, safety zone characteristics were determined by dummy format (i.e., present vs. absent). Table 1 describes the variables and their measurements and classifies the three models used in this study.

Table 1.
Definitions and measures of variables.
3.2. Methods
When analyzing hierarchical data with different levels, assuming that they are at the same level leads to a statistical error in the results [62]. The hierarchical model is used to analyze data with a hierarchical structure to control these statistical errors. For a hierarchical model, a dependent variable is measured at the individual level. However, independent variables are measured at two levels: an individual level at the lower level and a group level at the upper level [62]. Therefore, the hierarchical model allows statistical analysis of the relationships among variables measured at different levels. Each individual is influenced by the characteristics of the group to which that individual belongs, and individuals belonging to a certain group are considered to have characteristics distinct from those belonging to other groups [63].
In this study, a hierarchical model was employed to identify the characteristics of two groups affecting the severity of pedestrian injuries by age. In particular, the hierarchical binomial logistic model was used as a method for estimating the dummy dependent variable model with a hierarchical structure. A traditional logistic regression model cannot consider a hierarchical structure, which is defined by the presence of micro features (lower level) embedded within macro contexts (upper level) [62,64]. The hierarchical model is a statistical method that enables the estimation of parameters that indicate the characteristics of both lower and upper levels at the same time by including different levels of analysis units in one model [62]. The equation for the hierarchical binary logistic model is as follows [64]:
where i indicates the lower level unit; j is the upper level unit; is the probability of a fatal injury; is the odds ratio of a fatal injury; is the intercept; is the vector of individual characteristics at the lower level, which contains the factors of pedestrians, drivers, and crashes; is the vector of the neighborhood environmental characteristics at the upper level, which includes the features of roads, land use, places, and safety zones; and is the random effect of the neighborhood environmental characteristics at the upper level.
4. Results
4.1. Descriptive Statistical Analysis
Table 2 presents descriptive statistics of the severity of pedestrian injuries by age group in Seoul. When a pedestrian–vehicle crash occurred, the probability of a fatal injury was 32% for pedestrians aged under 18 years (Model 1) and 39% for those aged 19–64 years (Model 2). However, when a pedestrian crash occurred with pedestrians aged over 65 years (Model 3), the probability of fatal injury was approximately 63%. Accordingly, it is critical to make efforts to reduce the severity of pedestrian injuries for those aged 65 or older. Regarding pedestrian gender, the severity of injury for male pedestrians was higher in Models 1 and 2. Regarding individual characteristics, pedestrian gender showed that male pedestrians were more vulnerable in Models 1 and 2 (57% and 55% in Table 2, respectively). However, 63% of fatal injuries were female pedestrians in Model 3. The age of drivers involved in pedestrian crashes showed very interesting results. Regardless of the age of pedestrians, driver age averaged 49 years in all models. In the case of driver gender, regardless of the age of pedestrians, approximately 80% of drivers who cause fatal injuries in pedestrian–vehicle crashes were male. In the case of vehicle characteristics, the older the pedestrian, the more likely crashes were caused by heavy vehicles. Regarding weather characteristics, most accidents occurred in clear weather, rather than inclement weather, in all models.
Table 2.
Descriptive statistics.
In regard to the upper-level neighborhood environmental characteristics, there was no significant difference in the overall descriptive statistical analysis regardless of pedestrian age. Regarding road characteristics, in a neighborhood, the average number of humps was approximately 22, average number of signalized crosswalks was approximately 23, and average number of non-signalized crosswalks was approximately 46. In the case of intersections, the average number of signalized intersections in a neighborhood was approximately 44, and that of non-signalized intersections was approximately 161. The average posted speed in a neighborhood was approximately 50 km/hr. In terms of land use characteristics, the average proportion of residential areas in a neighborhood accounted for approximately 71%, while that of commercial areas was approximately 5%. In the case of place characteristics, a neighborhood had, on average, three parks, 14 convenience stores, and 10 restaurants. Regarding safety zone characteristics, the average number of school zones in a neighborhood was 0.97, while that of silver zones was 0.21. As a result, although South Korea has become an aging society, policies and programs for the safety of pedestrians over the age of 65 remain insufficient.
4.2. Results of the Hierarchical Model
Before the hierarchical logistic regression model, a chi-squared statistical test was conducted to determine the appropriateness of the severity of pedestrian injuries according to age group. As a result, the Pearson chi-squared value is 1051.86 and the probability of significance is 0.001, indicating a very high significance. This means that there is a significant difference in the severity of pedestrian injuries according to age group. Table 3 presents the results of the hierarchical binomial logistic regression analysis regarding the severity of pedestrian injuries in Seoul by age group. The interclass correlation coefficient (ICC) is calculated by variances at two levels to examine the average correlation between two measurements made on same subject [36,65]. The higher the ICC value, the more the severity of pedestrian injuries is affected by neighborhood environmental characteristics. The ICC values for the lower and upper levels of explanatory power are 0.040 for Model 1, 0.028 for Model 2, and 0.031 for Model 3. In other words, in all models, the individual characteristics of the pedestrian crashes can better explain the severity of pedestrian injuries than the built environment of neighborhoods. Accordingly, in addition to the physical improvement of neighborhoods, to reduce the severity of pedestrian injuries in Seoul in the future, various policy improvements, such as a traffic safety education programs for pedestrians and drivers, must be implemented. In particular, the ICC values of Model 1 and Model 3 were higher the ICC value of Model 2, which means that the influence of the built environment was somewhat higher in Models 1 and 3. It can be inferred that children and the elderly are more likely to be affected by the built environment because they tend to walk rather than drive cars. This implies that people are influenced differently by the built environment according to age in relation to pedestrian crashes. This suggests that more attention is needed to improve the neighborhood environment to ensure pedestrian safety for vulnerable road users, such as pedestrians who are under 18 and over 65 years of age.
Table 3.
Hierarchical logistic regression analysis.
4.2.1. Indiviual Characteristics
Pedestrian Factors
Regarding pedestrian characteristics, previous studies have shown that female pedestrians are likely to have more severe pedestrian injuries [23,27,35]. However, for pedestrians under the age of 18, this study indicates that pedestrian gender seems to have no association with the severity of pedestrian injuries. Nevertheless, female pedestrians increase the probability of fatal injury 1.205 times and 1.31 times, respectively in Model 2 and Model 3, compared to male pedestrians.
Driver Factors
Regarding driver gender, previous studies did not consider the differences in pedestrian ages and indicated that male drivers were associated with a higher severity of pedestrian injuries [31,35]. However, the results of this study indicate that statistical significance between driver gender and the severity of pedestrian injuries was found only in Model 3. In Model 3, being male increases the likelihood of the driver will cause fatal injury 1.171 times. In addition, the older the driver, the higher the severity of pedestrian injuries in Models 2 and 3. In general, older drivers tend to cause more severe pedestrian injuries because they tend to have a long perception–identification–emotion–volition (PIEV) due to having poorer judgment when sudden situations occur than younger drivers [65]. This interesting finding suggests that it is necessary to examine the direction of driver age and gender in Model 1. Although there is no statistical significance in Model 1, the age and gender of drivers show a negative direction with the severity of pedestrian injuries. In other words, it can be concluded that the combination of younger and/or inexperienced female drivers and pedestrians under the age of 18 may be most likely to result in crash.
Crash Factors
In the case of crash characteristics, most previous studies have shown that the severity of pedestrian injuries is higher for heavy vehicles [28,29]. This study, which classified pedestrian age, also shows that vehicle type has an association with the severity of pedestrian injuries. Heavy vehicles increase the probability of fatal injury 1.371 times and 1.194 times, respectively, in Model 1 and Model 2. However, they lead to less severe pedestrian injuries in Model 3. It can be inferred that community facilities frequented by the elderly are located on neighborhood streets where passenger vehicles largely run at low speeds. Accordingly, pedestrian protection facilities, such as fences, should be installed to protect children and adolescents from heavy vehicles.
Regarding weather, there was no statistical significance in Model 1. However, in Model 2 and Model 3, inclement weather increases the likelihood of fatal injury 1.253 times and 1.332 times, respectively. This is the same result as in most previous studies regarding the weather [24,29,35]. However, as noted above, Yu [36], who conducted a study on the severity of pedestrian injuries in Austin, Texas, argued that neither pedestrians nor drivers tend to go out when the weather is bad, and thus the severity of pedestrian injuries is likely to be low. In addition, Jang [66] argued that pedestrian injury is likely to be more serious on a clear day because drivers may pay less attention when driving. Overall, however, most studies, including this study, found that the severity of pedestrian injuries is likely to be high in inclement weather. In general, during inclement weather, it is more difficult for both the driver and pedestrians to have as clear a view as they would otherwise. Therefore, during inclement weather, it is necessary to expand the traffic safety facilities and lighting facilities to ensure good visibility so that drivers can recognize pedestrians from afar. In addition, traffic regulations are required for drivers, such as turning on headlights during the day if the weather is not good.
4.2.2. Neighborhood Environmental Characteristics
Road Characteristics
Regarding road characteristics, this study obtains an unexpected finding: humps were found to increase the severity of pedestrian injuries in Models 2 and 3. One increase in hump per kilometer increases the probability of fatal injury 1.003 times and 1.004 times, respectively, in Models 2 and 3. In general, humps are recognized as traffic safety facilities that decrease vehicle speed to reduce the severity of pedestrian injuries. According to a survey on the safety status of humps in South Korea, less than 40% of the speed bumps meet the installation standards of a hump [67]. This may indicate that most humps in South Korea do not function properly as traffic safety features, thus threatening the safety of drivers and pedestrians. Accordingly, to reduce the severity of pedestrian injuries, it is necessary to strengthen the installation and management of humps.
Crosswalks and intersections were analyzed by dividing them into those with and without traffic signals to more closely consider their impacts on the severity of pedestrian injuries. First, in the case of crosswalks, previous studies have shown that crosswalks are likely to reduce the severity of pedestrian injuries [24,29,33,39]. However, this study indicates that signalized crosswalks have no association with the severity of pedestrian injuries. An interesting result is that crosswalks without traffic signals can decrease the severity of pedestrian injuries in Models 1 and 3. For example, adding one crosswalk without traffic signals in a neighborhood can decrease the likelihood of fatal injury 0.004 times in the model of children and adolescent pedestrians. This finding suggests that pedestrians tend to be more careful when crossing at non-signalized crosswalks. Regarding intersections, previous studies have shown that intersections are likely to increase the severity of pedestrian injuries [34,35,42]. This study obtains an intriguing finding that intersections with traffic signals are likely to increase the severity of pedestrian injuries, while non-signalized intersections seem to decrease the severity of pedestrian injuries in Model 1. In particular, in Model 3, intersections with or without traffic signals have no associations with the severity of pedestrian injuries. Similar to the case of crosswalks, both drivers and pedestrians seem to pay more attention to traffic safety at intersections without traffic lights.
Furthermore, many previous studies on road characteristics have indicated that the higher the vehicle speed, the higher the severity of pedestrian injuries [21,24,28,29]. On the other hand, this study shows that the higher the posted speed, the higher the severity of pedestrian injuries only occurs in Model 3. In the model of pedestrians over 65 years of age, a speed increase of 1 km/hr increases the likelihood of fatal injury 1.017 times. A possible explanation for this finding is that older people tend to react relatively slowly during sudden situations compared with people of other ages. As Table 2 shows, elderly people are more likely to have a risk of fatal injury when a pedestrian crash occurs compared with other age groups. Therefore, there is a need to reduce vehicle speed through traffic calming programs such as mini roundabouts and chicanes in places where the elderly usually conduct their daily activities.
However, the silver zones, one of South Korea’s representative pedestrian safety policies, do not present significant results in either model. Therefore, to implement practical pedestrian safety policies around facilities for the elderly, it is necessary to not only designate safety zones but also develop various effective policies and programs.
Land Use Characteristics
In the case of land use characteristics, residential areas do not show a statistically significant association with the severity of pedestrian injuries in all models. On the other hand, commercial areas show a statistically significant association only in Model 2. The more commercial areas in a neighborhood, the higher the severity of pedestrian injury. A 1% increase in commercial area in a neighborhood increases the probability of fatal injury 1.004 times in the model of pedestrians aged 19–64 years. This is the same result obtained by the previous studies [44,55]. A possible explanation for this finding is that those aged 19–64 are the most active compared with the other age groups in commercial areas. Therefore, it is necessary to build a pedestrian safety policy such as pedestrian-oriented streets to reduce the severity of pedestrian injuries in commercial areas.
Place Characteristics
Parks, convenience stores, and restaurants, which are the basis of daily activities, have a positive effect on walkability [11,68,69,70]. This study was conducted to determine whether factors that have a positive effect on walkability also positively affect pedestrian safety. Apart from statistical significance, parks, convenience stores, and restaurants all show negative direction with the severity of pedestrian injuries. For example, adding one park to a neighborhood can decrease the likelihood of fatal injury 0.047 times in children and adolescent pedestrian crashes. Therefore, it may be worth paying attention to walking-focused places to create a safe walking neighborhood. However, convenience stores were found to have a serious effect on pedestrian injuries in Model 1. Meanwhile, adding one convenience store to a neighborhood increases the probability of fatal injury 1.016 times in the model of pedestrians under 18 years old. In South Korea, students frequently visit convenience stores around their schools to quickly purchase snacks or simple meals after school. Moreover, in Model 1 with children and adolescents, the more parks there are in a neighborhood, the lower the severity of pedestrian injuries.
Safety Zone Characteristics
Finally, regarding the characteristics of safety zones, which are one of the South Korea’s leading pedestrian safety policies, both school zones and silver zones were not found to have a statistical association with the severity of pedestrian injuries. It should be noted that both types of zones, regardless of age groups, show a negative direction with the severity of pedestrian injuries. In other words, despite no statistical significance, these safety zones can show the potential of positive effects. Accordingly, it is necessary to make efforts to reduce the severity of pedestrian injuries by closely examining school zones and silver zones in the future. In particular, South Korea, which has rapidly developed into an aging society, needs to reduce the severity of pedestrian injuries by further studying the effects of silver zones for the safety of elderly pedestrians who are a vulnerable road user group.
5. Conclusions
This study examined the spatial hierarchical characteristics as well as the effects of the individual characteristics of pedestrian crashes and the built environmental characteristics of neighborhoods on the severity of pedestrian injuries. This research was driven by the significant need to create pedestrian safety-oriented neighborhood environments to improve walkability. Since there is little prior research on how place characteristics that promote walkability further affect pedestrian safety, this study also examined how places that promote walking affect pedestrian–vehicle collisions. Further, this research clarified whether the characteristics influencing the severity of pedestrian injuries differ by age group. The main results and implications of this study are as follows.
First, regardless of age, the individual characteristics of pedestrian crashes are likely to contribute more to explaining the severity of pedestrian injuries than the built environment of neighborhoods in all models. Therefore, individual traffic safety plans, such as constant and regular safety programs for both drivers and pedestrians, need to be further developed.
Second, the individual characteristics of pedestrian crashes and the neighborhood environmental characteristics affect the severity of pedestrian injuries differently based on age. In particular, those under 18 years (Model 1) and over 65 years (Model 3), which are recognized as vulnerable road users, are more affected by neighborhood environments than other age groups. The ICC values of Model 1 and Model 3 were 0.04 and 0.031, respectively, which indicate that the probability of fatal injury can be explained by the difference in the neighborhood level of 4% and 3.1%, respectively; however, the ICC of Model 2 was 0.023, which was lower than that of Model 1 and Model 3. Therefore, it is necessary to develop concrete and effective policies and plans that consider vulnerable road users beyond the general pedestrian safety programs.
Third, the effect of crosswalks and intersections on pedestrian injuries differed depending on the presence of traffic signals. In particular, the severity of pedestrian injuries tended to be lower at non-signalized crosswalks and intersections than at signalized crosswalks and intersections. This indicates that traffic signals installed to control traffic are not necessarily responsible for the safety of pedestrians. Thus, more persistent traffic safety education programs are needed to ensure that both drivers and pedestrians comply with traffic signals. In addition, it is necessary to consider a way of reducing the severity of pedestrian injuries through methods such as introducing roundabouts that can control vehicle speed without the need for traffic signals in the neighborhoods.
Fourth, silver zones and school zones, which are representative policies for the safety of vulnerable pedestrians in South Korea, have no power to explain the severity of pedestrian injuries in all age groups. Therefore, it is necessary to develop effective traffic policies and programs that lead to traffic calming, such as chicanes and chokers, as well as street environmental plans and designs that can correspond to school zones and silver zones, rather than simply designating safety zones.
Finally, parks, convenience stores, and restaurants that are generally found to enhance neighborhood walkability seem to play a significant role in reducing the severity of pedestrian injuries. However, convenience stores that students often visit after school are likely to increase the severity of pedestrian injuries for pedestrians under 18 years old.
This study has some limitations. The data on pedestrian–vehicle collision examined in this study have spatial properties, which can cause spatial autocorrelation due to spatial distribution patterns. This study had to consider this spatial autocorrelation between pedestrian crashes. In addition, pedestrian and traffic volumes in neighborhoods are expected to be the main predictors affecting the severity of pedestrian injuries; however, because of the difficulty of obtaining data on pedestrian and traffic volumes for all neighborhoods in Seoul, this study did not consider this potential influence.
Meanwhile, this study is significant in that it identifies factors that can affect the severity of pedestrian injuries by considering and comparing the individual characteristics of pedestrian crashes and the built environment of neighborhoods, using a hierarchical model, to move toward a pedestrian-friendly Seoul. The study is expected to make a significant contribution to the literature and guide policy makers and planners in arriving at consensus approaches when making decisions on how to build pedestrian safety-oriented neighborhoods.
Author Contributions
Conceptualization, S.P. and D.K.; methodology, S.P. and D.K.; writing—original draft preparation, S.P. and D.K.; writing—review and editing, S.P. and D.K. All authors have read and agreed to the published version of this manuscript.
Funding
This research was supported by the Bisa Research Grant of Keimyung University. This work was also supported by the National Research Foundation of Korea (NRF) (No. NRF–2018R1D1A1B07050844).
Conflicts of Interest
The authors declare no conflict of interest.
References
- Saelens, B.E.; Handy, S.L. Built environment correlates of walking: A review. Med. Sci. Sports Exerc. 2008, 40, S550–S566. [Google Scholar] [CrossRef] [PubMed]
- Kurka, J.M.; Adams, M.A.; Todd, M.; Colburn, T.; Sallis, J.F.; Cain, K.L.; Glanz, K.; Frank, L.D.; Saelens, B.E. Patterns of neighborhood environment attributes in relation to children’s physical activity. Health Place 2015, 34, 164–170. [Google Scholar] [CrossRef] [PubMed]
- Lu, Y.; Chen, L.; Yang, Y.; Gou, Z. The association of built environment and physical activity in older adults: Using a citywide public housing scheme to reduce residential self-selection bias. Int. J. Environ. Res. Public Health 2018, 15, 1973. [Google Scholar] [CrossRef] [PubMed]
- Cavalcante, B.R.; Germano-Soares, A.H.; Gerage, A.M.; Leicht, A.; Tassitano, R.M.; Bortolotti, H.; de Mello Franco, F.G.; Wolosker, N.; Cucato, G.G.; Ritti-Dias, R.M. Association between physical activity and walking capacity with cognitive function in peripheral artery disease patients. Eur. J. Vasc. Endovasc. Surg. 2018, 55, 672–678. [Google Scholar] [CrossRef]
- Vahlberg, B.; Holmbäck, U.; Eriksson, S.; Cederholm, T. Protocol and pilot study of a short message service–guided training after acute stroke/transient ischemic attack to increase walking capacity and physical activity. Prev. Med. Rep. 2018, 11, 109–114. [Google Scholar] [CrossRef]
- Said, C.M.; Morris, M.E.; McGinley, J.L.; Szoeke, C.; Workman, B.; Liew, D.; Hill, K.D.; Woodward, M.; Wittwer, J.E.; Churilov, L. Additional structured physical activity does not improve walking in older people (>60 years) undergoing inpatient rehabilitation: A randomised trial. J. Physiother. 2018, 64, 237–244. [Google Scholar] [CrossRef]
- Lee, C.; Moudon, A.V. Physical activity and environment research in the health field: Implications for urban and transportation planning practice and research. J. Plan. Lit. 2004, 19, 147–181. [Google Scholar] [CrossRef]
- Cerin, E.; Nathan, A.; Van Cauwenberg, J.; Barnett, D.W.; Barnett, A. The neighbourhood physical environment and active travel in older adults: A systematic review and meta–analysis. Int. J. Behav. Nutr. Phys. Act. 2017, 14, 15. [Google Scholar] [CrossRef]
- Barnett, D.W.; Barnett, A.; Nathan, A.; Van Cauwenberg, J.; Cerin, E. Built environmental correlates of older adults’ total physical activity and walking: A systematic review and meta–analysis. Int. J. Behav. Nutr. Phys. Act. 2017, 14, 103. [Google Scholar] [CrossRef]
- Panter, J.R.; Jones, A.P.; Van Sluijs, E.M. Environmental determinants of active travel in youth: A review and framework for future research. Int. J. Behav. Nutr. Phys. Act. 2008, 5, 34–47. [Google Scholar] [CrossRef]
- Li, F.; Fisher, K.J.; Brownson, R.C.; Bosworth, M. Multilevel modelling of built environment characteristics related to neighbourhood walking activity in older adults. J. Epidemiol. Community Health 2005, 59, 558–564. [Google Scholar] [CrossRef] [PubMed]
- Kim, C.; Im, H.; Choi, C. Built environment, walking trip for different purposes, and pedestrian satisfaction. J. Korea Plan. Assoc. 2016, 51, 145–159. (In Korean) [Google Scholar] [CrossRef]
- Yun, J.; Choi, D. Geographically Weighted Regression on the Characteristics of Land Use and Spatial Patterns of Floating Population in Seoul City. J. Korean Soc. Geo. Inf. Sci. 2015, 23, 77–84. (In Korean) [Google Scholar] [CrossRef]
- Jang, J.; Choi, S.; Lee, H.; Kim, S.; Choo, S. A comparison analysis of factors to affect pedestrian volumes by land–use type using Seoul Pedestrian Survey. J. Korea Inst. Intell. Transp. Syst. 2015, 14, 39–53. (In Korean) [Google Scholar] [CrossRef]
- Ministry of Government Legislation (Korea). Pedestrian Safety and Convenience Enhancement Act. Available online: http://www.law.go.kr/lsInfoP.do?lsiSeq=195271&efYd=20170726#0000 (accessed on 11 November 2019). (In Korean)
- Sung, H.; Oh, J. Development of Safe Routes to School Program: Review on the Needs and Establishment of Its Program Promotion System. J. Transp. Res. 2011, 17, 1–134. (In Korean) [Google Scholar]
- Adler, M.W.; Ahrend, R. Traffic Safety in Korea. OECD Reg. Dev. Work. Pap. 2017. [Google Scholar] [CrossRef]
- Lee, J.; Lee, H. Developing a Pedestrian Satisfaction Prediction Model Based on Machine Learning Algorithms. J. Korea Plan. Assoc. 2019, 6, 106–118. (In Korean) [Google Scholar] [CrossRef]
- Park, H.; Lee, K. The Effects of Neighborhood Environment on Elderly’s Walking Time and Quality of Life—A Case Study of Nokbeon–Dong in Seoul. J. Korea Plan. Assoc. 2019, 4, 109–121. (In Korean) [Google Scholar] [CrossRef]
- Park, G.; Lee, S. Structural Relationship between Neighborhood Environment, Daily Walking Activity, and Subjective Health Status: Application of Path Model. J. Korea Plan. Assoc. 2018, 2, 255–272. (In Korean) [Google Scholar] [CrossRef]
- Liu, J.; Hainen, A.; Li, X.; Nie, Q.; Nambisan, S. Pedestrian injury severity in motor vehicle crashes: An integrated spatio–temporal modeling approach. Accid. Anal. Prev. 2019, 132, 105272. [Google Scholar] [CrossRef]
- Zhai, X.; Huang, H.; Sze, N.N.; Song, Z.; Hon, K.K. Diagnostic analysis of the effects of weather condition on pedestrian crash severity. Accid. Anal. Prev. 2019, 122, 318–324. [Google Scholar] [CrossRef] [PubMed]
- Kim, M.; Kho, S.Y.; Kim, D.K. Hierarchical ordered model for injury severity of pedestrian crashes in South Korea. J. Saf. Res. 2017, 61, 33–40. [Google Scholar] [CrossRef] [PubMed]
- Bae, M.; Park, S. The Effects of Individual and Neighborhood Environmental Characteristics on the Severity of Pedestrian Traffic Accidents in Daegu Metropolitan City. J. Korean Reg. Dev. Assoc. 2019, 31, 239–258. (In Korean) [Google Scholar]
- Park, S.-H.; Bae, M.-K. Exploring the Determinants of the Severity of Pedestrian Injuries by Pedestrian Age: A Case Study of Daegu Metropolitan City, South Korea. Int. J. Environ. Res. Public Health 2020, 17, 2358. [Google Scholar] [CrossRef] [PubMed]
- Park, S.; Ko, D. A Multilevel Model Approach for Investigating Individual Accident Characteristics and Neighborhood Environment Characteristics Affecting Pedestrian–Vehicle Crashes. Int. J. Environ. Res. Public Health 2020, 17, 3107. [Google Scholar] [CrossRef]
- Verzosa, N.; Miles, R. Severity of road crashes involving pedestrians in Metro Manila, Philippines. Accid. Anal. Prev. 2016, 94, 216–226. [Google Scholar] [CrossRef] [PubMed]
- Chen, Z.; Fan, W.D. A multinomial logit model of pedestrian–vehicle crash severity in North Carolina. Int. J. Transp. Sci. Technol. 2019, 8, 43–52. [Google Scholar] [CrossRef]
- Haleem, K.; Alluri, P.; Gan, A. Analyzing pedestrian crash injury severity at signalized and non-signalized locations. Accid. Anal. Prev. 2015, 81, 14–23. [Google Scholar] [CrossRef]
- Ulfarsson, G.F.; Kim, S.; Booth, K.M. Analyzing fault in pedestrian–motor vehicle crashes in North Carolina. Accid. Anal. Prev. 2010, 42, 1805–1813. [Google Scholar] [CrossRef]
- Kim, J.K.; Ulfarsson, G.F.; Shankar, V.N.; Mannering, F.L. A note on modeling pedestrian–injury severity in motor–vehicle crashes with the mixed logit model. Accid. Anal. Prev. 2010, 42, 1751–1758. [Google Scholar] [CrossRef] [PubMed]
- Zhang, G.; Yau, K.K.; Chen, G. Risk factors associated with traffic violations and accident severity in China. Accid. Anal. Prev. 2013, 59, 18–25. [Google Scholar] [CrossRef] [PubMed]
- Ko, D.; Park, S. The Effects of Individual Accidents and Neighborhood Environmental Characteristics on the Severity of Pedestrian Traffic Accidents in Seoul. J. Archit. Inst. Korea Plan. Des. 2019, 35, 101–109. (In Korean) [Google Scholar] [CrossRef]
- Eluru, N.; Bhat, C.R.; Hensher, D.A. A mixed generalized ordered response model for examining pedestrian and bicyclist injury severity level in traffic crashes. Accid. Anal. Prev. 2008, 40, 1033–1054. [Google Scholar] [CrossRef] [PubMed]
- Tay, R.; Choi, J.; Kattan, L.; Khan, A. A multinomial logit model of pedestrian–vehicle crash severity. Int. J. Sustain. Transp. 2011, 5, 233–249. [Google Scholar] [CrossRef]
- Yu, C.Y. Built environmental designs in promoting pedestrian safety. Sustainability 2015, 7, 9444–9460. [Google Scholar] [CrossRef]
- Lee, G.; Lee, S. An Analysis of the Factors of Pedestrian Traffic Accident by Driver’s Age and Accident Severity. J. Urban Des. Inst. Korea 2016, 17, 63–80. (In Korean) [Google Scholar]
- Anastasopoulos, P.C.; Mannering, F.L. An empirical assessment of fixed and random parameter logit models using crash- and non-crash-specific injury data. Accid. Anal. Prev. 2011, 43, 1140–1147. [Google Scholar] [CrossRef]
- Pour-Rouholamin, M.; Zhou, H. Investigating the risk factors associated with pedestrian injury severity in Illinois. J. Saf. Res. 2016, 57, 9–17. [Google Scholar] [CrossRef]
- Aziz, H.A.; Ukkusuri, S.V.; Hasan, S. Exploring the determinants of pedestrian–vehicle crash severity in New York City. Accid. Anal. Prev. 2013, 50, 1298–1309. [Google Scholar] [CrossRef]
- Park, H.-C.; Joo, Y.-J.; Kho, S.-Y.; Kim, D.-K.; Park, B.-J. Injury Severity of Bus–Pedestrian Crashes in South Korea Considering the Effects of Regional and Company Factors. Sustainability 2019, 11, 3169. [Google Scholar] [CrossRef]
- Sze, N.N.; Wong, S.C. Diagnostic analysis of the logistic model for pedestrian injury severity in traffic crashes. Accid. Anal. Prev. 2007, 39, 1267–1278. [Google Scholar] [CrossRef] [PubMed]
- Kim, D. The transportation safety of elderly pedestrians: Modeling contributing factors to elderly pedestrian collisions. Accid. Anal. Prev. 2019, 131, 268–274. [Google Scholar] [CrossRef] [PubMed]
- Li, Y.; Fan, W.D. Modelling severity of pedestrian–injury in pedestrian–vehicle crashes with latent class clustering and partial proportional odds model: A case study of North Carolina. Accid. Anal. Prev. 2019, 131, 284–296. [Google Scholar] [CrossRef] [PubMed]
- Larsen, K.; Gilliland, J.; Hess, P.; Tucker, P.; Irwin, J.; He, M. The influence of the physical environment and sociodemographic characteristics on children’s mode of travel to and from school. Am. J. Public Health 2009, 99, 520–526. [Google Scholar] [CrossRef] [PubMed]
- Li, F.; Harmer, P.A.; Cardinal, B.J.; Bosworth, M.; Acock, A.; Johnson-Shelton, D.; Moore, J.M. Built environment, adiposity, and physical activity in adults aged 50–75. Am. J. Prev. Med. 2008, 35, 38–46. [Google Scholar] [CrossRef] [PubMed]
- Heydari, S.; Miranda-Moreno, L.; Hickford, A.J. On the causal effect of proximity to school on pedestrian safety at signalized intersection: A heterogeneous endogenous economic model. Anal. Methods Accid. Res. 2020, 26, 100115. [Google Scholar] [CrossRef]
- Xin, C.; Guo, R.; Wang, Z.; Lu, Q.; Lin, P.-S. The effects of neighborhood characteristics and the built environment on pedestrian injury severity: A random parameters generalized ordered probability model with heterogeneity in means and variances. Anal. Methods Accid. Res. 2017, 16, 117–132. [Google Scholar] [CrossRef]
- Guo, R.; Xin, C.; Lin, P.-S.; Kourtellis, A. Mixed effects logistic model to address demographics and neighborhood environment on pedestrian injury severity. Transp. Res. Rec. 2017, 2659, 174–181. [Google Scholar] [CrossRef]
- Christiansen, L.B.; Cerin, E.; Badland, H.; Kerr, J.; Davey, R.; Troelsen, J.; Van Dyck, D.; Mitáš, J.; Schofield, G.; Sugiyama, T. International comparisons of the associations between objective measures of the built environment and transport-related walking and cycling: IPEN adult study. J. Transp. Health 2016, 3, 467–478. [Google Scholar] [CrossRef]
- Lu, Y.; Xiao, Y.; Ye, Y. Urban density, diversity and design: Is more always better for walking? A study from Hong Kong. Prev. Med. 2017, 103, S99–S103. [Google Scholar] [CrossRef]
- Yang, Y.; He, D.; Gou, Z.; Wang, R.; Liu, Y.; Lu, Y. Association between street greenery and walking behavior in older adults in Hong Kong. Sustain. Cities Soc. 2019, 51, 101747. [Google Scholar] [CrossRef]
- Wang, J.; Huang, H.; Xu, P.; Xie, S.; Wong, S.C. Random parameter probit models to analyze pedestrian red-light violations and injury severity in pedestrian–motor vehicle crashes at signalized crossing. J. Transp. Saf. Secur. 2019, 1–20. [Google Scholar] [CrossRef]
- Dannenberg, A.L.; Cramer, T.W.; Gibson, C.J. Assessing the walkability of the workplace: A new audit tool. Am. J. Health Promot. 2005, 20, 39–44. [Google Scholar] [CrossRef] [PubMed]
- Narayanamoorthy, S.; Paleti, R.; Bhat, C.R. On accommodating spatial dependence in bicycle and pedestrian injury counts by severity level. Transp. Res. Part B Method. 2013, 55, 245–264. [Google Scholar] [CrossRef]
- Kerr, J.; Emond, J.A.; Badland, H.; Reis, R.; Sarmiento, O.; Carlson, J.; Sallis, J.F.; Cerin, E.; Cain, K.; Conway, T. Perceived neighborhood environmental attributes associated with walking and cycling for transport among adult residents of 17 cities in 12 countries: The IPEN study. Environ. Health Perspect. 2016, 124, 290–298. [Google Scholar] [CrossRef] [PubMed]
- Xu, F.; Li, J.; Liang, Y.; Wang, Z.; Hong, X.; Ware, R.S.; Leslie, E.; Sugiyama, T.; Owen, N. Associations of residential density with adolescents’ physical activity in a rapidly urbanizing area of Mainland China. J. Urban Health 2010, 87, 44–53. [Google Scholar] [CrossRef]
- Carr, L.J.; Dunsiger, S.I.; Marcus, B.H. Validation of Walk Score for estimating access to walkable amenities. Br. J. Sports Med. 2011, 45, 1144–1148. [Google Scholar] [CrossRef]
- Berke, E.M.; Koepsell, T.D.; Moudon, A.V.; Hoskins, R.E.; Larson, E.B. Association of the built environment with physical activity and obesity in older persons. Am. J. Public Health 2007, 97, 486–492. [Google Scholar] [CrossRef]
- Moudon, A.V.; Lee, C.; Cheadle, A.D.; Garvin, C.; Johnson, D.B.; Schcd, T.L.; Weathers, R.D. Attributes of environments supporting walking. Am. J. Health Promot. 2007, 21, 448–459. [Google Scholar] [CrossRef]
- Traffic Accident Analysis System (TAAS). Available online: http://taas.koroad.or.kr/gis/mcm/mcl/initMap.do?menuId=GIS_GMP_STS_RSN (accessed on 5 September 2019). (In Korean).
- Lee, H.; Noh, S. Advanced Statistical Analysis, 2nd ed.; MoonWoo: Goyang, Korea, 2013. (In Korean) [Google Scholar]
- Diez-Roux, A.V. Bringing context back into epidemiology: Variables and fallacies in multilevel analysis. Am. J. Public Health 1998, 88, 216–222. [Google Scholar] [CrossRef]
- Wang, H.; Guo, X.-H.; Jia, Z.-W.; Li, H.-K.; Liang, Z.-G.; Li, K.-C.; He, Q. Multilevel binomial logistic prediction model for malignant pulmonary nodules based on texture features of CT image. Eur. J. Radiol. 2010, 74, 124–129. [Google Scholar] [CrossRef] [PubMed]
- Jang, J.; Choi, J.; Kim, T. Analyzing Driving Environment Effects on Severity of Elderly Driver’s Traffic Accidents. J. Transp. Res. 2017, 24, 79–94. (In Korean) [Google Scholar] [CrossRef]
- Jang, T. Traffic Accident Damage Severity of Old Age Drivers by Multilevel Analysis Model. J. Korea Soc. Civ. Eng. 2014, 34, 561–571. (In Korean) [Google Scholar] [CrossRef]
- Korea Consumer Agency. Safety Survey of Speed Humps; Safety Report; Editorial Department: Eumseong, Korea, 2015. (In Korean) [Google Scholar]
- Nykiforuk, C.I.; McGetrick, J.A.; Crick, K.; Johnson, J.A. Check the score: Field validation of street smart walk score in Alberta, Canada. Prev. Med. Rep. 2016, 4, 532–539. [Google Scholar] [CrossRef] [PubMed]
- Zuniga-Teran, A.A.; Orr, B.J.; Gimblett, R.H.; Chalfoun, N.V.; Marsh, S.E.; Guertin, D.P.; Going, S.B. Designing healthy communities: Testing the walkability model. Front. Archit. Res. 2017, 6, 63–73. [Google Scholar] [CrossRef]
- Koschinsky, J.; Talen, E.; Alfonzo, M.; Lee, S. How walkable is Walker’s paradise? Environ. Plan. B Urban Anal. City Sci. 2017, 44, 343–363. [Google Scholar] [CrossRef]


© 2020 by the authors. Licensee MDPI, Basel, Switzerland. This article is an open access article distributed under the terms and conditions of the Creative Commons Attribution (CC BY) license (http://creativecommons.org/licenses/by/4.0/).