Abstract
The soil properties, climate, type of management, and fermentation process critically affect the productivity and quality of tea. In this study, tender tea leaves were collected from central Taiwan, and organic components in their infusions as well as physical and chemical soil properties differentiated using aerial photographs where good (G) and bad (B) growth exhibitions were determined. Eleven physical and chemical soil properties as well as five compounds in tea infusions were analyzed to determine the main factor that affects the growth of these tea trees. The Fleiss’ kappa statistic results revealed that the wet aggregate stability, pH, and exchangeable potassium content exhibit the most significant effect, with scores of 0.86, 0.64, and 0.62, respectively. Soil quality calculated using the mean weight diameter based on 11 soil properties revealed that ~67% of the total score of G is greater than that of B. Generally, contents of total polyphenols (51.67%) and catechins (51.76%) in the infusions of B were greater than those of G. In addition, significant positive correlations between the free amino acids content and soil properties, including pH and copper content, were observed. However, a negative correlation between the free amino acids and flavone contents and most of the soil properties was observed. The survey data set obtained from this study can provide useful information for the improved management of tea plantations.
1. Introduction
Tea, Camellia sinensis (L.) O. Kuntze (Theaceae), is a unique and evergreen plant that is mainly dispersed in tropical and subtropical areas. The growth of a 60–100-cm-high natural shrub is maintained on tea plantations for collecting tender leaves [1]. Well-drained, deep, and well-aerated soils and sandy loam to clay loam textures, and even extremely coarse and gravelly soils, are the optimal soil conditions suggested for tea growth [2]. In addition, tea trees grow well in soils with 2–52% of the clay content, possibly containing 1.7–2.3% of soil organic matter (SOM) and 20.8–28.2% of water-holding capacity (WHC) [3]. Conditions that are conducive to tea plantations include a soil pH of 4.0–6.0, a temperature of 20.2–25.4 °C, an annual precipitation of 1500–2000 mm, and a humidity of 80–90% [4]. From the sea level up to ~2200 m above the sea level, the elevation of a plantation drastically affects the quality and quantity of tea leaves [5]. When the soil pH drops to less than 4.0, the growth of tea trees is adversely affected [6,7].
Soil conditions are important in that its biochemical properties might be changed by tea cultivation due to the specific natural characteristics of tea plants and agronomy management practices that supplement tea plants [8]. In addition, soil properties determine the availability of essential nutrients and thus, the nutrient uptake by plants [9,10]. Correspondingly, 11.0% nitrogen (N), 1.65% phosphorous (P), 3.7% potassium (K), 3.1% calcium (Ca), 1.07% magnesium (Mg), and 24 mg/kg copper (Cu) are reported to be necessary nutrients for tea [11]. Thus, tea trees grow well in several acidic soils, extending far down from the surface soil and penetrating well into the lowest available soil depth [5]. The application of calcium oxide decreases the soil acidity, releases exchangeable cations, and also improves the soil fertility [12]. However, most of the acid soils in India exhibit supplementary problems, with a low base saturation percentage (<75%) and low concentrations of exchangeable cations [2]. Negative effects of soil acidity on vegetable growth are closely correlated with the availability of essential nutrients, which might increase with the reduction in pH, such as for Cu and zinc (Zn). The SOM might retain heavy metals in the solid segments of the soil, while dissolved SOM can increase the adsorption of heavy metals through acidic soils [13,14].
The management of soil N has been extensively conducted for tea farming and has been described in several reviews [15,16]. N plays an important role in establishing proteins, and it plays an important role in chlorophyll synthesis. Hence, acidic soils not only affect the status of soil nutrients but also the tea ingestion security [15,16]. Moreover, the nitrification rate affects the soil pH and inorganic N content at different soil depths [17]. Soil aggregates are principally formed by physical, chemical, and biological processes, which are essentially responsible for their stabilization. Moreover, types of clay, the calcium carbonate content, and SOM constitute soil properties that exhibit a high correlation with soil aggregate stability [18]. N, P, and K are essential macronutrients for the growth of tea trees [19]. However, the availability of P is always low in soils due to its low natural content as well as the high P fixation capability of the soil [20]. Exploration demonstrations revealed that more than 70% of tea soils are deficient in P [21]. Therefore, a large amount of P fertilizers, as well as frequent application, is needed for tea plantations. Furthermore, the type and content of these essential elements and tea quality are closely related. N, P, and K are reported to support the contents of flavone, total polyphenols, free amino acids (FAAs), catechins, and theanine [22]. In addition, the application of K and Mg can increase the contents of FAAs and caffeine of different tea tree species [23]. Some efforts are devoted to the analysis of the effect of the changing chemical material expended to fertilize soil on quality parameters of produced tea [24].
Tea quality is mainly determined by its flavor, and it is affected by the quality of fresh, tender leaves as well as the fermentation processes of producers. The flavor of prepared tea leaves is mainly attributed to the abundant chemical compounds, including 20–40% of total polyphenols, 10–30% catechins, 1–2% flavones, 2–5% caffeine, and 14–17% protein. These compounds are either secondary metabolites accumulated in tender shoots during the growth and harvest periods or substrates participated the fermentation processing [25].
Overall, the quality of tea leaves can be affected by the tea species, management, plantation, and climatic factors [3]. Sustenance is unique among the major influences, and numerous tests are conducted to analyze the effects of soil fertility management on the quality of different types of tea [17]. A number of previous studies focused on the soil properties of tea plantations; however, less information is available with regards to the comparison of different soil physical and chemical properties and the effect of tea cultivation on organic components in tea infusions with respect to soil properties [26]. Most of the studies on tea quality are specialized studies, such as soil quality and absorption in leaves [17,26]. To observe effects of soil properties and organic components on one of the important types of tea in central Taiwan, soil samples and corresponding tender leaves were collected from the same plantation and analyzed with respect to good (G) and bad (B) growth exhibitions as distinguished by aerial photographs. This study aimed to identify the major soil properties via the growth determination of tea plants and further develop an assessment model based on soil quality (SQ) to distinguish between G and B and correlate it with the contents of organic compounds in the infusions of tender leaves. The results of this study can provide useful information regarding alternative fertilization and soil management practices for sustainable tea cultivation.
2. Materials and Methods
2.1. Study Area
The study site was in Nantou county, located in central Taiwan, at a latitude of 23°54′56.38′′ N and a longitude of 120°39′49.93′′ E. In addition, it is the only landlocked county with a total area of 4106 km2. This county exhibits an average annual temperature in the range of 20–23 °C on the ground level and mountains, and the climate is diverse, forming sub-tropical and frigid climate zones with increasing altitude. The annual average precipitation on the ground level and on mountains equals 1750 mm and 2800 mm, respectively. As ~83% of the area is covered by hills and mountains, and its terrain, elevation, and climate conditions are variable, Nantou county is a suitable place for growing tea trees. Soil and tea leaf samples were collected from 18 plots in Mingjian township area. For the same plot, and according to aerial photographs, tea with G and B growth appearances were selected, and soil and tea leaf samples were collected and taken to a laboratory for analysis in 2018–2019.
2.2. Collection and Analysis of the Soil and Tea Leaves
Soil samples were collected from 36 subplots with soil depth intervals of 0–20, 20–40, and 40–60 cm. Locations were randomly selected in each subplot and bored to different depths using an auger. Three soil samples with the same depth were then homogenized as a composite sample. All soil samples were stored in plastic containers and transferred to the laboratory. Then, the samples were dried in air, ground, sieved, and passed through 10-, 80-, or 100-mesh stainless-steel sieves according to the analyzed soil property. The measured soil properties included pH (Wsoil/Vwater = 1/5) [27], electrical conductivity (ECw; Wsoil/Vwater = 1/5) [28], 2 M KCl extractable N [29], 1 M NH4OAc (pH 7.0) extractable cations [30], available P, analyzed by the Bray No.1 method and UV spectrometry [31], and soil organic carbon content (SOC; [32]). The soil samples were digested using aqua regia, and the total concentrations of Cu and Zn in the digestants were analyzed by inductively coupled plasma atomic emission spectroscopy (ICP-AES, PerkinElmer Avio200, Waltham, MA, USA). Soil wet aggregate stability (WAS) was determined using a wet sieving device in accordance with that reported by Murer et al. [33].
Tender tea leaves (cultivar: Si Ji Chun) with two leaves and a bud were collected at the same time as the soil. All samples were washed with tap water and deionized water (DI water) to remove adhered dust, dried in an oven at 65 °C for 72 h, and ground into powders using a grinder. A total of 1.0 g of the powdered sample was extracted with 100 mL of DI water at 100 °C for 60 min. The tea infusions were stored in a freezer at 4 °C for further analysis.
To analyze the content of the total polyphenols in tea leaf infusions, gallic acid solution concentrations of 0, 0.01, 0.015, 0.02, 0.025, and 0.03 mg/mL were prepared for the calibration curve. One milliliter of the Folin-Ciocalteu’s reagent and 2 mL of the saturated Na2CO3 solution were added to a 1-mL infusion sample. After homogeneous mixing, the sample was quiesced for 1 h, and the total polyphenol content was determined at 700 nm using a visible spectrophotometer (Genesys 30, Thermo, Waltham, MA, USA) [34].
Gallic acid solutions with concentrations of 0, 0.1, 0.15, 0.2, 0.25, and 0.3 mg/mL were prepared for the calibration curve. One milliliter of the infusion sample with 3 mL pH = 7.5, 0.1 N phosphate buffered saline and 1 mL of tartaric acid as the coloring agent, which was prepared using 100 mg ferrous sulfate and 500 mg potassium sodium tartrate, was dissolved in water and quantitative to 100 mL. After homogeneous mixing and standing for 30 min, the catechin content was determined using a visible spectrophotometer at 540 nm (Genesys 30, Thermo, Waltham, MA, USA) [34].
The FAAs content was utilized to analyze theanine solutions at concentrations of 0, 0.04, 0.08, 0.12, 0.16, and 0.20 mg/mL for the calibration curve, and a 2-mL infusion sample with 1 mL of ninhydrin agent and 1 mL of a stannous chloride solution was prepared and maintained at a temperature of less than 80 °C in a water bath for 20 min. The 5-mL diluent (isopropanol:H2O = 1:1) was infused, and the sample was quiesced for 20 min after rapid cooling. The FAAs content was determined using a visible spectrophotometer (Genesys 30, Thermo, Waltham, MA, USA) at 570 nm [34].
Caffeine solutions at concentrations of 0, 1.2, 3, 6, 9, and 12 mg/L were prepared for the calibration curve. The caffeine content was directly determined at 276 nm using a PG Instruments Limited T60 UV–Vis spectrophotometer [35].
The flavone content was analyzed from a 1-mL infusion sample with 9 mL of aluminum(III) chloride (1%, w/w), which was determined by a visible spectrophotometer (Genesys 30, Thermo, Waltham, MA, USA) at 420 nm. The absorbance (A420) was input into the following formula: flavones (mg/mL) = (A420 × 320)/103 [36].
2.3. Soil Quality Assessment
The total minimum data set (MDS) was calculated by utilizing 11 soil properties that were selected for SQ assessment, which were recommended by several authors as beneficial soil quality indicators. The SQ score was computed by using a scoring function analysis framework reported previously [37,38,39,40].
The soil properties fulfilled all of the measured functions, and under the proposed framework, they were given a score of 1.0. These numerical weights were allocated to each soil function according to their significance in fulfilling the overall goals of sustaining SQ under the specific conditions of this study. The consistent numerical weights for individual SQ indicators were multiplied by indicator scores considered by the use of standardized scoring functions (SSFs) that standardize indicator measurements to a value between 0 and 1.0 [41]. Three SSFs are typically used for the SQ assessment [42,43], which are more is better (SSF3), less is better (SSF9), and optimum (SSF5), respectively. The form of the curves created by the scoring curve equation was determined by critical values, as described in Table 1. The critical values contained threshold and baseline values, which are based on published values. The thresholds of the soil property values were that the scoring function equaled one when the measured soil property was at an optimal level or equaled zero when the soil property was at an unacceptable level. The baselines were the soil property values where the scoring function equaled 0.5 and where the midpoints were between threshold soil property values [44].

Table 1.
Selected indicators, specific standardized scoring functions (SSFs), and parameters used in this study.
To determine the performance of different indices, the classification accuracy of SQ was assessed for each level by numerical score analysis. The numerical score in the indices was calculated by the direct comparison and Fleiss’ kappa statistic assessment. A direct evaluation of the quality level of each site was performed by comparing the number of points where the combination of the index and indicator exhibited the same soil quality level [45]. The Fleiss’ kappa statistic assessment was performed by using five soil levels to indicate the level of agreement at which different substances may be valued by different individuals [46]. The kappa statistic assessment evaluated the difference between the observed agreement between two tables and the agreement resulting from the degree to which the observed amount of agreement between raters exceeded what would be expected if all raters had random ratings. Furthermore, soil fertility specialists were consulted to compare their opinions with the proposed system’s output and to evaluate the agreement by the Fleiss’ kappa statistic assessment. The following limits of agreement were used: (1) poor: <0, (2) slight: 0–0.20, (3) fair: 0.21–0.40, (4) moderate: 0.41–0.60, (5) substantial: 0.61–0.80, and (6) almost perfect: 0.81–1 [47]. Similarly, the correlation between indices and regression for indicator methods was calculated.
2.4. Statistical Analysis
Statistical analysis of the SQ indicator was performed using Statistical Package for Social Sciences (SPSS, Armonk, NY, USA) software. Variance was examined to determine the consequential relationship between soil properties, SQ scores, and concentrations of organic compounds in the infusion of tea leaves. A one-way analysis of variance and a t-test were performed for the statistical analysis of data (Fleiss’ kappa, regression equations, and scoring functions). Microsoft Excel was used to detect differences in the soil and tea leaves. The least significant difference test was employed to identify significant differences between means. SQ indicators and SQ indices were evaluated for their level of significance at a p-value of less than 0.01, and 0.05 denoted a statistical significance.
3. Results
3.1. Soil pH, ECw and SOC
At different depths, soil samples exhibited strong acidity (Figure 1a), and at a soil depth of 0–60 cm, the average and median values for G were less than those of B. A wide range of pH values was observed in the survey area, and pH of soil samples were 3.29–4.77 and 3.33–4.87 for G and B, respectively. At a soil depth of 0–60 cm, the average soil pH was ~3.84 and 4.08 for G and B, respectively, and a significant relationship between them was observed (p < 0.01, R = 0.55) (Table 2). Generally, the pH of all soil samples is extremely strong acidic to extremely acidic, and the difference in soil pH between G and B could potentially affect the concentrations of available nutrients, which is explained in the following paragraphs.
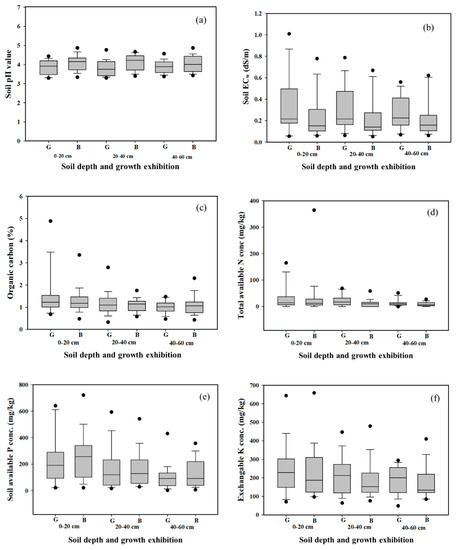
Figure 1.
Box and whisker plots of pH (a), ECw (b), SOC (c), available N conc. (d), available P conc. (e) and exchangeable K conc. (f) at different soil depths with good (G) and bad (B) growth exhibitions.
Table 2.
Statistic results for different soil properties in the survey tea plantations with good (G) and bad (B) growth exhibitions.
A significant relationship (R = 0.73, p < 0.01) with ECw between G and B was observed (Table 2). For different soil depths, ECw values were within the lower and upper baseline values, corresponding to 0.25–1.80 dS/m, as recommended by the Taiwan Agricultural Research Institute of Taiwan (TARI Taiwan). At a soil depth of 0–60 cm, the average and median values of ECw for G were 1.43–1.46 times greater than those of B. Moreover, in general, ECw decreased with the increase in the soil depth, regardless of G and B (Figure 1b).
Figure 1c shows the SOC contents at different soil depths. At soil depths of 0–20 and 20–40 cm, the average SOC content of G was significantly greater than that of B. Moreover, at a soil depth of 0–60 cm, the mean value for G was 1.07-fold greater than that of B. At depths of 40–60 cm, no statistical difference between G and B in SOC was observed. A significant relationship between G and B was observed (R = 0.57, p < 0.01) (Table 2).
3.2. Available N and Available P
Analytical results revealed that the available N content at 0–60 cm of G was greater than that of B. Compared to the sublayers, the surface layer exhibited a higher content of available N, possibly resulting from the broadcast application of fertilizers on the surface soil (Figure 1d). The average and median values for the available N content at 0–60 cm of G were 1.29- and 1.41-fold greater than those of B, respectively. The available N content was 34–36 mg/kg at a soil depth of 0–20 cm for G and B, and it gradually decreased in the second and third layers. The available N content varied from not detectable (ND) to 166 mg/kg and from ND to 365 mg/kg in G and B, respectively. The statistic exhibited a significant relationship between G and B with respect to the available N content at a soil depth of 0–60 cm (R = 0.71, p < 0.01) (Table 2).
A high concentration of available P was observed in the survey area, regardless of the soil depth (Figure 1e). Moreover, the maximum value was 7.21-fold greater than the optimum value of 100 mg/kg, which is recommended by TARI Taiwan. This survey result revealed that a high amount of fertilizer is applied to these tea plantations. The surface layer contained >230 mg/kg of the available P content, which drastically decreased with the increase in the soil depth. The available P contents were 2–641 and 6–722 mg/kg for G and B, respectively. The mean and median values for the available P content at 0–60 cm for G was 0.94- and 0.84-fold greater than those of B. A significant correlation at 0.61 (p < 0.01) (Table 2) between G and B was observed for the available P content at a soil depth of 0–60 cm.
3.3. Exchangeable Cations
Figure 2a,b show the distribution of the extent of exchangeable Ca and Mg at different soil depths of G and B. The three layers and top two layers of B exhibited higher concentrations of exchangeable Ca and Mg, respectively, compared with those of G. At a soil depth of 0–60 cm, the mean values for exchangeable Ca and Mg for G were 0.79- and 0.97-fold greater than those of B; however, these values were within the maximum expected values of TARI Taiwan, i.e., 300 and 200 mg/kg for exchangeable Ca and Mg, respectively. In addition, the exchangeable Ca and Mg concentrations decreased with the increase in the soil depth, indicating that the Ca and Mg concentrations are affected by fertilizer application.
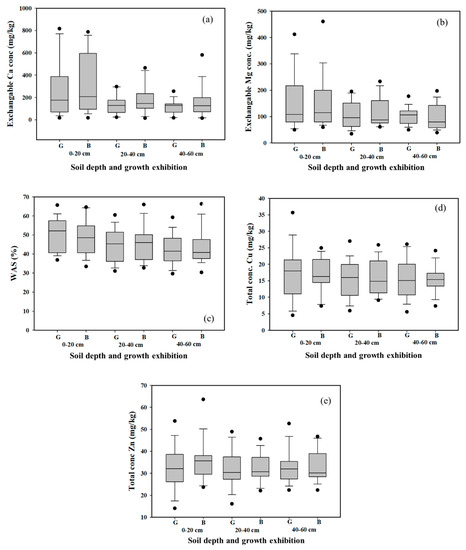
Figure 2.
Box and whisker plots of exchangeable Ca conc. (a), exchangeable Mg conc. (b), wet aggregate stability (WAS) (c), total Cu conc. (d), and total Zn conc. (e) at different soil depths with good (G) and bad (B) growth exhibitions.
At a soil depth of 0–60 cm, the mean and median values for exchangeable K for G were 1.12- and 1.36-fold greater than those of B, respectively (Figure 1f). Most of the exchangeable K content was within the expected values recommended by TARI Taiwan. A significant relationship between G and B was observed (R = 0.66, p < 0.01) (Table 2). The highest content of exchangeable K was found in the first layer, and its content gradually decreased with the increase in the soil depth, regardless of G or B.
3.4. Total Concentrations of Soil Cu and Zn
No significant difference between the total concentrations of Cu and Zn at a soil depth of 0–60 cm for G and B was observed (Figure 2d,e). At different soil depths of G and B, the total concentrations of Cu and Zn were less than 36 and 64 mg/kg, respectively. These values are far less than the monitoring standards stipulated by the Environmental Protection Administration of Taiwan (EPA Taiwan) for cropland, which are 200 and 600 mg/kg for Cu and Zn, respectively. Among these elements, a significant relationship for the Cu content between G and B was observed (R = 0.34, p < 0.01, Table 2).
3.5. WAS
The WAS of G and B at different soil depths ranged from 29% to 66% and from 30% to 67%, respectively. G and B exhibited similar WAS, regardless of soil depths, and the mean and median values for WAS at 0–60 cm were almost equal (Figure 2c). Moreover, WAS decreased with the increase in the soil depth. A significant relationship with WAS between G and B was observed (R = 0.55, p < 0.01) (Table 2).
3.6. Organic Compounds in Tea Infusions
Figure 3a shows the contents of the total polyphenols in the G and B infusions. In general, ~78% of the infusions of B showed a higher content of the total polyphenols than that of G. The total polyphenol content of the infusion ranged from 96 to 169 and from 112 to 184 mg/g for G and B, respectively. In addition, a significant relationship (p < 0.01, R = 0.57) between G and B in the total polyphenol content was observed (Table 3). Similar to the result obtained for the total polyphenols, ~83% of the catechins in the infusions of B was greater than that of G (Figure 3b). A significant correlation between G and B was observed (p < 0.01, R = 0.68), as shown in Table 3. The content of catechin in the infusions of G and B at different sites ranged from 47 to 76 and from 51 to 82 mg/g, respectively. Average values of the total polyphenols and catechins in the 18 infusions of B were approximately 1.07-hold greater than those of B. In addition, a significant correlation between the FAAs content in the infusions of G and B (p < 0.05, R = 0.54) was noted (Table 3). Approximately 61% of the FAAs content of the infusions of G was greater than that of B. The FAAs content of the infusions of G and B ranged from 1.3 to 4.3 and from 1.2 to 3.8 mg/g, with averages of 2.76 ± 0.65 and 2.58 ± 0.84 mg/g, respectively. The content of FAAs in the infusions of G and B did not fluctuate severely; hence, the FAAs content could not be utilized as a parameter to distinguish between them. Similar to the result of FAAs, a significant relationship between the caffeine content in the infusions of G and B was observed (R = 0.65, p < 0.01, Table 3); otherwise, a difference between G and B could not be distinguished. The caffeine content of the infusions of G and B ranged from 6.6 to 9.5 and from 6.3 to 10.7 mg/g, respectively (Figure 3d). The average caffeine content of B (8.10 ± 1.11 mg/g) was only slightly greater than that of G (7.90 ± 0.98 mg/g). Similar to the results obtained for FAAs and caffeine, the total flavone content of the infusions fluctuated, although ~56% of B exhibited values greater than those of G (Figure 3e). The total content of flavone in G and B ranged from 9.1 to 15.2 and from 7.7 to 15.1 mg/g, respectively, and a significant relationship between G and B was also observed (R = 0.61, p < 0.01).
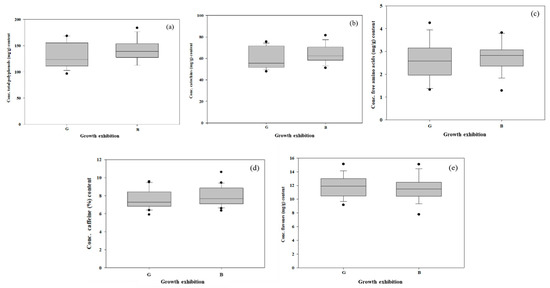
Figure 3.
Box and whisker plots for the total concentration of total polyphenols (a), catechins (b), free amino acids (FAAs) (c), caffeine (d), and flavones (e) in the infusions.
Table 3.
Statistic results for the different organic compounds in infusions of tea with good (G) and bad (B) growth exhibitions.
4. Discussion
4.1. Critical Soil Properties in Tea Cultivation
Several studies employed the Fleiss’ kappa analysis for land use, land reclamation, and land cover [48]; by contrast, few studies employed it to assess soil properties. The Fleiss’ kappa statistic was employed herein to assess the soil properties that critically affected the growth exhibition, i.e., G and B, of tea trees. Among the 11 analyzed soil properties, 8 soil properties showed moderate agreement (ECw, Cu, Zn, SOC, exchangeable Mg), substantial agreement (pH and exchangeable K), and almost perfect agreement (WAS) (Table 4) as reported by Fleiss and Cohen [46]. Compared to the other 11 soil properties, the available N concentration of the soil exhibited a slight agreement, possibly resulting from the high variations and some extreme values in the study area [49].
Table 4.
Fleiss’ kappa statistic results for 11 soil properties.
The management of tea cultivation in Taiwan is primarily determined on the basis of manager experiences. Moreover, the spatial variation and heterogeneity of soil affect the SQ. Notably, different substances can be rated by different characteristics although a fixed number of Fleiss’ kappa assessments was observed. The results of the Fleiss’ kappa statistic also determined whether soil conditions are suitable for tea cultivation. For instance, among 11 soil properties, the WAS was the most critical property because its value of the Fleiss’ kappa statistic was close to one (Table 4). This result is caused by the fact that WAS is a critical characteristic in determining the physical properties of soil, including maintaining the water content, percolation, and drainage of the soil. In addition, the WAS stability was primarily interrelated with the clay content and tended to be stronger in fine-textured soils [50]. In addition to WAS, the soil pH and exchangeable K content also played important roles in the growth exhibition of tea cultivation. The results of this study revealed that these important soil properties should be considered in the management of tea plantations. Moreover, in general, these important soil properties are involved in soil fertility, indicating that the suitable management of fertilization is essential for the growth of tea trees [51].
4.2. Total Score of SQ
Different SSFs were utilized in this study to translate the analytical results into scores in accordance with soil properties using the average value for the soil depth of 0–60 cm. Approximately 67% of the total score of G based on 11 properties was greater than that of B (Figure 4). In addition, only 8 soil properties, discussed in Section 4.1, with moderate, substantial, and almost perfect agreements (Table 4) were utilized to recalculate the total score of SQ. Approximately 28% of the total score of B was greater than that of G, if the difference between them of less than 5% was not considered. The results indicated that in general, SSFs and parameters utilized herein to calculate the SQ score could be useful for distinguishing between G and B.
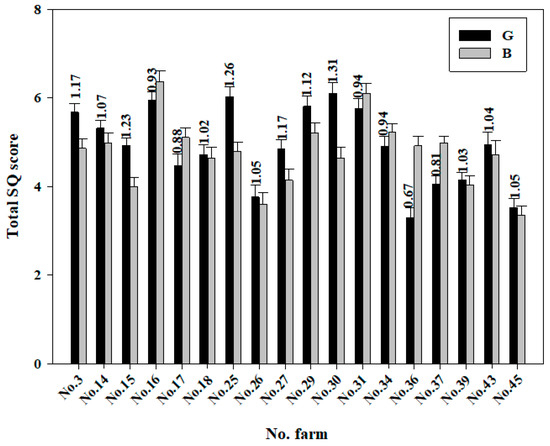
Figure 4.
Total score of the soil quality calculated using the mean weight diameter based on 11 soil properties of good (G) and bad (B) growth exhibitions. The number shown on the top of each bar is the ratio of the total SQ score of G and B.
Notably, the experimental results revealed that the SQ model correctly reflects the improvement in SQ and the increase in the growth of tea trees. The soil properties used for the MDS process have been used in previously produced SQs [52]. Zhang et al. [53] evaluated SQ indicator selection approaches as a tool to benefit high productivity in China by using MDS-based SQ. Previous studies also used SQ to evaluate the effects of different characteristics on SQ [54]. The results of this study indicated that tea cultivation exhibits a significant positive effect on soil properties, such as pH, soil nutrients, and WAS. Among the analyzed soil properties, the SQ score of WAS ranged from 0.54 to 0.93, and this score was within the suitable range. WAS controls the stability of the aggregate, and thus, the size of the pores; hence, a close association is observed between WAS and aeration, percolation, and drainage. In addition, soil erosion was reduced under high WAS [55]. The physicochemical processes of aggregate development are mainly related to the clay content and is stronger in fine-textured soils [50]. Moreover, WAS affects the physical properties of tea soils, available water retention capacity, aggregate-scale distribution, and stability [56]. Owing to its effect on soil, water and air mechanisms as a physical factor, it is preferably applied in the explanation of the assessment procedure [57].
The total score of these soil properties can be utilized to identify differences in SQ at different tea plantations; however, in general, SQ scores for available N, exchangeable K, exchangeable Ca, and exchangeable Mg were less than 0.70. Numerous studies revealed that the soil nutrient content decreases and that soil degradation occurs under continuous cultivation in the above situation [58]. The low SQ score for available N possibly resulted from its fixation, leaching, and denitrification in the soil [59]. Therefore, SQ is most efficiently calculated using a modeling basis that is effective at accumulating and synthesizing the collection of SQ indicators and site or climate characteristics; nevertheless, the limitation of SQ is that it mainly depends on the researcher’s viewpoint [60].
4.3. Relationship between Soil and Infusion
Soil chemical properties of tea plantations significantly affect the aroma test of the infusion (Table 5). Soil properties, nutrient status, and fertilizer application are key for the growth of tea trees. Moreover, tea quality is significantly affected by the fermentation process of the predecessor. FAAs, total polyphenols, and caffeine are essential groups of such complexes. This study aimed to examine the correlation between different soil properties and tea-quality-related components of the infusions [61], and significant correlations between some of them were not observed (Table 5). The contents of FAAs in the infusions exhibited significant relationships with pH, ECw, SOC, available P and exchangeable Mg contents, and the total Cu concentration. FAAs are produced by the metabolism of plants, and researchers and tea creators have been examining FAAs by suitable techniques to support the quality of tea by increasing their content.
Table 5.
Correlation between soil properties and organic compounds in the infusions.
This study revealed that the content of FAAs in the infusion is affected by that of exchangeable Mg in the soil. The content of FAAs in the tender shoots of tea was found to depend on the adaptation and transport of N within plants [62]. In addition, the exchangeable Mg nutrient level is a vital dynamic, prompting the movement of amino acids and sugars through the xylem and phloem, particularly for the mobilization of N and the carbon pool for the purpose of promoting the growth of young shoots in spring. Results from a previous study revealed that the FAAs concentration of young shoots increases with the increase in the exchangeable Mg content of the soil [63]. Moreover, the decrease in the FAAs concentration of fibrous roots and young shoots leads to the strong inhibition of the expanding growth of young shoots and biomass production in exchangeable-Mg-deficient plants [64]; however, a significant negative relationship was observed between the content of FAAs in the infusion and that of exchangeable Mg in the soil.
The SOC content was in the range of 0.3–4.9%, and the average value was less than 1.3% at a soil depth of 0–60 cm, perhaps corresponding to the rapid decay in the microorganism activity. SOM can increase the adsorption of heavy metals by acidic soils [13]. Moreover, adsorption and desorption are the two main processes that regulate the Cu concentration of soil solutions. The adsorption of Cu on SOM can reduce its action and movement via the formation of a compound of Cu with organic molecules. Total Cu and Zn concentrations of tea leaves and their infusions were affected, and sources of heavy-metal contamination included precipitation, atmospheric dust, vegetable protecting representatives, and nourishment [65]. A previous study revealed that the harvest reduction would occur when the soil Cu and Zn concentrations are greater than the critical levels of 10 and 25 mg/kg, respectively [43]. Moreover, soil acidification also can affect nutrient availability [66]. The soil heavy-metal pollution complete indices were 4.66–26.19 and 8.45–48.05 mg/kg for Cu and Zn, respectively [43]. The Cu and Zn concentrations of the survey soil were still less than above levels.
FAAs have been acknowledged as a mandatory chemical component for tea quality, and they are the major contributors to the freshness and mellowness of tea as well as an important impact factor on tea’s metabolism and varying concentrations of metabolites [67]. For example, the growth of grass at an unsuitable pH leads to the decrease in the FAAs concentrations [68]. The application of N-containing fertilizers motivates the metabolism of amino acids and modifies the FAAs content [69]. The available N content has been rarely analyzed in SQ studies, but it has been considered by a few researchers [70]. The survey result of this study indicated that the content of available N is not detectable for some tea plantations, and the metabolism of tender leaves possibly affects N deficiency. In addition, relationships between the content of available N in the soil and that of different organic compounds in tea infusions have been assessed; however, regardless of G or B, no significant correlation between them has been observed.
High soil salt levels inhibit populations of some microorganisms. In addition, increased salinity levels above the upper ECw can lead to decreased yields due to the osmotic effect [56]. Significant negative correlations between soil ECw and the contents of FAAs and flavones in tea infusions were observed. ECw can be combined with other physiochemical parameters to improve the fertilization of tea plantations [71].
5. Conclusions
Based on the 11 soil properties analyzed in this study, the mean values for exchangeable K, available N, and ECw of G were 1.12-, 1.29-, and 1.46-fold greater than those of B, respectively. Approximately 67% of the soil at a depth of 0–60 cm for G exhibited a better SQ score than that of B. On the other hand, based on the Fleiss’ kappa statistic assessment result, WAS, pH, and the exchangeable K content drastically affected the growth exhibition of tea. The mean values for the total phenols, catechins, FAAs, and caffeine of G was 1.02- to 1.08-fold greater than those of B. Moreover, the soil properties that affected the contents of FAAs in the infusions were pH, ECw, SOC, available P, exchangeable Mg, and Cu. As the flavor of the infusion is based on the combination of several organic compounds, it is also difficult to find the most suitable proportion of these five compounds. The survey results could allow for the concentration determination of ranges of these five organic compounds as well as their relationships with different soil properties.
Author Contributions
Conceptualization, Y.S. and H.-Y.L.; Data curation, P.T., W.-Y.T. and H.-Y.L.; Funding acquisition, H.-Y.L.; Investigation, P.T. and W.-Y.T.; Methodology, P.T., H.-Y.L. and W.-Y.T.; Project administration, Y.S.; Supervision, H.-Y.L.; Writing—original draft, P.T.; Writing—review and editing, H.-Y.L. All authors have read and agreed to the published version of the manuscript.
Funding
This program was funded by the Ministry of Science and Technology of the Republic of China (R.O.C.) (grant number MOST 107-2321-B-005-016) and in part by the Ministry of Education, Taiwan, R.O.C., under the Higher Education Sprout Project.
Acknowledgments
The authors would like to acknowledge all the services and technical support by Department of Soil and Environmental Science and Department of Soil and Water Conservation, National Chung Hsing University, Taichung 40227, Taiwan, during research work setting instrumentation, data collection, and write-up compilation.
Conflicts of Interest
The authors declare no conflict of interest.
Abbreviations
The following abbreviations are used in this manuscript:
| G | Good growth exhibition |
| B | Bad growth exhibition |
| SOC | Soil organic carbon |
| SOM | Soil organic matter |
| ECw | Electrical conductivity (Wsoil/Vwater = 1/5) |
| N | Nitrogen |
| P | Phosphorus |
| K | Potassium |
| Ca | Calcium |
| Mg | Magnesium |
| Cu | Copper |
| Zn | Zinc |
| FAAs | Free amino acids |
| WAS | Soil wet aggregate stability |
| WHC | Water-holding capacity |
| MDS | Total minimum data set |
| SQ | Soil quality |
| SSFs | Standardized scoring functions |
| L | Lower threshold |
| B1 | Baseline |
| U | Upper threshold |
| B2 | Lower baseline |
| B3 | Upper baseline |
| Optimal | Optimum value |
| TARI Taiwan | Taiwan Agricultural Research Institute of Taiwan |
| EPA Taiwan | Environmental Protection Administration of Taiwan |
References
- Hajiboland, R. Environmental and nutritional requirements for tea cultivation. Folia Hortic. 2017, 29, 199–220. [Google Scholar] [CrossRef]
- Chen, Z.S.; Hseu, Z.Y.; Tsai, C.C. The Soils of Taiwan; Springer: Dordrecht, The Netherlands, 2015; p. 127. [Google Scholar]
- Willson, K.C.; Clifford, M.N. Tea: Cultivation to Consumption; Chapman and Hall: London, UK, 1992; pp. 87–321. [Google Scholar]
- Dang, M.V. Soil–plant nutrient balance of tea crops in the northern mountainous region, Vietnam. Agric. Ecosyst. Environ. 2005, 105, 413–418. [Google Scholar] [CrossRef]
- Jayasinghe, S.L.; Kumar, L.; Sandamali, J. Assessment of potential land suitability for tea (Camellia sinensis (L.) O. Kuntze) in Sri Lanka using a GIS-based multi-criteria approach. Agriculture 2019, 9, 148. [Google Scholar] [CrossRef]
- Han, W.Y. The major nutrient limiting factors in tea soils and development of series tea speciality fertilizers. J. Tea Sci. 2002, 22, 70–74. [Google Scholar]
- Yan, P.; Shen, C.; Fan, L.C.; Li, X.; Zhang, L.P.; Zhang, L.; Han, W.Y. Tea planting affects soil acidification and nitrogen and phosphorus distribution in soil. Agric. Ecosyst. Environ. 2018, 254, 20–25. [Google Scholar] [CrossRef]
- Chen, Y.M.; Wang, M.K.; Zhuang, S.Y.; Chiang, P.N. Chemical and physical properties of rhizosphere and bulk soils of three tea plants cultivated in Ultisols. Geoderma 2006, 136, 378–387. [Google Scholar] [CrossRef]
- Chintala, R.; McDonald, L.M.; Bryan, W.B. Effect of soil water and nutrients on productivity of Kentucky bluegrass system in acidic soils. J. Plant Nutr. 2012, 35, 288–303. [Google Scholar] [CrossRef]
- Wang, H.; Xu, R.K.; Wang, N.; Li, X.H. Soil acidification of alfisols as influenced by tea cultivation in eastern china. Pedosphere 2010, 20, 799–806. [Google Scholar] [CrossRef]
- Konishi, S. Stimulatory effects of aluminium on tea plant growth. In Proceedings of the Transactions 14th International Congress of Soil Science, Kyoto, Japan, 12–18 August 1990. [Google Scholar]
- Oates, K.M.; Kamprath, E.J. Soil Acidity and Liming: I. Effect of the Extracting Solution Cation and pH on the Removal of Aluminum from Acid Soils 1. Soil Sci. Soc. Am. J. 1983, 47, 686–689. [Google Scholar] [CrossRef]
- Wang, R.H.; Zhu, X.F.; Qian, W.; Tang, H.Y.; Jiang, J.; Yu, Y.C.; Xu, R.K. Effect of tea polyphenols on copper adsorption and manganese release in two variable-charge soils. J. Geochem. Explor. 2018, 190, 374–380. [Google Scholar] [CrossRef]
- Behera, S.K.; Shukla, A.K. Spatial distribution of surface soil acidity, electrical conductivity, soil organic carbon content and exchangeable potassium, calcium and magnesium in some cropped acid soils of India. Land Degrad. Dev. 2015, 26, 71–79. [Google Scholar] [CrossRef]
- Li, S.Y.; Li, H.X.; Yang, C.L.; Wang, Y.D.; Xue, H.; Niu, Y.F. Rates of soil acidification in tea plantations and possible causes. Agric. Ecosyst. Environ. 2016, 233, 60–66. [Google Scholar] [CrossRef]
- Hayatsu, M.; Kosuge, N. Effects of difference in fertilization treatments on nitrification activity in tea soils. Soil Sci. Plant Nutr. 1993, 39, 373–378. [Google Scholar] [CrossRef]
- Van Dang, M. Effects of Tea Cultivation on Soil Quality in the Northern Mountainous Zone, Vietnam. Ph.D. Thesis, University of Saskatchewan, Saskatoon, SK, Canada, 2002. [Google Scholar]
- Cañasveras, J.C.; Barron, V.; Del Campillo, M.C.; Torrent, J.; Gomez, J.A. Estimation of aggregate stability indices in Mediterranean soils by diffuse reflectance spectroscopy. Geoderma 2010, 158, 78–84. [Google Scholar] [CrossRef]
- Mudau, F.N.; Soundy, P.; Du Toit, E.S. Nitrogen, phosphorus, and potassium nutrition increases growth and total polyphenol concentrations of bush tea in a shaded nursery environment. HortTechnology 2007, 17, 107–110. [Google Scholar] [CrossRef]
- Lin, Z.; Wu, X.; Wang, X.; Yu, Y. Studies on Phosphorus Nutrition in Red Soil of Tea Field. In Tea Science Research Proceedings; Tea Research Institute of Chinese Academy of Agricultural Science, Shanghai Scientific and Technological Publisher: Shanghai, China, 1992. [Google Scholar]
- Zhang, Y.L.; Luo, S.H.; Zeng, Y.H.; Peng, F.Y. Study on nutrient scale of sufficiency or deficiency in tea soils in hunan province and fertilizing recommendation. J. Tea Sci. 1997, 17, 161–170. [Google Scholar]
- Li, J.; Xia, J.G. Summary on nitrogen (N), phosphorus (P), potassium (K) and tea quality. Chin. Sci. Bull. 2005, 21, 62–65. [Google Scholar]
- Ruan, J.; Wu, X.; Härdter, R. Effects of potassium and magnesium nutrition on the quality components of different types of tea. J. Sci. Food Agric. 1999, 79, 47–52. [Google Scholar] [CrossRef]
- Venkatesan, S.; Ganapathy, M.N.K. Impact of nitrogen and potassium fertiliser application on quality of CTC teas. Food Chem. 2004, 84, 325–328. [Google Scholar] [CrossRef]
- Ruan, J. Quality-Related Constituents in Tea (Camellia sinensis (L.) O. Kuntze) as Affected by the form and Concentration of Nitrogen and the Supply of Chloride. Ph.D. Thesis, Christian-Albrechts Universität Kiel, Kiel, Germany, February 2005. [Google Scholar]
- Zhao, H.; Zhang, S.; Zhang, Z. Relationship between multi-element composition in tea leaves and in provenance soils for geographical traceability. Food Control 2017, 76, 82–87. [Google Scholar] [CrossRef]
- Thomas, G.W. Soil pH and soil acidity. In Methods of Soil Analysis: Part 3; Sparks, D.L., Page, A.L., Helmke, P.A., Loeppert, R.H., Soltanpour, P.N., Tabatabai, M.A., Johnston, C.T., Sumner, M.E., Eds.; SSSA Book Series No. 5; SSSA and ASA Inc.: Madison, WI, USA, 1996; pp. 475–490. [Google Scholar]
- Rhoades, J.D. Salinity: Electrical conductivity and total dissolved solids. In Methods of Soil Analysis: Part 3; Sparks, D.L., Page, A.L., Helmke, P.A., Loeppert, R.H., Soltanpour, P.N., Tabatabai, M.A., Johnston, C.T., Sumner, M.E., Eds.; SSSA Book Series No. 5; SSSA and ASA Inc.: Madison, WI, USA, 1996; pp. 417–435. [Google Scholar]
- Mulvaney, R.L. Nitrogen—Inorganic forms. In Methods of Soil Analysis: Part 3; Sparks, D.L., Page, A.L., Helmke, P.A., Loeppert, R.H., Soltanpour, P.N., Tabatabai, M.A., Johnston, C.T., Sumner, M.E., Eds.; SSSA Book Series No. 5; SSSA and ASA Inc.: Madison, WI, USA, 1996; pp. 1123–1184. [Google Scholar]
- Sumner, M.E.; Miller, W.P. Cation exchange capacity and exchange coefficients. In Methods of Soil Analysis: Part 3; Sparks, D.L., Page, A.L., Helmke, P.A., Loeppert, R.H., Soltanpour, P.N., Tabatabai, M.A., Johnston, C.T., Sumner, M.E., Eds.; SSSA Book Series No. 5; SSSA and ASA Inc.: Madison, WI, USA, 1996; pp. 1201–1230. [Google Scholar]
- Kuo, S. Phosphorus. In Methods of Soil Analysis: Part 3; Sparks, D.L., Page, A.L., Helmke, P.A., Loeppert, R.H., Soltanpour, P.N., Tabatabai, M.A., Johnston, C.T., Sumner, M.E., Eds.; SSSA Book Series No. 5; SSSA and ASA Inc.: Madison, WI, USA, 1996; pp. 869–919. [Google Scholar]
- Nelson, D.W.; Sommers, L.E. Total carbon, organic carbon, and organic matter. In Methods of Soil Analysis: Part 3; Sparks, D.L., Page, A.L., Helmke, P.A., Loeppert, R.H., Soltanpour, P.N., Tabatabai, M.A., Johnston, C.T., Sumner, M.E., Eds.; SSSA Book Series No. 5; SSSA and ASA Inc.: Madison, WI, USA, 1996; pp. 961–1010. [Google Scholar]
- Murer, E.J.; Baumgarten, A.; Eder, G.; Gerzabek, M.H.; Kandeler, E.; Rampazzo, N. An Improved Sieving Machine for Estimation of Soil Aggregate Stability (SAS). In Soil Structure/Soil Biota Interrelationships; Brussaardm, L., Kooistra, J., Eds.; Elsevier: Amsterdam, The Netherlands, 1993; pp. 539–547. [Google Scholar]
- Ou, S.M.; Liu, S.L.; Tsai, Y.S.; Chen, K.R. Characteristics of Taiwan Tiehkuanyin tea identified by physicochemical and stepwise discriminant analyses. Taiwan Tea Res. Bull. 2004, 23, 133–144. [Google Scholar]
- Huang, B.; Shi, X.; Yu, D.; Öborn, I.; Blombäck, K.; Pagella, T.F.; Wang, H.; Sun, W.; Sinclair, F.L. Environmental assessment of small-scale vegetable farming systems in peri-urban areas of the Yangtze River Delta Region, China. Agric. Ecosyst. Environ. 2006, 112, 391–402. [Google Scholar] [CrossRef]
- Xu, Y.Q.; Liu, P.P.; Shi, J.; Gao, Y.; Wang, Q.S.; Yin, J.F. Quality development and main chemical components of Tieguanyin oolong teas processed from different parts of fresh shoots. Food Chem. 2018, 249, 176–183. [Google Scholar] [CrossRef] [PubMed]
- Karlen, D.L.; Parkin, T.B.; Eash, N.S. Defining soil quality for a sustainable environment. In Methods for Assessing Soil Quality; Doran, J.W., Coleman, D.C., Bezdicek, D.F., Stewart, B.A., Eds.; CAB International: Wallingford, UK, 1997; pp. 345–355. [Google Scholar]
- Karlen, D.L.; Andrews, S.S.; Doran, J.W. Soil quality: Current concepts and applications. Adv. Agron. 2001, 74, 1–40. [Google Scholar]
- Andrews, S.S.; Karlen, D.L.; Cambardella, C.A. The soil management assessment framework: A quantitative soil quality evaluation method. Soil Sci. Soc. Am. J. 2004, 68, 1945–1962. [Google Scholar] [CrossRef]
- Sánchez-Navarro, A.; Gil-Vázquez, J.M.; Delgado-Iniesta, M.J.; Marín-Sanleandro, P.; Blanco-Bernardeau, A.; Ortiz-Silla, R. Establishing an index and identification of limiting parameters for characterizing soil quality in Mediterranean ecosystems. Catena 2015, 131, 35–45. [Google Scholar] [CrossRef]
- Karlen, D.L.; Stott, D.E. A framework for evaluating physical and chemical indicators of soil quality in Iowa. In Methods for Assessing Soil Quality; Doran, J.W., Coleman, D.C., Bezdicek, D.F., Stewart, B.A., Eds.; CAB International: Wallingford, UK, 1994; pp. 53–72. [Google Scholar]
- Andrews, S.S.; Mitchell, J.P.; Mancinelli, R.; Karlen, D.L.; Hartz, T.K.; Horwath, W.R.; Pettygrove, G.S.; Scow, K.M.; Munk, D.S. On-farm assessment of soil quality in California’s central valley. Agron. J. 2002, 94, 12–23. [Google Scholar] [CrossRef]
- Lee, C.H.; Wu, M.Y.; Asio, V.B.; Chen, Z.S. Using a soil quality index to assess the effects of applying swine manure compost on soil quality under a crop rotation system in Taiwan. Soil Sci. 2006, 171, 210–222. [Google Scholar] [CrossRef]
- Fernandes, J.C.; Gamero, C.A.; Rodrigues, J.G.L.; Mirás-Avalos, J.M. Determination of the quality index of a Paleudult under sunflower culture and different management systems. Soil Tillage Res. 2011, 112, 167–174. [Google Scholar] [CrossRef]
- Rahmanipour, F.; Marzaioli, R.; Bahrami, H.A.; Fereidouni, Z.; Bandarabadi, S.R. Assessment of soil quality indices in agricultural lands of Qazvin Province. Iran. Ecol. Indic. 2014, 40, 19–26. [Google Scholar] [CrossRef]
- Fleiss, J.L.; Cohen, J. The equivalence of weighted kappa and the intraclass correlation coefficient as measures of reliability. Educ. Psychol. Meas. 1973, 33, 613–619. [Google Scholar] [CrossRef]
- Hudson, W.D. Correct Formulation of the Kappa-Coefficient of Agreement. Photogramm. Eng. Remote Sens. 1987, 53, 421–422. [Google Scholar]
- Perroca, M.G.; Gaidzinski, R.R. Avaliando a confiabilidade interavaliadores de um instrumento para classificação de pacientes: Coeficiente Kappa. Rev. Esc. Enferm. USP 2003, 37, 72–80. [Google Scholar] [CrossRef][Green Version]
- Souza, F.B.D.; Souza, É.D.J.C.D.; Garcia, M.C.D.M.; Madeira, K. A fuzzy logic-based expert system for substrate selection for soil construction in land reclamation. REM 2018, 71, 553–559. [Google Scholar] [CrossRef]
- Lai, H.Y. Negative effects of chelants on soil qualities of five soil series. Int. J. Phytoremediat. 2015, 17, 228–234. [Google Scholar] [CrossRef]
- Periago, M.V.; Diniz, R.C.; Pinto, S.A.; Yakovleva, A.; Correa-Oliveira, R.; Diemert, D.J.; Bethony, J.M. The Right Tool for the Job: Detection of Soil-Transmitted Helminths in Areas Co-endemic for Other Helminths. PLoS Negl. Trop. Dis. 2015, 9, e0003967. [Google Scholar] [CrossRef]
- Cheng, J.; Ding, C.; Li, X.; Zhang, T.; Wang, X. Soil quality evaluation for navel orange production systems in central subtropical China. Soil Tillage Res. 2016, 155, 225–232. [Google Scholar] [CrossRef]
- Zhang, G.; Bai, J.; Xi, M.; Zhao, Q.; Lu, Q.; Jia, J. Soil quality assessment of coastal wetlands in the Yellow River Delta of China based on the minimum data set. Ecol. Indic. 2016, 66, 458–466. [Google Scholar] [CrossRef]
- Lin, Y.; Deng, H.; Du, K.; Li, J.; Lin, H.; Chen, C.; Fisher, L.; Wu, C.; Hong, T.; Zhang, G. Soil quality assessment in different climate zones of China’s Wenchuan earthquake affected region. Soil Tillage Res. 2017, 165, 315–324. [Google Scholar] [CrossRef]
- Lin, L.L. Evaluation of different soil conservation practices on a tea plantation in Taiwan. In Soil Erosion; American Society of Agricultural and Biological Engineers: Honolulu, HI, USA, 2001; pp. 187–190. [Google Scholar]
- Raiesi, F. A minimum data set and soil quality index to quantify the effect of land use conversion on soil quality and degradation in native rangelands of upland arid and semiarid regions. Ecol. Indic. 2017, 75, 307–320. [Google Scholar] [CrossRef]
- Juhos, K.; Czigány, S.; Madarász, B.; Ladányi, M. Interpretation of soil quality indicators for land suitability assessment—A multivariate approach for Central European arable soils. Ecol. Indic. 2019, 99, 261–272. [Google Scholar] [CrossRef]
- Lal, R.; Stewart, B.A. Food Security and Soil Quality; CRC: Boca Raton, FL, USA, 2010; p. 418. [Google Scholar]
- Qi, Y.; Darilek, J.L.; Huang, B.; Zhao, Y.; Sun, W.; Gu, Z. Evaluating soil quality indices in an agricultural region of Jiangsu Province, China. Geoderma 2009, 149, 325–334. [Google Scholar] [CrossRef]
- Mukherjee, A.; Lal, R. Comparison of soil quality index using three methods. PLoS ONE 2014, 9, e105981. [Google Scholar] [CrossRef]
- Lin, Z.H.; Qi, Y.P.; Chen, R.B.; Zhang, F.Z.; Chen, L.S. Effects of phosphorus supply on the quality of green tea. Food Chem. 2012, 130, 908–914. [Google Scholar] [CrossRef]
- Millard, P.; Grelet, G.A. Nitrogen storage and remobilization by trees: Ecophysiological relevance in a changing world. Tree Physiol. 2010, 30, 1083–1095. [Google Scholar] [CrossRef]
- Jayaganesh, S.; Venkatesan, S. Impact of magnesium sulphate on biochemical and quality constituents of black tea. Am. J. Food Technol. 2010, 5, 31–39. [Google Scholar] [CrossRef]
- Ruan, J.; Ma, L.; Yang, Y. Magnesium nutrition on accumulation and transport of amino acids in tea plants. J. Sci. Food Agric. 2012, 92, 1375–1383. [Google Scholar] [CrossRef] [PubMed]
- Chan, K. Some aspects of toxic contaminants in herbal medicines. Chemosphere 2003, 52, 1361–1371. [Google Scholar] [CrossRef]
- Kemmitt, S.J.; Wright, D.; Jones, D.L. Soil acidification used as a management strategy to reduce nitrate losses from agricultural land. Soil Biol. Biochem. 2005, 37, 867–875. [Google Scholar] [CrossRef]
- Yu, P.; Yeo, A.S.; Low, M.Y.; Zhou, W. Identifying key non-volatile compounds in ready-to-drink green tea and their impact on taste profile. Food Chem. 2014, 155, 9–16. [Google Scholar] [CrossRef]
- Sidari, M.; Panuccio, M.R.; Muscolo, A. Influence of acidity on growth and biochemistry of Pennisetum clandestinum. Biol. Plant. 2004, 48, 133–136. [Google Scholar] [CrossRef]
- Lucassen, E.C.H.E.T.; Bobbink, R.; Smolders, A.J.P.; Van der Ven, P.J.M.; Lamers, L.P.M.; Roelofs, J.G.M. Interactive effects of low pH and high ammonium levels responsible for the decline of Cirsium dissectum (L.) Hill. Plant Ecol. 2003, 165, 45–52. [Google Scholar] [CrossRef]
- Sharma, K.L.; Shankar, G.M.; Chandrika, D.S.; Grace, J.K.; Sharma, S.K.; Thakur, H.S.; Jain, M.P.; Sharma, R.A.; Chary, G.R.; Srinivas, K.; et al. Effects of Conjunctive Use of Organic and Inorganic Sources of Nutrients on Soil Quality Indicators and Soil Quality Index in Sole Maize, Maize plus Soybean, and Sole Soybean Cropping Systems in Hot Semi-arid Tropical Vertisol. Commun. Soil Sci. Plant Anal. 2014, 45, 2118–2140. [Google Scholar] [CrossRef]
- Plaster, E.J. Soil Science and Management, 6th ed.; Delmar, Cengage Learning: Clifton Park, NY, USA, 2014; pp. 246–279. [Google Scholar]


© 2020 by the authors. Licensee MDPI, Basel, Switzerland. This article is an open access article distributed under the terms and conditions of the Creative Commons Attribution (CC BY) license (http://creativecommons.org/licenses/by/4.0/).