Article

Energy, Exergy, and Sustainability Analyses of the Agricultural Sector in Bangladesh

1
Department of Electrical & Electronic Engineering, Chittagong University of Engineering & Technology, Kaptai Highway, Raozan, Chattogram 4349, Bangladesh
2
Department of Mechanical Engineering, Chittagong University of Engineering & Technology, Kaptai Highway, Raozan, Chattogram 4349, Bangladesh
3
School of Environmental Engineering, University of Seoul, Seoul 02504, Korea
4
COMSATS University Islamabad, Lahore Campus, Raiwind Road, Lahore 54000, Pakistan
5
Chattogram Collegiate School and College, Chattogram 4200, Bangladesh
6
School of Engineering, RMIT University, Melbourne, VIC 3000, Australia
7
CCITR-RI, King Fahd University of Petroleum & Minerals, Dhahran 31261, Saudi Arabia
*
Author to whom correspondence should be addressed.
Co-first authors.
Sustainability 2020, 12(11), 4447; https://doi.org/10.3390/su12114447
Submission received: 11 April 2020 / Revised: 23 May 2020 / Accepted: 28 May 2020 / Published: 30 May 2020

Abstract

:
Globally, the agriculture sector consumes a considerable portion of energy. Optimizing energy consumption and energy loss from different fuel-based types of machinery will increase the energy sustainability of this sector. Exergy analysis is a useful optimizing method that applies the thermodynamic approach to minimize energy loss. The main goal of this study is to highlight the impact of exergy loss on the energy sustainability of the agriculture sector. Hence, this study focuses on the implementation of exergy-based sustainability parameters to determine the sustainability of the agricultural sector in Bangladesh. A comprehensive analysis combining energy, exergy, and sustainability indicators was conducted based on the data obtained from 1990 to 2017. Overall energy and exergy efficiencies varied between 29.86% and 36.68% and 28.2% and 35.4%, respectively, whereas the sustainability index varied between 1.39 and 1.54. The values of relative irreversibility and lack of productivity indices from diesel fuel are higher than that of other fuel types. Maximum relative irreversibility is 0.95, whereas maximum lack of productivity is 2.50. The environmental effect factor of diesel fuel is the highest (2.47) among all the analyzed fuel types. Replacing old farming devices and selecting appropriate farming methods, appliances, and control systems will reduce exergy loss in this sector.

1. Introduction

Energy is the ultimate indicator for determining the advancement of a society. A continuous and reliable supply of energy is essential for ensuring sustainable development [1]. Currently, the necessity of energy is increasing rapidly in all stages of society. To meet this increasing demand, societies are leaning toward fossil fuel energy generation. However, energy generation from fossil fuels has some disadvantages. The increasing use of fossil fuels causes many environmental catastrophes, such as acid rain, global warming, and greenhouse gas emissions, among others [2,3]. Besides this, inefficient equipment and processes are responsible for energy wastage. Increasing the energy efficiency of processes and demand-side energy management can play a vital role in reducing energy loss and overdependence on fossil fuels. Thus, improving the energy efficiency of processes can contribute to better resource utilization and energy savings. Therefore, it is essential to determine the processes that consume and deplete a significant amount of energy. Identifying energy losses and reducing them can also help in obtaining energy efficiency. Exergy analysis is regarded as a powerful technique for obtaining energy efficiency. Exergy can be interpreted as the topmost useful form of energy that can be obtained from a system when it proceeds to a final state in equilibrium with surroundings [4]. It is an optimizing technique that can determine the quantity and location of energy losses [4]. Identifying energy losses opens up the path for future improvement [5]. Reistad first used the sectoral exergy analysis concept to determine energy and exergy utilization in the USA [6]. Reistad’s analysis has since been applied globally to determine sectoral energy and exergy efficiencies. Several studies have used this analysis method in the agricultural sector. Zhang et al. applied exergy analysis in the Chinese agricultural sector [7]. Yildizihan proposed a new approach based on cumulative energy and exergy consumption to determine the irreversibilities in potato production [8]. Yildizihan determined the energy and exergy efficiencies and CO2 emissions associated with strawberry cultivation [9]. Ahamed et al. identified the losses associated with the machinery used in the agricultural sector in Malaysia [4]. Energy and exergy loss diagrams were presented to highlight the fuel loss to the environment. Dincer et al. applied exergy analysis to highlight the energy usage in the agricultural sector in Saudi Arabia [10]. Utlu and Hepbasli investigated the reformation potential of the agricultural sector in Turkey [11]. Ghandoor and Jaber analyzed the agricultural devices used in the Jordanian agricultural sector from the viewpoint of exergy [12]. Avara and Karimi calculated the energy and exergy efficiencies of the agricultural equipment utilized in Iran [13]. An exergetic comparison of the agricultural sectors of different countries was shown in the abovementioned studies. In previous studies based on the agricultural sector, the operating efficiency of lorries and tractors (22%) was assumed similar to that of Reistad [6]. However, the agricultural sector has undergone a significant change over time. Thus, the operating efficiencies for the devices need to be updated. Bligh and Ugursal aimed to update Reistad’s efficiencies for various transportation modes [14]. Based on their findings, this analysis assumes that the operating efficiency for lorries and tractors is 28%. From the available literature, it can be said that conventional studies based on the agricultural sector did not address the sustainability of this sector. Exergy and sustainability are interrelated. The change in exergy efficiency influences the sustainability of a system. Exergy analysis aims to help realize the proper utilization of energy resources. Thus, improving the exergy efficiency of this sector can help toward increasing sustainability and proper energy conservation.
Bangladesh located in South East Asia (latitude and longitude are 23.8511° N and 89.9250° E, (Figure 1) is an agro-based country. The economy of this country is heavily dependent on the performance of its agricultural sector. As of 2017, the agricultural sector contributed approximately 14.75% of total GDP [15]. Approximately 70% of the total population is engaged in agricultural work [16]. The traditional method of farming, overdependence on nature, and the use of inefficient farming devices are major obstacles in the development of the sector. Due to illiteracy, farmers do not use energy-efficient devices. Agriculture is responsible for 5.3% of the total energy consumption of the country [17]. Diesel is used as a major fuel in operating farming machinery. Recently, the use of electricity has increased in this sector. The performance of the sector will always be important for issues such as employment generation, human resource development, food security, and poverty reduction. The main focus of this analysis is to introduce exergetic sustainability indicators for highlighting the exergetic sustainability of the agricultural sector in Bangladesh. The current model is unique as the indicators easily provide knowledge on the trend of energy consumption and the effect of waste energy on the environment and sustainability. Irreversibilities associated with each fuel can be identified, and steps can be taken to minimize the loss of fuel. To the best of our knowledge, no such study exists for the agricultural sector in Bangladesh. Therefore, this study can serve as a representative model for comparing the sustainability of the agricultural sectors in different countries.

2. Methodology and Data Sources

2.1. Basic Relations for Exergy Analysis

Energy is known as the capacity to cause motion [18]. Energy is always a conserved attribute. One of the major drawbacks of energy analysis is that it cannot identify the processes responsible for the depletion of energy. However, in exergy analysis, the area and quantity of exergy losses can be identified [4]. Exergy is always destroyed in the real process. The following subsection presents some of the fundamental relations utilized in exergy analysis. The relationships are derived from Ahamed et al. [4] and Chowdhury et al. [19].

2.1.1. Chemical Exergy

At ambient condition, the specific exergy of a hydrocarbon fuel is equivalent to chemical exergy, as shown in Equation (1):
∈= γff Hff
Table 1 shows the exergy factor of several fuels.

2.1.2. Energy and Exergy Efficiencies

“Energy efficiency is the ratio of energy in products and total energy input while exergy efficiency is the ratio of exergy in products and total exergy input”, as shown in Equations (2) and (3) [20].
Energy efficiency, ɳ = (Energy in products)/(Total energy input)
Exergy efficiency, φ = (Exergy in products)/(Total exergy input)

2.2. Sustainability Index and Depletion Number

Compelling use of energy resources is vital for guaranteeing sustainable development [22,23,24]. Exergy analysis distinguishes the losses related to a procedure. Sustainability can be achieved by reducing exergy losses associated with fossil fuel utilization [25]. Depletion number (DN) is an indicator used to determine the productivity of fossil fuel utilization. DN is the proportion of exergy decimated and exergy input [24,25,26].
D N = E x D e s / E x i n
D N = ( 1 φ )
The sustainability index (SI) is related to the DN. Mathematically,
S I = 1 / ( 1 φ )
Lack of productivity (LOP) and relative irreversibility (RI) are two significant indicators used to estimate the sustainability of a process [27,28].
R I = E x D e s l E x D e s l
L O P = E x D e s l E x p r o d
Two parameters, namely waste exergy ratio (WER) and environmental effect factor (EEF), can be used to show the interconnection between waste exergy and the environment, as shown in Equations (9) to (11).
W E R = E x o u t / E x i n
Total exergy out = Total inlet exergy − Total output exergy
E E F = W E F / φ

2.3. Improvement Potential

Reducing the exergy loss from a sector or process can lead to obtaining maximum exergy efficiency. The exergetic improvement potential (IP) can be used for investigating a system [29] and is expressed as,
I P = ( 1 φ ) × ( E x i n E x o u t )
IP is also written as:
I P = ( 1 φ ) 2 × E x i n
IP can be used as a parameter to show the amount of irreversibility in a system or process. A high IP value suggests that the system has low exergy utilization, and hence, the energy efficiency of the system is low.

2.4. Data Sources

The total fuel utilization of the various devices used in agriculture processes in Bangladesh was collected from the United Nations Statistics Energy Statistics Database [30] and the International Energy Agency [31] and are reported in Table 2. From Table 2, it can be observed that energy consumption in this sector has increased over time. Energy consumption increased from 10.90 PJ in 1990 to 51.40 PJ in 2017. Diesel contributed the most to energy consumption, and overall, its contribution also increased with time (with the exception of some years). The share of electricity increased steadily and attained a value of 5.45 PJ in 2015.

2.5. Methodology

Bangladesh’s agricultural sector mainly relies on diesel to meet its energy demand, and ~90% of energy demand is fulfilled by diesel. Recently, the consumption of electricity has increased in this sector. For instance, electricity consumption in this sector increased from 0.61 PJ in 1990 to 6.44 PJ in 2017, i.e., an increase of more than 90% within two decades. The share of natural gas steadily increased from 1991 to 2017. An increase of ~54% has been observed in the case of natural gas. Farming vehicles such as tractors and lorries have been taken as representative of diesel- and gas-operated devices, while the same has been assumed for electricity-operated devices. Statistics regarding devices and their fuel consumption patterns cannot be utilized due to their unavailability. To determine energy and exergy efficiency, the methodologies proposed by Ahamed et al. [4] and Dincer et al. [10] were adapted. The overall methodology of the study is presented in Figure 2. To evaluate the energy and exergy efficiency of this sector, at first weighting factor is calculated. The weighting factor can be defined as the ratio of energy input in each device by the total sector’s energy input. By multiplying the weighing factor with the energy efficiencies of each device, weighted mean energy efficiencies for each device can be found out. Then, by summing the weighted mean energy efficiencies of each device, the weighted mean overall energy efficiency of the agricultural sector for a particular year can be calculated [4]. Herein, we assume that diesel and natural gas are used to operate agricultural vehicles such as lorries and tractors, and electricity is used to run pumps [11]. The operating efficiency of diesel- and gas-operated devices (28%) are assumed similar to updated Reistad efficiencies for road mode devices [14]. The operating efficiency of electricity is considered as 90% [11]. Using the following equation, the overall weighted mean energy efficiency can be determined:
F ɳo = ∑η × Tr
“By multiplying weighting factors with the energy efficiency of the device divided by the exergy grade function of the fuels, weighted mean exergy efficiency for each device of the agricultural sector is calculated. By summing the weighted mean exergy efficiency of each device, weighted mean overall exergy efficiency of the agricultural sector for a particular year can be calculated” [4]. Using the following equation, the overall weighted mean exergy efficiency can be determined:
FφO = ∑ɳ/γ × Tr
Sustainability analysis was conducted using the parameters presented in Section 2.2.

3. Results and Discussion

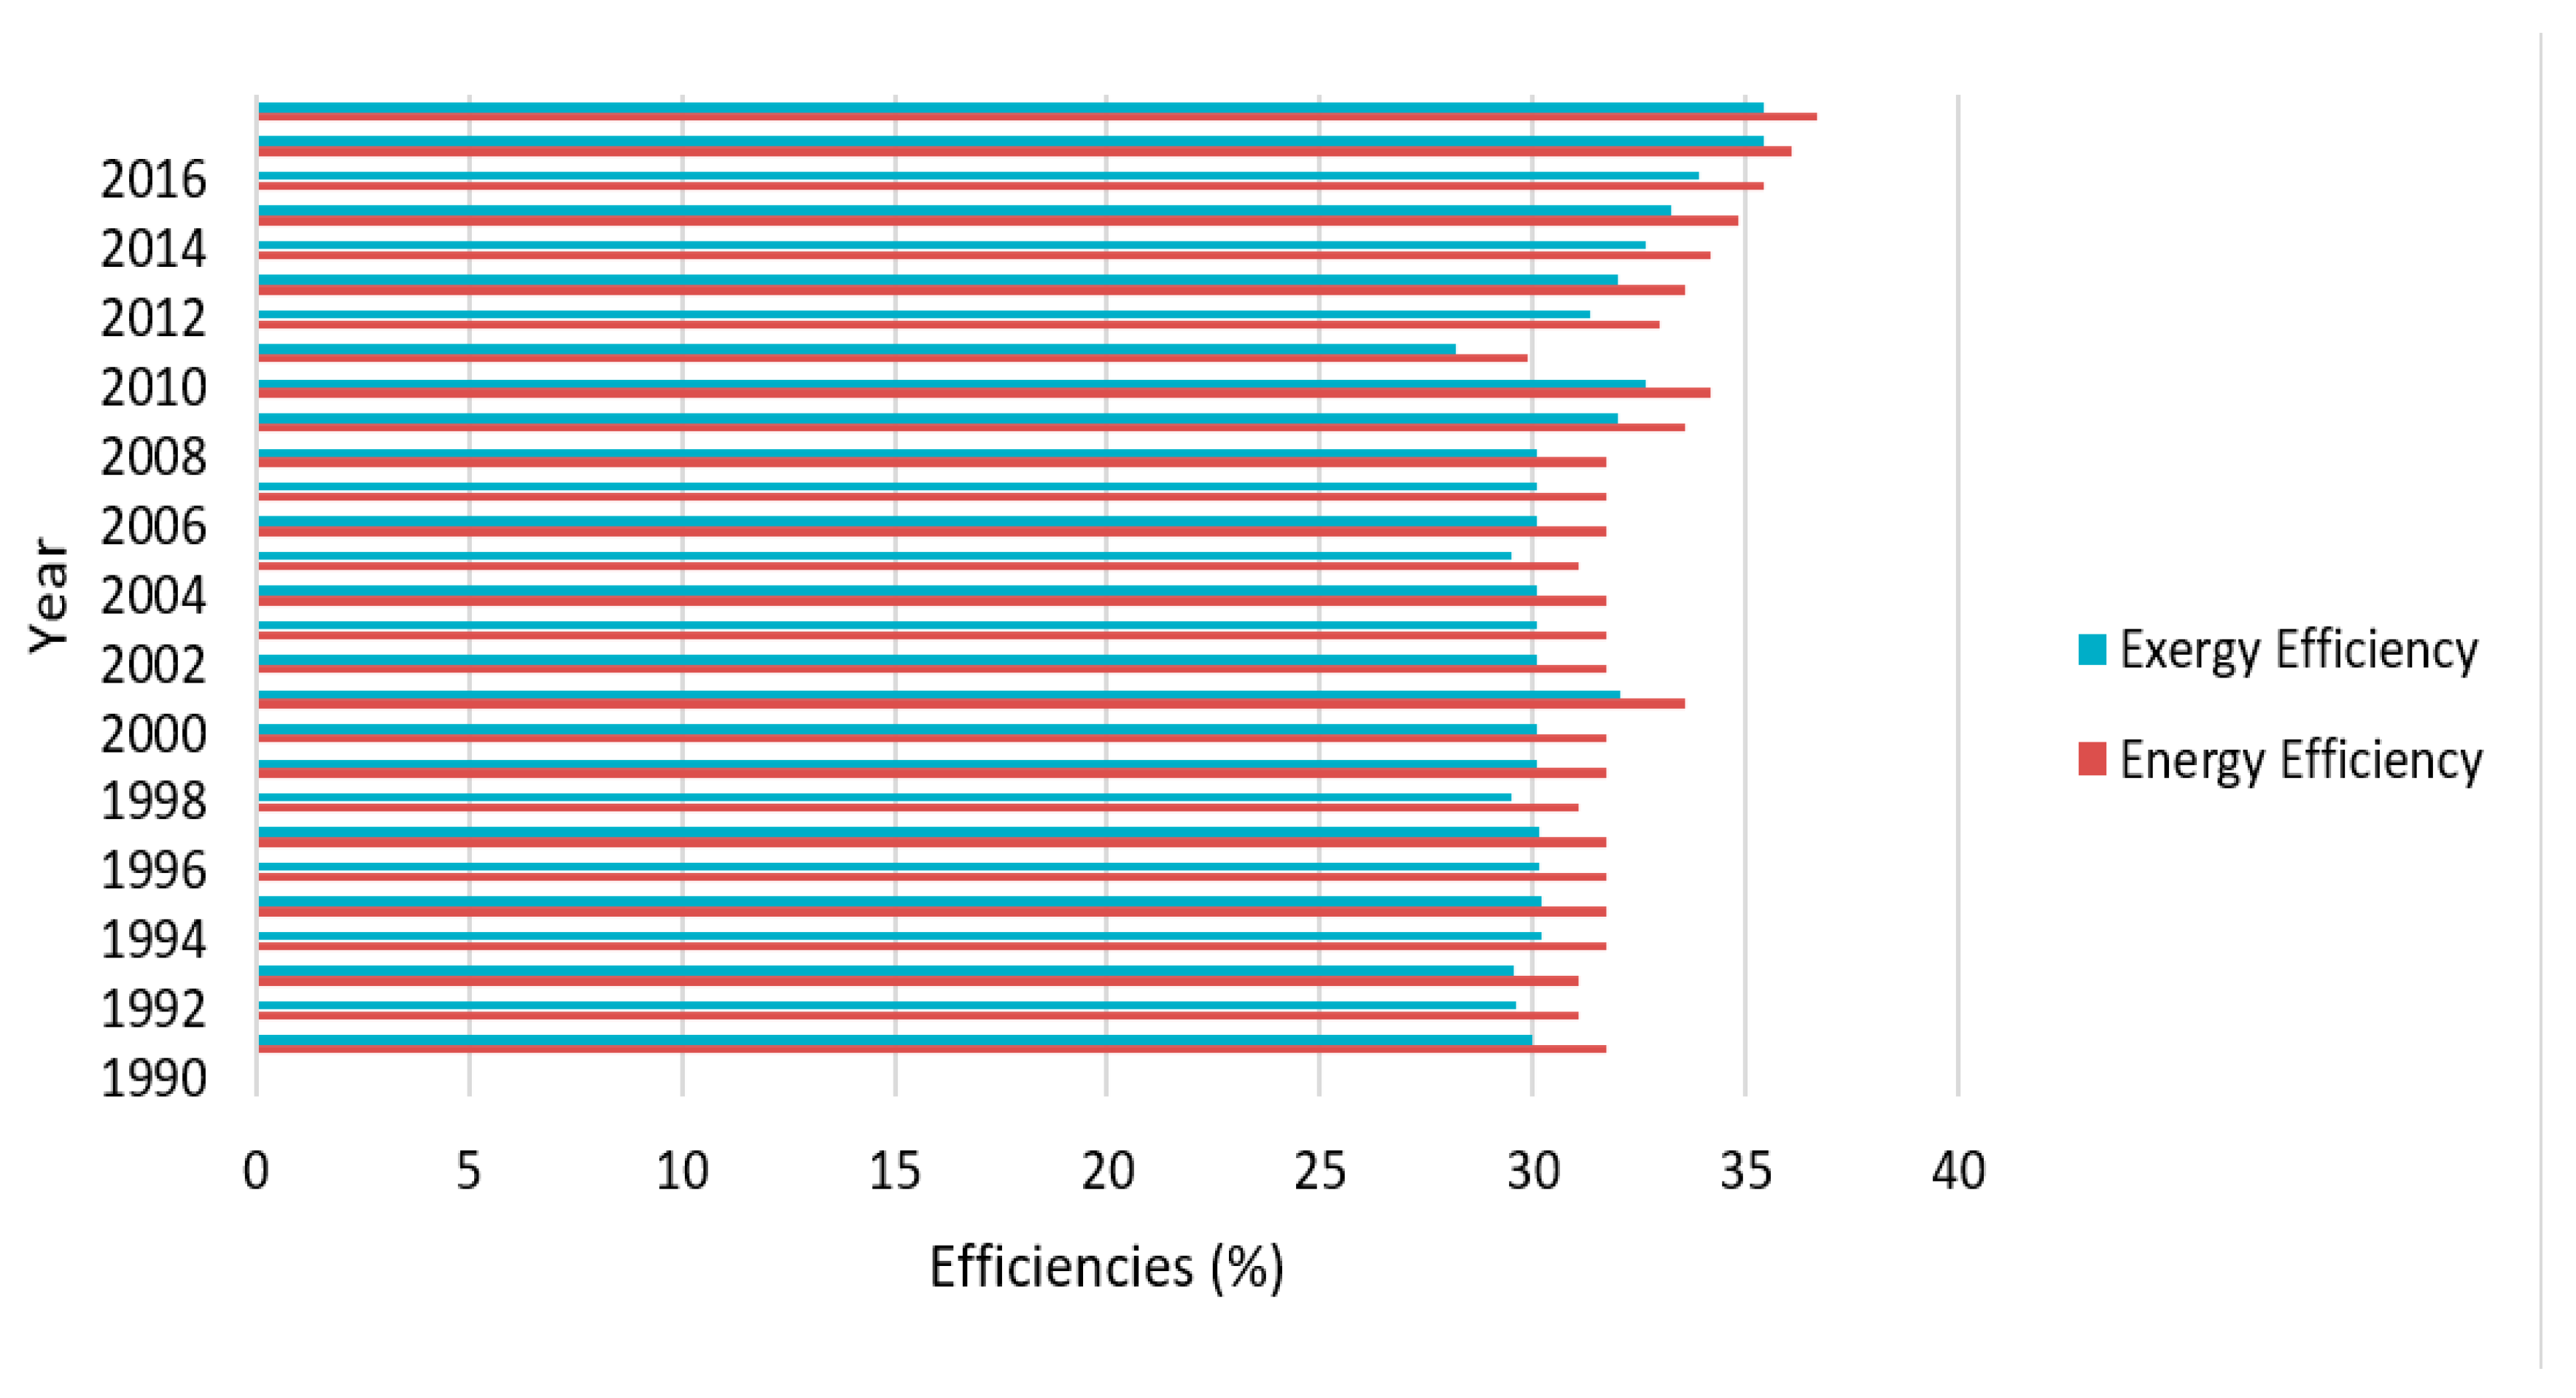
3.1. Overall Energy and Exergy Efficiencies

In this subsection, the overall energy and exergy efficiencies of the agricultural sector in Bangladesh from 1990 to 2017 were determined. Equations (14) and (15) and the energy consumption statistics from Table 2 were utilized to determine these efficiencies. From Figure 3, it can be noted that overall energy and exergy efficiency varied between 29.86% and 36.44% and 28.25% and 32.67%, respectively, during this period. Exergy efficiency was 33.9% in 2015. It is also found that energy efficiency was more than exergy efficiency, as exergy analysis takes into account the irreversibilities of devices. Irreversibilities occur due to work loss in tractors. For minimizing work loss in tractors, work output should be increased for the same input. Minimizing the pressure drop in the pump will help to increase exergy efficiency.
Figure 4 and Figure 5 show energy and exergy consumption for 2010. This year was chosen as both energy and exergy efficiencies were lower than other years due to higher energy and exergy losses. Approximately 37.77 PJ of energy was consumed by this sector in 2010, and most of it was from diesel (approximately 35.63 PJ.) Approximately 10.64 PJ of energy was converted into products and 24.99 PJ was lost. The energy transformation factor of diesel is greater than that of other fuels, but the irreversibilities associated with this fuel are higher. Tractors and other diesel-operated devices used in this sector are old. Most of the farmers operate diesel and other devices, and they are not properly trained in operating them. Besides heat and friction losses, rolling resistance, and tire slip during field operation also contribute toward major energy loss.
Figure 4 shows the exergy consumption of Bangladesh’s agricultural sector in 2010. Approximately 10.05 PJ of exergy turned into products and 25.58 PJ was lost. Diesel accounted for the major portion of exergy, and exergy loss from diesel was higher than that of other fuels. Approximately 24.99 PJ of exergy was lost from diesel, and 10.64 PJ was converted into produce. Irreversibilities were higher for diesel-operated devices. Energy and exergy flow diagrams can be used to easily determine the energy and exergy loss associated with the sector.

3.2. Calculation of Sustainability Indicators

To determine the SI, DN was first calculated using Equation (5). DN is a vital parameter since it outlines the decline in the constructive outcome of this sector. The constructive outcome is delineated as the benefaction provided by this sector to supply more output and minimize the waste exergy losses. For efficient exergy-based sustainability, the reference value of this parameter needs to be zero [27,28,29,30,31]. From our analysis, it has been noted that DN varies fluctuates between 67% and 72%. This higher value is due to higher fossil fuel depletion, and it contributes to lower sustainability. Equation (6) was used to calculate the SI, as shown in Figure 6. From Figure 6, it can be seen that the SI varies between 1.39 and 1.54. Higher SI value was 1.52 in 2015, whereas lower SI value was 1.39 in 2010. The value of SI should be in the range of one to infinity. The higher value of this indicator suggests that the irreversibilities are low, and energy resources were used efficiently. SI was lower as the exergy efficiencies were lower. A low exergy efficiency rating means that the fossil fuel utilization rate is low. Maximum sustainability can be ensured by reducing the DN to zero. The fossil fuel utilization rate can be increased by reducing the irreversibilities of the devices, as stated in the previous section. Table 3 lists the RI, LOP, WER, and EEF for different fuel-operated devices in the Bangladeshi agricultural sector. Equations (7)–(11) were used to calculate these indicators. From Table 3, it is observed that RI and LOP have high values in diesel-operated devices. The RI signifies the loss associated with fuels, whereas LOP signifies the inability of the process or equipment to convert the input into useful produce. The values of the RI and LOP were 0.95 and 2.21 in 1990, respectively, which reduced to 0.87 and 1.70 in 2015, respectively. From Figure 4, it was found that diesel contributed to higher exergy loss than other fuels utilized for agricultural purposes. Due to the higher consumption of exergy from diesel, the loss associated with it also increased. RI and LOP show a decreasing trend with the exception of some years. This was due to neglecting the impact of advancing technologies during this time, and the presumption that the effectiveness of the engaged systems was steady to simplify calculations. From Table 3, it is also noticeable that natural gas-operated devices show lower RI and LOP values. This is because natural gas has lower associated irreversibility due to its higher chemical exergy value than diesel. RI and LOP were also lower for electrically operated devices, as the amount of electrical exergy consumption and loss from these devices was lower.
From Table 3, it can be seen that WER and EEF exhibit higher values for diesel fuel. The maximum WER and EEF values were 0.74 and 2.47, respectively. WER was higher from diesel-operated devices as the exergy losses were higher. WER and EEF are lower for electricity- and gas-operated devices as less exergy is demolished from these fuels. WER is an essential variable since it outlines the necessity of waste energy management in this sector. The value of this variable should lie between zero and infinity. Higher emissions from this sector adversely affect environmental conditions and ecosystems, which is further validated by the higher value of EEF. To reduce the value of WER, focus should be given to minimizing thermodynamic irreversibilities. Machinery and processes responsible for higher losses should be identified, and proper steps should be undertaken to reduce loss.

3.3. Comparison Based on Exergy Efficiency

In this section, the agricultural sector of Bangladesh is compared with that of other countries. The outcome of the analysis is that the exergy efficiency of Bangladesh’s agricultural sector is more than that of Malaysia, Saudi Arabia, or Iran, but less than that of Turkey. Energy and exergy efficiencies of selected countries are listed in Table 4.
In Saudi Arabia and Iran, the energy efficiencies of the pump and tractor are 90% and 22%, respectively. Malaysia uses diesel engines, with an energy efficiency rating of 22%. Pumps are less exergy-efficient (4.53%) than diesel engines (Malaysia 22% and Bangladesh 28%). Thus, Bangladesh and Malaysia are more exergy-efficient than other countries. While comparing Malaysia and Bangladesh, we have assumed that the efficiency of diesel-operated devices in Malaysia is higher than that in Bangladesh [31]. The analysis of the Malaysian agricultural sector did not discuss electricity utilization in this sector. Exergy loss from electricity in the Malaysian agricultural sector is low. Hence, Bangladesh’s agricultural sector is highly exergy-efficient. In the Turkish agricultural sector, the electricity utilization rate is higher than that in Bangladesh. Furthermore, the machinery used is modern and energy-efficient. Besides this, the efficiency of diesel engines in Turkey is taken as 50%, which is higher than that of Bangladesh. Thus, exergy efficiency in Turkey is higher than in Bangladesh.

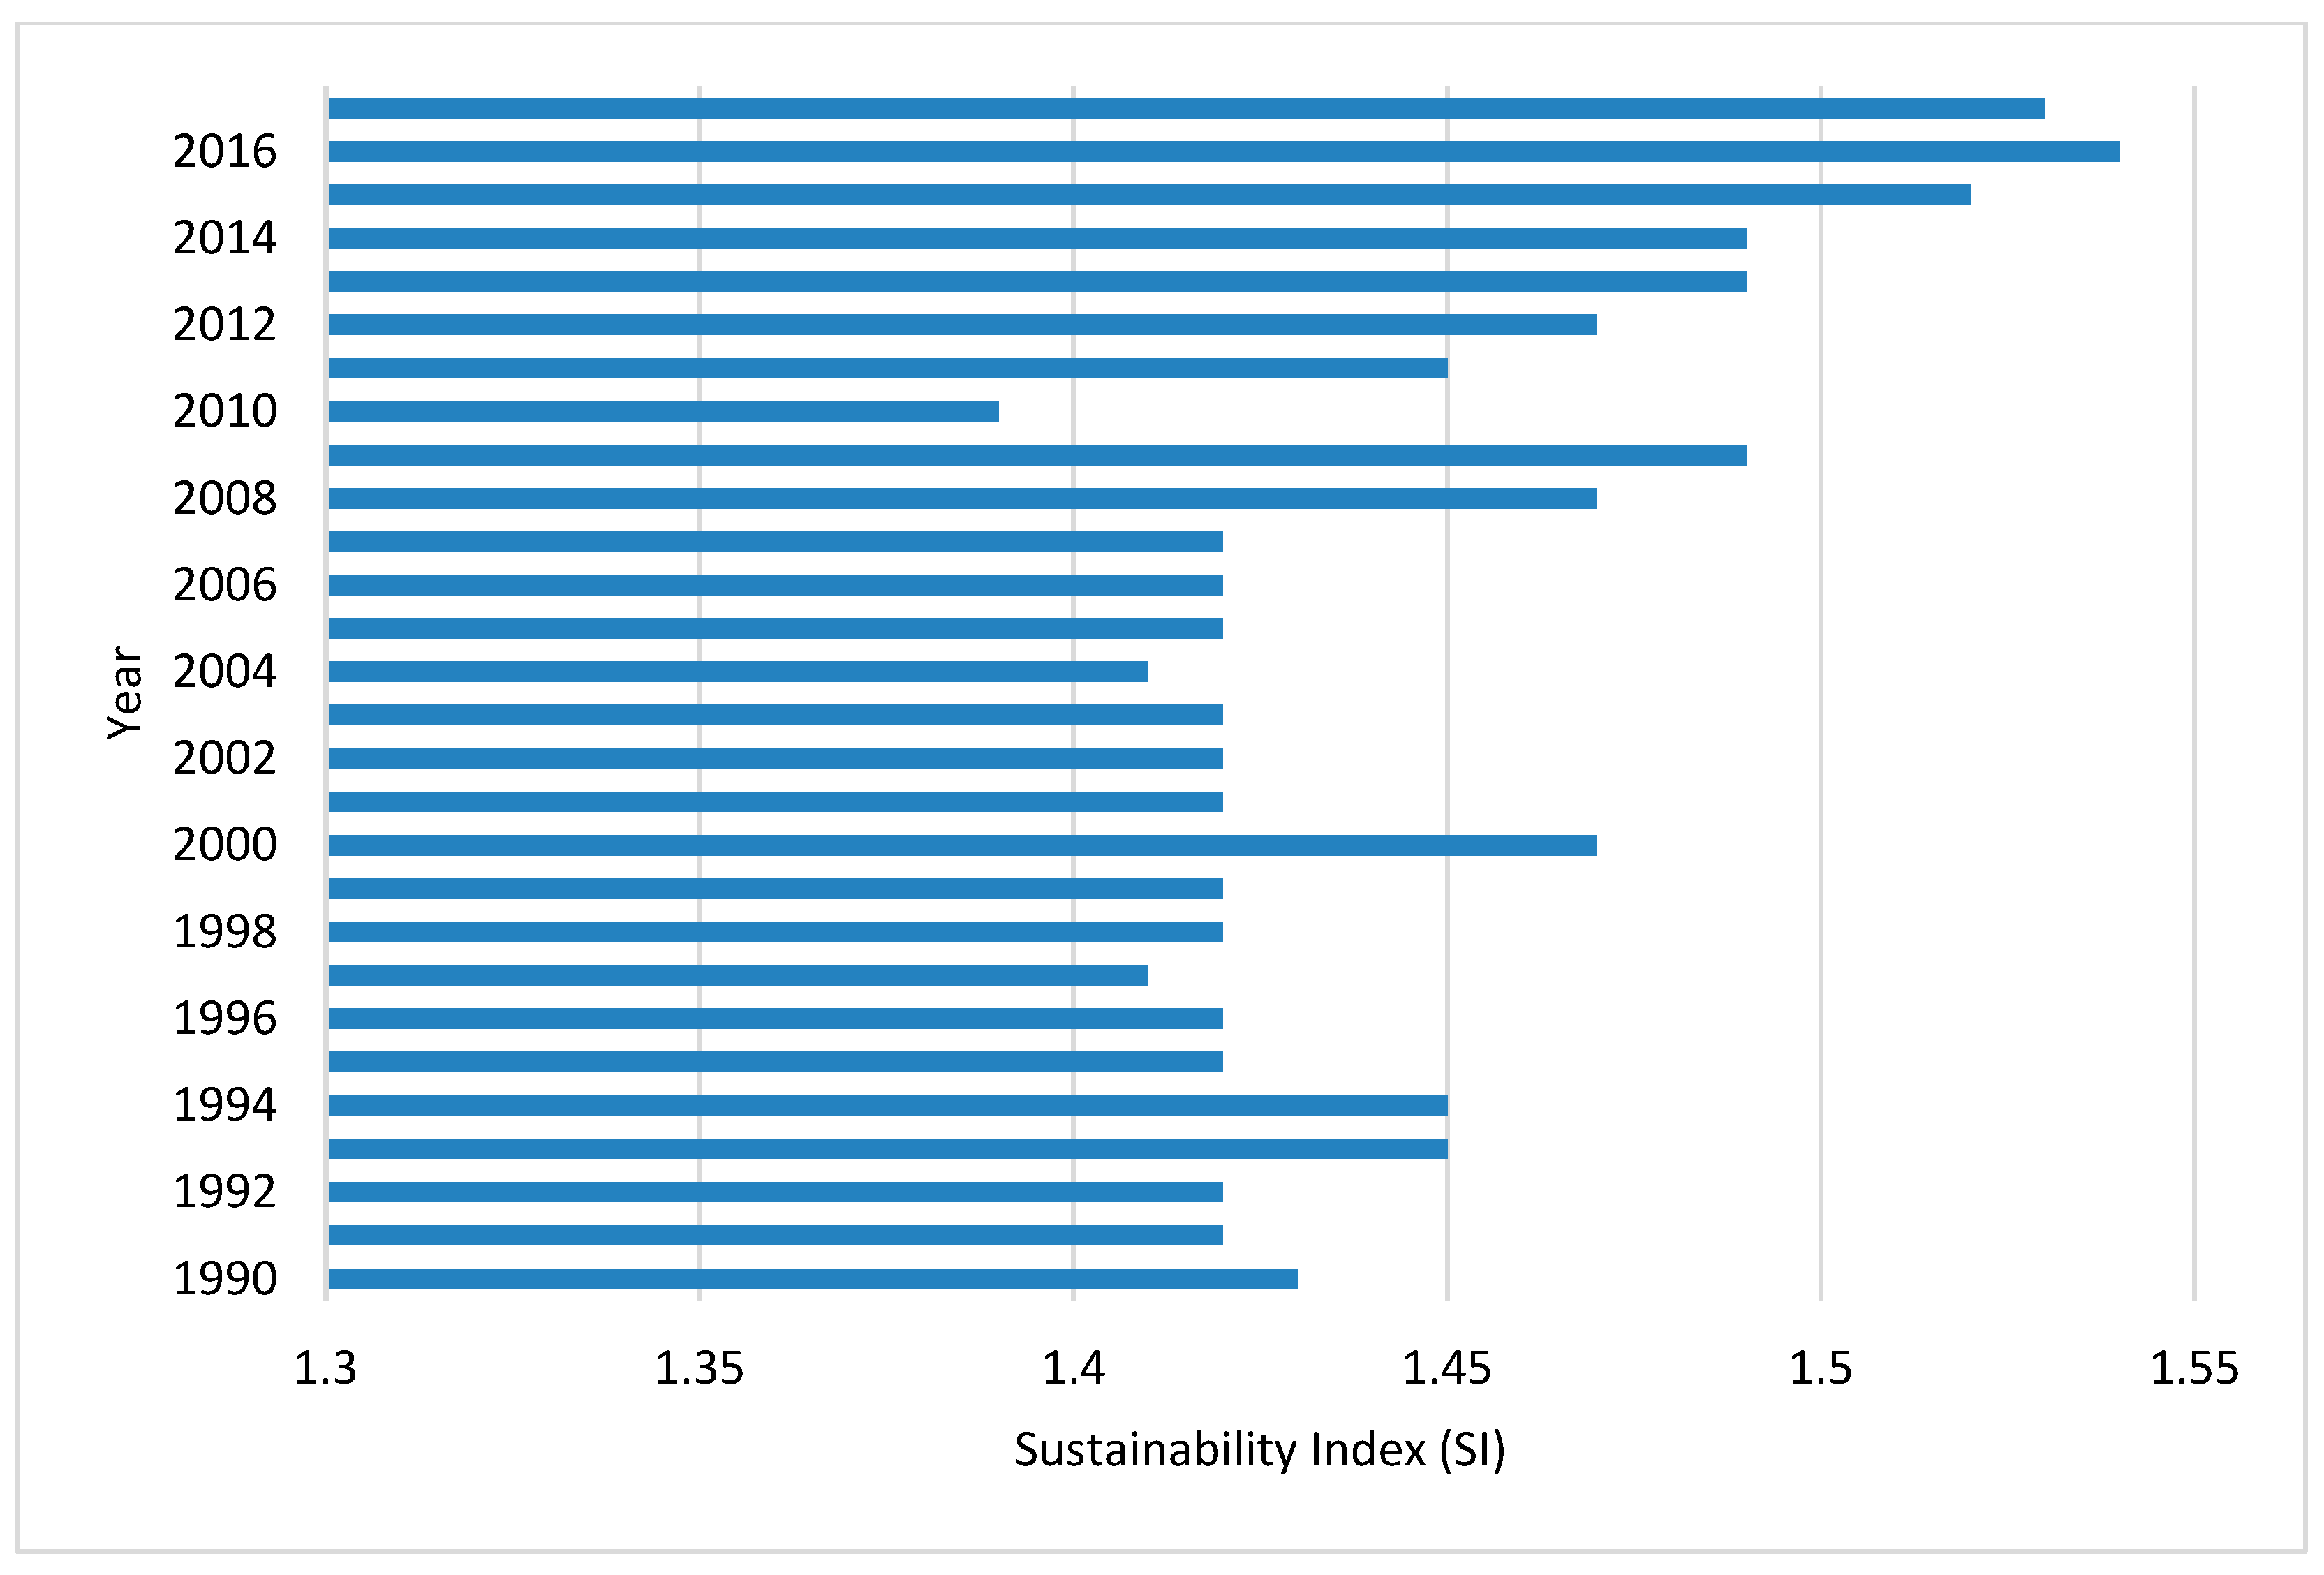
3.4. Comparison in Terms of Sustainability Index

Efficient use of energy resources is essential to ensure sustainable development. The SI can help to address the resource utilization efficiency of a sector. In this section, SI is used as a parameter to compare the Bangladeshi agricultural sector with selected countries. Exergy efficiency statistics from Table 4 were utilized for this comparison. Table 5 indicates the SI value for the selected countries.
Table 5 shows that the SI value of the Turkish agricultural sector is higher than that of Bangladesh. The fuels and devices used in Turkish farming yield higher exergy efficiency. As the exergy efficiency is higher, the DN is lower, and the SI is higher. For other countries, exergy loss from fuels is higher as they are heavily dependent on fossil fuels. In Bangladesh, diesel, natural gas, and electricity are used as fuels. Diesel and electricity have higher exergy utilization factor than other fuels. Therefore, a higher exergy value is obtained for produce, and the amount of exergy losses is lower.

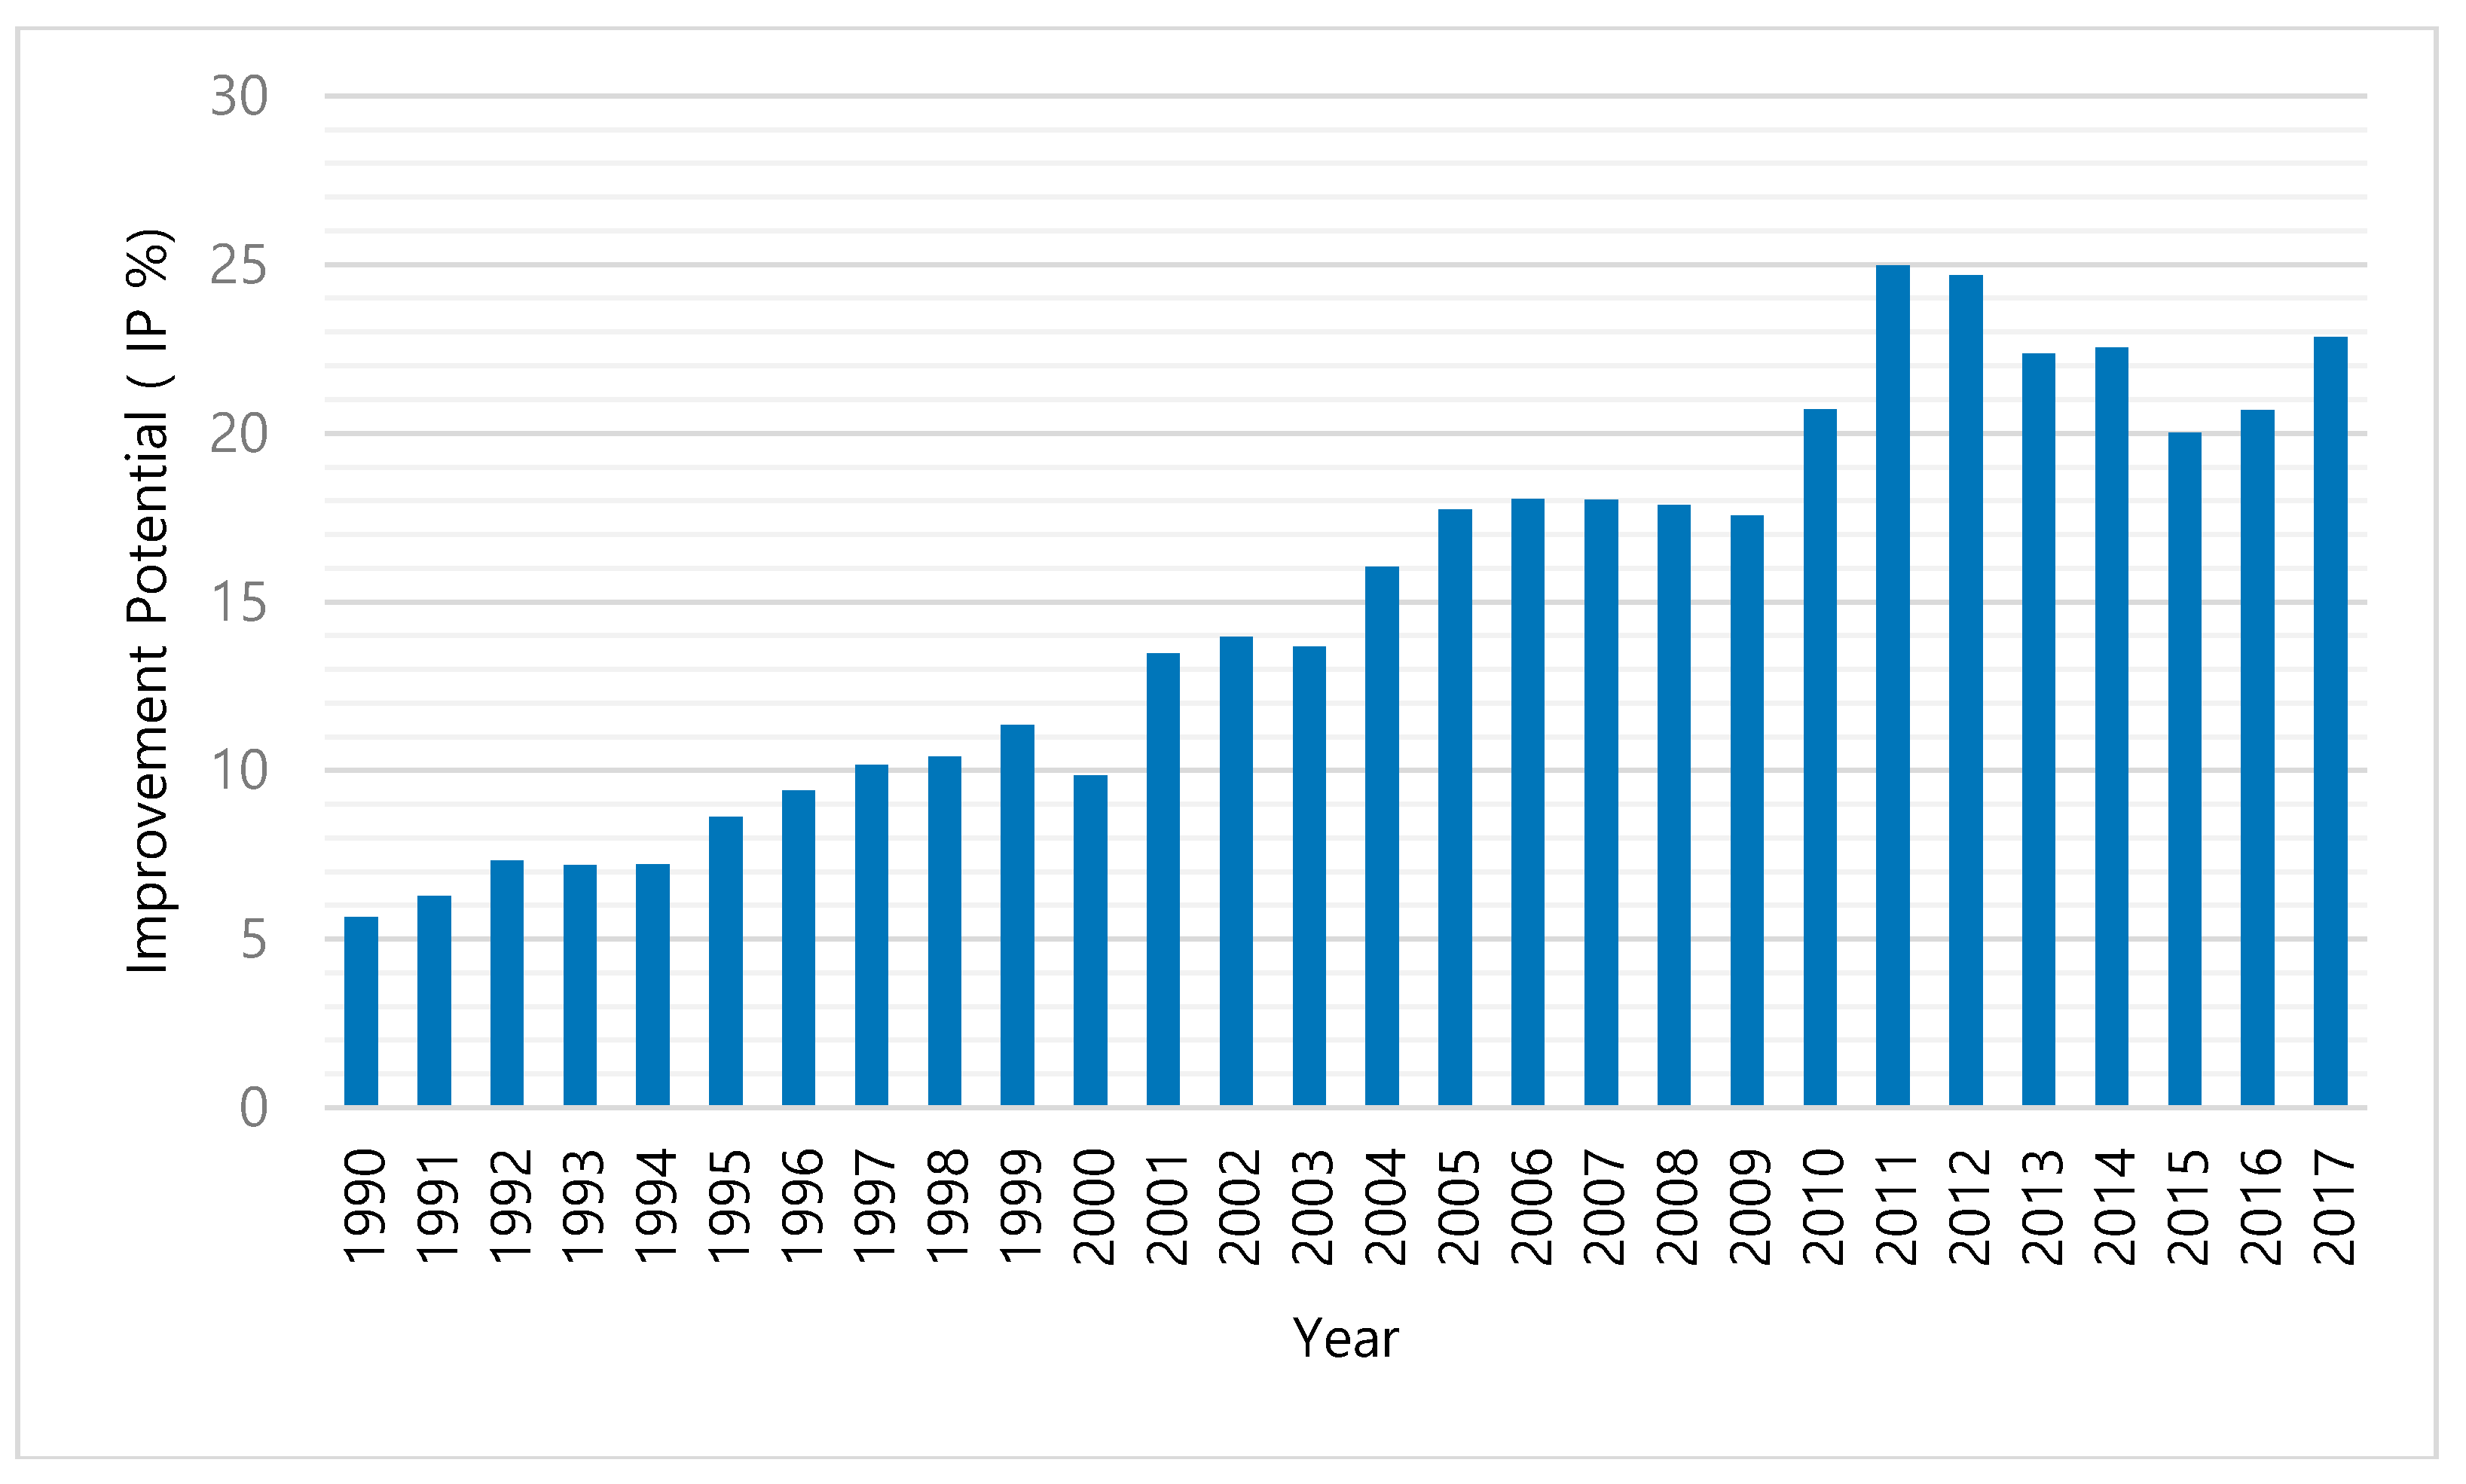
3.5. Improvement Potential

Figure 7 shows the IP of Bangladesh’s agricultural sector.
From Figure 7, an increasing trend in IP is observed. IP was 5.64% in 1990 and 20.02% in 2015. The highest IP value was 24.97% in 2011. An increase in IP value signifies that exergy losses are increasing with time. Utilization of exergy in this sector is much lower than energy. Conscious and systematic actions are necessary to ameliorate exergy utilization in the agricultural sector.

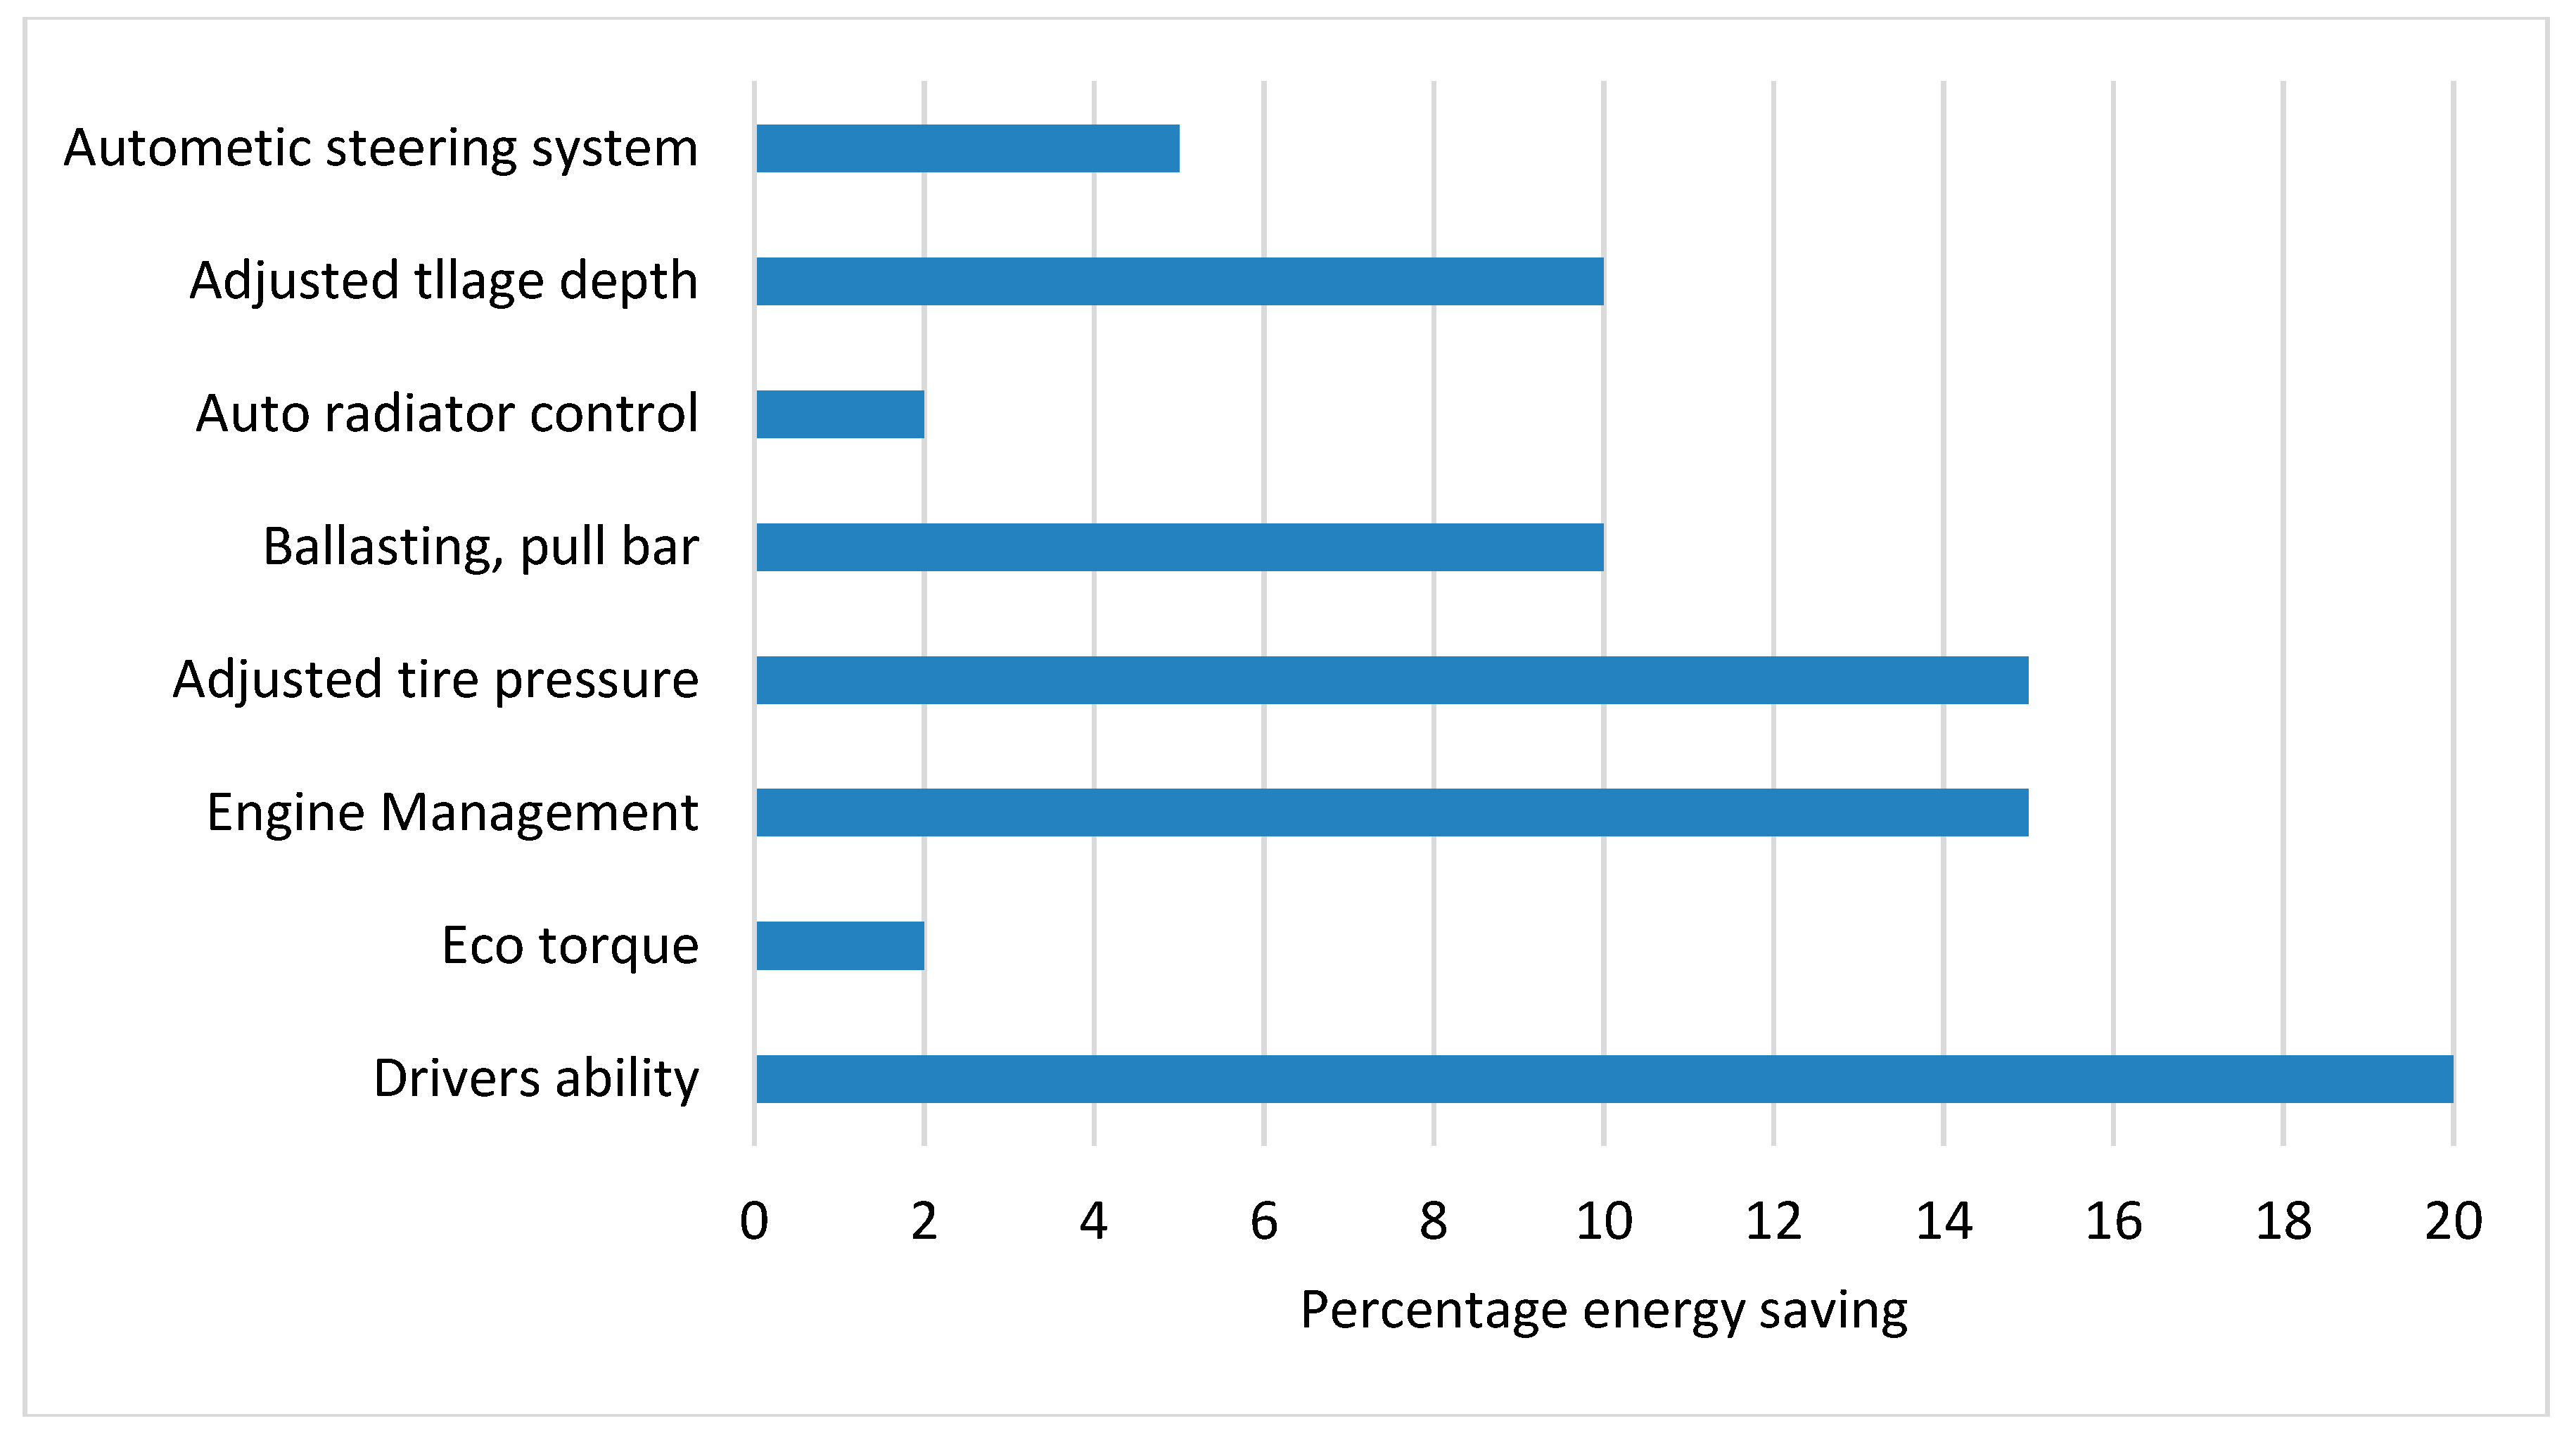
3.6. Strategies for Energy or Exergy Saving

In this section, an analysis of energy-saving potential from different farm devices, such as tractors, lorries, and irrigation pumps, is presented. There are numerous studies on the energy efficiency of diesel-operated devices. About 10–15% of fuel can be saved if an improved engine/transmission system is used. About 10–20% of fuel savings can be achieved using the gear up and throttled down approach [33,34]. Increasing the travel speeds and decreasing load levels of the tractor decrease specific fuel consumption [35]. “Fitting the tractor with a continuously variable transmission system decreases the load levels and increases travel speeds of the tractor” [35]. Approximately 20–55% of energy is lost due to the wear of the tractive device at the soil interface [36]. Thus, reducing wear may help to save a significant amount of energy. An electric tractor is a good alternative that can be used to reduce loss. Utilizing electric tractors can reduce energy consumption and CO2 emissions by 70% [37]. Several strategies that can help in diesel energy saving and their percentages are shown in Figure 8 [38].
From Figure 8, it is evident that 20% of energy can be saved by improving a driver’s ability. If drivers or farmers are properly trained, they can properly use tractors to cultivate land. They can refill the tractor with the proper amount of fuel and adjust the controls and tire pressure correctly. Electronic controlling, such as a variable transmission system, can help to reduce fuel loss. Engine management can help to achieve a proper balance in the load on the engine, which can reduce fuel consumption. Following these recommendations properly can reduce a significant portion of diesel losses, which is presented in Table 6.
From Table 6, it can be seen that engine management and increasing driver’s ability can be effective measures to conserve diesel fuel. Other recommendations may be not economical for a poor country like Bangladesh but creating awareness and teaching proper methods to run diesel operated machinery can contribute to diesel saving. Reducing losses via these recommendations will minimize the depletion of diesel fuel. Hence, irreversibilities and productivity lack associated with diesel machinery will be lowered, which will contribute to lower waste exergy emission and environmental deterioration. Thus, sustainability will be achieved in diesel fuel utilization [39].
In Bangladesh, irrigation pumps consume a considerable amount of energy. As most of the farmers are not properly trained, they do not use energy-efficient pumps. Therefore, a major amount of energy is lost. Besides energy wastage, inefficient pumps put additional pressure on diesel and electricity. Renewable energy sources, such as solar and biogas, can be helpful in reducing this pressure. Because Bangladesh is an agro-based country, the amount of agricultural and farm waste generated is higher than in other countries. This waste can be used to produce biogas, which could be used to operate a pump. Energy consumption was found to decrease by an average of 80.3% and 79% in biogas-operated pumps [40]. Solar irrigation may not be feasible for shorter durations of use due to its higher cost. However, it is more cost attractive for longer periods of cultivation. Hybrid solar irrigation systems, consisting of a solar photovoltaic system with grid electricity, are an attractive choice to reduce the consumption of fossil fuels. It is more cost-effective, and its operation time is higher than a normal solar irrigation system [41].

4. Conclusions

In this study, a detailed analysis of the energy, exergy, and sustainability of the agricultural sector in Bangladesh was carried out, based on actual data from 1990 to 2017. Two main components, the tractor and irrigation pump, were analyzed. The outcomes of this analysis are given below:
  • Overall energy efficiencies differ from 29.86% to 36.68%, and overall exergy efficiencies differ from 28.2% to 35.4% from 1990 to 2017.
  • SI values vary between 1.39 and 1.54 within this period.
  • Bangladesh’s agricultural sector is more sustainable than that of Iran, Jordan, Malaysia, or Saudi Arabia.
  • The RI and LOP from diesel fuel are much higher than that of other fuel types. Maximum RI is 0.95 and the maximum LOP is 2.50.
  • WER and EEF of diesel fuel are higher than that of the other fuels analyzed. The WER value is 0.74, and the EEF value is 2.47.
These losses can be reduced by proper fuel selection. Increased use of electricity can improve this condition. Using modern technology can not only save energy but can also improve production. The replacement of old farming devices with modern ones can reduce energy consumption. Replacing diesel-operated machinery, such as diesel tractors, with electrical tractors can reduce diesel losses. Arranging training programs for farmers and creating awareness regarding energy efficiency and the environmental nexus could reduce emissions from this sector. Increasing awareness regarding the proper farming method and including knowledge about environmental sustainability and cleaner production in school and college textbooks could play a major role in reducing energy losses associated with this sector. A detailed energy audit should be conducted to find out the most convenient energy efficacy measures that befit local climates. Economic analysis, such as an exergoeconomic analysis, should also be taken into consideration in future studies. The potential of various sustainable energy sources, for instance, solar, biogas, and biodiesel, should be investigated in the future.

Author Contributions

T.C. and H.C. developed the conceptualization and methodology of the study. A.A. and Y.-K.P. provided valuable research insights into the study, helped to review the manuscript, and helped with publishing. P.C. provided literature resources and analysis. N.H. and S.M.S. contributed to the writing and provided valuable research insights. All authors have read and agreed to the published version of the manuscript.

Funding

This research received no external funding from any commercial or non-commercial source.

Acknowledgments

The authors would like to thank the Department of Mechanical Engineering, Chittagong University of Engineering & Technology and King Fahd University of Petroleum & Minerals for providing support in preparing this manuscript. The authors would like to thank the late Engineer Farhan Munem for his contribution to this study.

Conflicts of Interest

The authors declare no conflict of interest.

Nomenclature

HHigher heating value (kJ/kg)
WShaft work (kJ)
TrEnergy fraction or weighting factor
FɳoOverall weighted mean energy efficiency (%)
FφoOverall weighted mean exergy efficiency (%)
IPImprovement potential (%)
DNDepletion number
Specific exergy (kJ/kg)
ɳEnergy efficiency (%)
φExergy efficiency (%)
γExergy factor
exOutput condition
ffFuel
inInput condition
oOverall system
Des Destroyed
EEFEnvironmental effect factor
ExExergy
InInput
LOPLack of productivity
RIRelative irreversibility
SISustainability index
WERWaste exergy ratio

References

  1. Ahmed, A.; Bakar, M.S.A.; Hamdani, R.; Park, Y.K.; Lam, S.S.; Sukri, R.S.; Hussain, M.; Majeed, K.; Phusunti, N.; Jamil, F.; et al. Valorization of underutilized waste biomass from invasive species to produce biochar for energy and other value-added applications. Environ. Res. 2020, 186, 109596. [Google Scholar] [CrossRef] [PubMed]
  2. Majeed, K.; Ahmed, A.; Bakar, M.S.A.; Mahlia, T.M.I.; Saba, N.; Hassan, A.; Jawaid, M.; Hussain, M.; Iqbal, J.; Ali, Z. Mechanical and Thermal Properties of Montmorillonite-Reinforced Polypropylene/Rice Husk Hybrid Nanocomposites. Polymers 2019, 11, 1557. [Google Scholar] [CrossRef] [PubMed] [Green Version]
  3. Radenahmad, N.; Morni, N.A.H.; Ahmed, A.; Bakar, M.S.A.; Zaini, J.; Azad, A.K. Characterization of Rice Husk as a Potential Renewable Energy Source. In Proceedings of the 7th Brunei International Conference on Engineering and Technology 2018, Bandar Seri Begawan, Brunei, 12–14 November 2018. [Google Scholar] [CrossRef]
  4. Ahamed, J.U.; Saidur, R.; Masjuki, H.H.; Mekhilef, S.; Ali, M.B.; Furqon, M.H. An application of energy and exergy analysis in agricultural sector of Malaysia. Energy Policy 2011, 39, 7922–7929. [Google Scholar] [CrossRef]
  5. Kanoǧlu, M.; Kazim Işik, S.; Abuşoǧlu, A. Performance characteristics of a Diesel engine power plant. Energy Convers. Manag. 2005, 46, 1692–1702. [Google Scholar] [CrossRef]
  6. Reistad, G.M. Available Energy Conversion and Utilization in the United States. J. Eng. Power 1975, 97, 429. [Google Scholar] [CrossRef]
  7. Zhang, B.; Jin, P.; Qiao, H.; Hayat, T.; Alsaedi, A.; Ahmad, B. Exergy analysis of Chinese agriculture. Ecol. Indic. 2017. [Google Scholar] [CrossRef]
  8. Yildizhan, H. Thermodynamics analysis for a new approach to agricultural practices: Case of potato production. J. Clean. Prod. 2017, 166, 660–667. [Google Scholar] [CrossRef]
  9. Yildizhan, H. Energy, exergy utilization and CO 2 emission of strawberry production in greenhouse and open field. Energy 2018, 143, 417–423. [Google Scholar] [CrossRef]
  10. Dincer, I.; Hussain, M.M.; Al-Zaharnah, I. Energy and exergy utilization in agricultural sector of Saudi Arabia. Energy Policy 2005, 33, 1461–1467. [Google Scholar] [CrossRef]
  11. Utlu, Z.; Hepbasli, A. Assessment of the energy and exergy utilization efficiencies in the Turkish agricultural sector. Int. J. Energy Res. 2006, 30, 659–670. [Google Scholar] [CrossRef]
  12. Al Ghandoor, A.; Jaber, J.O. Analysis of energy and exergy utilisation of Jordan’s agricultural sector. Int. J. Exergy 2009, 6, 491–508. [Google Scholar] [CrossRef]
  13. Avara, A.; Karami, M. Energy and exergy efficiencies in agricultural and utility sectors of Iran compared with other countries. In Proceedings of the 2010 International Conference on Mechanical and Electrical Technology, Singapore, 10–12 September 2010; pp. 6–10. [Google Scholar] [CrossRef]
  14. Bligh, D.C.; Ugursal, V.I. Exergy efficiency factors for transportation: Updated Reistad estimates. Int. J. Exergy 2013, 12, 273–277. [Google Scholar] [CrossRef]
  15. Ministry of Agriculture of Bangladesh (MOA). Available online: http://www.moa.gov.bd/site/page/4fb627c0-d806-4a7e-a1cdb67d4bc85159/Bangladesh-Agriculture-at-a-Glance (accessed on 20 February 2020).
  16. Employment in Agriculture, The World Bank. Available online: https://data.worldbank.org/indicator/SL.AGR.EMPL.ZS?name_desc=false (accessed on 20 February 2020).
  17. Energy Efficiency and Conservation Master Plan up to 2030-SREDA. Available online: http://sreda.gov.bd/files/EEC_Master_Plan_SREDA.pdf (accessed on 22 February 2020).
  18. Wall, G. A Useful Concept. Ph.D. Thesis, Chalmers University of Technology, Gothenburg, Sweden, 1986. [Google Scholar]
  19. Chowdhury, T.; Chowdhury, H.; Thirugnanasambandam, M.; Hossain, S.; Barua, P.; Ahamed, J.U.; Saidur, R.; Sait, S.M. Is the commercial sector of Bangladesh sustainable?—Viewing via an exergetic approach. J. Clean. Prod. 2019, 228, 544–556. [Google Scholar] [CrossRef]
  20. Dincer, I.; Hussain, M.M.; Al-Zaharnah, I. Energy and exergy utilization in transportation sector of Saudi Arabia. Appl. Eng. 2004, 24, 525–538. [Google Scholar] [CrossRef]
  21. Rosen, M.A.; Dincer, I. Sectoral Energy and Exergy Modeling of Turkey. J. Energy Resour. Technol. 1997, 119, 200. [Google Scholar] [CrossRef]
  22. Rosen, M.A.; Dincer, I.; Kanoglu, M. Role of exergy in increasing efficiency and sustainability and reducing environmental impact. Energy Policy 2008, 36, 128–137. [Google Scholar] [CrossRef]
  23. Hossain, N. Characterization of Novel Moss Biomass, Bryum dichotomum Hedw. as Solid Fuel Feedstock. BioEnergy Res. 2019, 13, 50–60. [Google Scholar] [CrossRef]
  24. Barua, P.; Chowdhury, T.; Chowdhury, H.; Islam, R.; Hossain, N. Potential of power generation from chicken waste-based biodiesel, economic and environmental analysis: Bangladesh’s perspective. SN Appl. Sci. 2020, 2, 330. [Google Scholar] [CrossRef] [Green Version]
  25. Cornelissen, R.L. Thermodynamics and Sustainable Development. Ph.D. Thesis, University of Twente, Enschede, The Netherlands, 1997. [Google Scholar]
  26. Connelly, L.; Koshland, C.P. Two aspects of consumption: using an exergy-based measure of degradation to advance the theory and implementation of industrial ecology. Resour. Conserv. Recycl. 1997, 19, 199–217. [Google Scholar] [CrossRef]
  27. Chowdhury, H.; Chowdhury, T.; Chowdhury, P.; Islam, M.; Saidur, R.; Sait, S.M. Integrating sustainability analysis with sectoral exergy analysis: A case study of rural residential sector of Bangladesh. Energy Build. 2019, 202, 109397. [Google Scholar] [CrossRef]
  28. Chowdhury, T.; Chowdhury, H.; Chowdhury, P.; Sait, M.S.; Paul, A.; Ahamed, J.U.; Saidur, R. A case study to application of exergy-based indicators to address the sustainability of Bangladesh residential sector. Sustain. Energy Technol. Assess. 2020, 37, 100615. [Google Scholar] [CrossRef]
  29. Van Gool, W. Energy policy: Fairly tales and factualities. In Innovation and Technology-Strategies and Policies; Soares, O.D.D., da Cruz, A.M., Costa Pereira, G., Soares, I.M.R.T., Reis, A.J.P.S., Eds.; Kluwer Academic Publisher: Dordrecht, The Netherlands, 1997; pp. 93–105. [Google Scholar]
  30. United Nations Energy Statistics Database for Bangladesh. Available online: https://knoema.com/UNSDESD2017/un-statistics-division-energy-statistics-database-1990-2014?location=1000170-bangladesh> (accessed on 23 February 2020).
  31. International Energy Agency Energy Statistics for Non Member Country. Available online: http://www.iea.org/countries/non-membercountries/bangladesh>/ (accessed on 22 February 2020).
  32. Mottaleb, K.A.; Krupnik, T.J.; Erenstein, O. Factors associated with small-scale agricultural machinery adoption in Bangladesh: Census findings. J. Rural Stud. 2016, 46, 155–168. [Google Scholar] [CrossRef] [Green Version]
  33. Grisso, R.; Perumpral, J.V.; Vaughan, D.; Roberson, G.T.; Pitman, R. Predicting Tractor Diesel Fuel Consumption; Virginia Cooperative Extension Publication: Petersburg, Russia, 2010; pp. 442–473. [Google Scholar]
  34. Koniuszy, A.; Kostencki, P.; Berger, A.; Golimowski, W. Power performance of farm tractor in field operations. Eksploat. I Niezawodn. Maint. Reliab. 2017, 19, 43–47. [Google Scholar] [CrossRef]
  35. Farias, M.S.; Schlosser, J.F.; Linares, P.; Barbieri, J.P.; Luis, G.M.N.; Oliveira, F.V.; Rüdell, I.I.P. Fuel consumption efficiency of an agricultural tractor equipped with continuously variable transmission. Ciênc. Rural 2017, 47. [Google Scholar] [CrossRef] [Green Version]
  36. Almaliki, S.; Alimardani, R.; Omid, M. Fuel consumption models of MF285 tractor under various field conditions. Agric. Eng. Int. CIGR J. 2016, 18, 147–158. Available online: http://www.cigrjournal.org (accessed on 20 March 2020).
  37. Ueka, Y.; Yamashita, J.; Sato, K.; Doi, Y. Study on the Development of the Electric Tractor—Specifications and Traveling and Tilling Performance of a Prototype Electric Tractor. Eng. Agric. Environ. Food 2013, 6, 160–164. [Google Scholar] [CrossRef]
  38. Ludwig, V.; Stephan, D.; Sandra, R. How to Increase Diesel Fuel Efficiency in Agriculture. Available online: https://www.landtechnik-online.eu/ojs-2.4.5/index.php/landtechnik/article/viewFile/2011-2-140-143/514 (accessed on 20 March 2020).
  39. Hossain, S.; Chowdhury, H.; Chowdhury, T.; Ahamed, J.U.; Saidur, R.; Sait, S.M.; Rosen, M.A. Energy, exergy and sustainability analyses of Bangladesh’s power generation sector. Energy Rep. 2020, 6, 868–878. [Google Scholar] [CrossRef]
  40. Galil, A.A.; Mostafa, M.M.; Elnono, A.M.; Mohamed, F.M. Biogas utilization for powering water irrigation pump. MISR J. Agric. Eng. 2008, 25, 1438–1453. [Google Scholar]
  41. Haque, M.M. Photovoltaic water pumping system for irrigation. In Proceedings of the 4th International Conference on Mechanical Engineering, Utrecht, The Netherlands, 14–17 October 2001; pp. 21–26. [Google Scholar]
Figure 1. Location of Bangladesh in the world map.
Sustainability 12 04447 g001
Figure 2. The methodology of the study.
Sustainability 12 04447 g002
Figure 3. Overall energy and exergy efficiencies of Bangladesh’s agricultural sector.
Sustainability 12 04447 g003
Figure 4. Energy consumption by fuel type of Bangladesh’s agricultural sector, 2010.
Sustainability 12 04447 g004
Figure 5. Exergy consumption by fuel type of Bangladesh’s agricultural sector, 2010.
Sustainability 12 04447 g005
Figure 6. Sustainability index of Bangladesh’s agricultural sector, 1990–2017.
Sustainability 12 04447 g006
Figure 7. Improvement potential of Bangladesh’s agricultural sector, 1990–2017.
Sustainability 12 04447 g007
Figure 8. Estimated energy-saving potential of various diesel energy-saving strategies.
Sustainability 12 04447 g008
Table 1. Typical values of exergy factor for the fuels encountered in the present study [20,21].
FuelExergy Factor
γff
Natural Gas0.93
Diesel1.07
Electricity1
Table 2. Data for energy use in the agriculture sector of Bangladesh (1990 to 2017) [31,32].
YearEnergy Input Data (PJ)
DieselElectricityNatural gas
199010.170.610
199110.630.620.72
199212.480.750.73
199312.430.790.74
199412.430.810.75
199514.911.110.62
199616.371.090.74
199717.541.040.73
199818.211.110.77
199919.801.340.73
200017.711.750.66
200123.811.440.67
200224.621.500.75
200323.991.610.77
200427.801.770.83
200531.401.890.83
200631.862.060.83
200731.822.080.82
200832.363.320.77
200931.903.930.71
201035.631.260.88
201144.924.100.88
201244.924.560.84
201341.114.480.88
201441.455.450.88
201537.225.190.88
201639.526.060.99
201743.846.441.11
Table 3. Relative irreversibility (RI), lack of productivity (LOP), waste exergy ratio (WER), and environmental effect factor (EEF) of different fuels of Bangladesh agriculture sector.
YearDieselElectricityNG
RILOPWEREEFRILOPWEREEFRILOPWEREEF
19900.952.210.662.20.050.120.040.130.000.000.000.00
19910.902.140.632.10.050.120.030.100.050.110.040.13
19920.901.830.642.130.050.120.040.130.050.110.030.10
19930.902.080.632.10.050.120.040.130.050.110.030.10
19940.902.080.632.10.050.130.040.130.050.110.030.10
19950.912.100.632.10.060.150.040.130.030.080.020.07
19960.912.100.632.10.060.130.040.130.030.080.020.07
19970.922.500.742.470.050.140.040.130.030.090.030.10
19980.922.120.642.130.050.120.040.130.030.070.020.07
19990.912.120.642.130.060.140.040.130.030.070.020.07
20000.891.890.601.880.080.180.060.190.030.060.020.06
20010.932.150.652.170.050.120.040.130.030.050.020.07
20020.922.140.652.170.050.120.040.130.020.060.020.07
20030.922.140.642.130.060.140.040.130.020.060.020.07
20040.922.200.652.170.050.130.040.130.030.060.020.07
20050.932.160.652.170.050.120.040.130.020.050.010.03
20060.922.150.652.170.060.130.040.130.020.050.010.03
20070.922.150.652.170.060.130.040.130.020.050.010.03
20080.901.910.611.910.090.180.060.190.010.040.010.03
20090.881.820.591.790.100.210.070.210.020.040.010.03
20100.952.410.682.430.030.080.020.070.020.050.010.04
20110.911.990.622.00.080.170.050.160.010.030.010.03
20120.901.910.611.910.090.180.060.190.010.030.0010.003
20130.891.840.601.820.090.190.060.180.020.030.010.03
20140.881.760.581.760.100.220.070.210.020.030.010.03
20150.871.700.571.670.110.220.070.210.020.040.010.03
20160.861.590.561.60.120.230.080.230.020.030.020.06
20170.851.580.571.610.110.220.080.240.020.030.010.03
Table 4. Energy and exergy efficiencies of the agriculture sector of some selected countries.
CountryEnergy Efficiency (%)Exergy Efficiency (%)Source
Bangladesh29.86–36.6828.2–35.4This study
Iran29–41.716.9–20.2[13]
Malaysia2220.728[4]
Turkey29.1–41.127.9–37.4[11]
Saudi Arabia27.2520.65[10]
Jordan37.3023.45[12]
Table 5. Calculated Sustainability Index (SI) for some selected countries.
CountrySustainability Index (SI)
Bangladesh1.39–1.54
Iran1.20–1.25
Malaysia1.26
Turkey1.39–1.60
Saudi Arabia1.26
Jordan1.31
Table 6. The amount of exergy (PJ) that can be saved after applying different strategies.
YearDriver AbilityEco-TorqueEngine ManagementAdjusted Tire PressureBallasting,
Pull Bar
Automatic Radiator
Control
Adjusted
Tillage Depth
Automatic Steering
System
19901.520.151.141.140.760.150.760.38
19911.600.161.201.200.800.160.800.40
19921.880.191.411.410.940.190.940.47
19931.860.191.391.390.930.190.930.46
19941.860.191.391.390.930.190.930.46
19952.230.221.671.671.120.221.120.56
19962.450.241.841.841.220.241.220.61
19973.020.302.272.271.510.301.510.76
19982.720.272.042.041.360.271.360.68
19992.960.302.222.221.480.301.480.74
20002.580.261.931.931.290.261.290.64
20013.560.362.672.671.780.361.780.89
20023.680.372.762.761.810.371.810.92
20033.590.362.692.691.800.361.800.90
20044.200.423.153.152.010.422.011.05
20054.70.473.533.532.350.472.351.18
20064.770.483.583.582.380.482.381.19
20074.760.483.583.582.380.482.381.10
20084.710.473.533.532.360.472.361.18
20094.60.463.453.452.300.462.301.15
20105.470.554.114.112.740.552.741.37
20116.600.664.954.953.300.663.301.65
20126.540.654.904.903.270.653.271.63
20135.930.594.444.442.960.592.961.48
20145.920.594.444.442.960.592.961.48
20155.260.533.953.952.630.532.631.32
20165.470.554.104.102.760.552.761.37
20176.040.604.534.533.020.603.021.51

