Article

Analysis of Land Transition Features and Mechanisms in Peripheral Areas of Kyoto (1950–1960)

by
Roberta Fontan Pereira Galvão
1,
Andrea Yuri Flores Urushima
2,*,
Shoichiro Hara
2 and
Wil De Jong
2
1
Foundation Institute of Economic Research-FIPE, São Paulo 01311-928, Brazil
2
Center for Southeast Asian Studies, Kyoto University, Kyoto 6068501, Japan
*
Author to whom correspondence should be addressed.
Sustainability 2020, 12(11), 4502; https://doi.org/10.3390/su12114502
Submission received: 16 March 2020 / Revised: 22 May 2020 / Accepted: 23 May 2020 / Published: 2 June 2020

Abstract

:
This article analyzes land transition in the peripheral areas of Kyoto City during a period of fast economic growth in Japan. Disorganized urban growth during periods of urban transition consumed farmland and forestland, with a lasting impact on the city’s environment. The article reports changes in land use and land cover (LULC), population, roads and other transportation infrastructure and the factors behind these changes. The analysis is based on classification of a georeferenced mosaic of black-and-white aerial photos processed with the use of remote sensing technology to reconstruct the city’s LULC change for the years 1950 and 1960. This information is complemented by GIS data, and information derived from the consultation of primary and secondary historical sources. The results show that the urbanization patterns in periods of urban transition and economic growth which vary in different parts of the city determine LULC trajectories. Complex factors and mechanisms at the local level shape these dynamics. The article provides insights into the complex socioenvironmental processes that shape urban land systems and how their unforeseen consequences can impact the transition to sustainable cities.

1. Introduction

The difference in definitions of urbanization and the variation in methods to quantify urbanization gradients is a persistent challenge in urbanization studies [1,2]. Urbanization debates in general focus on urban demographic dynamics (population urbanization) and the spatial manifestations of urban expansion (land urbanization) [3]. Population urbanization debates focus on demographic dynamics whereas debates on land urbanization include analyses of changes of built-up area, urban land use and land cover (LULC) [4]. The latter are empirically assessed using remotely sensed images, unmanned aerial vehicle technology or cadastral records or surveys. This article considers urbanization to occur when the ratio of urban population in relation to the total population increases within a confined geographic space.
Globally, urbanization is increasing, suggesting that living in cities contributes to socio-economic benefits like access to jobs or other economic opportunities, education and health services. Urbanization, however, has severe environmental impacts, as it contributes to deforestation and fragmented landscapes, to air and water pollution and to the augmentation of impervious surfaces. Urbanization’s impact on landscapes reduces the provision of ecosystem services to beneficiaries who reside in areas beyond cities [5,6,7]. As already over half of the world population lives in cities, and this proportion is expected to increase, many efforts are being undertaken to promote greener, healthier cities that are enjoyable to live in. Sustainable Development Goal 11 specifically addresses the sustainability of cities. Many cities have adopted policies to that end, like green infrastructure expansion including urban forestry, green or carbon neutral buildings, renewable energy, other CO2 emission reduction and other air pollution measures, floodplain development restrictions, open-space provisions and storm-water management infrastructure [8,9].
In the search for a balanced socioenvironmental well-being in cities, the literature discussing urbanization has recognized the relevance of long-term historical urban land-use change [10,11] and the need to assess the dynamics of urban and peri-urban land-systems in relation to progressive urbanization. Research dedicated to the analysis of spatiotemporal patterns of urbanization implies long term analysis of landscape structures and dynamics [12,13], including, for instance, the analysis of carbon sequestration vulnerability caused by land urbanization [14].
One strand of urbanization research aims to clarify the spatial and functional features of land change in peri-urban areas [15]. Such research elucidates the relationship between centric versus polycentric urban sprawl and urban and peri-urban land consumption and LULC change [16,17]. The studies on those topics, however, tend to overlook the interaction of socioeconomic factors and mechanisms behind the formation of urbanization patterns and land consumption. They focus on a city or metropolitan level scale with less concern for the analysis of smaller spatial units including the microscale of neighborhoods. They rely on empirical and quantitative formal research techniques to analyze geographical, geometrical and topological properties. We argue that the analysis of urbanization and land consumption in peri-urban areas and factors that influence those have a lot to gain from information and data from a wide-range of multidisciplinary sources. These can reveal socioeconomic, but also cultural and political drivers of land consumption at varied spatial scales and different moments in time [18]. Considering that urban sprawl has a greater carbon footprint than other forms of LULC change [19,20], it is relevant to identify the factors and mechanisms of land transitions and resulting urbanization patterns. It is also relevant to develop new research approaches that allow us to understand how urbanization patterns occur at smaller spatial scales. These new approaches could provide information useful to pursue future urban and peri-urban sustainable land transition pathways.
This is especially important because the recent literature suggests that sustainable land transitions pathways will need to rely on new approaches, as sustainable development goals (SDGs) have limited ability to measure progress towards environmental sustainability—especially in cities [21]. The SDGs are a large framework to coordinate actions across policy domains with a wide range of goals, targets and indicators which provide a diluted overall guidance. The SDGs still require a more refined elaboration of the complex interactions between goals, of the means-ends continuum towards goals accomplishments and of the description of societal shifts and policy reforms that could actually happen in variable socioeconomic and geopolitical circumstances of localities. Accordingly, urban sustainability very often overlooks the dynamic connection established with rural sustainability [22]. Sustainable land transitions are challenged by the fact that land urbanization processes have been advancing faster than population urbanization. The urban population in China, for instance, increased by 26% since the beginning of the 21st century while the built-up area of cities has expanded by 50% [23]. The area of impervious surfaces increased by more than 502% during the last three decades, and about 73% of the new built-up area was converted from croplands. Sustainable land transition research suggests that planned urbanization has the potential to be more sustainable than uncontrolled sprawl-like type of urbanization [24,25].
Research about urbanization efficiency that takes into consideration development pathways with low environmental impact is quickly advancing [8,26,27]. One recurrent issue emerging in the implementation of plans and actions that consider urbanization efficiency and low environmental impact is the spatial lock-in process that occurs due to institutional and socioeconomic persistence in well-established urban and land systems. Very often the spatial lock-in follows a path-dependence logic [28,29,30] that begins during urbanization linked to accelerated economic growth, urbanization that often results in unplanned expansion into peri-urban areas [31]. Disorganized urban growth during periods of urban transition consumes farmland and forestland with a lasting impact on food provision and nearby green areas. Thus, it is relevant to improve the understanding of the spatial features and the related socioeconomic drivers of urbanization during economic growth periods including variation of intra city dynamics, especially in the case of well-established cities, as this can help with more efficient urban policies for existing cities that experience land pressures.
In order to provide insights into the complex socioenvironmental processes shaping land systems, following concepts of LULC trajectories [32], persistence [33] and path dependence [34,35], this article will analyze the features and mechanisms of land transition in Kyoto City. The analysis focuses on the LULC changes that occurred in the peripheral areas of Kyoto City between 1950 and 1960 using reconstructed images that show spatial transformations. This decade marks the beginning of fast economic growth and related urban transition in Japan.

2. Materials and Methods
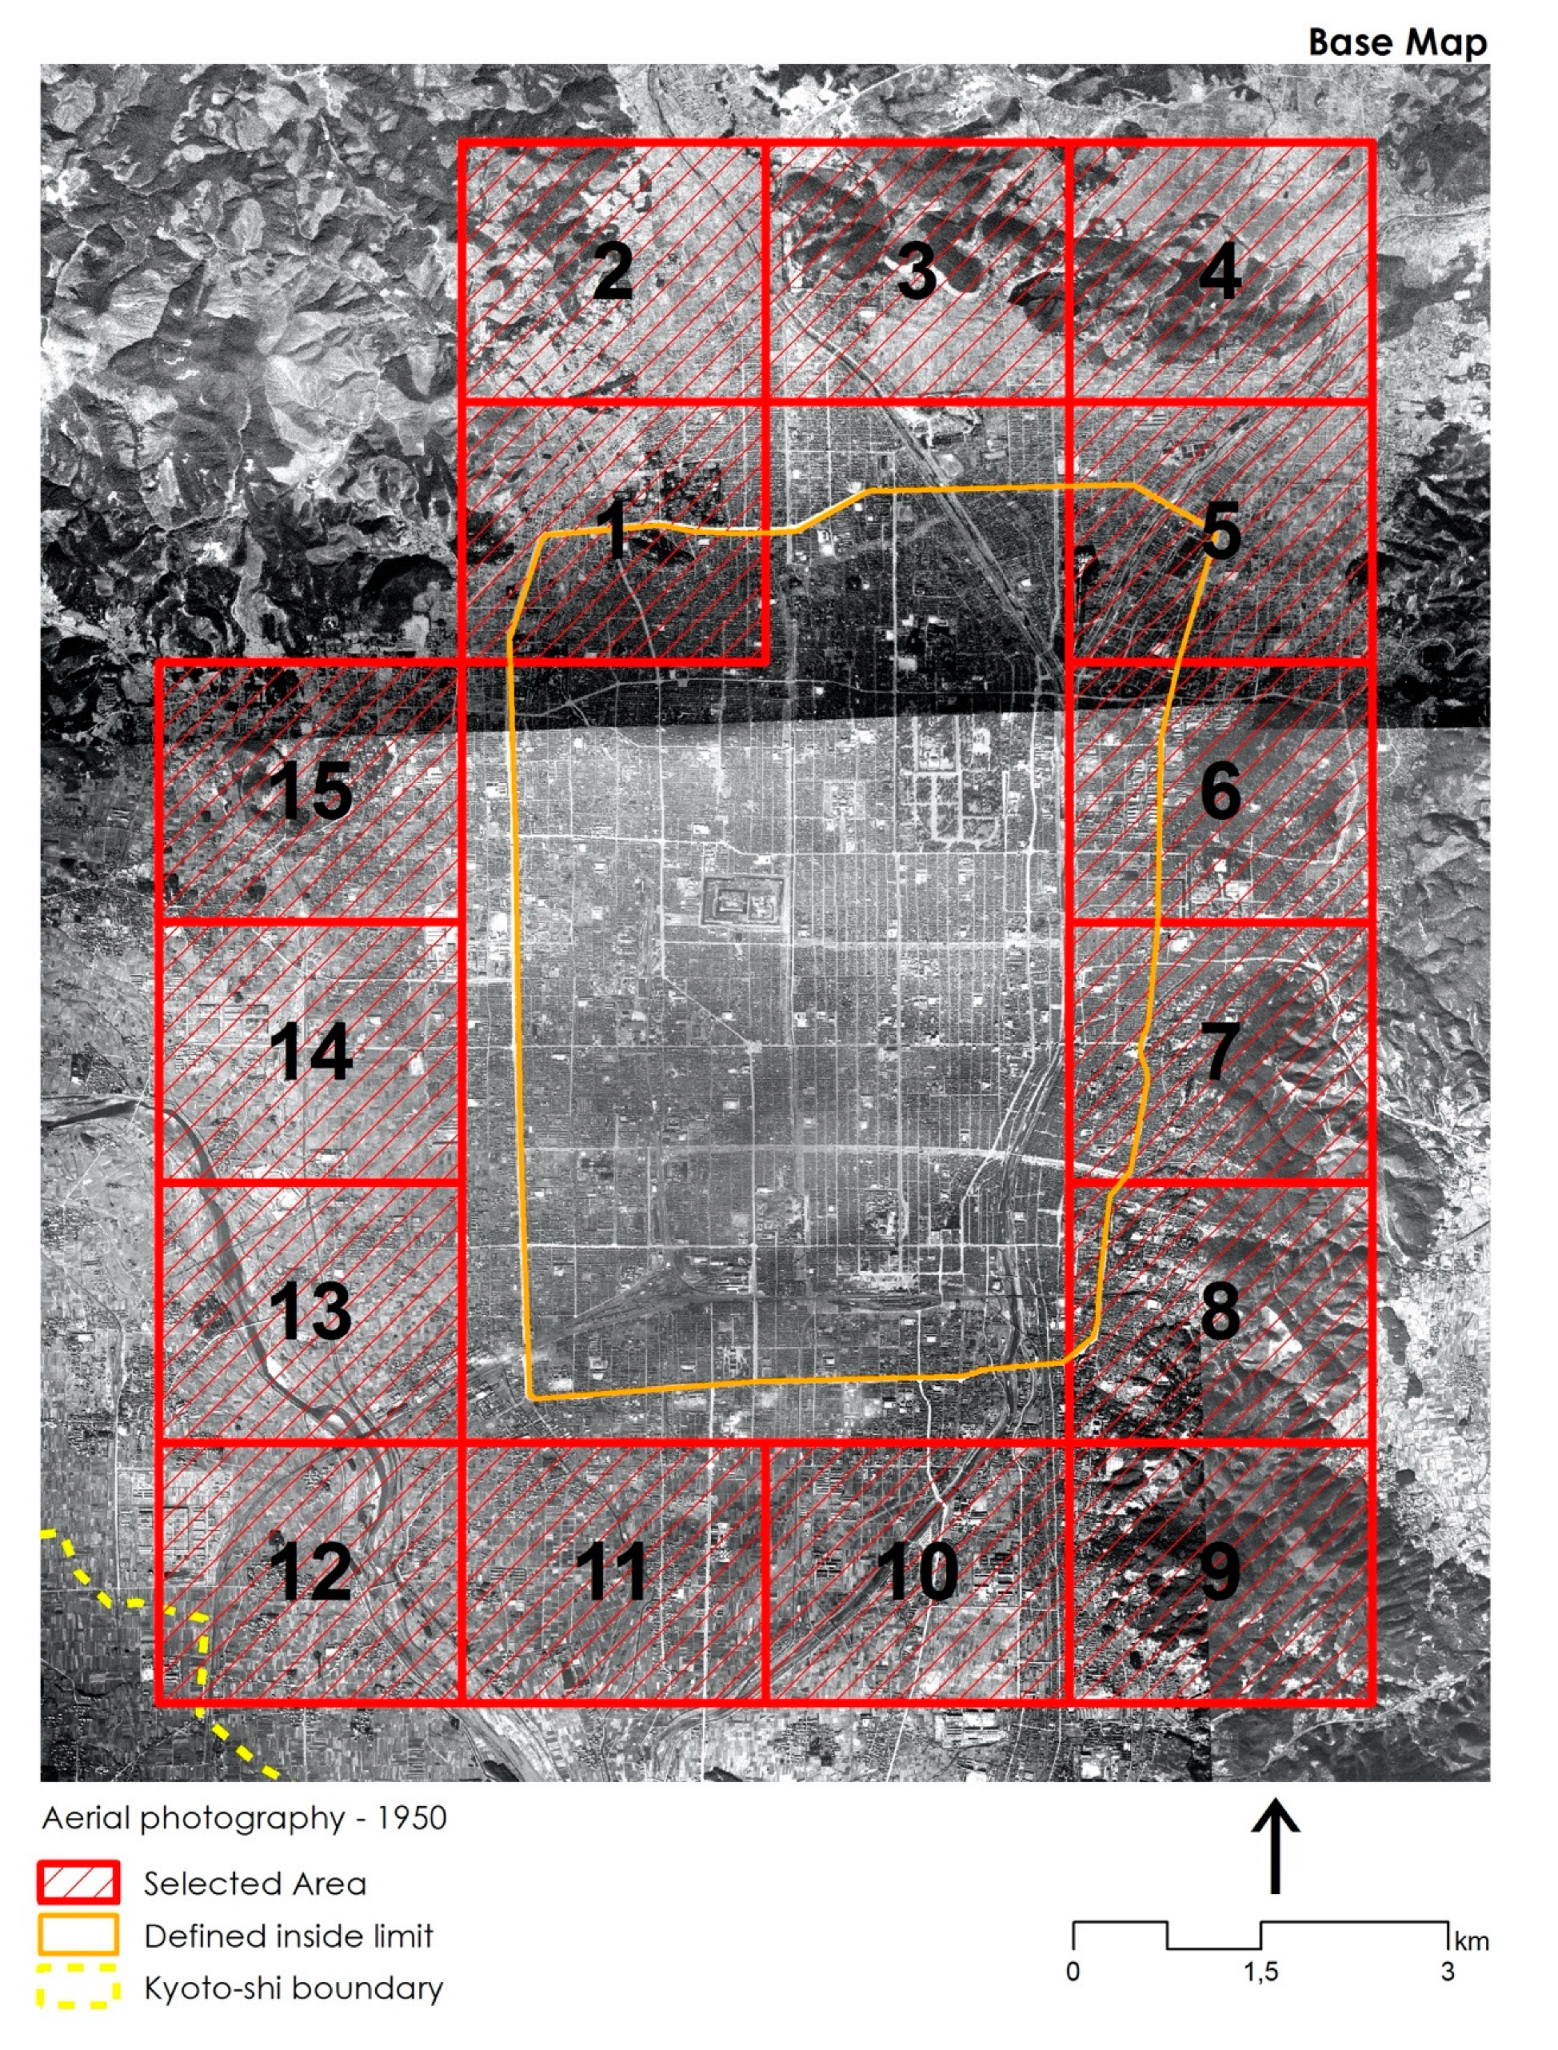
2.1. Study Site

The study site is Kyoto City, the main administrative center of Kyoto Prefecture located in the Kansai Region, Japan. Kyoto used to be Japan’s capital starting from the year 794, and there is evidence of human settlements since the 6th century. Kyoto became a modern municipality during the second half of the 19th century. During and shortly after the war period, between 1940 and 1950 adjacent areas were incorporated into the municipality resulting in complex variations of area and population. In 1950, the area administered by the Kyoto municipal government was 536.45 km² in size and held a population of 1,101,854 inhabitants [36]. Since 1960 the total area of the municipality changed to 610.61 km², at which time the population had increased to 1,284,818 inhabitants (Table 1).
The city is located in the valley part of the Yamashiro Basin and is surrounded by mountains on the northern and eastern sides. This geographical location and the mild temperate climate provide conditions beneficial for agriculture. Agricultural production as the main economic activity has meanwhile been replaced by other economic sectors, including industry and services provision [37]. In 1950, the urban area occupied the central part of the Yamashiro Basin and the natural mountainous barrier constituted an urbanization expansion limit. In this period, non-urban areas occupied 65.97% of the whole of Kyoto City, while 34.03% corresponded to urban areas according to the area calculation based on the neighborhood (chō) administrative division (Table 2) [38]. According to recent population data in 2018 Kyoto City had 1,469,295 inhabitants.

2.2. Data Collection and Analysis

We obtained spatial data for LULC in the peripheral areas of Kyoto City and population data and used geographic information systems (GIS) to analyze the increase of roads and other transportation infrastructure. We also consulted primary and secondary historical accounts to analyze two selected areas of the city’s peripheral area. We acquired black-and-white aerial photographs taken by the US army in the years 1947, 1948, 1963 and 1967 from the Geographical Information Authority of Japan (GSI) [40]. These photos were selected taking into consideration the visibility of the images and the density of clouds. The photographs served as a basis for the definition of LULC categories of Kyoto peripheral areas in 1950 and in 1960. Many images used to reconstruct the 1960 LULC pattern were taken in 1963. This approximation of the year of reference for LULC reconstruction was necessary to allow matching with other datasets. The images were processed with GIS tools and software for remote sensing image processing. The georeferencing process of the aerial photos was based on Digital Globe sources which allowed for the construction of a mosaic of photos covering the entire area of Kyoto City.
The first step consisted of defining a spatial entity with empirical measurable limits that could serve as basis to proceed with a more refined analysis. Within the defined spatial limits of this study, the smaller spatial units that correspond to the administrative divisions of the census survey during the period were identified to allow us the visualization of the population dynamics in the studied area. In addition, reconstructed GIS data of roads and other transportation infrastructure were included to allow the visualization of the changes in accessibility. Finally, we used qualitative methods and analyzed primary and secondary historical sources to correlate changes of LULC, population and accessibility at a smaller spatial scale.
The first step of the research was to define a peripheral zone to be studied from the entire area of Kyoto City. The peripheral zone was defined as the area beyond Nishiōji, Kitayama, Higashiōji and Kūjo streets, which already existed in 1950. The central area within this limit was a consolidated urban area of small variations in terms of LULC. The area located immediately outside this limit maintained features of a peri-urban area (c.f. Geneletti et al. [41]), and included unoccupied exposed soils, paddies and other agricultural fields and forests. The peripheral area also featured historically developed patterns of occupation such as village agglomerations, mixed large modern facilities like schools or industries, and infrastructure. The peripheral area delimited for this study is shown in Figure 1. To proceed with the automatic classification of LULC and analyze land cover changes, the peripheral area was subdivided into 15 squares with approximately an area of 6 km² each. The limits of each square were generated after the placement of a zero reference at the center of the Kyoto Imperial Park (Kyoto Gyoen National Garden).
To undertake the automatic classification of LULC, the photographs of each of the 15 squares were subjected to image segmentation—a procedure used for processing remote sensing images (see Appendix A). This procedure allowed for the automatic recognition of differences in image texture (mean, variance, homogeneity, contrast, dissimilarity, entropy and correlation). Three major processing window parameters (15 × 15, 21 × 21, 31 × 31) were used in combination with the texture information. The resulting texture files were subsequently submitted to the remote sensing image processing software SPRING, using the Bhattacharya algorithm for a supervised classification process (Figure 2). In this process representative training samples were selected for the automatic recognition of each of the predefined LULC categories.
The classification results allowed for the generation of shapefiles for each of the defined six categories: i) built-up areas (BA) characterized by road infrastructure and roofs of buildings; ii) dense forest (DF) with dense contiguous vegetation; iii) exposed soils (ES) with land without vegetation or buildings, clearing in forests and road openings; iv) plantation (Pl) which included paddy fields and rice terraces; v) sparse forest (SF) with vegetation inside the built-up areas, waterfront vegetation, mountain vegetation and cleared areas on mountains; and, vi) water (WA) including watercourses, ponds, lakes, dams and others. The classification results allowed us to calculate the total area of each category.
Data on population distribution according to neighborhood (chō) division was acquired from the Art Research Center databases at Ritsumeikan University [39]. Recent data on transportation infrastructure—dirt roads, paved roads, highways and railways—, was acquired from the Geospatial Information Authority of Japan (GSI) databases in the format of a GIS shapefile [40]. This shapefile was manually processed to reconstruct the existing infrastructure network of Kyoto City for the studied period. At first, the infrastructure shapefile of 2018 was placed over the reconstructed mosaic of images for the entire Kyoto City for 1950 and 1960. The superposition of recent GIS data over past photographic images and topographic maps allowed for the comparison of the actual existing infrastructure network with the still undeveloped infrastructure network of the earlier period. Based on the visual observation of the aerial photos and complementary verification of topographic maps, the absent sections of the infrastructure of the earlier period were manually extracted from the original shapefile to generate two different shapefile layers for each year. The extraction of lacking sections of infrastructure enabled the recreation of the existing infrastructure at the time of the researched periods. The shapefile layers of each period were subsequently overlapped to allow for the visualization of the expansion of infrastructure between 1950 and 1960 (Figure 3).
The most relevant samples (square 14 and Square 8) in terms of the variations in the rates of built-up and non-built-up areas will be analyzed later in more depth in order to discuss in detail the land consumption occurring during the studied period. Detailed examination of Squares 14 and 8 allowed for the recognition of socioeconomic factors, including urban development policies, mobility patterns of population and resource utilization, and their influence on land consumption. Square 14 is roughly delimited to the west by the Mitsubishi Motors Kyoto Plant at Umezu street, the Oike street to the north, Sai street to the east and Chudoji Minami street to the south. Square 8 is roughly delimited by Nara Keihan Line to the west, Jūjo street to the south, Gojo street to the north and the western limit of the Kyoto Municipal Dodo Elementary School. Square 14 encompasses a plain area predominantly occupied by paddy fields in 1950 and was selected as a relevant sample of fast and intense urbanization. Square 8 represents a mountainous area covered by forest and was selected as a relevant example of forest recovery during the studied period. The LULC shifts between the six predefined categories explained above in Squares 14 and 8 were causally linked to infrastructure expansion and population increase. The results are shown in Figure 4, Figure 5, Figure 6 and Figure 7.
A view of the cartography above reveals the territorial transformations in Kyoto during the researched period.

3. Results

The total area of plantation decreased by 31.3% (Figure 8). and the total built-up area expanded by 26.8% during the 1950–1960 period. The analysis of land cover maps indicates a relative increment of the built-up area of 9.19%, a relative decrease of plantation areas of 12.17% and a relative increase of dense forests of 4.82% during that time (Figure 9). The built-up area expansion did not keep pace with population growth as demonstrated in Figure 8. The contrast between built-up area change and population change is even more contrasting when comparing individual squares. Eight squares witnessed a built-up area expansion which is higher than the population growth. Six of those experienced a built-up area expansion more than twice as high as the population growth, demonstrating high rates of land urbanization. These cases likely represent areas with accelerated rural-urban land use conversion caused by public and private expansion of service facilities or industrial production units. In the squares where the relative population increase was much higher than the expansion of built-up areas, population urbanization prevailed. The Squares 8 and 9 are extreme examples, as in those the relative population growth was 5–200 times higher than the relative expansion of built-up areas.
The area of vegetation cover (dense forest, sparse forest and plantations) decreased to 14.2%. If areas with exposed soils are considered representative of vegetation cover because they represent fields that were being prepared for cultivation or where crops had just been planted, then, the vegetation cover dropped to almost 16%. In absolute numbers the variation of the built-up area is similar to the variation of the areas of dense forest, sparse forest, plantation and exposed soil (Figure 10). The results also demonstrate that all the squares lost vegetation area and gained in built-up area with the exception of the Square 8. A relevant case to understand the dynamics of forest land and sparse forest is Square 14 in which the exposed areas and forest areas together increased by over 1200% while the built-up area increased with 67%. A close verification of the aerial photos suggests that much of the exposed soil from 1950 transformed into dense forest or sparse forest in 1960, but their location was integrated into built-up locations or inside areas with plantation cover. The increase of dense and sparse forest apparently represents an increase of tree vegetation and paddy fields in advanced stages of development in urbanized areas or in plantation areas. The relatively large increase in dense forest and sparse forest of this sample should be interpreted carefully, as both represented only 0.39% of the total area of Square 14 in 1950 and reached 5.3% in 1960. These forest covered areas still represent a small proportion of the total area compared to the built-up area of 29.27% in 1950 and 51.07% in 1960.
A similar point can be made for Square 8. The aerial photographs indicate that between 1950 and 1960 much forest regenerated on exposed soil areas, but at the same time the built-up area, which was fragmented in 1950 became more homogenous in 1960.

3.1. Western Urbanization

The analysis of LULC change in Square 14 shows an absolute increase in built-up area to 21.8%, a decrease of plantation areas by 25.78% and a minor increase in dense forest by 0.23%. For the whole area of Kyoto City, the road-infrastructure increased by 3866 km between 1950 and 1960, which represents an expansion of 45.2% of the network (Table 3). In the total peripheral area, analyzed in this article, the roads expanded by 48.35%, larger than the increase of the entire area of Kyoto City. Within Square 14, located in the western side of Kyoto City, the road network more than doubled during this period. Within Square 8 (eastern side), however, the road network increased with only 17.03%. In general, the increase of the road network in the western side of Kyoto City advanced much more dramatically than in the eastern side of the city.

3.2. Southeastern Forest Recovery

The LULC classification analysis of Square 8 shows a decrease of 6.99% of the total built-up area, an increase of 17.78% of dense forest cover areas and an increase of 0.85% of plantation areas. A closer look at the variation of the population dynamics suggests a general trend towards the migration from countryside to urban areas. In particular, the analysis of Square 8 proves that forested areas have steadily lost population and the population within neighborhoods (chō) has increased. Square 8 shows the highest population increase, relative to built-up area growth of all squares. In fact, between 1950 and 1960, in Square 8 the population increased, but the built-up area diminished, a fact that suggests that population density greatly increased near the foot of the mountain. In comparison, the population growth was more evenly distributed in Square 14, where the road network transition was more significant (Figure 11).
In summary, the results demonstrate significant variations in the relationship between built-up area, population and infrastructure growth in the plain western areas, in contrast to the eastern areas where vegetation cover increased. The analysis above suggests that some factors, such as topography, served as drivers for the urbanization pattern in Kyoto City during the economic growth period and revealed the most relevant trends in terms of spatial change, exemplified by the western intensive installation of roads infrastructure coupled with built-up area growth.

4. Discussion

Kyoto City was spared from the massive destruction that befell many other Japanese cities during the second world war. The postwar national industrialization stimulated urban expansion and related urban LULC changes. Between 1950 and 1960, the city’s built-up area increased with 9.19%, but plantation areas decreased with 12.17%. Dense forests, however, increased by 4.82%. As demonstrated by Kinda et. al. [42], industrialization and urbanization have greatly encroached upon rural areas causing fast and uncontrolled rural landscape transformation everywhere in Japan. During the early years after the second world war urbanization, Kyoto City’s peripheral areas experienced the gradual elimination of agriculture and forestry activities. However, LULC changes varied enormously between different areas of the city. These variations correspond to geographical features of areas, mobility of the population and infrastructure developments. The differences in urbanization patterns, both in population growth and built-up area expansion are an expression of socioeconomic accumulation over the urban fabric of Kyoto [28,29,43]. The southern areas are characterized by population urbanization patterns, possibly because these areas historically were connected with Osaka by river and maintained intense socioeconomic interactions with that metropole. The western and northeastern areas of Kyoto, on the other hand, where land urbanization was the typical urbanization development, constitute the more distant spatial limits of a historically developed network of cities. Although the rate of built-up area gains of the entire peripheral area studied was 9.19%, a close examination of the two selected samples demonstrates that in the western area of Kyoto City the built-up area between 1950–1960 increased by 21.8% (square 14), while in the southeastern area a decrease of the built-up area occurred (square 8). These figures indicate that the land consumption in the peripheral areas in one city may vary enormously and this variation is the result of socioeconomic-cultural and geographical features of specific city areas.
The intense urbanization in Square 14 can be explained by its location between five small villages (Uzumasa-mura, Yasui-mura, Yamanouchi-mura, Saiin-mura, Higashi Umezu-mura), which existed until the modern period. In 1950 this area had a basic road network that linked together paddies and other agricultural fields. After 1950 the road network expanded apparently following a planned pattern. This is explained by the fact that in the area four land readjustment projects had been implemented between 1928 and 1971 (Table 4), and three of these projects had been implemented between 1950 and 1970 [44]. These projects were the major drivers of infrastructure development in the area.
In 1950, Square 14 was the location of a large sports facility, the Nishikyōgoku Baseball Ground and of the Mitsubishi Motors Kyoto Plant. These two facilities have also accelerated urban development in this square. In addition, the area was already accessible by trains of the Keifuku Denki Tetsudō Company (Arashiyama Line) and the Keihan Denki Tetsudō Company (now called the Hankyu Kyoto Main Line). Public transportation facilities, especially railways, have been a main catalyst of the sprawl of Japanese cities. The improvement of infrastructure together with the rapid transformation of the spatial economy contributed significantly to the shift in rural-to-urban activities of the population in peripheral city areas.
In peripheral urban areas, the mix of agricultural and urban based activities persisted until the post-war intense urbanization process impacted several cities across the country [45]. In the case of Kyoto City, the natural barriers (mountains around the city) have had a major influence over orienting the spatial direction of the urban expansion, combined with the existence of roads and public transportation. The spatial direction of the urban expansion is also linked to the historical occupation of the Kyoto basin. In the east of the city, several temples had been constructed to form a spiritual barrier to protect the city against natural catastrophes, political instability, wars, epidemics and other misfortunes [46]. The western part of the city represented a territory historically marked by the presence of cemeteries and a low population density, and postwar urban expansion was feasible there.
In comparison to the urban expansion prone Square 14, Square 8 could be divided into two areas with clearly distinct geographical features. One plain area located at the foot of Higashiyama mountain had a dense road network that historically developed intrinsically linked to several temples located in the area. Another mountainous area separates in an east–west direction, Higashiyama Ward and Yamashina Ward. The plain area at the foot of the mountain maintained until 1950 a mix of land uses, and a dense urban fabric composed of housing, schools, temples, traditional industry facilities, commerce and services. The area located on the western side of Higashiyama Mountain, had developed until the modern period as the intersection of five districts and two villages located in an area which is nowadays known as Higashiyama Ward (Ken’ninji Monzen, Daibutsu Mawari, Kyomizu Monzen, Seikanji Mura, Yanagihara Mura, Shin Kumano Mura, Senryūji Monzen, Tōfukuji Monzen) and one village in the Fushimi Ward (Inari Mura). In 1950, the plain area had already reached a high level of urbanization featuring a dense urban fabric that developed during the pre-modern and modern period. After 1950, occupation continued in the plain area at the foot of the mountain, resulting in densification of buildings and people. However, the mountainous area that was sparsely occupied in 1950, saw a process of retreat and abandonment. Takanashi [47] mentioned that the forest landscape of the Higashiyama Mountain range principally started to change during the economic growth period. Although the general forest density has increased after extensive post war planting of trees, the quality of these forests for ecosystem services provision has decreased. This is because the forest cover increase on Higashiyama Mountain concurred with the replacement of coppice forest (Japanese red pine, Pinus densiflora) with laurel forest (primarily Quercus glauca) [48]. People left the area and abandoned customary forest management in mountainous areas. This has also been discussed by Nakajima [49,50,51], who shows that the surrounding forests of Kyoto lost their productive function and were gradually transformed into parks which served the purposes of urban leisure and urban scenery. This reflects cultural changes in how forests are appreciated for their esthetic beauty or as sites for leisure for the benefit of urban dwellers or tourists and no longer for production purposes. However, recent successive extreme weather events occurring during the summer period and particularly in 2018, resulted in landslides in the North of Kyoto City and prefecture. Several reports of trees that fell down over roads or electricity cables blocking access to areas and obstructing the electricity provision, raised criticism of the quality of these forests.
The analysis of the urban expansion of two locations in Kyoto shows that factors and mechanisms that determine urban expansion when scrutinized at a closer scale correspond to LULC trajectories, path dependence and persistence. Recent studies, such as Oda et al. [52], assert that the population of Kyoto City will witness a decrease of 190,000 inhabitants in the future (2010–2040). This decrease represents a loss of a little less than 13% of the total population of 2018 and in amount is comparable to the increase of 182,964 people between 1950 and 1960, which represented about 16.6% of growth. This means that a similar demographic variation is occurring, but in the opposite direction, but this demographic shift will take three times as long. This expected population decline was unforeseen during the post-war period. Oda et al. believe that the population shrinkage since 2010 is already causing a retreat from consumed land [52]. However, because of its current land use trajectory, Kyoto continues until today to lose agricultural land despite the onset of the period of population decline. The land that was once urbanized, even in cases of a decrease in population, is not transitioning back to become agricultural or forested land. In fact, a substantial and sudden loss of agricultural land may still occur in or nearby Japanese cities in the future. This change may come along with the expiration of a law, the Productive Green Land Act (enacted in 1974, revised in 1992), currently set to expire in 2022. This law prohibits the selling of actively cultivated land for uses other than agriculture. The law also reduces the tax burden for agricultural areas, which when the law expires will possibly increase again. The possible expiration of the law has prompted debates about its effect on land prices and how that may increase land pressure towards non-agricultural uses of the land.
Until 2006, there had been neither any effective policy nor any comprehensive agreement across varied social actors to maintain or renew the rural and urban landscape of Japan except for some restricted actions targeting a few areas [42]. After 2006 some rural traditional landscapes have been added to the list of preserved cultural landscapes. This is an outcome of a long trajectory of debate that emerged since the late 1980’s related to the preservation of terraced paddy fields. However, the preservation of specific rural landscapes has not been enough to control land use conversion, and the conversion of agricultural land for other purposes continues to affect local ecologies. The existence of rural areas has strong relevance to the resilience of cities [53], and the conversion of cultivated land not only contributes to ecological stress on surrounding natural areas, but also impacts food chains and natural resources that are important for the wider wellbeing of human settlements. Land conversion caused by cities also contributes to the dismantling of sustainable economies of rural areas nearby those cities.
In the postwar period urban expansion advanced into agricultural areas to accommodate an increasing population of Kyoto City, but the densification of existing urbanized areas also allowed the reforestation of mountainous areas. Kyoto City has been designated as an environmental model city by the Japanese Government since 2009. It is characterized as an eco-city for its efforts to preserve urban landscapes, assure community participation and for its low carbon footprint [54]. The process of densification of urbanized areas opened the path for the implementation of policies towards urban landscape preservation, including the forested surrounding mountains. However, the landslide prone forests in surrounding mountains and the irreversible land consumption that transformed agricultural land in built-up areas have persisted as a legacy that deserves attention for the future discussion of sustainability in city making. The dense occupation of the southern plain urbanized areas between Katsura and Kamo rivers is currently considered a flood risk area, which was not the case in 1950. The southern plain areas were not considered to be areas of high flood risk, but nowadays begin to receive attention as areas with higher risk, especially during the summer period and its torrential rains, when evacuation alerts are recurrent. Sustainable cities in the future will benefit from the proximity of agricultural lands as sources of food, to reduce the city’s carbon footprint, to reduce the density of impervious surfaces and as water overflow areas in cases of extreme weather. Investments in peri-urban forest management allow urban dwellers to enjoy scenic landscapes and forest-based recreation and it should also help against landslides caused by typhoons and torrential rains. The control of the use and densification of built-up areas which may be considered as areas of low risk today may in the future turn into unsafe areas because of changes in weather patterns.

5. Conclusions

Following patterns of path–dependence and persistence, the interventions and decisions made during the urban transition period in Kyoto between 1950 and 1960 left a lasting impact in terms of land consumption, and consequently, in terms of its environmental impact. This analysis serves to inform the debate about possible sustainable scenarios for the growth of cities in regions which are now witnessing processes of urban transition. The analysis in this study demonstrates that the processes of land transition in the context of intensive urbanization should take into consideration current and future population transitions with local specificities, including mechanisms that allow for the reconversion of land use from non-agricultural to agricultural use in the future, together with forest management policies in mountainous areas which are adapted to extreme weather conditions and future risks of flooding where they are now absent. This also reinforces the validity of analysis that takes into consideration long term lifespans of cities and regions and the relevance of planning future urban growth of urbanizing regions under economic growth pressure with a careful consideration to long-term visions.

Author Contributions

“Conceptualization, R.F.P.G., A.Y.F.U., S.H. and W.D.J.; methodology, R.F.P.G., A.Y.F.U., S.H.; validation, R.F.P.G., A.Y.F.U.; formal analysis, S.H. and W.D.J.; investigation, R.F.P.G., A.Y.F.U.; resources, R.F.P.G., A.Y.F.U., S.H.; data curation, R.F.P.G., A.Y.F.U., S.H.; writing—original draft preparation, A.Y.F.U.; writing—review and editing, R.F.P.G., A.Y.F.U., W.D.J.; visualization, R.F.P.G.; supervision, S.H. and W.D.J.; project administration, S.H.; funding acquisition, S.H. and W.D.J. All authors have read and agreed to the published version of the manuscript.”, please turn to the for the term explanation. Authorship must be limited to those who have contributed substantially to the work reported.

Funding

This research was funded by the Kyoto University Research Coordination Alliance, Unit of Academic Knowledge Integration Studies and the Research Unit for Development of Global Sustainability.

Acknowledgments

The authors of this article are indebted to the direct support received from SPRING developers at the Brazilian National Institute of Spatial Research (Instituto Nacional de Pesquisas Espaciais-INPE) especially to Rosa Kato and Leonardo Sant’Anna Bins for the support and the suggestions of the best methods of image classification using texture features. We are also indebted to the support from Nakamura Keigetsu, at that time a doctoral student at the Department of Architecture of Kyoto University, who suggested data sources and worked for the reconstruction of the historical infrastructure network of the areas researched in this article. Finally, we would like to express our gratitude to prof. Yano Keiji at the Art Research Center of Ritsumeikan University [39] for providing the data related to population distribution according to neighborhood limits (chō) of the researched period.

Conflicts of Interest

The authors declare no conflict of interest. “The funders had no role in the design of the study; in the collection, analyses or interpretation of data; in the writing of the manuscript or in the decision to publish the results.”

Appendix A

The images were mainly processed with the use of the software SPRING, complemented by the use of varied software, such as ENVI and ArcGIS. SPRING is a remote sensing image processing system with an object-oriented data model which provides for the integration of raster and vector data representations in a single environment. SPRING is a product of Brazil’s National Institute for Space Research (INPE/DPI, Image Processing Division) with assistance from EMBRAPA/CNPTIA—Brazil’s Agricultural Research Agency; IBM Brazil; TECGRAF—Computer Graphics Technology Group; PETROBRÁS / CENPES. The SPRING project also received support from the CNPq (National Research and Development Agency). For more information see [55].

References

  1. Short Gianotti, A.G.; Getson, J.M.; Hutyra, L.R.; Kittredge, D.B. Defining urban, suburban, and rural: A method to link perceptual definitions with geospatial measures of urbanization in central and eastern Massachusetts. Urban Ecosyst. 2016, 19, 823–833. [Google Scholar] [CrossRef]
  2. Alkema, L.; Jones, G.W.; Lai, C.U.R. Levels of urbanization in the world’s countries: Testing consistency of estimates based on national definitions. J. Popul. Res. 2013, 30, 291–304. [Google Scholar] [CrossRef]
  3. Melchiorri, M.; Florczyk, A.J.; Freire, S.; Schiavina, M.; Pesaresi, M.; Kemper, T. Unveiling 25 years of planetary urbanization with remote sensing: Perspectives from the global human settlement layer. Remote Sens. 2018, 10, 768. [Google Scholar] [CrossRef] [Green Version]
  4. Mundhe, N.; Jaybhaye, R. Impact of urbanization on land use/land covers change using Geo-spatial techniques. Int. J. Geomat. Geosci. 2014, 5, 50–60. [Google Scholar]
  5. Fahey, R.T.; Casali, M. Distribution of forest ecosystems over two centuries in a highly urbanized landscape. Landsc. Urban Plan. 2017, 164, 13–24. [Google Scholar] [CrossRef] [Green Version]
  6. Treby, D.L.; Castley, J.G. The impacts of historical land-use and landscape variables on hollow-bearing trees along an urbanisation gradient. Urban For. Urban Green. 2016, 15, 190–199. [Google Scholar] [CrossRef]
  7. Tao, Y.; Li, F.; Liu, X.; Zhao, D.; Sun, X.; Xu, L. Variation in ecosystem services across an urbanization gradient: A study of terrestrial carbon stocks from Changzhou, China. Ecol. Model. 2015, 318, 210–216. [Google Scholar] [CrossRef]
  8. Shafique, M.; Kim, R. Retrofitting the Low Impact Development Practices into Developed Urban areas Including Barriers and Potential Solution. Open Geosci. 2017, 9, 240–254. [Google Scholar] [CrossRef] [Green Version]
  9. Shafique, M.; Xue, X.; Luo, X. An overview of carbon sequestration of green roofs in urban areas. Urban For. Urban Green. 2020, 47, 126515. [Google Scholar] [CrossRef]
  10. Miao, L.; Zhu, F.; Sun, Z.; Moore, J.C.; Cui, X. China’s Land-Use Changes during the Past 300 Years: A Historical Perspective. Int. J. Environ. Res. Public Health 2016, 13, 847. [Google Scholar] [CrossRef] [Green Version]
  11. Dearing, J.; Braimoh, A.; Reenberg, A.; Turner, B.; van der Leeuw, S. Complex Land Systems: The Need for Long Time Perspectives to Assess their Future. Ecol. Soc. 2010, 15. [Google Scholar] [CrossRef] [Green Version]
  12. Li, J.; Deng, J.; Wang, K.; Li, J.; Huang, T.; Lin, Y.; Yu, H. Spatiotemporal Patterns of Urbanization in a Developed Region of Eastern Coastal China. Sustainability 2014, 6, 4042–4058. [Google Scholar] [CrossRef] [Green Version]
  13. Salvati, L. Urban Growth and the Spatial Structure of a Changing Region: An Integrated Assessment. J. Urban Reg. Anal. 2014, 6, 5–14. [Google Scholar]
  14. Wu, J.; Chen, B.; Mao, J.; Feng, Z. Spatiotemporal evolution of carbon sequestration vulnerability and its relationship with urbanization in China’s coastal zone. Sci. Total Environ. 2018, 645, 692–701. [Google Scholar] [CrossRef] [PubMed]
  15. Salvati, L.; Carlucci, M. The way towards land consumption: Soil sealing and polycentric development in Barcelona. Urban Stud. 2016, 53, 418–440. [Google Scholar] [CrossRef]
  16. Salvati, L.; Venanzoni, G.; Serra, P.; Carlucci, M. Scattered or polycentric? Untangling urban growth in three southern European metropolitan regions through exploratory spatial data analysis. Ann. Reg. Sci. 2016, 57, 1–29. [Google Scholar] [CrossRef]
  17. Zambon, I.; Serra, P.; Grigoriadis, E.; Carlucci, M.; Salvati, L. Emerging urban centrality: An entropy-based indicator of polycentric development and economic growth. Land Use Policy 2017, 68, 365–371. [Google Scholar] [CrossRef]
  18. Romero-Lankao, P.; Gurney, K.R.; Seto, K.C.; Chester, M.; Duren, R.M.; Hughes, S.; Hutyra, L.R.; Marcotullio, P.; Baker, L.; Grimm, N.B.; et al. A critical knowledge pathway to low-carbon, sustainable futures: Integrated understanding of urbanization, urban areas, and carbon. Earths Future 2014, 2, 515–532. [Google Scholar] [CrossRef]
  19. Baur, A.H.; Förster, M.; Kleinschmit, B. The spatial dimension of urban greenhouse gas emissions: Analyzing the influence of spatial structures and LULC patterns in European cities. Landsc. Ecol. 2015, 30, 1195–1205. [Google Scholar] [CrossRef]
  20. McGarigal, K.; Plunkett, E.B.; Willey, L.L.; Compton, B.W.; DeLuca, W.V.; Grand, J. Modeling non-stationary urban growth: The SPRAWL model and the ecological impacts of development. Landsc. Urban Plan. 2018, 177, 178–190. [Google Scholar] [CrossRef]
  21. Fang, K.; Zhang, Q.; Yu, H.; Wang, Y.; Dong, L.; Shi, L. Sustainability of the use of natural capital in a city: Measuring the size and depth of urban ecological and water footprints. Sci. Total Environ. 2018, 631–632, 476–484. [Google Scholar] [CrossRef]
  22. Li, Y.; Jia, L.; Wu, W.; Yan, J.; Liu, Y. Urbanization for rural sustainability–Rethinking China’s urbanization strategy. J. Clean. Prod. 2018, 178, 580–586. [Google Scholar] [CrossRef]
  23. Glaeser, E.; Huang, W.; Ma, Y.; Shleifer, A. A Real Estate Boom with Chinese Characteristics. J. Econ. Perspect. Nashv. 2017, 31, 93–116. [Google Scholar] [CrossRef] [Green Version]
  24. Shen, L.; Peng, Y.; Zhang, X.; Wu, Y. An alternative model for evaluating sustainable urbanization. Cities 2012, 29, 32–39. [Google Scholar] [CrossRef]
  25. Pacheco-Torres, R.; Roldán, J.; Gago, E.J.; Ordóñez, J. Assessing the relationship between urban planning options and carbon emissions at the use stage of new urbanized areas: A case study in a warm climate location. Energy Build. 2017, 136, 73–85. [Google Scholar] [CrossRef]
  26. Jin, G.; Deng, X.; Zhao, X.; Guo, B.; Yang, J. Spatiotemporal patterns in urbanization efficiency within the Yangtze River Economic Belt between 2005 and 2014. J. Geogr. Sci. 2018, 28, 1113–1126. [Google Scholar] [CrossRef] [Green Version]
  27. Shafique, M.; Kim, R. Green stormwater infrastructure with low impact development concept: A review of current research. Desalin. Water Treat. 2017, 83, 16–29. [Google Scholar] [CrossRef] [Green Version]
  28. Sorensen, A. Taking path dependence seriously: An historical institutionalist research agenda in planning history. Plan. Perspect. 2015, 30, 17–38. [Google Scholar] [CrossRef]
  29. Sorensen, A. Uneven Processes of Institutional Change: Path Dependence, Scale and the Contested Regulation of Urban Development in Japan: Uneven processes of institutional change in Japan. Int. J. Urban Reg. Res. 2011, 35, 712–734. [Google Scholar] [CrossRef]
  30. Sorensen, A. Periurbanization as the institutionalization of place: The case of Japan. Cities 2016, 53, 134–140. [Google Scholar] [CrossRef]
  31. Wang, B.; Tian, L.; Yao, Z. Institutional uncertainty, fragmented urbanization and spatial lock-in of the peri-urban area of China: A case of industrial land redevelopment in Panyu. Land Use Policy 2018, 72, 241–249. [Google Scholar] [CrossRef]
  32. Levers, C.; Müller, D.; Erb, K.; Haberl, H.; Jepsen, M.R.; Metzger, M.J.; Meyfroidt, P.; Plieninger, T.; Plutzar, C.; Stürck, J.; et al. Archetypical patterns and trajectories of land systems in Europe. Reg. Environ. Chang. 2018, 18, 715–732. [Google Scholar] [CrossRef]
  33. Lieskovský, J.; Bürgi, M. Persistence in cultural landscapes: A pan-European analysis. Reg. Environ. Chang. 2018, 18, 175–187. [Google Scholar] [CrossRef]
  34. Brown, D.; Page, S.; Riolo, R.; Zellner, M.; Rand, W. Path dependence and the validation of agent-based spatial models of land use. Int. J. Geogr. Inf. Sci. 2005, 19, 153–174. [Google Scholar] [CrossRef] [Green Version]
  35. Wieczorek, A.J. Sustainability transitions in developing countries: Major insights and their implications for research and policy. Environ. Sci. Policy 2018, 84, 204–216. [Google Scholar] [CrossRef]
  36. Kyotoshi Sōmukyoku Tōkeika. Kyotoshi Tōkeisho Shōwa 46 Nenban; Kyotoshiyakusho: Kyoto, Japan, 1972. [Google Scholar]
  37. Flores Urushima, A.Y. Urban Innovation in Kyoto; IIAS Newsletter: Leiden, Netherlands, 2019. [Google Scholar]
  38. Kirimura, T. Social Area Analysis of Kyoto from 1911 to1965. In Historical GIS of Kyoto; Nakanishiya Shuppan: Kyoto-City, Japan, 2011; pp. 273–284. ISBN 978-4-77950-542-3. [Google Scholar]
  39. ARC, R.U. Art Research Center, Ritsumeikan University. Available online: https://www.arc.ritsumei.ac.jp/ (accessed on 1 May 2020).
  40. Ministry of Land, Infrastructure, Transport and Tourism, G. Geospatial Information Authority of Japan. Available online: https://www.gsi.go.jp/top.html (accessed on 1 May 2020).
  41. Geneletti, D.; La Rosa, D.; Spyra, M.; Cortinovis, C. A review of approaches and challenges for sustainable planning in urban peripheries. Landsc. Urban Plan. 2017, 165, 231–243. [Google Scholar] [CrossRef]
  42. Kinda, A. (Ed.) A Landscape History of Japan; Kyoto University Press: Kyoto-City, Japan, 2010; ISBN 978-4-87698-792-4. [Google Scholar]
  43. Sorensen, A. Institutions and Urban Space: Land, Infrastructure, and Governance in the Production of Urban Property. Plan. Theory Pract. 2018, 19, 21–38. [Google Scholar] [CrossRef]
  44. Shimomura, Y.; Iizuka, T. Kyotoshi no tochi kukaku seiri jigyōchi ni okeru machiwari hōhō no rekishiteki henka nit suite. Randosukēpu Kenkyū 2014, 77, 559–564. [Google Scholar]
  45. Klug, S. Urban Sprawl and Local Infrastructure in Japan and Germany; Fraunhofer Verlag: Stuttgart, Germany, 2012; ISBN 978-3-8396-0429-8. [Google Scholar]
  46. Faure, E. La fondation de Heiankyō ou comment obtenir la paix et la sûreté dans une Capitale. Rev. Interdiscip. Sobre Cult. Ciutat 2019, 6, 83–102. [Google Scholar]
  47. Takanashi, T. Forest landscape and its objective evaluation method—Forest landscape management guidelines considered by forest. Kyoto Zôkei Geijutsu Daigaku Kiyou Genes. 2012, 34–62. [Google Scholar]
  48. Morimoto, J.; Morimoto, Y. Satoyama landscape transition in the Kansai area. In Satoyama: The Traditional Rural Landscape of Japan; Springer Japan: Tokyo, Japan, 2003; pp. 60–71. ISBN 978-4-431-00007-5. [Google Scholar]
  49. Nakajima, S. Shōwa shoki ni okeru Kyoto no keikan hozen shisō to shinrin segyō, Kyoto no toshikeikan to sanrin ni kansuru kenkyū. Nihon Kenchiku Gakkai Keikakukei Ronbunshū 1994, 59, 185–193. [Google Scholar] [CrossRef]
  50. Nakajima, S. Meiji shoki kara chōki ni kakete no Kyoto no shinrin kanri to keikan hozen, Kyoto no toshikeikan to sanrin ni kansuru kenky kenkyū. Nihon Kenchiku Gakkai Keikakukei Ronbunshū 1996, 61, 213–222. [Google Scholar] [CrossRef] [Green Version]
  51. Nakajima, S. Kindai Kyoto ni okeru shigaichi kinkō sanchi no kōen toshite no ichiduke to sono seibi, Kyoto no toshi kankyō to ryokuchi ni kansuru kenky kenkyū. Nihon Kenchiku Gakkai Keikakukei Ronbunshū 1997, 62, 247–254. [Google Scholar] [CrossRef] [Green Version]
  52. Oda, K.; Rupprecht, C.; Tsuchiya, K.; McGreevy, S. Urban Agriculture as a Sustainability Transition Strategy for Shrinking Cities? Land Use Change Trajectory as an Obstacle in Kyoto City, Japan. Sustainability 2018, 10, 1048. [Google Scholar] [CrossRef] [Green Version]
  53. Allen, A. Neither Rural nor Urban: Service Delivery Options That Work for the Peri-urban Poor. In Peri-Urban Water and Sanitation Services: Policy, Planning and Method; Kurian, M., McCarney, P., Eds.; Springer Netherlands: Dordrecht, The Netherlands, 2010; pp. 27–61. ISBN 978-90-481-9425-4. [Google Scholar]
  54. Inoue, K. Eco-city development in Japan. Available online: https://www.taylorfrancis.com/ (accessed on 14 March 2020).
  55. Câmara, G.; Souza, R.C.M.; Freitas, U.M.; Garrido, J. Spring: Integrating remote sensing and gis by object-oriented data modelling. Comput. Graph. 1996, 20, 395–403. [Google Scholar] [CrossRef]
Figure 1. Map of delimitation of the peripheral area of Kyoto City. The orange line delimits the consolidated urban area. The numbered red squares show the fifteen squares generated to cover the city’s peripheral area.
Sustainability 12 04502 g001
Figure 2. Maps of land use and land cover (LULC) classification. The results of the automatic classification are shown for the defined area of study (a) in 1950 and (b) 1960. Red colored areas represent built-up areas (BA), dark and bright green colors represent sparse and dense forests (SF, DF), light pale green areas refer to plantation (PL), blue for water (WA), yellow for exposed soils (ES).
Sustainability 12 04502 g002
Figure 3. Road expansion. Dark orange segments refer to the infrastructure network in 1950. The pale light beige color segments refer to the infrastructure network in 1960. Expansion of infrastructure is clearly perceived, especially in the North and West areas.
Sustainability 12 04502 g003
Figure 4. Square 14 LULC categories in the reconstructed images of 1950 and 1960.
Sustainability 12 04502 g004
Figure 5. Square 14 population growth and transportation infrastructure expansion of the analyzed period.
Sustainability 12 04502 g005
Figure 6. Square 8 LULC categories in the reconstructed images of 1950 and 1960.
Sustainability 12 04502 g006
Figure 7. Square 8 population growth and transportation infrastructure expansion of the analyzed period.
Sustainability 12 04502 g007
Figure 8. Table that shows the rates of peripheral LULC change subdivided per sub-areas inside Kyoto City, according to the classification of built-up areas, exposed soil, plantation, sparse forest and dense forest.
Sustainability 12 04502 g008
Figure 9. Table that shows the absolute changes of peripheral LULC divided per sub-areas inside Kyoto City, according to the classification of built areas, exposed soil, plantations, sparse forest and dense forest.
Sustainability 12 04502 g009
Figure 10. Built-up area change contrasted with vegetation covered area change (dense forest, sparse forest, plantation and exposed soil) between 1950 and 1960. The values used to create this diagram are shown in the table above (Figure 9).
Sustainability 12 04502 g010
Figure 11. Variation of built-up area in opposite to vegetation covered area (dense forest, sparse forest, plantation and exposed soil) in Squares 14 and 8 between 1950 and 1960.
Sustainability 12 04502 g011
Table 1. Population growth in Kyoto City (1950–1960) [36].
Area (Km²)PopulationVariation (Population)Variation (% Population)
1950536.451,101,854
1960610.611,284,818182,96416.6%
Table 2. Kyoto City, urban, non-urban areas1.
Kyoto City Area (Km²)Urban Area (Km²)%Non-urban Area (Km²)%
1950529.82180.3134.03349.5165.97
1960602.92223.5437.08379.3862.92
% growth13.8023.98 8.55
1 Table created based on the calculation of areas extracted from the geospatial data provided by the Research Group on Digital Humanities of the Art Research Center at Ritsumeikan University [39].
Table 3. Absolute changes of peripheral LULC divided per sub-areas inside Kyoto City, according to the classification of built-up areas, exposed soil, plantations, sparse forest and dense forest.
Roads Extension and Growth (1950–1960)
Total in KyotoGrowth in the Peripheral AreaSquare 14Square 8
Km%Km%Km%Km%
19508556.72 1776.22 99.63 117.90
196012,422.92 2635.00 202.04 137.98
Growth of roads linear extension3866.2045.18858.7848.35102.42102.8020.0717.03
Ratio difference considering the total growth of linear road extension22.21 11.93 2.34
Table 4. Land readjustment projects implemented within Square 14.
District NameProject Launching (Fiscal Year)Project Completion (Fiscal Year)
Saiin Kitabu19281954
Sai Dai Ichi19321938
Shimizu Hitori19391970
Kadono19571971

