3.1. Data
As described earlier, it is necessary to take utmost care in collecting data through a CV survey. In this regard, four important considerations were taken into account in this study. First, the sample size was set at 1000. This is because Arrow et al. [
31] proposed 1000 as the number of observations needed for policy decision-making, and the Korea Development Institute, a government-run think tank, also provided a guideline of 1000 for the size of a nationwide sample needed for policy decision-making.
Second, by sampling based on the census data gathered in 2015 by Statistics Korea [
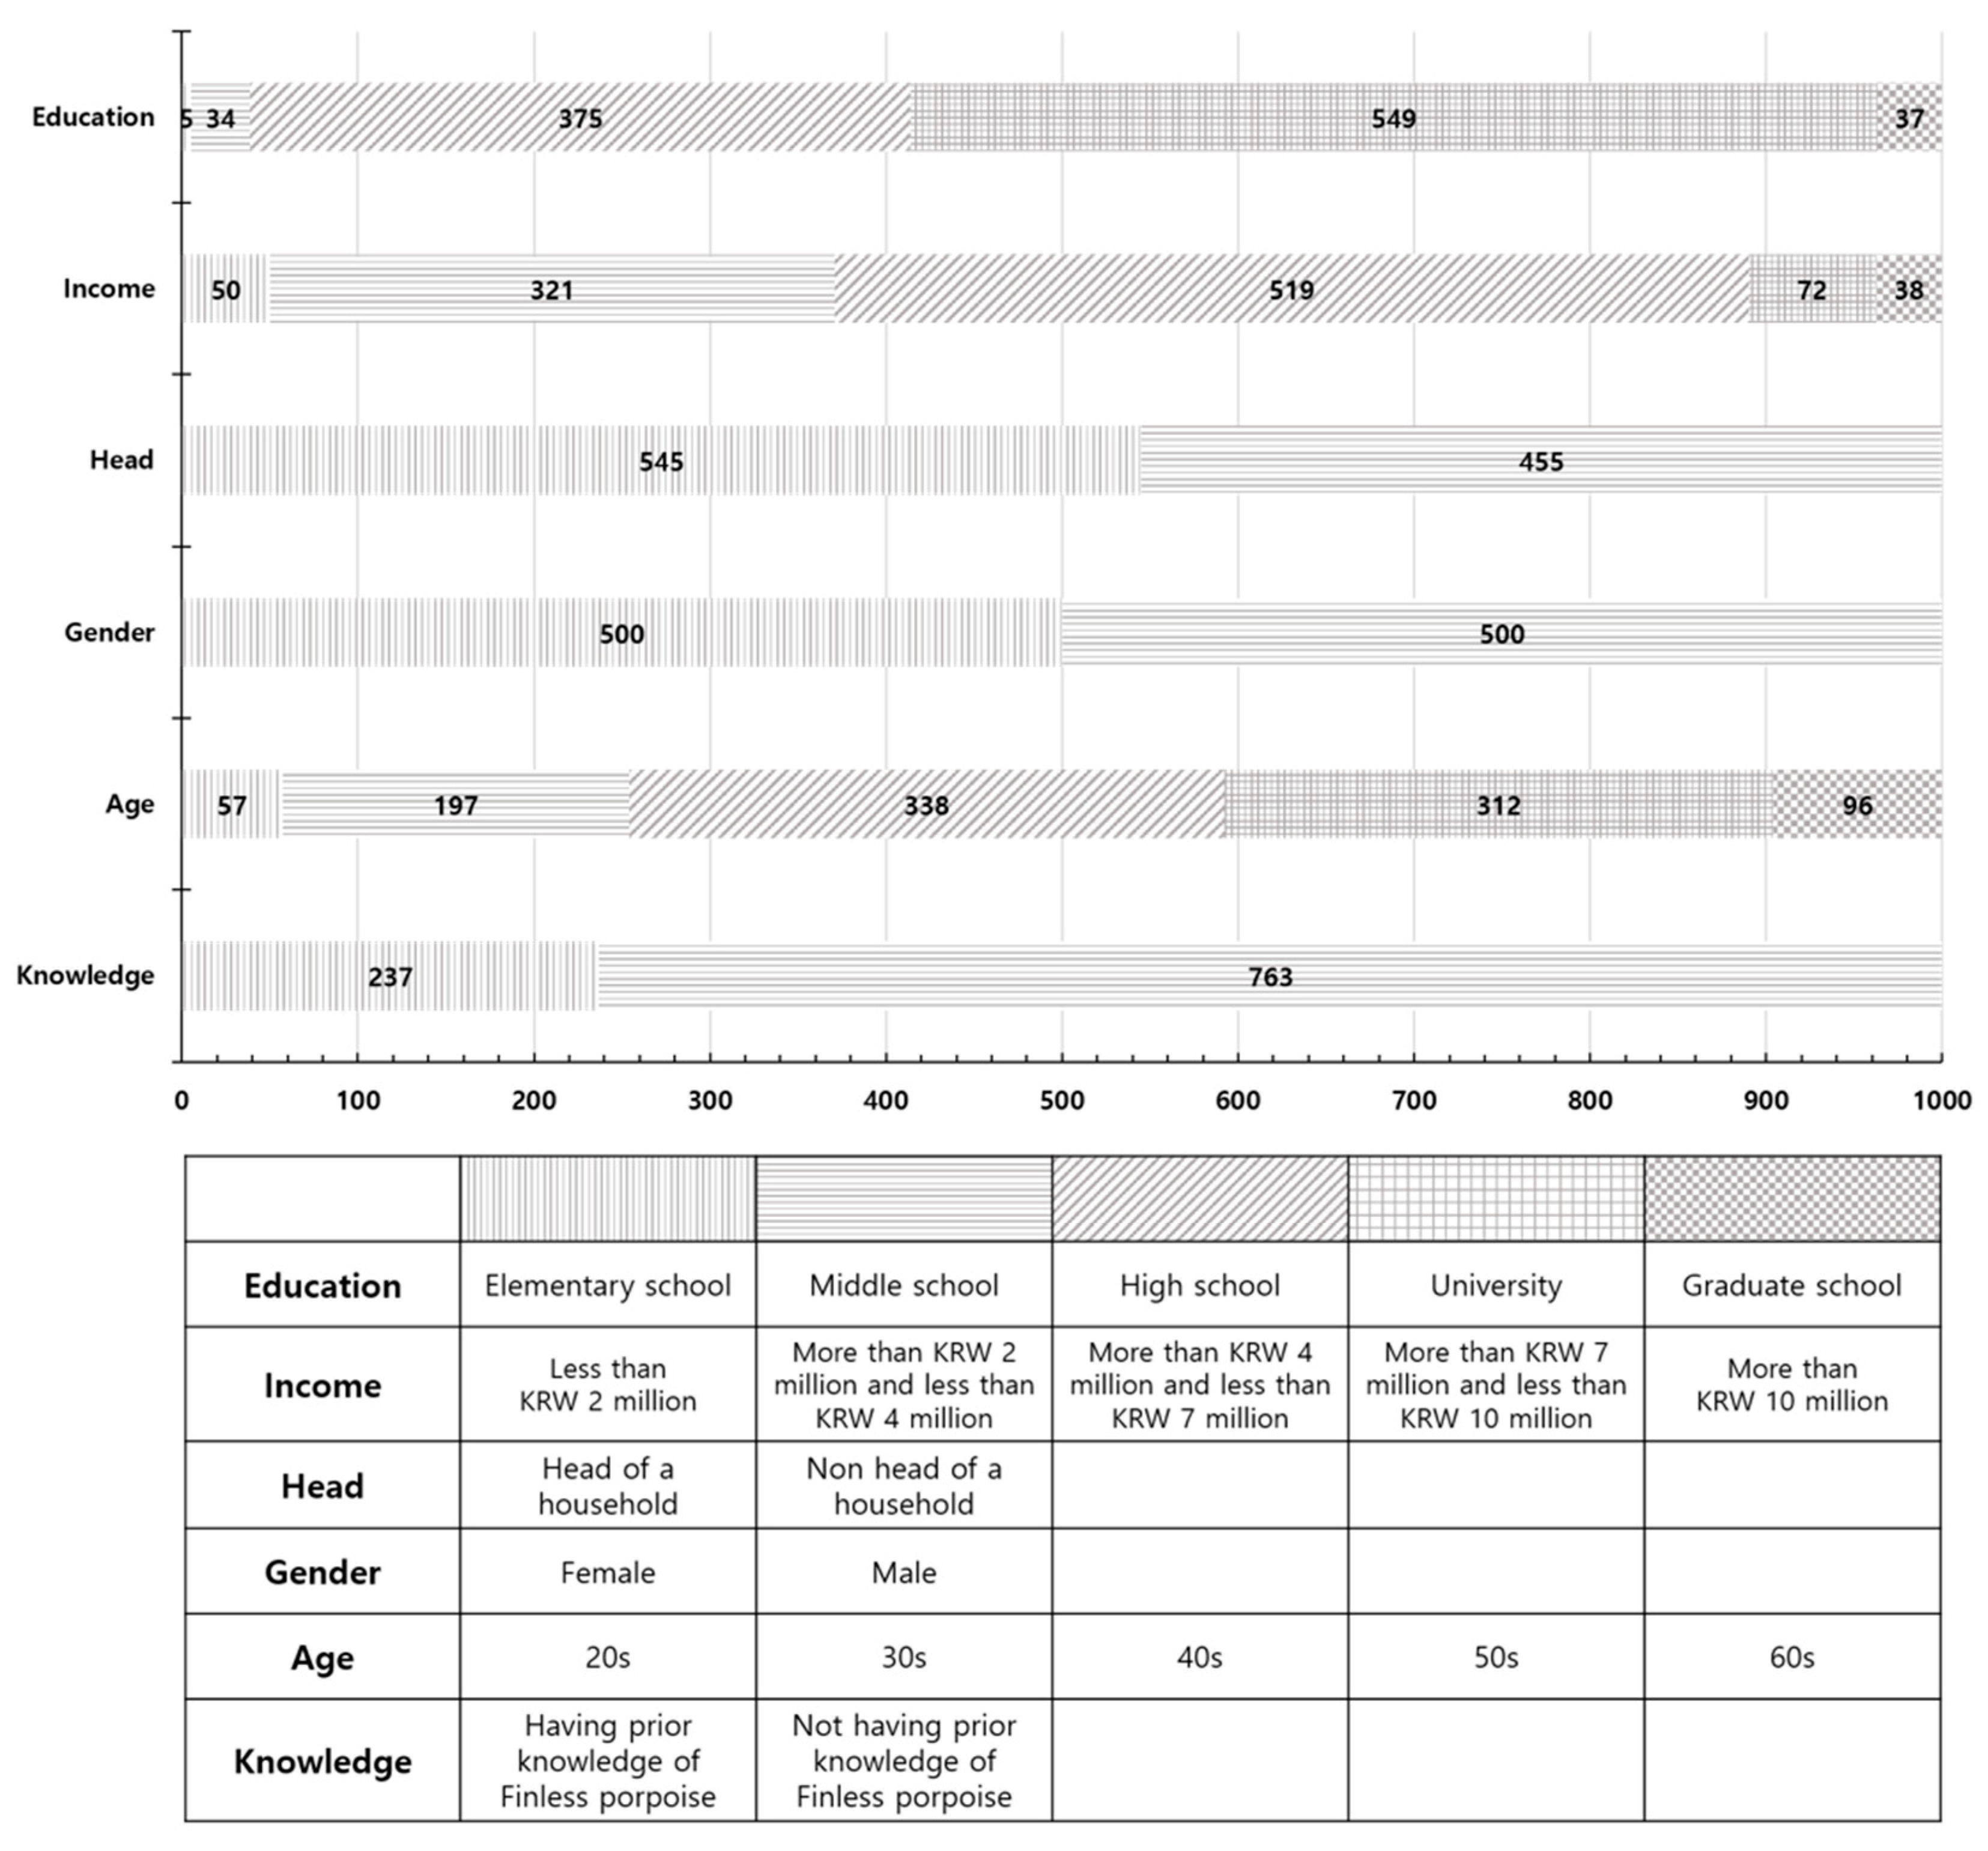
36], we tried to make the sample representative of the population. In South Korea, the population census is conducted on a five-year basis, and the 2015 census data were the latest data at the time of the survey. Consequently, we compared the characteristics of the population with those of the sample. Three variables were found for that comparison. The percentages of female respondents in the sample and women in the population were 50.0% and 49.9% [
36]. The proportions of respondents who lived in Seoul, Gyeonggi, and Pusan Provinces for the sample were 20.1%, 23.9%, and 7.2%, respectively. The equivalent residential proportions for the population were 19.4%, 23.7%, and 7.0%. The averages of household income for the sample and for the overall South Korean population were 4.91 million and 4.83 million KRW, respectively. Therefore, it seems that there is no significant gap between the values for the sample and those for the population. The sample characteristics are shown in
Figure 1.
Third, despite the resultant high cost, a professional polling firm was commissioned to conduct the survey to ensure fairness in sampling and for expertise in implementing face-to-face surveys. Fourth, we chose household income tax as a payment vehicle to help interviewees reveal their actual WTP without difficulty. An appropriate payment vehicle can avoid any bias caused by posing a hypothetical question. This is because, in a hypothetical market situation, interviewees may take the experiment less seriously than in a real situation. In addition, the payment period presented in the CV survey was 10 years.
In summary, a professional survey company in August 2018 conducted a survey of 1000 Korean households with interviewees aged 20–65 years. There were 4539 household visits and attempts to contact to obtain the 1000 final sample data. In other words, the response rate of the CV survey was about 22%. Judging from the comments of the supervisor and interviewers, the survey was implemented without difficulty and was successful enough to collect opinions representative of the population.
Unfortunately, the questionnaire used in this study was not designed to test for an interviewer effect or bias with which the interviewer may influence the CV survey results. However, in this study, two efforts were made to prevent the interviewer effect or bias. First, the authors did not conduct the survey arbitrarily and commissioned a specialized polling agency with extensive CV survey experience. Second, only those who had extensive experience in CV surveys were selected among a number of interviewers belonging to the polling agency and put them into the field CV survey. Therefore, the authors think that the data obtained from the CV survey do not suffer from any interviewer bias.
The distribution of interviewees’ answers to the suggested bid is given in
Table 3. Each bid that is shown in the first column of
Table 3 was offered to a similar number of interviewees. As explained earlier, a “no” answer with regard to paying the lower bid (
) was followed by a further question to confirm whether the interviewee’s WTP ranged from zero to the bid or zero. Of the 1000 interviewees, 612 persons indicated a WTP of zero; they have no intention of paying a single cent for managing and protecting FPs.
3.3. Discussion of the Results
Since the whole sample may not be identical at the national level, segmenting and then analyzing the sample according to the sample characteristics provides us with some interesting findings. However, the sample size adopted in this study is only 1000, and the segmentation may decrease the number of observations to be analyzed, thereby reducing the statistical efficiency. In such cases, it may be more useful to reflect sample characteristics as covariates in the model rather than to segment the sample.
The spike model has no other covariates except for constant term and bid amount. However, there can be other factors influencing the likelihood of stating “yes” to an offered bid; for example, the age, gender, and education level of the interviewee. The interviewee’s household income is also one of the commonly used covariates. Thus, a model containing covariates can be introduced for investigating the impact that covariates make on the likelihood. Concerning the covariates, six variables that are related to the interviewees’ characteristics were selected. The basic information about the covariates used was shown in
Table 2.
Table 5 describes the estimation results of the model with covariates.
All of the estimated values show statistical significance. The positive sign of the estimated coefficient indicates that the greater the covariate, the greater the possibility of responding “yes” to an offered bid. The figures for all variables except Age are positive. The education level of the interviewee has a positive correlation with the probability of stating “yes” to a presented bid. Households with more income have a higher possibility, compared to those with less income, to report “yes” to a provided bid. Interviewees who are heads of their households are more likely to answer “yes” to a suggested bid compared to those who are not. Female interviewees are more likely to give a “yes” answer to a supplied bid than male ones. Interviewees who knew the FP before the survey are more likely to answer “yes” to a suggested bid compared to those who did not. However, the coefficient for the Age variable has a negative sign. This indicates that older interviewees are less likely to answer “yes” than younger ones to a given bid.
After obtaining the yearly mean WTP for each household, the next step is to estimate aggregate values. We need to adjust the sample value to the population value, retaining representativeness. The authors believe that this sample is representative and well balanced in two aspects, as discussed above. First, the survey represented the recommended statistical power of 1000 people and was conducted by skilled, professional interviewers. Second, there were no significant differences between the characteristics of the sample and the overall population. In addition, the spike model was estimated using all sample data, including observations with zero WTP, not only using observations with positive WTP. In this regard, when values for a sample are extended to the population, the mean WTP estimate obtained for the sample can be extended over the population.
The mean WTP in
Table 4 was used for the adjustment to prevent covariates from affecting the mean WTP estimate. The mean household WTP estimate multiplied by the total number of households in South Korea is the total WTP adjusted for the population. There were 19,871,152 households in the country when the survey was underway [
36]. The mean household WTP was estimated to be 2730 KRW (2.32 USD). The population’s total WTP for managing and protecting the FP is 54.19 billion KRW (46.00 million USD) per year. The management and protection significantly contribute to South Korean households’ utility.
This value implies the economic benefits of managing and protecting the FP. If the economic benefits exceed the costs involved in the management and protection, the management and protection re socially profitable and should be immediately and continuously carried out. It seems socially beneficial given that the magnitude of the benefits is not small, although strictly estimating the costs is not attempted here, as it is a difficult task and goes beyond the scope of this study. In addition, the research structure taken and major results obtained in this study could be a reference in the formulation and determination of a policy for other endangered marine species not only in South Korea, but also in other countries.
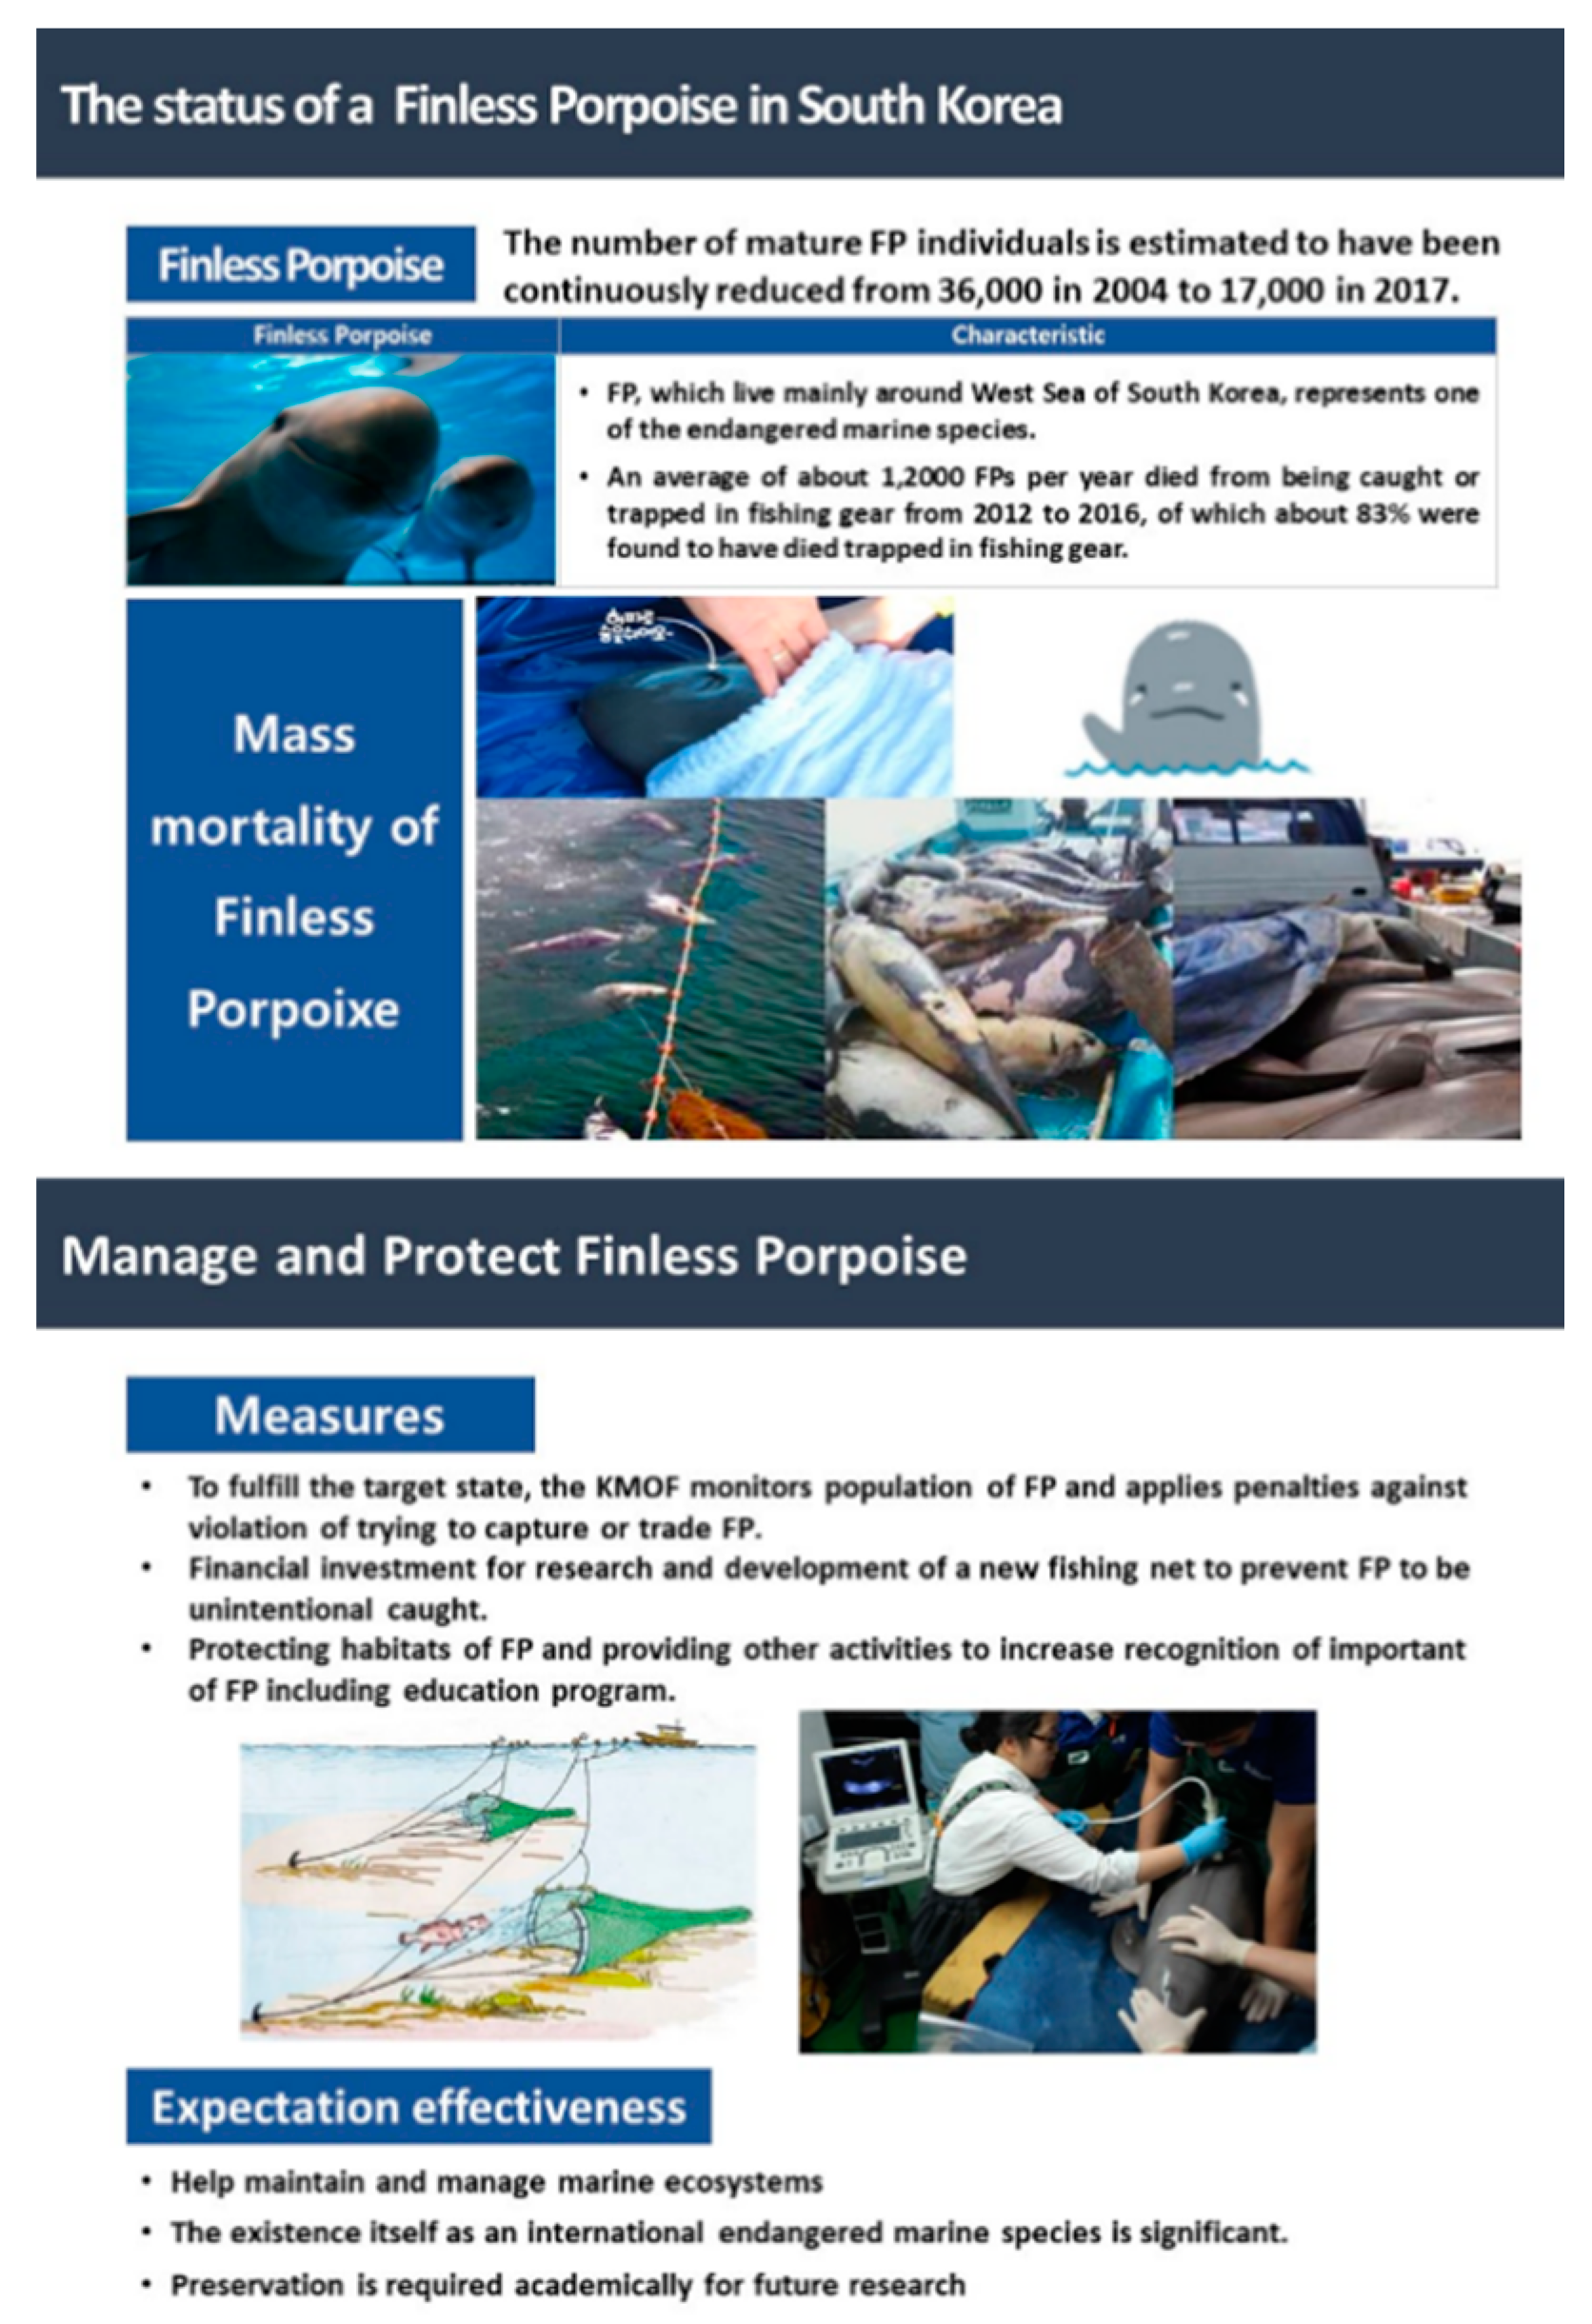
As described earlier, 76.3% of all respondents were not aware of the FP in advance, and 61.2% of all respondents indicated zero WTP. Nevertheless, the estimated mean WTP was statistically significant. This implies the possibility of increasing WTP by raising public awareness of the FP. Therefore, in order for the management and protection of the FP to be supported by the people, it is necessary to discover and implement policy instruments to publicize the FP to the public, such as awareness campaigns.
In terms of the object to be valued, Dong’s [
13] study is the most similar to this study. However, it is difficult to directly compare the findings from the two studies because this study differs from Dong’s [
13] study in five respects: Sample size, survey method, the time of the survey, the model, and estimated mean WTP. First, this study utilized 1000 observations, whereas Dong [
13] utilized only 240 observations. Second, this study conducted in-person face-to-face interviews, but Dong [
13] conducted a market stall survey. Third, our survey was implemented during August 2018, but Dong’s [
13] survey was implemented during October and November 2009. Fourth, regarding the WTP model, this study applied the spike model, but Dong [
13] applied the multiple linear regression model. Fifth, the mean WTP was estimated to be 2730 KRW (2.32 USD) per household per year in this study, but Dong [
13] reported the mean WTP as 9.94, 5.92, and 6.67 EUR (13.92, 8.29, and 9.34 USD) per household per year in three Chinese cities (Beijing, Guangzhou, and Nanchang), respectively. In addition, although both Dong [
13] and this study selected the FP as the object to be valued, in this study, protection of the FP by various means was evaluated, whereas in Dong’s [
13] study, preservation of the FP’s habitat to protect the FP was valued. The WTP estimates obtained from both studies can be expressed as a constant price in 2010 using the real exchange rate of USD. When the real effective exchange rate for 2010 was 100, the real effective exchange rates of USD in 2009 and 2018 were 104.699 and 112.986, respectively [
38]. Using these values, the yearly household WTP estimates for three Chinese cities (Beijing, Guangzhou, and Nanchang) given in Dong’s [
13] book were 13.30, 7.92, and 8.92 in international constant dollars, respectively. The yearly household WTP estimate for South Korea was 2.05 in international constant dollars.


