Article

Levee Overtopping Risk Assessment under Climate Change Scenario in Kao-Ping River, Taiwan

1
National Science and Technology Center for Disaster Reduction, New Taipei City 23143, Taiwan
2
Department of Civil Engineering, National Chiao Tung University, Hsinchu 30010, Taiwan
*
Author to whom correspondence should be addressed.
Sustainability 2020, 12(11), 4511; https://doi.org/10.3390/su12114511
Submission received: 24 April 2020 / Revised: 22 May 2020 / Accepted: 1 June 2020 / Published: 2 June 2020
(This article belongs to the Section Air, Climate Change and Sustainability)

Abstract

:
With the growing concern about the failure risk of river embankments in a rapidly changing climate, this study aims to quantify the overtopping probability of river embankment in Kao-Ping River basin in southern Taiwan. A water level simulation model is calibrated and validated with historical typhoon events and the calibrated model is further used to assess overtopping risk in the future under a climate change scenario. A dynamic downscaled projection dataset, provided by Meteorological Research Institute (MRI) has been further downscaled to 5-km grids and bias-corrected with a quantile mapping method, is used to simulate the water level of Kao-Ping River in the future. Our results highlighted that the overtopping risk of Kao-Ping River increased by a factor of 5.7~8.0 by the end of the 21st century.

1. Introduction

A torrential rainfall alters the flow rate of rivers and puts flood prevention facilities at a higher risk of failure. According to the statistics from the International Disaster Database (EM-DAT) [1], the number of major natural disaster events in 2018 totaled 281, of which floods were the largest natural hazard (about 38%) among various kinds of natural hazards. The August flooding of India Kerala state is the largest flood event in 2018. It claimed approximately 504 lives and more than 23 million people were affected by flooding. In addition to casualties, severe flooding also causes damage of embankments and hydraulic structures and consequently causes immense asset loss [2]. A considerable number of studies have shown that the frequency of extreme rainfall will increase in the upcoming future under the influence of global warming and climate change [3,4,5]. A common lesson learned from the previous extreme flood events is that it is time to review the current hydraulic facilities and re-evaluate the overtopping risk of river embankments under future climate change scenarios.
Hydrological phenomena will be altered by future climate change, and many studies have been conducted on future hydrological changes [6,7,8,9]. Arnell (1999) [8] used data simulated from the climate model of the Hadley Centre to forecast global river flow rates; the annual runoff will increase in high latitude areas but will decrease in middle-latitude areas and the subtropics in the future. Nohara et al. (2006) [9] used the 19 coupled ocean–atmosphere general circulation models (GCMs) of the A1B emission scenario [10,11] to investigate flow rate changes in the selected 24 major rivers in the world and their results also support the statement by Arnell (1999) [8]. Under the possible threats of rapid hydrological changes, there is a need to quantitatively evaluate the risk of current flood control infrastructures such as levees and embankments.
Embankments are designed on the basis of hydrological conditions, topography, and river channel erosion or deposition, and they are at an extreme high risk if the water level exceeds the design stage of the embankments. Some studies utilized the first-order second-moment method (FOSM) to evaluate the failure risk of river embankments [12,13,14]. In a levee construction or reconstruction project, many kinds of source of risk could be involved. Kovačević et al. (2020) [15] identified five key risks in a levee reconstruction project including (1) inadequate site investigation; (2) overtopping; (3) insufficiently detailed reconstruction design; (4) unsatisfactory performance of reconstruction works; (5) inaccurate monitoring and condition evaluation. Among these risks, this study focused on the risk of overtopping which occurs when water level exceeds the levee crest. Specifically, the major aim of this study is to evaluate the overtopping risk of embankment along the Kao-Ping River under a climate change scenario using a dynamic downscaled dataset.

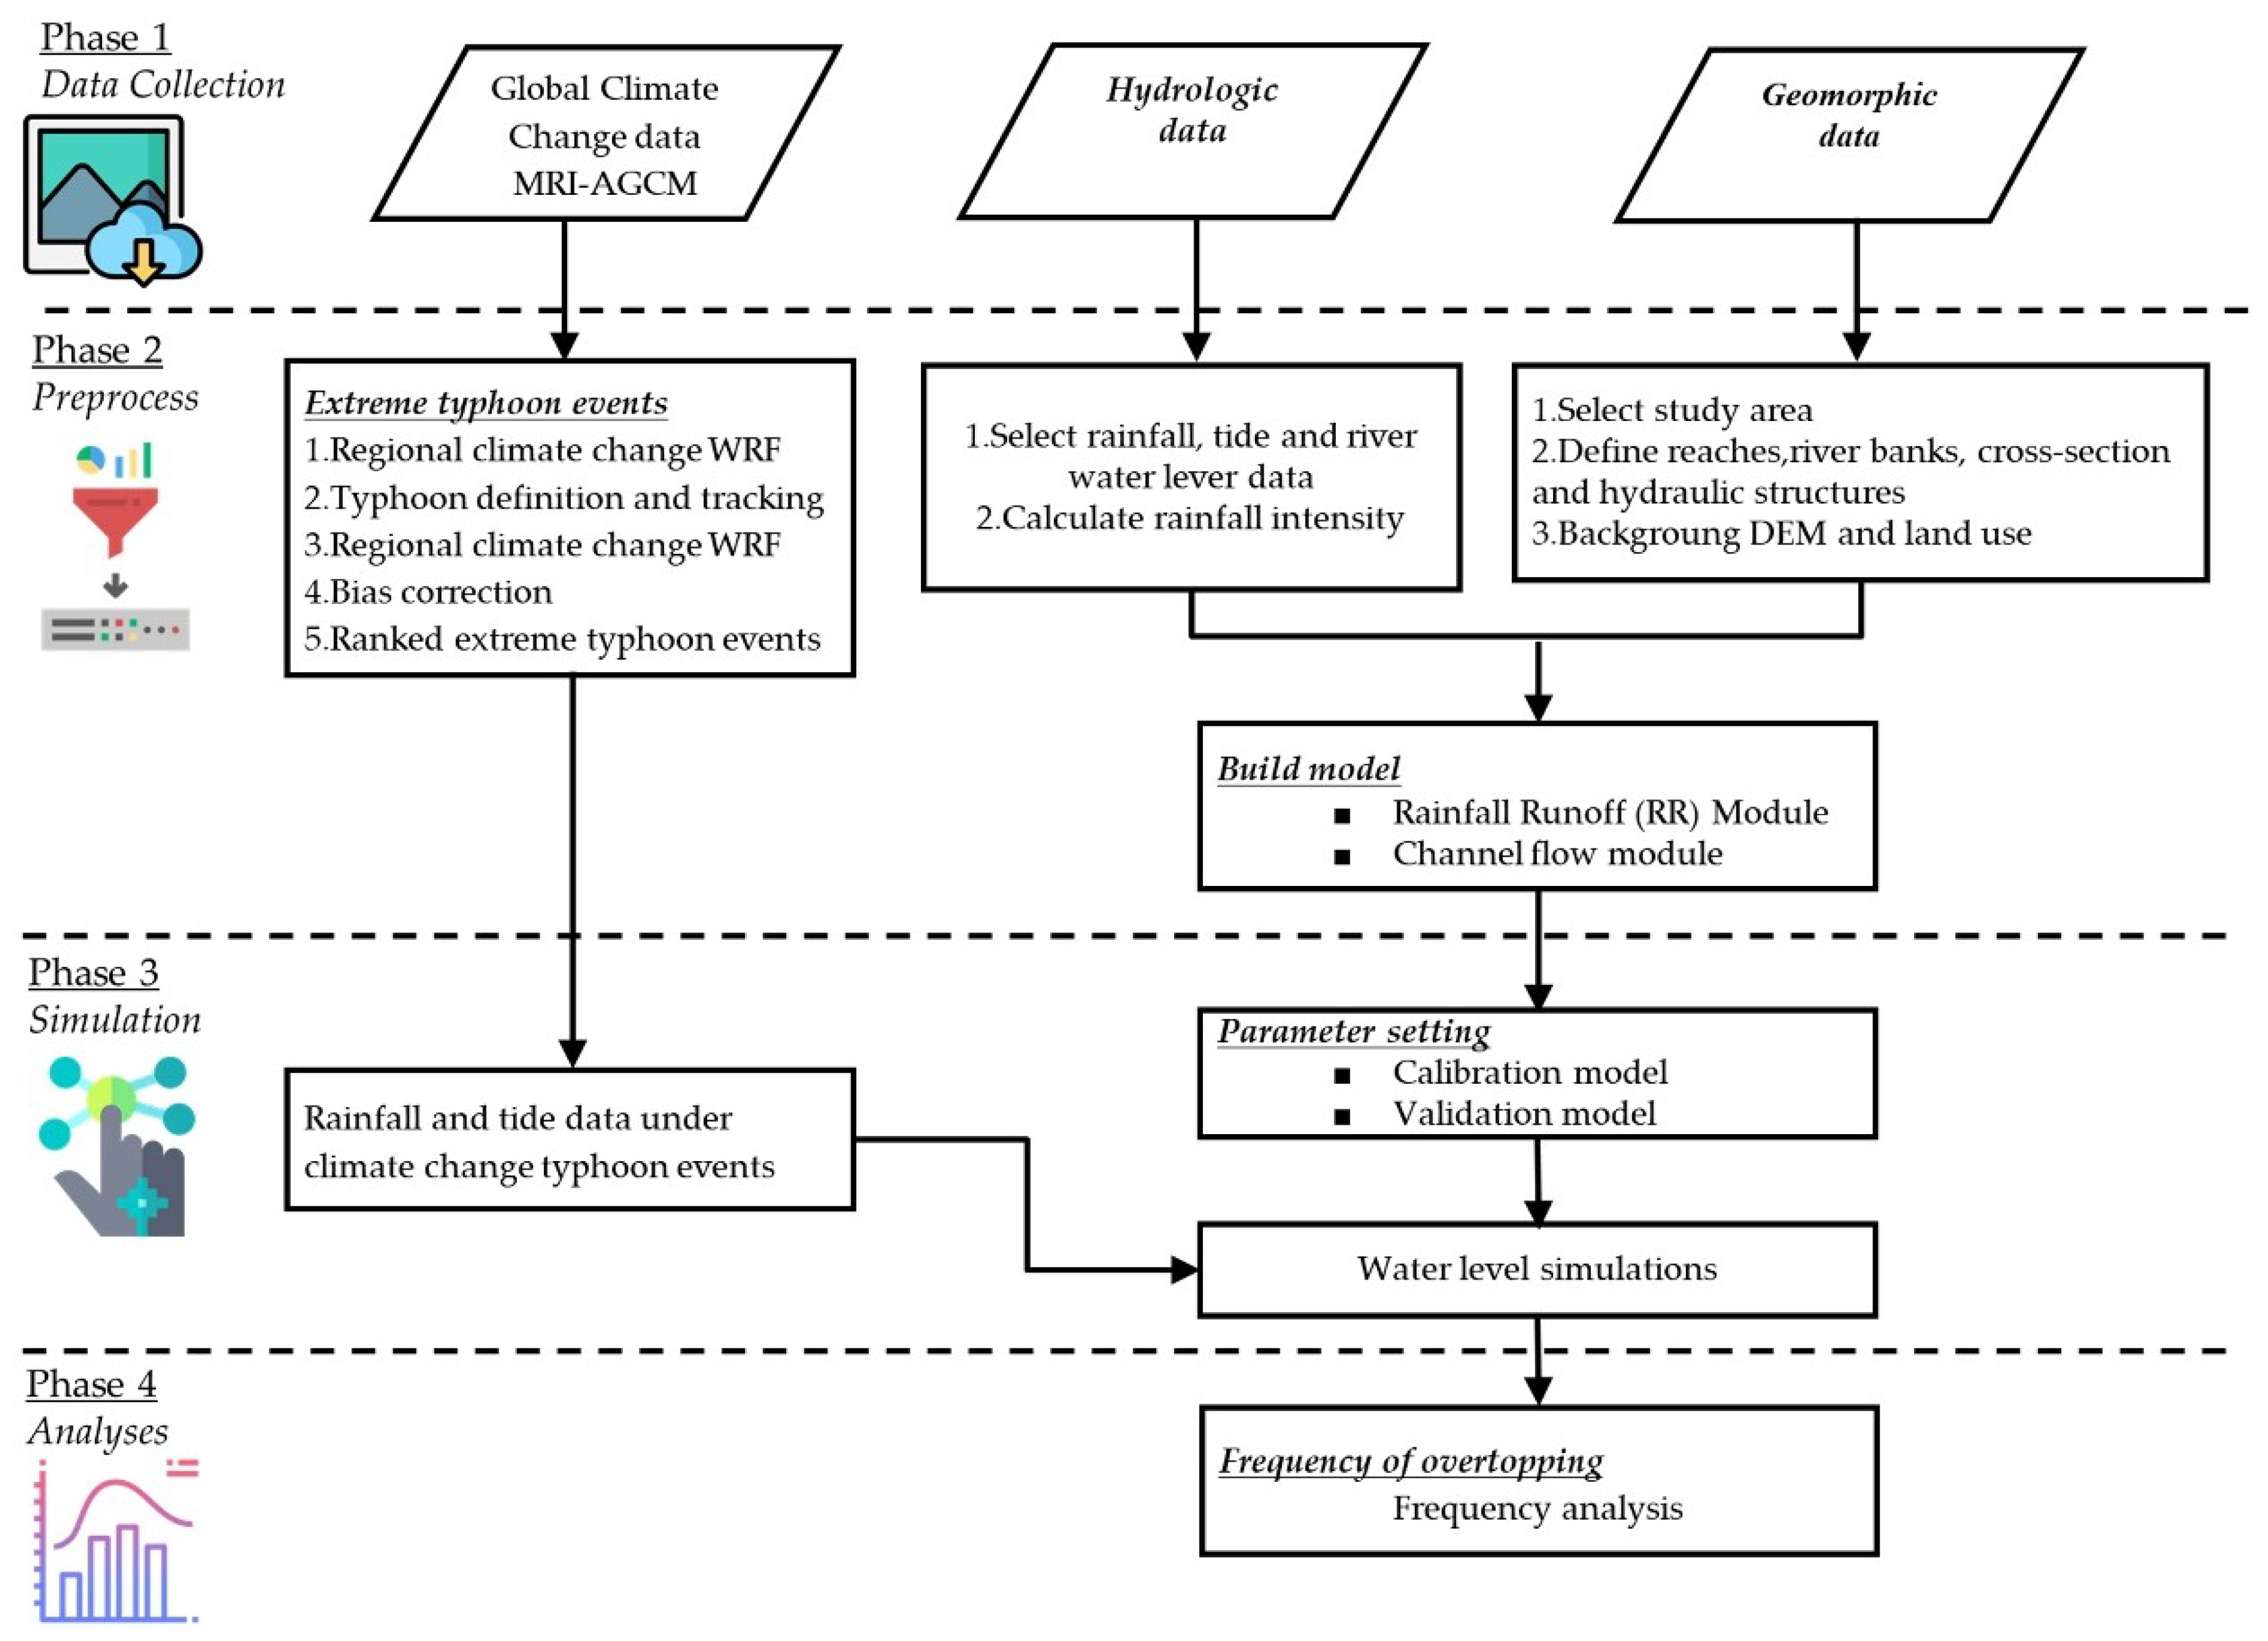
2. Materials and Methods

With the growing concern about the failure risk of river embankments in a rapidly changing climate, this study aims to quantify the overtopping probability of river embankment in Kao-Ping river basin in Taiwan. The research framework, as shown in Figure 1, is divided into three stages. In the first stage, the climate projections simulated by Meteorological Research Institute Atmospheric General Circulation Model Version 3.2S (MRI-AGCM3.2S) [16] are dynamic downscaled and bias-corrected. Specifically, five steps in this stage include (1) acquiring the climate projection simulated by MRI-AGCM3.2S, (2) downscaling the GCM outputs with a regional model, the Weather Research and Forecasting model (WRF), (3) defining and tracking the typhoon events which have direct impacts on Taiwan, (4) bias-correction applied to the hourly precipitation to remove the systematic bias, and (5) ranking and selecting the top 20 extreme typhoon rainfall events in the study area. The second stage is the development of a hydrodynamic model with calibrations and validations. Finally, river discharge changes and the overtopping risks of the river embankment in Kao-Ping river basin under climate change scenarios are evaluated.

2.1. Study Area

The Kao-Ping River is the largest river in southern Taiwan, with a length of approximately 171 km and a catchment area of 3257 km2. It originates from the highest mountain in Taiwan, the Jade Mountain Range at an altitude of 3952 m, and has five major tributaries, namely the Qishan, Laonong, Meinong, Zhuokou, and Ailiao Rivers (Figure 2). The Kao-Ping River is the main water resource for domestic, agricultural, and industrial usages in Kaohsiung and Pingtung counties. The catchment has a mean monthly temperature of 28 °C and mean annual precipitation of 1832 mm.

2.2. Observed and Projected Typhoon Rainfall Events

Rainfall data comprised historical observations from past typhoon events during 1991–2017 and projected rainfall product from the atmospheric general circulation model (AGCM) developed by the Meteorological Research Institute (MRI) of the Japan Meteorological Agency (JMA). This product is further downscaled with the WRF developed by the US National Center for Atmospheric Research (NCAR) into a 5-km gridded hourly rainfall dataset (denotes as MRI-WRF hereafter) [17,18]. The projection periods follow the MRI-AGCM setting which is comprised of Base Period (BP, 1979–2003), Near Future (NF, 2015–2039), and End of Century (EC, 2075–2099). After downscaling to 5-km grids, a certain degree of system bias still exists when compared to observations from rainfall gauges. To cope with this problem, the MRI-WRF dataset is further bias corrected using Quantile Mapping (QM) method by Su et al. (2016) [19]. The bias-corrected dataset is denoted as MRI-WRF-BC hereafter and is used for the subsequent analyses.
The tropical cyclone detection scheme of Virtart et al. (1997) [20] was applied to climate projection simulated by MRI-AGCM to identify typhoon events of the northwest Pacific. Because the resolution of MRI-AGCM is 10 times higher than the data used in Virtart et al. (1997) [20], which means simulated extreme weather systems will be more intense, threshold parameters used in the tropical cyclone detection scheme were adjusted to give reasonable tropical cyclone genesis frequency. Once the typhoons in the climate projection were identified, the typhoons affecting Taiwan can be decided and also shown in MRI-WRF-BC data. There are 88, 81, and 82 typhoons affecting Taiwan in BP, NF, and EC, respectively. The typhoon events are ranked based on the total rainfall over 24 h in the Kao-Ping River basin. The top 20 typhoon events with highest 24 h accumulated rainfall are listed in the Table 1. Table 1 shows that the Top1-Top4 events in the BP, the Top1–Top5 events in the NF, and the Top1–Top11 events in the EC have 24-h accumulated rainfall higher than 500 mm and are categorized as “Extremely Torrential Rain” based on the definition of the Central Weather Bureau (CWB). Similarly, one event in the BP, 4 events in the NF, and 11 events in the EC have 3-h accumulated rainfall higher than 130 mm and are categorized as a “short-duration disastrous rainfall event” based on the definition proposed by Yu et al. (2014) [21]. Typhoon Morakot in 2009 is the most severe typhoon event in the 21st century thus far and it caused long-duration continuous rainfall, with a total rainfall close to Top1 and Top2 typhoon events in the EC. However, the maximum 3-h accumulated rainfall of Typhoon Morakot is obviously lower than that of the top 5 typhoon events in the EC. It is noteworthy that Table 1 only showed the precipitation statistics of the Top 20 typhoon events, while the following analyses are based upon all identified typhoon events in the three projection periods. The comparison of the 3-h and 24-h accumulated rainfall of all typhoon events in the three periods is shown in Figure 3.

2.3. Model Simulation

This study employed the SOBEK model for simulating future changes in river flow rates. The SOBEK model was developed by Delft Hydraulics, Netherlands [22], and it adopts an integrated approach for the hydraulic and hydrologic processes of rivers and regional and urban drainage systems. SOBEK already has a window-based interface that is useful for creating models, inputting data, and dynamically displaying simulation results. To reduce the input variables of the SOBEK model, we selected the nearest MRI-WRF-BC grid to the rainfall gauges as the input. The locations of the rainfall gauges and MRI-WRF-BC grids were shown in Figure 1. For each selected MRI-WRF-BC grid, the hourly rainfall of the typhoon events in the three projection periods was used as input of the SOBEK model. This study used the SOBEK channel flow (CF) module along with the rainfall runoff module for river channel simulations. The estimated rainfall runoff (RR) volume was calculated as the lateral inflow (node) that converges in the main stream when the unsteady flow of the river channel was calculated [22].

2.3.1. Rainfall Runoff (RR) Module

This study adopted the Sacramento model for simulating the process of rainfall forming runoff, including evaporation, infiltration, subsurface runoff, and underground water. The concept is to convert effective rainfall at the surface by using a unit hydrograph into surface runoff and then add soil surface moisture, intermediate flow, and ground water discharge (base flow) to obtain the total runoff [23].

2.3.2. Channel Flow (CF) Module

River flood routing was based on the dynamic wave transfer theory for one-dimensional (1D) varied flow (i.e., the gradual varied flow equation of de Saint Venant for describing water flow in rivers). This study used the nonlinear implicit difference method to determine the depth and flow rate during each time period. At points where the main and branch streams converged, water depth and flow rate at each cross section were determined based on the conditions that the main and branch streams have the same water level and that inflow equaled outflow. With regard to flood routing, the equations of continuity and motion were considered based on the 1D gradual varied flow equation of de Saint Venant, which is the dynamic wave model. The equations are presented as:
A f t + Q x = q l a t
Q t + x ( Q 2 A f ) + g A f h x + g Q | Q | C 2 R A f W f τ w i ρ w = 0
where Q is the flow rate; h is the water level; R is the hydraulic radius; q l a t is the lateral inflow; A f is the wetted area; C is the Chezy coefficient; W f is the river width; τ w i is the wind shear; and ρ w is the water density.
While processing the equation of motion by using the SOBEK CF modules, the influence of wind shear was also considered, and wind force and direction were set as a fixed value or time sequence. SOBEK also takes the influence of wind on water level and lateral inflow of a unit length in the river into consideration.

2.3.3. Required Hydrologic and Geomorphic Datasets for SOBEK

Hydrologic and geomorphological data must be collected before the river flow rate and water depth could be simulated. River cross section, hydraulic structures, land use, tide level, and water level data were collected for determining the rainfall runoff and channel flow. River cross section data of Kao-Ping River were obtained from the Water Resource Agency (WRA). It is worth noting that the future change of river bed is ignored here since it is extremely difficult to predict. Hourly water level data from current gauging stations were collected for calibration and validation purposes; the locations of the three water level stations are shown in Figure 2. The tide level at the estuary is also collected and serves as the downstream boundary condition in the SOBEK model. Finite volume coastal ocean model (FVCOM) is used to project changes in the astronomical tide at the estuary in the climate change scenario. For a detailed description about the FVCOM structure and parameters please refer to [24].

2.3.4. Model Performance Assessment

The major focus of this study is to evaluate the overtopping risk of Kao-Ping River under the climate change scenario. Our attention is focused on the three water level stations, Li-Ling Bridge, Kao-Ping Bridge, and Wann-Ta Bridge in the order from upper stream to the downstream of Kao-Ping River. Some salient information of the three water level gauges is listed in Table 2. Among this information, the design stage at water level stations are used to compare with the simulated peak water levels by the SOBEK model using the precipitation of the typhoon events in the three projection periods as input.
The performance of the developed SOBEK model is evaluated by three indicators, including coefficient of efficiency (CE), error rate of peak water level ( E p ), and error of time-to-peak ( E T P ). The three indicators are defined as:
CE = 1 S S E S S T m = 1 i n ( H o H e ) 2 i n ( H o H o ¯ ) 2
E P = H e , p H o , p H o , p × 100
E T P = T e , p T o , p
where H o ,   H e are the observed and simulated water levels, respectively. H o ¯ is the mean of observed water level, H o , p and H e , p are the peak of observed and simulated water levels, SSE is the sum of square errors and S S T m is the sum of square errors respects with respect to mean value, T o , p and T e , p are the time to peak of the observed and simulated water levels.

2.4. Levee Overtopping Risk Assessment

This study defined failure risk as the probability of the maximum water level exceeding the levee crown which could be expressed as:
Risk = P r ( H w > h )
where H w is the water level simulated by SOBEK model using the rainfall projection data in the three periods, and h represents the current height of the levee crest.
To tackle Equation (6), a straightforward practice is to fit a proper probability distribution to the simulated peak water levels of the typhoon events in the three periods. For each peak water level of independent typhoon event, it could be described by a generalized extreme value (GEV) distribution, which could be represented as [26]:
P ( x ) = { exp [ { 1 s ( x l ) / f } 1 / s ]                 s 0 exp [ exp { ( x l ) / f } ]                           s = 0
where s, l, and f are the shape, location, and scale parameters of GEV distribution. The GEV distribution is chosen here because it has been widely utilized in modeling flood peaks [27,28,29].

3. Results and Discussion

This study evaluated the overtopping risk of levee crown of Kao-Ping River under a climate change scenario using the hourly projection of dynamic-downscaled and bias-corrected MRI data as input of SOBEK model to simulate the 1D water level in three projection periods: base period (1979–2003), near future (2015–2039), and end of century (2075–2099).

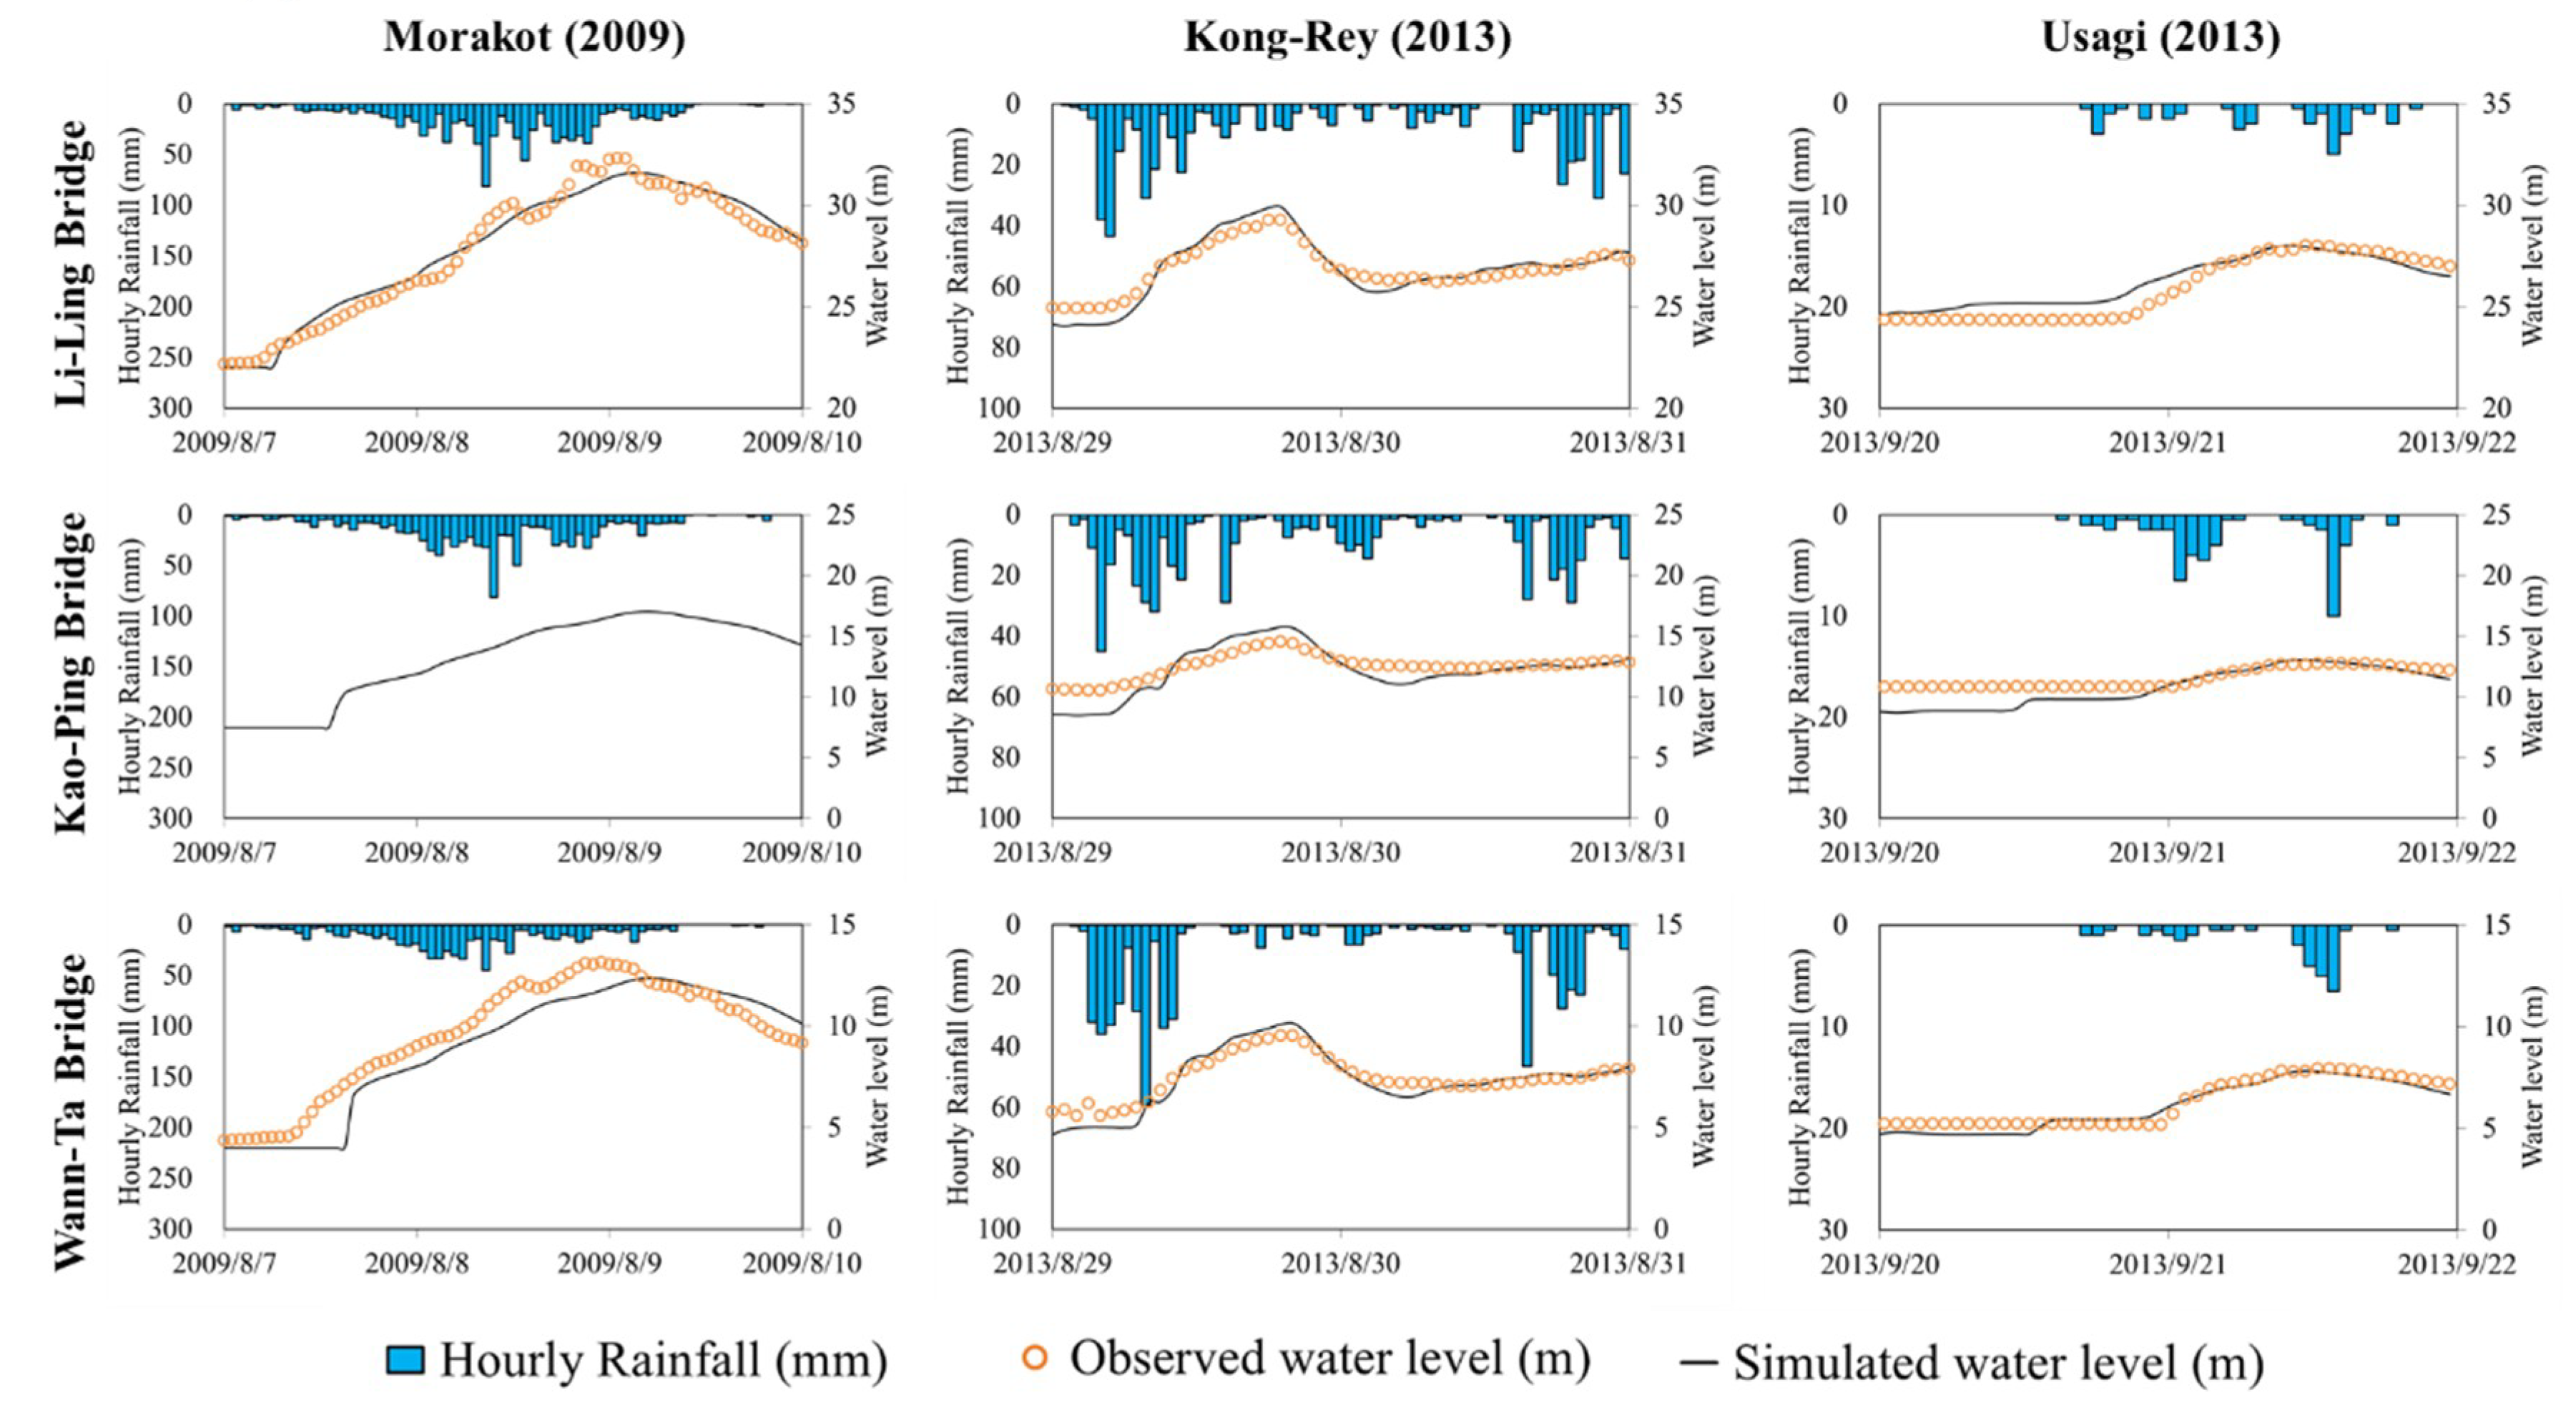
3.1. Calibration and Validation of SOBEK Model

In order to evaluate the applicability of the SOBEK model for the simulation of future climate, we first calibrate and validate the parameters of the SOBEK model using three extreme typhoon events occurred in Aug. 2009 (Morakot), Aug. 2013 (Kong-Rey), and Sep. 2013 (Usagi). Figure 4 shows the comparisons of the simulated and observed water level at Li-Ling Bridge station in the Kao-Ping River basin and it appears that the water levels simulated by the SOBEK model have a fairly good agreement with observations. It also reveals that the SOBEK model is capable of simulating the peak water level of the three typhoon events. To further quantify the performance of the SOBEK model, we derived the CE, E P , and E T P as listed in Table 3. From the results of Li-Ling Bridge and Wann-Ta Bridge stations, the CE values of the three events ranged between 0.78 and 0.97. However, the CE at Kao-Ping Bridge is relative poor due to the small variations in the water level observations during typhoon Kong-Rey and typhoon Usagi as that produced very small S S T m in Equation (3). The E P shows that the errors of peak water level for the three typhoon events are generally less than 8.3% (most of the E P values are less than 2.5%) and most of the errors of time-to-peak are within 2 h, except Wann-Ta Bridge during typhoon Morakot. Although the water level observations at Kao-Ping Bridge in typhoon Morakot are unavailable, due to a broken water level sensor, the validation and calibration results, overall, reveal that the SOBEK model is able to simulate the peak water level of the three typhoon events.

3.2. Water Level Simulation Results

With the calibrated and validated SOBEK model for the Kao-Ping river basin, we utilized the projection precipitation datasets in the three projection periods (base period, near future, and end of century) as input of the SOBEK model to simulate the water levels of the typhoon events in the three periods. The results showed that the simulated peak water level of the typhoon events does not exceed the design stage at the Wann-Ta Bridge station in the three projection periods (Table 4). There are only two typhoon events (Top1 and Top4 in Table 1) in the EC period that result in peak water level exceeding the design stage at Li-Ling Bridge and Kao-Ping Bridge with the total duration of 23 h and 14 h, respectively. The reason why not the TOP2 and TOP3 typhoon events in the EC period results in peak water levels (31.83 m and 31.92 m at Li-Ling Bridge station for TOP2 and TOP3 in the EC period, respectively) exceeding design stage (32.25 m at Li-Ling Bridge station) is primary due to the heterogeneous spatial and temporal distribution of rainfall patterns.

3.3. Overtopping Risk Assesment

Given the definition of risk in Equations (6) and (7), the shape, location, and scale parameters of GEV distribution at the three water level stations in the three projection periods are shown in Table 5. It is interesting to observe that the GEV parameters, location and scale, increased in the EC comparing to that in the BP. This implies that the probability of higher water level for the EC is expected to be larger than that for the BP. Validated using Equation (6), the overtopping probabilities of current embankment height at three water level stations in the historical period and the three projection periods are listed in Table 6. From the historical data, the overtopping probability is close to 1.0 which is corresponding to the 100-year design level [25]. From Figure 5, the fitted GEV distributions have good agreement with the histograms. Comparing EC to BP, the overtopping probability at Li-Ling Bridge increased from 1.3% to 7.4% (by a factor of 5.7), while at Kao-Ping Bridge it increased from 0.5% to 4.0% (by a factor of 8), and at Wann-Ta Bridge it increased from 1.6% to 1.8% (by a factor of 1.1). The increment of overtopping probability is obvious and it highlights the danger of current flood control facilities along Kao-Ping River.

3.4. Uncertainties and Limitations

This study demonstrated how to assess the overtopping probability of Kao-Ping River based on a dynamic downscaling dataset under a climate change scenario. Nonetheless, there are still some limitations due to various kinds of uncertainty sources including the climate change scenario, downscaling process, bias-correction process, probability distribution fitting etc. First, only one climate change scenario is considered in this study. The results are solely based upon this scenario. To conduct a comprehensive risk assessment, more scenarios should be taken into consideration if possible. It requires, however, considerable labor and computation time to complete 1D flood simulation using a huge number of projected typhoon events. One possible way is to develop a statistical model to estimate peak water level based on rainfall data such as Advance First Oder Second Moment (AFOSM) [12,13,14]. However, AFOSM also involved some degree of modeling uncertainty.
Secondly, dynamic downscaling processes are not yet perfect and thus bias is inevitable. Similar with the issue of climate change scenario, it is suggested to use as many of the dynamic downscaled products provided by various meteorological centers as possible.
Finally, the probability distribution fitting issue also involves certain uncertainty. Certainly, many kinds of distribution could be used to fit the flood peaks such as Pearson Type III and Generalized Pareto distributions. The GEV, however, currently is still the most commonly used distribution to model the flood peaks in the literature [30,31]. It should be noted that the probability distribution of flood peaks in the future is not necessarily the same as the one in the Base Period.

5. Conclusions

The main objective of this study is to quantitatively evaluate the overtopping risk of the embankment along the Kao-Ping River under a climate change scenario using the dynamic downscaled MRI-WRF-BC dataset. In the bias-corrected WRI-WRF-BC dataset, more than 80 typhoon events were identified in each projection period (BP, NF, and EC). We developed a 1D river flood simulation model by SOBEK which had been calibrated and validated by historical typhoon events including the most devastating typhoon Morakot in the 21st century in Taiwan. Our results highlighted that (1) the levee Li-Ling Bridge of Kao-Ping River has higher risk of overtopping; (2) the overtopping probability at Li-Ling Bridge increases from 1.3% to 7.4% (by a factor of 5.7), while at Kao-Ping Bridge it increases from 0.5% to 4.0% (by a factor of 8), and at Wann-Ta Bridge no significant increase (by a factor of 1.1) is observed. Although some limitations and uncertainties regarding climate change scenarios, downscaling methods, and probability distribution model selection remain challenging, useful information on climate change and overtopping risk of the levee along Kao-Ping River is clearly illustrated in this study. The authority should take this information seriously to draw appropriate and long-term improvement plans for the sustainable projects of Kao-Ping River.

Author Contributions

Conceptualization, H.-P.W. and Y.-F.S.; methodology, Y.-F.S. and C.-T.C.; software, K.-C.Y.; validation, H.-P.W. and Y.-F.S.; formal analysis, H.-P.W.; investigation, H.-P.W.; resources, K.-C.Y. and C.-T.C.; data curation, Y.-F.S., and C.-T.C.; writing—original draft preparation, H.-P.W. and Y.-F.S.; writing—review and editing, H.-P.W., Y.-F.S., C.-T.C., and K.-C.Y.; visualization, Y.-F.S.; supervision, K.-C.Y. All authors have read and agreed to the published version of the manuscript.

Funding

Part of the funding supporting this study is from the Taiwan Climate Change Projection and Information Platform (TCCIP) project in Ministry of Science and Technology, Taiwan (MOST-108-2621-M-865-001).

Acknowledgments

The authors are grateful for the tidal level provided by our colleague W.B. Chen. We also grateful for the valuable comments provided by three reviewers.

Conflicts of Interest

The authors declare no conflict of interest.

References

  1. The International Disaster Database. Available online: https://www.emdat.be (accessed on 27 March 2020).
  2. Centre for Research on the Epidemiology of Disasters (CRED). Available online: https://www.cred.be (accessed on 27 March 2020).
  3. Myhre, G.; Forster, P.M.; Samset, B.H.; Hodnebrog, Ø.; Sillmann, J.; Aalbergsjø, S.G.; Andrews, T.; Boucher, O.; Faluvegi, G.; Fläschner, D.; et al. A Precipitation Driver and Response Model Intercomparison Project—Protocol and Preliminary Results. Am. Meteorol. Soc. 2017, 98, 1185–1198. [Google Scholar] [CrossRef]
  4. Papalexiou, S.M.; Montanari, A. Global and Regional Increase of Precipitation Extremes under Global Warming. Water Resour. Res. 2019, 55, 4901–4914. [Google Scholar] [CrossRef]
  5. Janssen, E.; Wuebbles, D.J.; Kunkel, K.E.; Olsen, S.C.; Goodman, A. Observational- and model-based trends and projections of extreme precipitation over the contiguous United States. Earth’s Future 2014, 2, 99–113. [Google Scholar] [CrossRef]
  6. Oeurng, C.; Cochrane, T.A.; Chung, S.; Kondolf, M.G.; Piman, T.; Arias, M.E. Assessing Climate Change Impacts on River Flows in the Tonle Sap Lake Basin. Water 2019, 11, 618. [Google Scholar] [CrossRef] [Green Version]
  7. Wei, H.P.; Yeh, K.C.; Liou, J.J.; Chen, Y.M.; Cheng, C.T. Estimating the Risk of River Flow under Climate Change in the Tsengwen River Basin. Water 2016, 8, 81. [Google Scholar] [CrossRef] [Green Version]
  8. Arnell, N.W. Climate change and global water resources. Glob. Environ. Chang. 1999, 9, S31–S49. [Google Scholar] [CrossRef]
  9. Nohara, D.; Kitoh, A.; Hosaka, M.; Oki, T. Impact of climate change on river discharge projected by multimodel ensemble. J. Hydrometeorol. 2006, 7, 1076–1089. [Google Scholar] [CrossRef] [Green Version]
  10. Nakicenovic, N.; Alcamo, J.; Davis, G.; Vries, B.D.; Fenhann, J.; Gaffin, S.; Gregory, K.; Grübler, A.; Jung, T.Y.; Kram, T.; et al. Special Report on Emissions Scenarios: A Special Report of Working Group III of the Intergovernmental Panel on Climate Change; Cambridge University Press: Cambridge, UK, 2000; p. 570. [Google Scholar]
  11. Arnell, N.W. Climate change and global water resources. SRES emissions and socio-economic scenarios. Glob. Environ. Chang. 2004, 14, 31–52. [Google Scholar] [CrossRef]
  12. Cheng, S.T.; Yen, B.C.; Tang, W.H. Overtopping Risk for an Existing Dam. Ph.D. Thesis, Hydraulic Engineering Series, University of Illinois, Urbana, IL, USA, 1982. [Google Scholar]
  13. Wu, S.J.; Yang, J.C.; Tung, Y.K. Risk analysis for flood control structure under consideration of uncertainties in design flood. Nat. Hazards 2011, 58, 117–140. [Google Scholar] [CrossRef]
  14. Sowinski, M. Application of AFOSM method for risk assessment of Warta River flood levee overtopping. In Proceedings of the 1st International Conference on New/Emerging Concepts for Rivers-Rivertech 1996, Chicago, IL, USA, 22–26 September 1996; pp. 324–331. [Google Scholar]
  15. Kovačević, M.S.; Librić, L.; Ivoš, G.; Cerić, A. Application of reliability analysis for risk ranking in a levee reconstruction project. Sustainability 2020, 12, 1404. [Google Scholar] [CrossRef] [Green Version]
  16. Mizuta, R.; Yoshimura, H.; Murakami, H.; Matsueda, M.; Endo, H.; Ose, T.; Kamiguchi, K.; Hosaka, M.; Sugi, M.; Yukimoto, S.; et al. Climate simulations using MRI-AGCM3.2 with 20-km Grid. J. Meteorol. Soc. Jpn. Ser. 2012, 90A, 233–258. [Google Scholar] [CrossRef] [Green Version]
  17. Fita, L.; Ferna´ndez, J.; Garcı´a-Dı´ez, M. CLWRF: WRF Modifications for Regional Climate Simulation under Future Scenarios. Preprints, 11th WRF Users’ Event; NCAR: Boulder, CO, USA, 2010; p. 26. [Google Scholar]
  18. Skamarock, W.C.; Klemp, J.B.; Dudhia, J.; Gill, D.O.; Barker, D.; Duda, M.G.; Duda, M.; Huang, X.-Y.; Wang, W.; Powers, J.G. A Description of the Advanced Research WRF Version 3.NCAR Technical Note, 475, TN-475+STR; University Corporation for Atmospheric Research: Boulder, CO, USA, 2008. [Google Scholar] [CrossRef]
  19. Su, Y.F.; Cheng, C.T.; Liu, J.J.; Chen, Y.M. Bias correction of MRI-WRF dynamic downscaling datasets. Terr. Atmos. Ocean. Sci. 2015, 27, 649–657. [Google Scholar] [CrossRef] [Green Version]
  20. Vitart, F.; Anderson, J.L.; Stern, W.F. Simulation of Interannual Variability of Tropical Storm Frequency in an Ensemble of GCM Integrations. J. Clim. 1997, 10, 745–760. [Google Scholar] [CrossRef]
  21. Yu, Y.C.; Lee, T.J.; Kung, C.Y. Disaster warning and scenario analysis in Typhoons and Heavy Rainfall events. NCDR Rep. 2014, 2014, 1–15. (In Chinese) [Google Scholar]
  22. Deltares. Sobek User Manual; Deltares: Delft, The Netherlands, 2017. [Google Scholar]
  23. Burnash, R.J.C. The NWS River Forecast System-Catchment model. In Computer Models of Watershed Hydrology; Singh, V.P., Ed.; Water Resources Publications: Highlands Ranch, CO, USA, 1995; pp. 311–366. [Google Scholar]
  24. Chen, W.B.; Liu, W.C. Modeling Flood Inundation Induced by River Flow and Storm Surges over a River Basin. Water 2014, 6, 3182–3199. [Google Scholar] [CrossRef] [Green Version]
  25. Water Resources Agency (WRA). Calibration of Flood Forecasting Model and Review and Establishment of Warning Stages (2/2); Water Resources Agency: Taipei, Taiwan, 2014. (In Chinese) [Google Scholar]
  26. Hosking, J.R.M. Testing whether the shape parameter is zero in the generalized extreme-value distribution. Biometrika 1985, 71, 367–374. [Google Scholar] [CrossRef]
  27. Morrison, J.E.; Smith, J.A. Stochastic modeling of flood peaks using the generalized extreme value distribution. Water Resour. Res. 2002, 38, 1305. [Google Scholar] [CrossRef]
  28. Nadarajah, S.; Shiau, J.T. Analysis of extreme flood events for the Pachang River, Taiwan. Water Resour. Manag. 2005, 19, 363–374. [Google Scholar] [CrossRef]
  29. Nyaupane, N.; Bhandari, S.; Rahaman, M.M.; Wagner, K.; Kalra, A.; Ahmad, S.; Gupta, R. Flood frequency analysis using generalized extreme value distribution and floodplain mapping for hurricane Harvey in Buffalo Bayou. In Proceedings of the World Environmental and Water Resources Congress, Minneapolis, MN, USA, 3–7 June 2018. [Google Scholar] [CrossRef]
  30. Huang, Y.; Ma, Y.; Liu, T.; Luo, M. Climate change impacts on extreme flows under IPCC RCP scenarios in the mountainous Kaidu watershed, Tarim River basin. Sustainability 2020, 12, 2090. [Google Scholar] [CrossRef] [Green Version]
  31. Kim, S.U.; Son, M.; Chung, E.S.; Yu, X. Effects of non-stationary on flood frequency analysis: Case study of the Cheongmicheon watershed in South Korea. Sustainability 2018, 10, 1329. [Google Scholar] [CrossRef] [Green Version]
Figure 1. The research framework of this study.
Sustainability 12 04511 g001
Figure 2. The study area in which the red triangles show the locations of rain gauges, while the green stars represent the water level stations and the gray crosses shows the center of Meteorological Research Institute Weather Research and Forecasting model (MRI-WRF) 3.2S (see Section 2.2) grid with 5 km spatial resolution. The digital elevation model (DEM) is from Shuttle Radar Topography Mission (SRTM) dataset.
Sustainability 12 04511 g002
Figure 3. Comparison of the accumulated rainfall of typhoon events in the three periods (a) 3 h; (b) 24 h.
Sustainability 12 04511 g003
Figure 4. Calibration and validation of the SOBEK model at the three water level stations with the three typhoon events. Note that the rainfall record of each plot is from the rain gauge station nearby each water level station as shown in Figure 2. Notably, the water level records at Kao-Ping Bridge station during typhoon Morakot are unavailable due to a broken water level sensor.
Sustainability 12 04511 g004
Figure 5. Histograms and the fitted GEV distributions of the annual peak water levels in the historical period and three projection periods. For historical period, there are 27 samples at the Li-Ling Bridge, 7 samples at the Kao-Ping Bridge, and 17 samples at the Wann-Ta Bridge. Each plot in base period (BP), near future (NF), and end of century (EC) is based on 25 samples. The black dashed line shows the dike height at each water level station.
Sustainability 12 04511 g005
Table 1. Precipitation statistics of the top 20 typhoon events in the three projection periods and typhoon Morakot in 2009. Note that: I 3 is the maximum accumulated rainfall for 3 h (mm); I 24 is the maximum accumulated rainfall for 24 h (mm); I R is the total precipitation of the event (mm); T R is the total duration of the event (hours). The shaded areas indicate the events with I 3 and I 24 larger than that of typhoon Morakot in 2009.
Typhoon
Event
Base Period (BP)
(1979–2003)
Near Future (NF)
(2015–2039)
End of Century (EC)
(2075–2099)
I 3 I 24 I R T R I 3 I 24 I R T R I 3 I 24 I R T R
Top1149.5935.31899.5119135.2758.7811.861230.21269.21524.049
Top2117.8602.7838.761147.9749.91093.091227.51156.41608.967
Top3122.6562.3692.249118.4637.3700.343158.6932.21080.849
Top491.3507.71178.291129.4554.6657.767163.4866.71031.067
Top589.5469.2510.343150.5521.5545.449188.6813.3847.334
Top687.0395.6614.391130.8485.0490.931168.4786.91141.2132
Top772.6334.1487.17983.1477.8586.473110.0730.41114.497
Top881.1326.6328.537124.9471.5497.343140.7672.4697.348
Top977.9318.7594.26792.3433.1507.267138.1545.8554.043
Top1062.5314.0369.54791.7397.4456.479111.4529.8575.649
Top1185.5305.0353.055105.7347.2377.644101.0507.5842.061
Top1264.2288.8324.74697.4342.2352.737117.6497.8553.579
Top1365.1285.7343.47384.1341.1751.7144168.7492.3524.979
Top1494.1262.7294.14359.7331.7577.091141.0471.8544.243
Top1549.6259.6284.24951.2323.9694.979199.1468.5509.461
Top1644.1241.5349.29582.1317.8381.36778.3466.0686.573
Top1786.6233.4346.313961.5282.5292.65488.5455.5558.349
Top1848.7225.8230.63760.4281.5312.249112.9426.6436.037
Top1945.0224.3238.03144.1265.9389.869132.5419.1434.446
Top2072.3206.0206.03147.9255.2326.34370.1406.6568.167
Morakot133.7496.21475.872--------
Table 2. Information of the three water level stations in Kao-Ping River. Note that the design stage is based on a return period of 100 years [25]. The historical maximum water level at the Li-Ling Bridge and Wann-Ta Bridge stations are recorded in the typhoon Morakot 2009. Notably, during typhoon Morakot the water level sensor at Kao-Ping Bridge is broken.
Water Level StationDesign Stage (m)Historical Maximum Water Level (m)Dike Height (m)
Li-Ling Bridge32.2532.3136.58
Kao-Ping Bridge18.1416.86 (2016Megi)18.66
Wann-Ta Bridge14.0813.1416.22
Table 3. Calibration and validation of the SOBEK model. Note that water level record at Kao-Ping Bridge station is unavailable due to a broken water level sensor.
Typhoon EventsMorakot (2009)Kong-Rey (2013)Usagi (2013)
Station CE E P
(%)
E T P
(hours)
CE E P
(%)
E T P
(hours)
CE E P
(%)
E T P
(hours)
Li-Ling Bridge0.97−2.2320.792.2310.83−0.02−1
Kao-Ping Bridge---−0.18.30−0.972.5−1
Wann-Ta Bridge0.84−5.960.786.410.91−1.37−1
Table 4. Statistics of the simulated water levels exceeding design stage during the typhoon events. The number in the parentheses is the total duration (hours) of the water levels exceeding the design stage.
Water Level StationNumber of Typhoon Events with Water Level Exceeding the Design Stage
Base Period (BP)
(88 Events)
Near Future (NF)
(81 Events)
End of Century (EC)
(82 Events)
Li-Ling Bridge002(23)
Kao-Ping Bridge002(14)
Wann-Ta Bridge000
Table 5. Parameters of generalized extreme value (GEV) distribution by maximum likelihood method for the three water level stations in the three projection periods. Note that s, l, f are shape, location, and scale parameters.
Water Level StationsHistorical PeriodBase PeriodNear FutureEnd of Century
slfslFslfslf
Li-Ling Bridge−0.1526.891.890.0127.311.10−0.2327.841.48−0.4128.772.21
Kao-Ping Bridge−0.4314.381.38−0.0713.091.15−0.3313.621.50−0.4214.412.11
Wann-Ta Bridge−0.189.171.670.008.890.94−0.339.431.21−0.279.811.73
Table 6. Overtopping probability at the three water level stations in the historical period and the three projection periods.
Water Level StationDesign Stage (m)Overtopping probability (%)
HistoricalBase PeriodNear FutureEnd of Century
Li-Ling Bridge32.252.51.30.67.4
Kao-Ping Bridge18.140.00.50.04.0
Wann-Ta Bridge14.081.60.40.01.8

