Article

Pork Production Survey to Assess Factors of Facility Design and Operation

by
Joseph R. Sanford
*,
Horacio A. Aguirre-Villegas
and
Rebecca A. Larson
Department of Biological Systems Engineering, University of Wisconsin-Madison, 460 Henry Mall, Madison, WI 53706, USA
*
Author to whom correspondence should be addressed.
Sustainability 2020, 12(11), 4536; https://doi.org/10.3390/su12114536
Submission received: 19 March 2020 / Revised: 23 May 2020 / Accepted: 30 May 2020 / Published: 3 June 2020

Abstract

:
Pork producers can have difficulty operating or expanding existing facilities or establishing new facilities based on perceived negative impacts to the environment and surrounding community. It is critical to understand the characteristics and practices adopted in swine facilities to evaluate the extend of these impacts. A survey, completed by 69 pork producers in Wisconsin, was conducted to assess how facility design and management affect odor, water quality, water consumption, air quality, traffic, and noise. A wide range of production facilities participated in the survey where 29% of respondents were classified as very small (<35 animal units, AU), 16% as small (35–70 AU), 20% as medium (70–300 AU), 23% as large (300–1000 AU), and 12% as permitted (>1000 AU) facilities. Generally, facilities integrated numerous odor control strategies which resulted in high calculated odor scores and the absence of odor complaints. However, the lack of nutrient management planning and other practices for water quality, particularly for facilities with less than 300 AU, indicates there are areas that need improvement. Regardless of facility size, water reduction practices were very commonly reported indicating water conservation is important. Pit ventilation and mechanical ventilation was reported at 58 and 85% of the surveyed facilities, which highlights the need to increase the adoption of mechanical ventilation for air quality, especially in farms with under-barn storage. Using trucks instead of tractors and pumping instead of trucks and tractors can reduce traffic around facilities during manure hauling season.

1. Introduction

Pork production accounts for a large portion of protein in American diets and contributes US$ 23.4 billion (gross output) to the U.S. economy [1]. Unfortunately, pork production facilities are also known to have negative environmental impacts such as emissions to air and water, odors, and contribute to noise and traffic in the areas they are located [2,3,4,5]. The number of swine producing facilities in the U.S. has decreased from 660,000 to 69,000 from 1980, but the total annual swine production has remained constant [6]. This is a result in a shift from small farms to large concentrated animal feeding operations (CAFO) in recent decades. CAFO’s have additional challenges as they concentrate large quantities of manure [7]. Liquid or slurry manure storage can be a source of methane (CH4) and ammonia (NH3) emissions and result in odor, due to high moisture environments which are more favorable for the growth of bacteria that generate these emissions [8,9]. Odor often intensifies when manure storage surface is disturbed, during agitation [4]. Land applied manure can also be an important source of NH3 and greenhouse gases (GHG) further contributing to odor and gaseous emissions. Up to 60% of nitrogen (N) can be lost through volatilization if swine liquid manure is not rapidly incorporated [4] which is not only an environmental and odor concern, but also a financial loss in the form of N fertilizer that could be utilized on-farm or sold. Additionally, over application of manure can contribute to both soil and water pollution resulting in surface water quality impacts such as eutrophication. These concerns can result in tension between existing facilities and local communities, as well as those trying to site new facilities. It is hard to understand the potential issues from existing and new pork production facilities when the current practices are unknown, even more so, if the practices have significantly changed over time [10].
Studies have analyzed the air quality effects of practices adopted in swine operations, but they have targeted specific processes or impacts. Lory et al. [11], surveyed 39 farms in Iowa, Missouri, North Carolina, Oklahoma, and Pennsylvania in order to get an understanding of N losses based on different manure management practices. The authors found that more than one third of the farms were larger than 1000 AU and 57% were between 300 and 1000 AU. They also identified that anaerobic lagoons had significant N losses compared to slurry structures for storage. Zhong et al. [12] focused on GHG emissions from manure composting and land application in China. The authors found that fossil carbon dioxide (CO2) (30%), CH4 (54%) and nitrous oxide (N2O) (16%) were the main gaseous emissions from these operations, and that the composting process itself accounted for nearly 50% of total GHG emissions. Godbout et al. [13] investigated the impact of ambient air quality in relation to public health in farming communities in terms of symptoms, quality of life, social climate, and mental health. Approximately, 43% of the participants claimed that they had detected odor and of those, 60% found it disturbing. Those that detected odor also indicated symptoms such as headaches, runny nose, cough, and vomiting. Liu et al. [14] conducted a meta-analysis on NH3 and hydrogen sulfide (H2S) emissions from swine facilities in North America. Deep-pit and hoop houses had significantly higher NH3 emissions than other systems and farrowing houses had the highest H2S emission rate followed by gestation houses. Both NH3 and H2S increased with pig weight and operation size, but no significant effects of production stage or storage type were observed for NH3 and H2S.
Contaminants from swine manure can also enter water streams through leakage from storage systems, during precipitation events, or atmospheric deposition followed by dry or wet fallout [15]. Riaño and García-González [16] conducted a study to evaluate how effective solid-liquid separation was at reducing concentration of nutrients, metals, and pathogens in raw swine manure and found reductions of 97% for chemical oxygen demand (COD) and N, and 89% for phosphorus (P). Pote et al. [17] investigated the relation of soil infiltration rate to swine manure application in regards to the water quality of leachate and runoff. The authors reported that soils with high infiltration rates would reduce impacts from surface water contaminates but may be detrimental to groundwater with extremely high infiltration rates. Xian et al. [18] evaluated the potential of utilizing floating bed systems with different varieties of ryegrass to remove swine manure nutrients and improve water quality of swine wastewater. All grass varieties achieved nutrient reductions due to increased surface area for microorganisms from the root growth. In addition, the authors concluded that the roots acted as a filtration device that would help the settling process of particulate bond P. Daverede et al. [19] evaluated the effects of source and application method on P in runoff on soybean fields. Injection and incorporation of swine manure resulted in the smallest P losses minimizing the risk of surface water contamination.
The potential to reduce the negative impacts from pork production farms is highly dependent on the design of the facility and the management practices that the farm integrates [4]. Understanding the trends in facility design and management practices can help identifying the actual concerns and areas for targeted improvement. The objective of this study was to document facility design and operation practices in swine production facilities in Wisconsin (WI) by using surveys, and relate this data to odor, water quality, water consumption, air quality, traffic, and noise impacts to understand the potential areas of concern for facility design and operation and to also identify areas of performance which may reduce impacts.

2. Materials and Methods

2.1. Farm Selection and Survey Description

Data related to swine production facility design and management was collected through surveys sent to production facilities in WI. The practices assessed were related to environmental or operational issues commonly identified as a concern for neighboring communities particularly odor, air quality, water quality, water consumption, traffic, and noise. Surveys were used to outline the current state of the industry, areas for improvement, and areas of excellence. The survey (Appendix A) consisted of 41 questions encompassing general farm information (acreage, distance to neighbors, number of animals), housing and facility design (type, age, animal permanence), manure handling (collection, storage, processing, and land application), resource use (energy and water), transport (trucks used for feed and animal transport), and conservation practices (water recycle, nutrient guidelines).
A total of 480 pork producers in WI were identified by the WI Pork Producers Association (including members and non-members). The initial survey was sent via email followed by two mailed hard copies. Participants were offered an incentive of US$10 for completing the survey. No identifiable information was tabulated from the surveys in order to guarantee anonymity to the respondents.
A total of 90 producers responded to the survey, for a 18.7% response rate. Only 69 of the participant surveys were used for analysis, as they provided information on facility capacity for each animal stage, which was required for classifying based on animal unit (AU = 453.6 kg or 1000 lbm) population. Some of the 69 participants did not respond to every survey question, but they were still included in the analysis (for all surveys used, participants responded to at least 50% of the questions). As a result, the number of respondents (n) is less than 69 in some of the graphs and tables reported in the results section and supplemental materials. Of the 69 facilities used for analysis, 29% were classified as very small (<35 AU), 16% small (35–70 AU), 20% medium (70–300 AU), 23% large (300–1000 AU), and 12% CAFO (>1000 AU), Table S1. Facility AU was determined by:
A U = ( ( n n u r s e r y × m ¯ n u r s e r y ) + ( n g r o w i n g × m ¯ g r o w i n g ) + ( n f i n i s h i n g × m ¯ f i n i s h i n g ) + ( n b r e e d i n g × m ¯ b r e e d i n g ) + ( n f a r r o w w e a n × m ¯ f a r r o w w e a n ) ) 453.6   k g  
where n is the facility capacity of the animal stage and m ¯ is the average mass of animal stage in kg. When facilities did not provide weight information (i.e., the average weight of animal), m ¯ was replaced by the median reported average weight based on averages reported from other facilities (Table S2). Participants were grouped based on these classifications to further ensure anonymity of individual data. Of those responding, 66% were members of the Wisconsin Pork Producers Association, 94% participated in the USDA Pork Quality Assurance Program, and 31% were dependent on pork production as their main source of income, Figure S1.

2.2. Estimation of Odor Score

Odor scores were calculated using methods outlined in the Wisconsin Department of Agriculture Trade and Consumer Protection (DATCP) chapter 51 using the Odor From Farms–Setback Estimation Tool (OFFSET) [20,21,22]. This method calculates a quantitative odor score using factors of distance to nearest neighbor, animal housing type and area, manure collection method, manure storage type and area, animal lot type and area, and odor control practices. Odor scores were reported for those that responded to all necessary questions (n = 39). For model calculations, manure collection other than scrape systems, slatted floors, and pull plug the odor generation number was assumed to be 20, which corresponds to the pull plug manure collection value, as other collection methods did not have an odor generation number and pull plug was assumed to be the most similar. The manure storage surface area was calculated by assuming the manure storage depth was 4.6 m and dividing the total volume reported by the assumed depth to get the surface area.

3. Results

3.1. General Facility Information
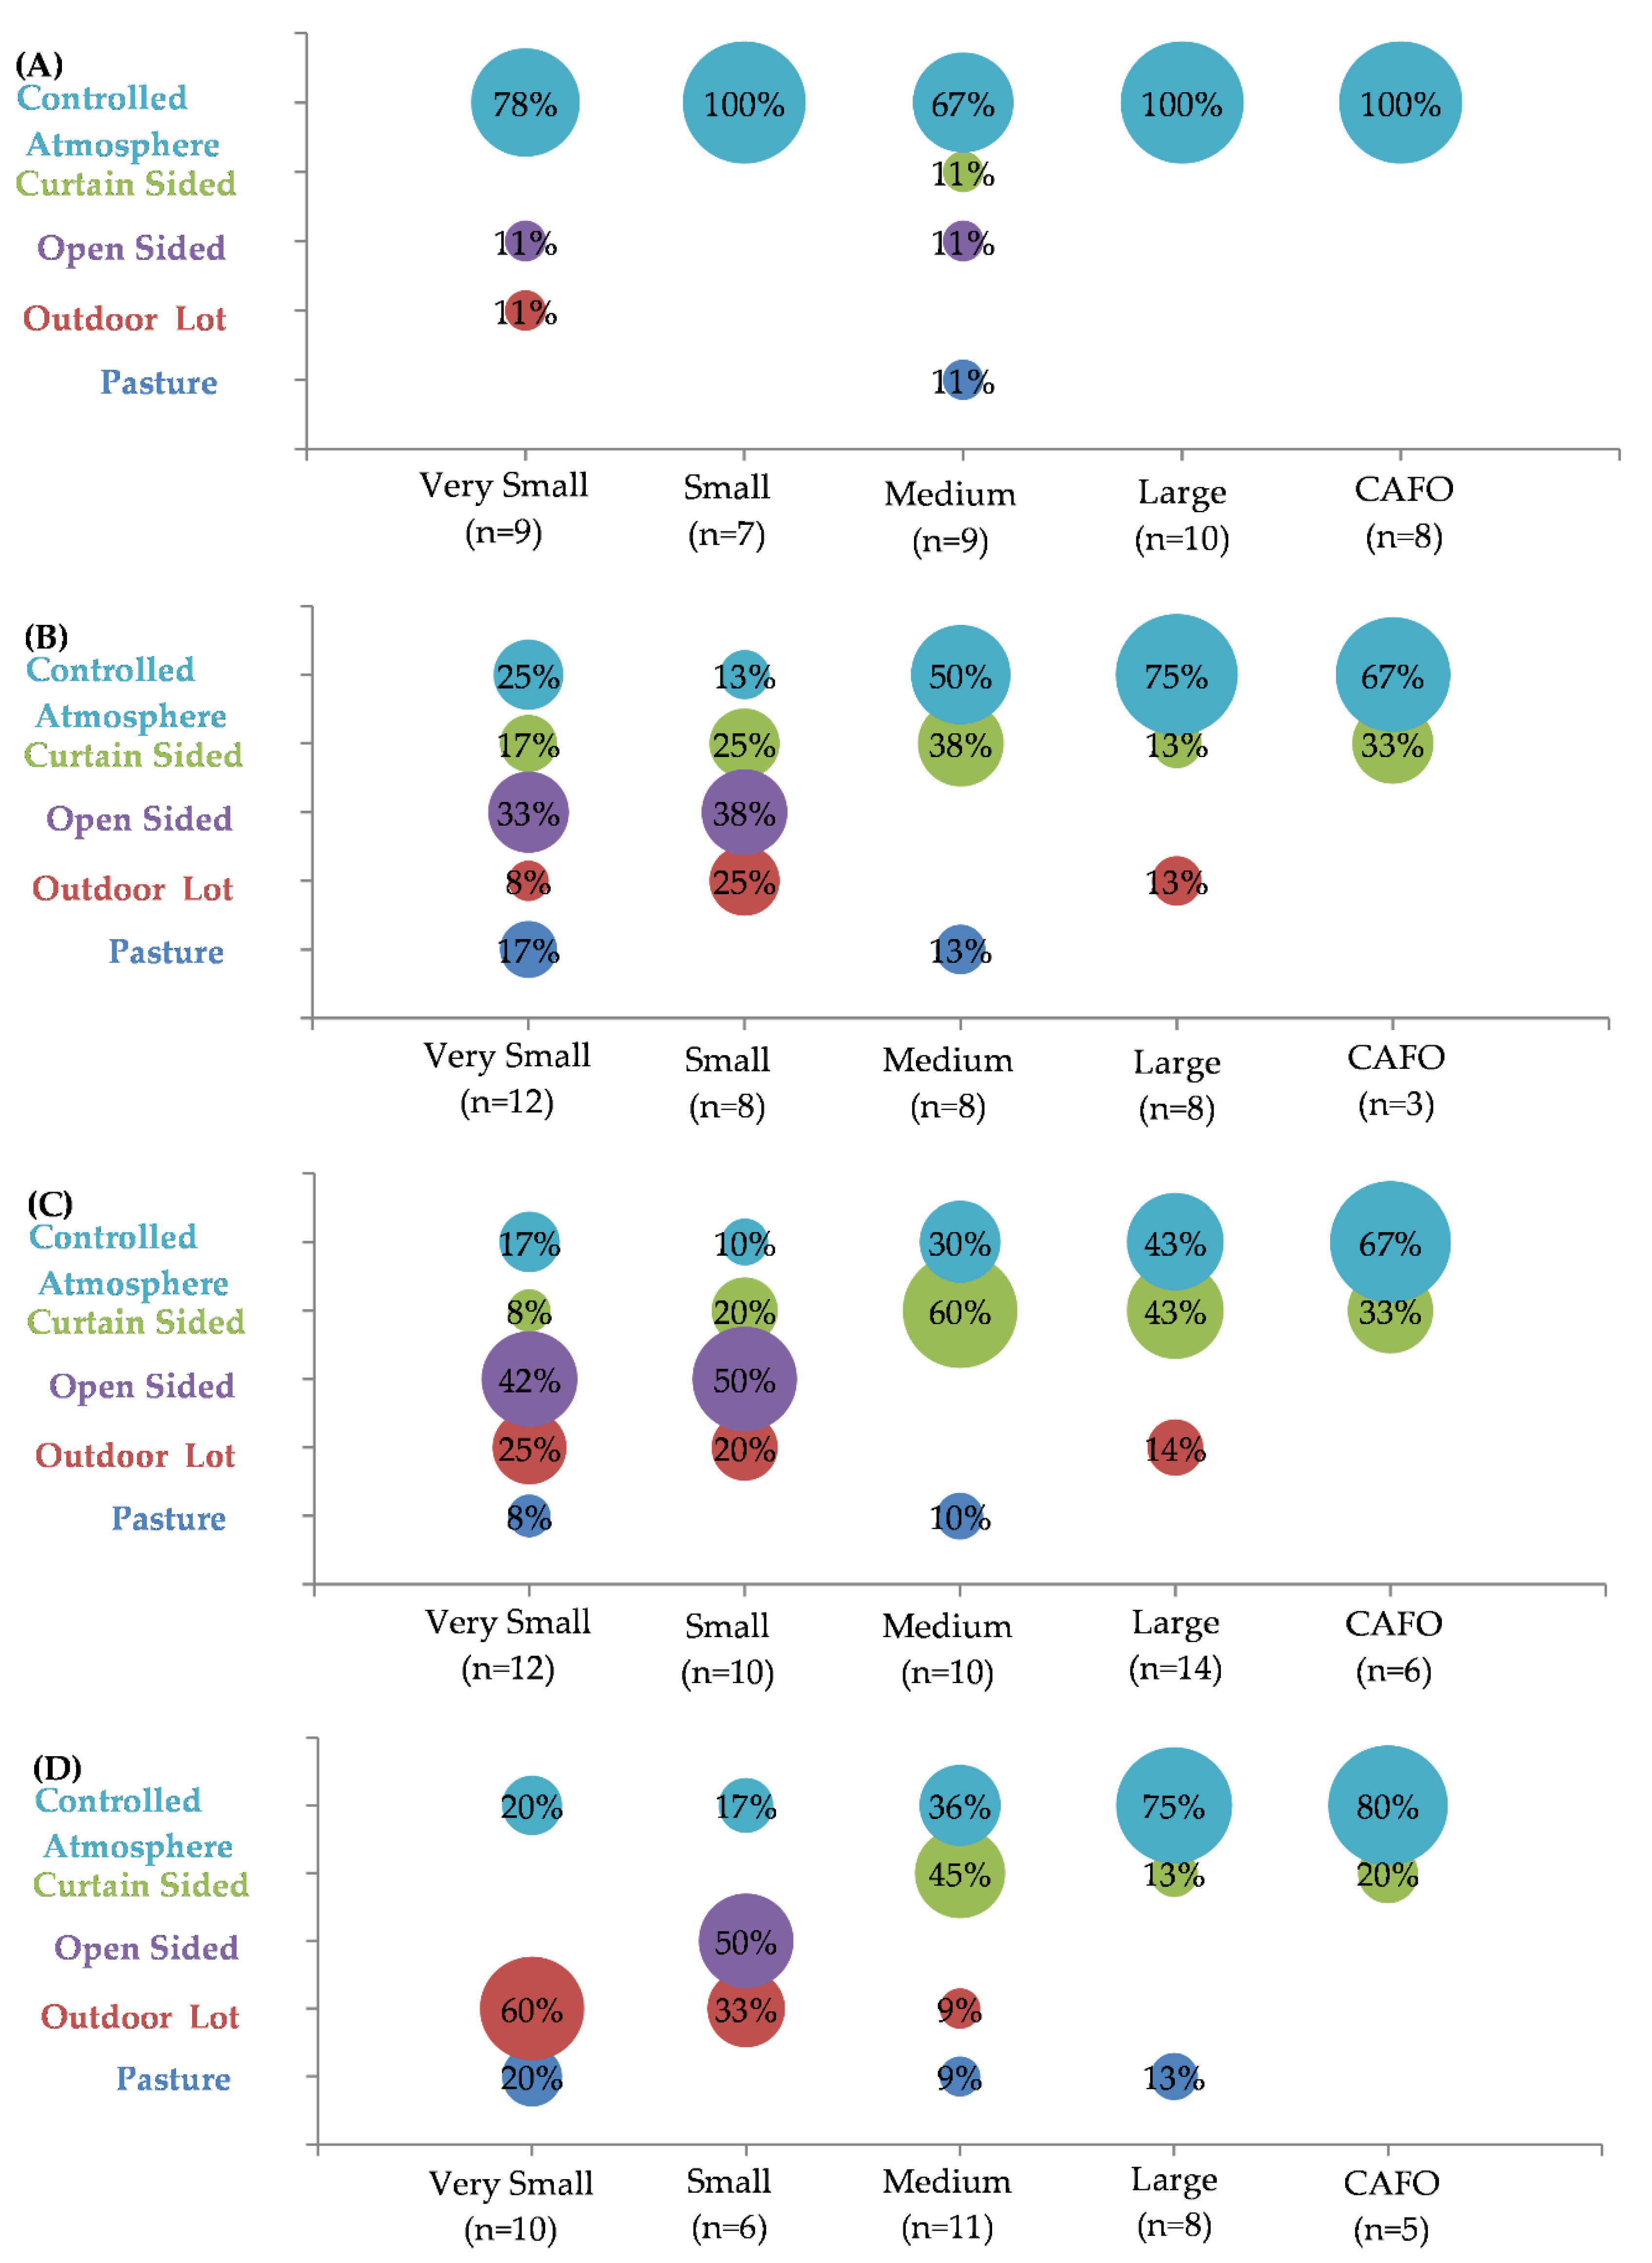
Facility characteristics across animal stages regarding capacity, animal weight, animal density, initial year of construction, year of recent facility update, and number of barns are presented in Table S2. Nursery, growing, finishing, breeding/gestation, and farrow to wean swine stages were kept at 65, 61, 78, 62 and 48% of facilities, respectively, Table S3. Nearly 75% of the facilities kept multiple different swine stages, as only 25% of all facilities kept only one stage of swine and 30% kept all five stages, Figure S2.
The year of initial construction ranged from 1850 to 2017. Multiple facilities have been updated in recent years, Figure S3, particularly those built before the year 2000. A higher fraction of nursery and breeding facilities have been updated compared to growing and finishing. All facility updates were completed between 1990 to 2017.

3.2. Housing Type

Survey respondents indicated controlled atmosphere housing as the most common for nursery, Figure 1. For later stages of swine, controlled atmosphere was still common, but an increasing percentage of other methods included outdoor lots, open side housing, curtain side housing, and pastures were used. Housing type varied with farm size where larger facilities had more controlled atmosphere housing, except for nursery facilities. This is likely the result of higher capital costs for constructing controlled atmosphere housing. Small and very small facilities typically use open sided housing or outdoor lots for growing and finishing swine. Growing, finishing, and breeding swine facilities that have not been updated since 1990 were less likely to be controlled atmosphere housing, Figure S4.
Animal density ranged from 0.19 to 9.29 m2 per animal (or 2 to 100 ft2 per animal) for nursery swine and 0.28 to 9.29 m2 per animal (or 3 to 100 ft2 per animal) for growing, finishing, and breeding swine, Figure S5. The median animal density for nursery, growing, finishing, breeding, and farrow to wean swine was 0.37, 0.74, 0.74, 1.86, and 1.58 m2 per animal (or 4, 8, 8, 20, 17 ft2 per animal), respectively. In general, smaller operations had lower animal density than larger farms, Figure S6. This relationship was not observed for nursery facilities where animal density was more consistent across farm size. As expected, pastured facilities had the largest reported area per animal unit, Figure S7. Growing and finishing controlled atmosphere, curtain sided, and open sided housing typically had animal densities between 0.46 to 0.93 m2 per animal (or 5 and 10 ft2 per animal). Swine kept in open lots typically had between 0.93 to 1.86 m2 per animal (or 10 to 20 ft2 per animal). Animal density was also generally higher for more recently updated or built facilities, Figure S8.
The most common ventilation system was natural ventilation, Figure 2. Mechanical ventilation was very common at CAFO facilities. The fraction of facilities using misters for cooling purposes increased as facility size increased. Similarly, evaporative cooling systems were used only at facilities with 70 or more AUs and was most found at CAFOs.

3.3. Manure and Nutrient Management

Multiple manure collection methods were used although 10% reported not collecting manure, which were primarily smaller operations (<70 AU’s), Figure 3. The most common method used was slatted floors (56% of all facilities) which allows manure to flow directly into an under-barn storage. The use of slatted floors for manure collection increased with operation size, likely due to capital cost of facilities. Additional methods used for manure collection included scrape system and pull plug gutters.
Manure storage was present at 65% of farms surveyed, where larger operations had a higher frequency of farms with manure storage, Table S4. The most common manure storage was a concrete basin (80%), Figure 4. Additionally, 58% of facilities reported having under barn storage, which was more frequent at larger operations. Only 38% of facilities with manure storages utilized storage covers, Table S4. Overall, 78% of facilities with manure storage conducted annual inspections of manure storage, with it being most common for CAFO facilities.
About half (48%) of responding farms used some type of manure processing, Table S5. Composting and manure additives were the most common methods utilized at 27 and 25% of facilities, respectively. Anaerobic digestion was used at 11% of responding facilities, more commonly found on larger operations. For manure application a majority (66%) of producers reported using surface application without incorporation to some extent, Figure 5. However, 40% of the producers responding reported using incorporation after surface application and 26% used injection.
Producers indicated they have integrated several management practices aimed at reducing water quality impacts, Table S6. Only 9 of the 68 respondents to this question did not integrate any form of management practice targeted at improving water quality impacts. The most common practices included avoiding winter manure application (54%), not allowing animals in waterways (54%), using setbacks when applying manure (43%), and using a nutrient management plan (53%). Thirty-five percent of respondents used buffer strips on croplands that were adjacent to waterways, and like other practices, the use of buffer strips generally increased as operation size increased, Figure S9. On average, soil and manure analysis for nutrient management was only conducted at approximately 50% of facilities, but 100% and 89% of CAFOs implemented soil and manure testing, Figure 6. The survey also indicated 13% of respondents collected farmstead runoff.

3.4. Odor Management

Only 7% of the responding farms reported having received odor complaints, Table S7. All facilities receiving complaints reported acting to address the complaint, except for one. Odor scores were calculated for 39 swine facilities, Table 1. The overall mean odor score was 783 and the median was 694.
Reported odor reduction strategies included applying manure at specific times (39% of producers did not apply manure during weekends and holidays), Figure S10, and using physical barriers (planting trees) around odor sources to reduce odor transport, Figure 7. While many farms used pit ventilation, physical barriers, and other odor control practices, 41% (mostly <70 AU farms, Figure 7) reported no odor management practices at their facilities, Table S8.

3.5. Water Use Management

Many facilities have implemented water management practices to reduce water usage, where 83% of facilities used at least one water use reduction strategy, Figure S11. Facilities not using any water reduction practices were primarily very small and small operations, and all large and CAFO operations utilized some type of water saving method. As facility size increased, the number of practices used at a facility generally increased, with 67% of CAFO’s using four or more water management practices. The survey indicated that only 6% of facilities conducted annual water audits, but 25% indicated actively metering water consumption, Figure S12.
The survey indicated 58% of responding facilities actively managed nipple flow and height, Figure 8. Fraction of facilities using nipple management was higher amongst facilities with >70 AU. The survey indicated 30% of responding facilities used bite ball or arato nipples as a water saving method. Thirty-seven percent of producers are utilizing cup or bowl drinkers at their facilities. The fraction of facilities using cup/bowl drinkers was highest for facilities with >300 AU. Wet/dry feeders were used at 16% of responding facilities, and the fraction of facilities using it was greatest for CAFO’s. The survey indicated 51% of facilities used pressure washers for facility cleaning, which generally increased with operation size, Figure S12.

3.6. Traffic Managment

The most frequent traffic is related to animal feed, followed by animal transport and mortality, Table S9. Facility mean and median monthly rucks was 10 and 5, respectively. That can vary greatly based on farm size and operational practices, and as expected, truck traffic at a facility generally increases as AUs on the farm increase.
Tractors were used for some portion of manure hauling at 72% of responding facilities, where 61% of the facilities indicated all manure was transported using this method, Figure 9. The ratio of facilities using tractors for manure transport was higher for smaller facilities, and generally decreased as the facilities got larger. Approximately 25% of responding facilities reported using trucking to some extent, with 9% using it exclusively. A total of 25% of facilities reported using pumping systems for manure transport, and 11% used it exclusively. Only 4% of facilities had permanent pump lines in place, the others were all non-permanent lines. The use of pumping was higher for larger operations, and 90% of facilities with 750 animal units or more used to some extent pumping at their operations.

3.7. Noise Managment

Of the facilities that responded to the survey, none had received any noise complaints. However, 59% of facilities have implemented some noise management practices, while the remaining 41% have not, Table S10. Some of the most common noise reduction strategies include using low noise fans, reducing noise during feeding, and operating and maintaining equipment to reduce noise. Of these practices, 15% of facilities reported using low noise fans and 42% reported using feeding practices targeted at reducing noise, Figure S13.

4. Discussion

4.1. Odor

Odors associated with pork facilities are one of the most common neighbor relationship issues. Larger farms reported higher implementation rates of odor reduction strategies, likely because of the larger odor production potential at these facilities. Additionally, as operation size increased, the number of practices implemented at a facility tended to increase as well. It was expected that facilities with neighbors closer in distance would have more odor reduction practices, but distance and number of practices do not appear to be correlated. Pit ventilation was more common with larger farms likely due to the fact they had a higher ratio of under barn storages. Pit ventilation reduces manure gases and odor from being drawn into the animal area. Under barn storage has been shown to reduce odor emissions since it typically minimizes wind exposure to the atmosphere and reduces manure surface area, which reduce emissions. Odor emissions from other types of storage will vary based on surface area of the manure storage, with lower surface area decreasing odor emissions. Venting outside using pit ventilation allows manure gases and odors to dissipate which reduces odor, particularly when wind can increase the dissipation. Ideally odors are vented with a chimney to better dissipate the gases higher into the atmosphere away from receptors (or people) [23,24], but only two facilities reported using chimneys, Table S8. Using physical barriers reduces odors by capturing some of the compounds within the vegetation and dispersing gases up into the atmosphere [25]. Barriers are most easily implemented along property lines to reduce the transport of odor off the property to neighbors, or around odor sources such as animal facilities and manure storage. Only 27% of facilities reported using physical barriers, Figure 7, and could easily be implemented at all facilities to reduce odor impacts.
Proper siting of swine facilities is another way to reduce odor nuisance by creating a larger setback (or distance) to neighbors [26,27]. A greater setback distance from a facility to neighbors or property lines will result in a better dispersion of gases before reaching neighbors or the public. Multiple states have guidelines when building a new facility on siting in order to reduce odor nuisance. Using the information reported in the survey, odor scores were calculated for 39 swine facilities. The minimum odor score required is 500, and is calculated based on distance to nearest neighbor, animal housing type and area, manure collection method, manure storage type and area, animal lot type and area, and odor control practices [20,21]. The average and median odor score for all facilities was 783 and 694, respectively, Table 1. Only four farms did not meet the odor score standard of 500. However, two of those facilities fell within the 470 to 500 range, which can be acceptable in many states, including WI [22], if given authorization by the local government. Farms with the two lowest odor scores reported that odor complaints had been made against their operation, indicating this methodology may be effective in predicting odor issues. There was no correlation between farm size and odor score. However, the factor that had the largest impact on the odor score was the distance to the nearest neighbor, Figure S14, which signifies the importance of setbacks when siting and constructing new facilities. Existing operations with low odor scores can take multiple steps to increase the score, by implementing mitigation processes at the facility or during manure handling [20,21].

4.2. Surface Water Quality

Surface water quality impacts from pork production facilities generally are a result of runoff from cropland where manure is applied and feed produced, or from the farmstead itself. Runoff from fields is highly dependent on the manure application methods, rate of application, and location and timing of application [28,29,30]. Manure application methods within the survey included surface broadcast application, surface broadcast application with incorporation, and injection. Applying manure using surface broadcast methods without incorporation increases the potential for surface runoff of manure that can then degrade water quality. To reduce runoff producers can incorporate manure, via tillage or injection, into the soil, which significantly reduces loss of P to surface runoff [31]. Additionally, by incorporating manure N the loss of N as NH3 emissions can be reduced [32]. The survey indicated 66% of producer’s surface applied manure without incorporation, 40% surface applied with incorporation, and 26% used injection. Very small farms almost exclusively used surface application without incorporation, and as the size of farm increased beyond that size the use of surface broadcast with incorporation and/or injection increased. For improving water quality, encouraging injection methods or at least light tillage for incorporation of manure into the soil could aid in benefiting P losses from cropland following application, particularly those near surface waters.
Regular application of manure and application of manure during the winter is not recommended. Thus, having manure storage is important for reducing manure applications. A total of 35% of facilities did not have manure storage, Table S4, which were primarily smaller facilities. The most common manure storage was concrete, which generally has low permeability and reduces potential impact to groundwater through leaching. Encouraging manure storage is an important way to reduce impacts from manure application, particularly during winter months. During the winter there are no growing crops to use the nutrients in the manure at that time and nutrient losses are often high as the manure applied cannot penetrate the frozen ground and can then be lost during snowmelt. Studies have estimated that winter manure application can result in P losses 2.5 to 3.6 higher than when applied in non-winter months [33,34]. However, it should be noted that selective use of winter manure applications on some fields that have little to no probability of causing runoff to waterways and may not impact water quality, although reducing the practice generally leads to improved water quality outcomes. As farm size increases winter manure applications decrease, Figure S10, however this is generally expected as permitted facilities in WI cannot apply manure in the winter [35]. It should be noted that while the very small farms have more manure applications, the maximum total animal units of all the respondents (19 very small farms x 35 max animal units = 665) which is equivalent to one large farm. So, while all farms should try to integrate specific practices, the impact may be larger if you target increased implementation on larger farms or in fields with proximity to surface water.
When land applying manure, the use of setbacks (maintaining a recommended distance from the area of application to the edge of the surface water) can reduce the potential for manure constituents to move from the field to the surface water. The US EPA outline a 30 m setback from any surface water located down the gradient from the area of application if the manure is not incorporated or injected into the soil [36]. While there is good participation in this practice, Figure S9, this is easily implemented at all farms and attempts should be made to increase participation in this area as manure applied very close to surface water has high potential for impact. If a reduction in the setback is of interest to increase the area of manure application, a 10 m buffer strip can be constructed [36] for similar effects. Studies have found that buffer strips can reduce sediment transport up to 75%, and nutrients up to 50% [37,38,39,40]. A majority of large (56%) and CAFO (75%) facilities reported utilizing buffer strips, Figure S9, which is a promising sign for improving this conservation practice. However, a minority of medium (36%), small (27%), and very small (5%) facilities used buffer strips, thus increasing efforts at incentivizing this practice at facility with lower AUs may be important next steps for improving water quality.
Nutrient management planning is the tracking and management of nutrients throughout a farm [35]. The general idea is to account for all the sources of nutrients on a farm and then manage the nutrients during application to increase crop yields and reduce losses to the environment, particularly to reduce edge of field losses which can then move to surface water. There are many practices that can be adapted to aid in proper nutrient application including soil and manure sampling and analysis, using recommended application rates, and having and following a written nutrient management plan. Permitted CAFO facilities in WI are required to follow all these practices [35], thus it is concerning that some CAFO facilities did not report using these practices, Figure 6. Overall, there was low participation in these practices among respondents compared to other impact categories investigated, highlighting a need for further development and potentially incentivizing practices. Particularly it should be noted that large, medium, small, and very small facilities should be encouraged to increase soil and manure testing, and follow recommended nutrient application rates following guidelines, such as A2809 [41].

4.3. Water Quantity

Water conservation is critical to reduce the water demand and increase sustainability. Drinking water is the primary water use for swine facilities, composing 80% of the water used [42,43,44]. Therefore, reducing wastage from these systems is a useful practice to reduce water demands. The conventional method for animal drinkers is using nipple drinkers, as they provide a continuous flow of fresh water and do not require as much maintenance/cleaning as other methods [45]. However, this style of drinker is prone to wastage due to a variety of reasons (spillage due to improper height/flow, accidental flow due to animals leaning against the nipple, animals knowingly manipulating nipples for cooling purposes) [43]. These losses can be mitigated by active management of nipple or use of other practices.
The importance of managing nipple height and flow has been reported in different studies. One study found that by reducing nipple water flow rate and setting the height of the nipple drinker to 50 mm (~2 inches) above shoulder height of the smallest animal in the pen, water waste could be reduced by 16% [46]. As a result of that and other studies, multiple recommendations for nipple height and flow are given for different stages of swine production [45]. Managing nipple height and flow was the most common water use practice used at WI facilities, as 58% of facilities indicated using this practice, which was more common as facility size increased, Figure 8. A common reason why nipple height is not managed is due to labor requirements for adjusting drinkers. To reduce time, producers can utilize swinging water drinkers that can be easily adjusted for swine stage. An added benefit is when leaned against, swinging drinkers are less likely to result in wastage compared to mounted, as they will swing away from the pig. Implementation of swinging drinkers has reportedly reduced water usage by 11% compared to conventional mounted nipple drinkers [43]. The survey indicated 20% of producers used swinging drinkers at their facility and the fraction of facilities increased as operation size increased, Figure 8.
Instead of standard nipples, a bite ball or arato nipple can be used. These types of nipples require the animals to insert the nipple deeper into the mouth before water can be dispensed, thus reducing waste. Studies have found that this style of drinkers can reduce water use by 8 to 22% [43]. Producers have claimed up to a 35% water use decrease from bite ball drinkers [47]. However, other studies have found that if conventional nipples are managed properly (i.e., manage height and flow rate), there is not a significant difference between the two [48]. Thirty percent of facilities reported using this style of drinker, Figure 8. Cup and bowl drinkers are considered to be the most efficient drinker for reducing water use. They are designed to reduce water loss, as all water that may otherwise be wasted is collected in a cup/bowl. There are different types of mechanisms used for filling the bowl depending upon the design. Some systems are equipped with nipples or levers that fill when an animal is drinking, while others have floats that fill the bowl or cup when level is low. Cup and bowl drinkers have been reported to reduce water losses by 20 to 60% compared to conventional nipples [42,49,50]. One common concern for the use of cup/bowl drinkers is contamination, but studies have not found evidence of this influencing animal growth [42]. This management practice was the second most common in the survey, as 39% of facilities reported using them, and was typically more common as facility size increased, Figure 8.
Wet/dry feeders is a system where dry feed and water are mixed into the same trough. The idea to reduce water waste is similar to cup/bowl drinkers, in which water that would have otherwise wasted in a nipple system would be collected in the trough. Wet/dry feeders have been reported to reduce water use by 20% to 40% compared to conventional nipple drinkers [44]. Overall, the survey indicated that producers implemented a large number of water savings techniques, indicating this is an area of strength for the industry.
Additionally, facility practices can aid in reducing water consumption. Facility washing accounts for 7% of water consumption at swine facilities [43]. A simple way to reduce washing water consumption is the implementation of pressure washers. Pressure washers use less water, require less pre-soaking, and reduce the time required for cleaning [42]. Pressure washers were used a 51% of facilities, with 100% of CAFOs reporting utilizing pressure washers, Figure S12. Additionally, actively metering water consumption can reduce usage by quickly identify leaks and provide data on where water use could be reduced. Only 25% of all facilities reported actively monitoring water usage, Figure S12, and is an area that could be improved in the swine industry for all classifications of farms. Annual water audits could also allow facilities to determine baseline water usage. Only 6% of all facilities reported conducting annual water audits.

4.4. Air Quality

Air quality is important at livestock facilities for both human and animal health and environmental sustainability. Manure produced from livestock releases emissions, such as H2S, NH3, and GHG. Exposure to these gases can be toxic at high concentrations. Literature of H2S concentration in swine facilities are reported to range from 0 to 97 ppm [51], which are higher than other livestock (poultry, dairy, beef). This is due to the use of slatted floors and under-barn storage, which 58% of respondents reported using, Figure 3. If a facility is not managed properly, the manure storage can emit high levels of H2S, but proper ventilation can greatly enhance the air quality inside swine facilities. Also NH3 can be extremely irritating to the eyes, respiratory tract, and other mucous membranes and can be lethal at concentrations of 2500 ppm and higher [52]. Odorless and colorless CO2 and CH4 have the potential to displace oxygen in confined spaces resulting in conditions that can cause asphyxiation. The risks for humans and animals are greater in conditions where gas dispersion is impeded such as in a confined space, often observed at swine facilities. Manure management is one of the major contributors to GHG emissions in a swine facility right after crop production, depending on the adopted management practices. Utilizing pit ventilation or controlled atmosphere and mechanical ventilation can greatly reduce the risk from under barn storage. Of the 26 facilities utilizing under barn storage, Figure 4, pit ventilation and mechanical ventilation was reported at 58 and 85% of facilities, Figure 2, respectively. The fact that some of these facilities reported still using natural ventilation with under-barn storage is concerning, and outreach to stakeholders regarding the health hazards should be a priority for future outreach.
The number of air exchanges in a facility is equally as important. Risk of exposure to H2S and NH3 is different depending on the type of animal housing facility used. For instance, outdoor lots, pastures, and hoop housing will have a significantly lower concentration than confined housing spaces [53]. Facilities using confined animal housing must ensure proper ventilation to reduce the risk for H2S exposure. The survey indicated that the median approximate number of air exchanges per hour was 10 for facilities using mechanical ventilation, indicating that most facilities with under barn storage had sufficient air exchanges. However, NH3 emissions are directly related to wind speed, so, these emissions could be higher in facilities with ventilation systems. Heber et al. [54] showed that increasing the air change rate from 2 to 4 air changes per hour increased the quantity of NH3 released from 250 to 350 mg/h.
The type of manure also has a major role on emissions. For example, NH3 and CH4 emissions have been noted to increase during manure storage with more liquid manure since such conditions are more favorable for bacterial growth. Slurry is especially susceptible to CH4 losses when the storage conditions become anaerobic, which happens in the absence of an organic crust on top of the storage. Nearly all operations with more than 300 animal units reported handling liquid or slurry manure, whereas 84% of farms with less than 35 animal units handled mostly solid manure. Solid manure on the contrary, is less susceptible to NH3 and CH4 emissions, but is more susceptible to N2O emissions. Solid manure has a mix of both aerobic and anaerobic conditions which is ideal for the formation of N2O. Manure storage covers can aid in reducing CH4 and NH3 emissions [55], but only 25% of facilities utilized covers, Table S4. Manure processing, such as anaerobic digestion, solid-liquid separation, and composting are options to reduce emissions while adding value to the manure stream. Aguirre-Villegas et al. [56] found more than 40% and 20% GHG emission reductions with anaerobic digestion and solid-liquid separation. However, anaerobic digestion and composting can increase NH3 emissions during storage and composting processing itself due to the high temperatures and the aeration process. Only 11% of facilities reported using anaerobic digestion for manure processing. All facilities utilizing anaerobic digestion had greater than 70 animal units and was most persistent at CAFO operations, likely due to high capital cost of anaerobic digestion systems. Solid liquid separation is a more economical option for manure processing [9], but was only reported at one facility. Promoting integration of solid liquid separation at WI swine facilities may be beneficial to decrease GHG emissions. Additionally, promoting anaerobic digestion at larger facilities that could also aid in improving air quality at swine facilities. Composting of manure was utilized at 27% of facilities, Table S5, and it was more common at smaller facilities, likely due to smaller facilities typically handling solid manure rather than slurry or liquid manure.
Manure application method can significantly influence N based emissions impacting air quality [57,58,59]. If manure is not rapidly incorporated or injected, nearly 30% of ammoniacal N could be lost through volatilization as NH3. The survey indicated that 66% of facilities applied at least a portion of their manure through surface broadcast without incorporation, Figure 5. Generally, this decreased as farm facility size increased as over 90% of very small facilities indicated using surface broadcast without incorporation. To improve air quality related to volatilization, future outreach should focus on promoting incorporation of manure after surface application or utilizing injection practices. The survey indicated that injection was primarily used at lager facilities, potentially due to capital and equipment needs for the application practice.

4.5. Traffic

Generally larger facilities reported a higher volume of traffic due to feed, animal transport, and manure hauling. Conventional manure transport via spreaders/tankers or trucks will add to traffic around the facility. In some facilities that incorporate manure storage, the manure is hauled most in the fall and/or spring over a short duration. Those facilities without manure storage (or with short term storage capacity) will haul manure more frequently over the course of the year, up to once per day. One way to reduce traffic is to use alternative manure hauling methods to conventional tractors with manure spreaders. In Michigan, Harrigan [60,61] reported that by implementing truck tankers rather than conventional tractor manure spreaders, producers could not only reduce traffic, but reduce operating cost for manure application. This survey indicated that large and CAFO facilities were more likely to use trucks to transport manure. Encouraging facilities to utilize truck transport rather than tractor has the potential to reduce traffic around facilities during manure hauling season, reduce operating cost, and increase travel distance for manure application [60].
An additional way to reduce traffic from manure transport is to utilize pumping lines for liquid manure rather than tractors or trucks [62]. The survey indicated 25% of the facilities reported using pumping (either permanent or non-permanent) to transport manure, Figure 9, eliminating manure transport via roadways. This was predominantly done at larger and CAFO facilities, potentially due to cost, but also the higher likelihood of handling liquid or slurry manure. While for smaller facilities it is likely not feasible for investment in truck or pumping manure transport methods, large facilities could reduce traffic nuisance by transitioning away from traditional tractor transport to truck or pumping methods.

4.6. Noise

Numerous studies have documented that noise form swine facilities can be nuisances due to animals and also equipment [63,64,65,66]. This can be a nuisance to neighboring communities and also an occupational hazard. Equipment is a recognized source of noise in the swine industry [66]. For WI swine producers only 17% reported actively trying to reduce noise from equipment, Figure S13, which is an area that could be improved in the industry. Within confined facilities noise can be of particular concern due to its occupational hazard [65], thus management of facility equipment and incorporation of low noise fans can improve conditions. The survey indicated that 29% of facilities actively managed facility equipment to reduce noise, which was more pronounced at larger facilities. Low noise fans were only implemented at 15% of responding facilities. Animal feeding can result in noise which can be of nuisance to neighbors [65], but none of the facilities reported receiving any noise complaints from the community. This may be because many facilities (42%) took measures to reduce noise associated with feeding by feeding at specific times. While none of the facilities reported noise complaints, there are areas in which producers could improve noise management, particularly for occupational safety, by incorporating facility practices such as management of facility equipment and incorporation of low noise fans.

5. Conclusions

The survey provides current data on the state of the pork industry in terms of their facility design and management practices. Facilities also reported different practices and strategies to address odor, water quality, water quantity, air quality, noise, and traffic. Overall, pork producers report implementing at least one practice to reduce impact from the six different categories. Larger farms are thought to present a greater environmental risk in many of these areas due to the larger number of animals and associated manure and other inputs and output from the system. However, for those assessed, as facility operation increased in AUs the facility generally increased management practices to address those risks. We cannot verify whether the risk is reduced due to those practices, however it is important to note that these facilities reported implementing more structural, operational and management strategies than smaller facilities.
Many producers integrated strategies to reduce odor and that was reflected in the low number of odor complaints reported. Interestingly, the computed odor scores could predict those that received complaints and may be an effective tool in siting and operating facilities to reduce odor impacts to the surrounding community. Measures to improves air quality within facilities were common, which is important for human and animal health. Many facilities used controlled atmosphere housing, which greatly reduces potential air quality hazards. The median air exchanges within facilities was 10 per hour. A majority of facilities utilized mechanical ventilation to ensure air quality, and almost all facilities with under barn storage used pit ventilation to ensure potentially fatal concentration of manure gases did not reach the animal level within the facility.
While many swine producers had implemented at least one water quality practice, 87%, there were significant areas for improvement, particularly in smaller facilities. This includes the method of manure application at facilities with less than 300 animal units. Most of these facilities indicated using surface broadcast without incorporation application method and indicated application during winter months, both of which can contribute to nutrient rich runoff resulting in consequential implications for water quality. Additionally, educating smaller facilities regarding the benefits of using setbacks and implementing a nutrient management plan would help protect water quality.
Water quantity practices were implemented at 83% of facilities, which suggests an industry standard to implement water saving practices. However, like water quality, it was not uncommon for facilities under 300 animal units to have no practices in place and additional education and resources may aid in increasing awareness and implementation at smaller facilities, particularly for water reduction practices related to drinkers. Ideally to reduce water waste, more facilities would be actively managing water usage and conducting annual water audits to identify areas where improvement could be made at facilities of all sizes.

Supplementary Materials

The following are available online at https://www.mdpi.com/2071-1050/12/11/4536/s1, Table S1: Farm classification based on animal units and number of participating facilities responding to survey; Table S2: Animal capacity, weight, facility area, animal density, date of construction, date of most recent facility update, and number of barns based on animal stage; Table S3: Animal stages kept at facilities based on classification; Table S4: Manure storage, covered storage, and annual inspection by farm size; Table S5: Manure processing practices at facilities; Table S6: Implementation of water quality management practices at WI pork production operations; Table S7: Operations reporting odor complaints and if action was taken to address complaints; Table S8: Odor management practices; Table S9: Monthly truck data mean, median, min, and max of survey data; Table S10: Noise management practices; Figure S1: Fraction of respondents by farm size for whom pork production is the main source of income, are members of the Wisconsin Pork Producers Association, and participate in the pork quality assurance program; Figure S2: Number of animal stages kept at different classified facilities; Figure S3: Fraction of facilities that have been updated based on year of initial construction for (A) nursery [n = 37], (B) growing [n = 36], (C) finishing [n = 44], and (D) breeding [n = 36] stage facilities; Figure S4: Type of housing used at facilities based on year of most recent facility update (A) nursery [n = 37], (B) growing [n = 34], (C) finishing [n = 43], and (D) breeding [n = 34] facilities; Figure S5: Box and whisker plot of animal density (m2/animal) for different swine stages. The horizontal line within the box indicates the median, boundaries of the box indicate the 25th and 75th percentile, the whiskers indicate the min and max values, ● is the mean, and X indicates outliers; Figure S6: Animal density (m2/animal) by farm size for (A) nursery [n = 34], (B) growing [n = 33], (C) finishing [n = 42], and (D) breeding [n = 30] facilities, Figure S7: Animal density (m2/animal) by housing type for (A) nursery [n = 34], (B) growing [n = 30], (C) finishing [n = 40], and (D) breeding [n = 29] facilities; Figure S8: Animal density (m2/animal) by year of most recent update for (A) nursery [n = 31], (B) growing [n = 27], (C) finishing [n = 37], and (D) breeding [n = 27] facilities; Figure S9: Fraction of farms using buffer strips, setbacks, and limiting animal access to waterways; Figure S10: Facilities reporting whether they apply manure on weekend or holidays; Figure S11: Number of water quantity practices (including drinker management/method, water audit, water metering, pressure washing, and water recycle) used at facilities by farm size; Figure S12: Facility water management methods by farm size, Figure S13: Noise management methods by farm size; Figure S14: Odor scores for livestock facilities in relation to animal units present at facility and distance to neighbors.

Author Contributions

J.R.S. contributed to the methodology and conceptualization and completed the formal analysis and writing of the original draft preparation. H.A.A.-V. contributed to the methodology and analysis methods, writing—review, and editing. R.A.L. contributed to the conceptualization, methodology, writing—review and editing, supervision, project administration, and funding acquisition. All authors have read and agreed to the published version of the manuscript.

Funding

This work was funded by the Wisconsin Pork Producers Association.

Acknowledgments

Authors would like to thank the Wisconsin Pork Producers Association for funding the survey and providing contact information of Wisconsin pork producers. Additionally, authors would like to thank Jenna Walsh and Hui Wang for assisting with survey administration.

Conflicts of Interest

The authors declare no conflict of interest.

Appendix A

Pork Producers Survey
UNIVERSITY OF WISCONSIN-MADISON
Research Participant Information
Title of the Study: Understanding Practices Integrated at Pork Facilities in Wisconsin
Principal Investigator: Rebecca Larson.
Phone: (608)890-3171.
Co-Investigator: Horacio Aguirre-Villegas.
Phone: (608)-262-9703.
Student Researcher: Jenna Walsh
DESCRIPTION OF THE RESEARCH
You are invited to participate in a research study to identify pork production that are used on Wisconsin farms. You have been asked by Wisconsin Pork Producers to participate as an owner or manager of a pork operation in Wisconsin. This information will help researchers and educators develop training and education materials to address issues facing the pork industry including odor, noise, air quality, water quality, and traffic. This study will include approximately all pork facilities with membership in the Wisconsin Pork Producers Association. You can complete the survey in the location of your choosing.
WHAT WILL MY PARTICIPATION INVOLVE?
If you decide to participate in this research, you will be asked to complete one survey which will require approximately 15 minutes to complete. This survey will cover questions about your facility, manure management system, traffic, environmental practices, feed, and facility design.
ARE THERE ANY RISKS TO ME?
We do not anticipate any risks resulting from participation in this study.
ARE THERE ANY BENEFITS TO ME?
Although there are no immediate benefits from this study, the information will facilitate research and educational materials.
HOW WILL MY CONFIDENTIALITY BE PROTECTED?
THIS STUDY IS COMPLETELY ANONYMOUS. Neither your name nor any other identifiable information will be recorded.
WHOM SHOULD I CONTACT IF I HAVE QUESTIONS?
You may ask any questions about the research at any time. If you have questions about the research during or after completing the survey please feel free to contact any of the researchers listed above. If you are not satisfied with the response of the research team, have more questions, or want to talk with someone about your rights as a research participant, you should contact the University of Wisconsin Education Research and Social & Behavioral Science IRB Office at 608-263-2320. Your participation is completely voluntary. If you decide not to participate or to withdraw from the study it will have no effect on any services or treatment you are currently receiving.
  • Please select “Yes” below if you consent to complete the following survey and understand your answers will be used as data in manure management research. Select “No” to opt-out and end the survey.
    Yes
    No
If No Is Selected, Then Skip to End of Survey
  • Which of these stages of pork production take place on your farm? (Select all that apply.)
    Nursery
    Growing
    Finishing
    Breeding/Gestation
  • Please share related information on the animal stages you indicated in question 1. * Note: To answer questions on “Year of Most Recent Facility Update”, note that facility updates mean changes to facility layout, addition of new buildings, change in ventilation, addition of manure storage, etc.
Number of AnimalsAverage Weight (lbs)Predominant Facility Housing TypeNumber of FacilitiesTotal Combined Area Of All Facilities (Square ft)Year of Initial ConstructionYear of Most Recent Facility Update *Duration Animals Remain In Facility (Months)
Controlled AtmosphereOpen sidedCurtain sidedHoop houseOutdoor lotPasture
Nursery
Growing
Finishing
Breeding/Gestation
3. Please provide details about the controlled atmosphere housing facilities on your farm.
Number of Air Exchanges Per Hour
Nursery
Growing
Finishing
Breeding/Gestation
4.
Do you heat your controlled atmosphere or hoop house housing facilities?
Yes
No
5.
Which, if any, of the following cooling systems do you use to cool your facility and/or animals? (Select all that apply.)
I cool my facility using ventilation
I cool my animals using misters
I do not cool my facility/animals
6.
What is the animal density (approximately), in square feet allotted per animal, on your farm for each of the following options?
Animal Density (Square Feet Allotted Per Animal)
Nursery
Growing
Finishing
Breeding/Gestation
7. What is the diet composition of the feed? Is it is grown on farm or purchased? (Select all that apply.)
Select All that ApplySelect Whether the Feed is Grown on Farm or Purchased Using the Drop Down Menu
Grown on farmPurchased
Corn
Dry Distillers Grains
Soybean Meal
Other Protein Source
Other; please specify
8. What is your farm’s annual energy use (approximately)?
Energy SourceAnnual Use
Electricity (kWhr)
Gasoline (gallons)
Diesel (gallons)
Propane (gallons)
Natural gas (cubic ft)
9.
Is your manure:
Liquid
Slurry
Solid
10.
What, if any, manure collection methods do you use? (Select all that apply.)
Slatted floor
Flush alley
Gutter flush system
Scrape system
Pull Plug Gutter
No collection
Other; please specify ____________________
11.
Do you have manure storage?
Yes
No
Answer If 11. Do you have manure storage? Yes Is Selected
12. What type of manure storage do you have? (Select all that apply.)
Earthen basin
Clay lined
Plastic lined
Concrete
Glass-lined Steel
Under barn storage
Other; please specify ____________________
Answer If 11. Do you have manure storage? Yes Is Selected
13. What volume of manure do you store? (approximately)
______
Answer If 11. Do you have manure storage? Yes Is Selected
14. Do you cover your manure storage?
Yes
No
Answer If 11. Do you have manure storage? Yes Is Selected
15. How many times a year do you empty your manure storage (approximately)?
______
Answer If 11. Do you have manure storage? Yes Is Selected
16.
Do you perform annual inspections and maintenance on your manure storage?
Yes
No
23.
Please indicate which of the following manure storage and processing practices are integrated at your facility. (Select all that apply)
Acidification
Aeration
Anaerobic digestion
Composting
Digestion
Impermeable covers
Manure additives
Nutrient recovery
Permeable covers
Solids separation
Urine/feces segregation
Advanced treatment; please specify ____________________
I do not process manure
18.
Please indicate the percentage of manure (approximate) transferred to field using each of the following methods.
Manure Transferred to Field in %
Tractor & Tanker
Semi-truck
Pump non-permanent line
Pump permanent line
Other; please specify
19. Please indicate the percentage of manure (approximate) applied using each of the following manure application methods.
Manure Applied in %
Irrigation
Surface application, no incorporation
Surface application with incorporation
Injection
20. How many acres on your farm are available for manure application? (approximately)
______
21. What is your manure application rate? (approximately)
Manure Application Rate (in Gallons/Acre)
Maximum manure application rate
Average manure application rate
Minimum manure application rate
22. What is the average percent total solids of your manure? (approximately)
______
39.
Do you apply manure on the weekends and holidays?
Yes
No
24. What is your annual water usage in gallons per month? (approximately)
______
25. What percent of the annual water usage is used for each of the two following categories? (approximately)
% of Annual Water Use
Facility/Farmstead
Irrigation
26. Which, if any, of the following water reduction practices do you use? (Select all that apply.)
Conducted a water audit
Actively metering water use (for evaluation and leak monitoring)
Swinging nipple drinkers (drinking water savings)
Managing nipple height and flowrate (drinking water savings)
Bite style or arato style nipple drinkers (drinking water savings)
Cup or bowl drinkers (drinking water savings)
Wet/dry feeders (drinking water savings)
Pressure washers
Water recycle
Other; please specify ____________________
I do not use any water reduction practices
27. Provide an estimate of recycle volume in gallons per month
______
28.
Briefly describe the water recycle system you use.
28.
Which, if any, of these practices do you use to reduce impact to water quality?
No winter manure application
Buffer strips on croplands adjacent to waterways
No animals in waterways
Use setbacks when applying manure to fields
Nutrient management plan
Perform manure analysis for each manure application event
Use recommended nutrient application rates (from A2809 or similar)
Collect farmstead runoff (or no production due to environmentally controlled facility)
None of the above
Other; please specify ____________________
29.
Please indicate which, if any, of the following practices you use to reduce odor or air quality impacts. (Select all that apply.)
Physical barriers (e.g., trees)
Biofilters
Chimneys
Diet manipulation
Electrostatic precipitation
Oil sprinkling
Pit ventilation
Scrubbers
Siting (location of facility or facility components)
Urine/feces segregation
UV light
None of the above
Other; please specify ____________________
30.
How many trucks per month are used for each of the following non-cropping activities? (approximately)
Number of Trucks Per Month
Feed (purchased off-farm)
Animal transport
Mortality removal
Other; please specify
31. What is the approximate distance from your facility location to your nearest neighbor? (in miles). (approximately)
______
32. Approximately, what is the shortest distance from your facility to a property line (in ft)?
______
33.
Which, if any, of these practices do you use to manage noise in your facilities?? (Select all that apply)
Incorporate low noise fans
Feed all animals at once or attempt to reduce the feeding time
Actively try to reduce the noise from tractors/equipment
Actively maintain facility equipment to reduce noise
None of the above
Other; please specify ____________________
34.
Have you had any noise complaints?
Yes
No
35.
Did you alter your practices in response to noise complaints?
Yes; if so, how? Please elaborate. ____________________
No
Answer If 29. Please indicate which, if any, of the following practices you use to reduce odor or air quali... Biofilters Is Selected or 29. Please indicate which, if any, of the following practices you use to reduce odor or air quali... Scrubbers Is Selected or 29. Please indicate which, if any, of the following practices you use to reduce odor or air quali... UV light Is Selected
36. What percent of air from your facility do you treat? (approximately)
______
Answer If 40. Have you had any odor complaints?<o:p></o:p> Is Selected
37. What system do you have for pit ventilation?
Answer If 41.&nbsp;Did you alter your practices in response to odor complaints? Is Selected
38. How long does the pit ventilation system run?
______
40. Have you had any odor complaints?
Yes
No
Answer If 54. Have you had any odor complaints?<o:p></o:p> Yes Is Selected
41.
Did you alter your practices in response to odor complaints?
Yes; if so, how? Please elaborate. ____________________
No

References

  1. Council, N.P.P. Pork Facts. Available online: https://nppc.org/pork-facts/ (accessed on 3 May 2020).
  2. Thoma, G.; Nutter, D.; Ulrich, R.; Charles, M.; Frank, J.; East, C. National Life Cycle Carbon Footprint Study for Production of US Swine; National Pork Board: Des Moines, IA, USA, 2011.
  3. Thoma, G.; Matlock, M.; Putman, B.; Burek, J. A Life Cycle Analysis of Land Use in US Pork Production; National Pork Board: Des Moines, IA, USA, 2015.
  4. Maurer, D.L.; Koziel, J.A.; Harmon, J.D.; Hoff, S.J.; Rieck-Hinz, A.M.; Andersen, D.S. Summary of performance data for technologies to control gaseous, odor, and particulate emissions from livestock operations: Air management practices assessment tool (AMPAT). Data Brief 2016, 7, 1413–1429. [Google Scholar] [CrossRef] [PubMed] [Green Version]
  5. Thoma, G.; Boles, P.E.E.; Leh, M.; Sandefur, H.; Bautista, R.; Ulrich, P.E.R. A Life Cycle Analysis of Water Use in US Pork Production; National Pork Board: Des Moines, IA, USA, 2011.
  6. Stone, J.J.; Dollarhide, C.R.; Jinka, R.; Thaler, R.C.; Hostetler, C.E.; Clay, D.E. Life cycle assessment of a modern northern great plains U.S. swine production facility. Environ. Eng. Sci. 2010, 27, 1009–1018. [Google Scholar] [CrossRef]
  7. Cherubini, E.; Zanghelini, G.M.; Alvarenga, R.A.F.; Franco, D.; Soares, S.R. Life cycle assessment of swine production in Brazil: A comparison of four manure management systems. J. Clean. Prod. 2015, 87, 68–77. [Google Scholar] [CrossRef]
  8. Koger, J.B.; O’Brien, B.K.; Burnette, R.P.; Kai, P.; van Kempen, M.H.J.G.; van Heugten, E.; van Kempen, T.A.T.G. Manure belts for harvesting urine and feces separately and improving air quality in swine facilities. Livest. Sci. 2014, 162, 214–222. [Google Scholar] [CrossRef]
  9. Aguirre-Villegas, H.A.; Larson, R.A. Evaluating greenhouse gas emissions from dairy manure management practices using survey data and lifecycle tools. J. Clean. Prod. 2017, 143, 169–179. [Google Scholar] [CrossRef]
  10. Boyd, G.; Cady, R.; Wittig, L.; Bryan, G.; Anderson, D.; Sutton, A.; Holden, P. A 50-Year Comparison of the Carbon Footprint and Resource Use of the US Swine Herd: 1959–2009; National Pork Board: Des Moines, IA, USA, 2012.
  11. Lory, J.A.; Massey, R.E.; Zulovich, J.M.; Hoehne, J.A.; Schmidt, A.M.; Carlson, M.S.; Fulhage, C.D. An assessment of nitrogen-based manure application rates on 39 U.S. swine operations. J. Environ. Qual. 2004, 33, 1106–1113. [Google Scholar] [CrossRef]
  12. Zhong, J.; Wei, Y.; Wan, H.; Wu, Y.; Zheng, J.; Han, S.; Zheng, B. Greenhouse gas emission from the total process of swine manure composting and land application of compost. Atmos. Environ. 2013, 81, 348–355. [Google Scholar] [CrossRef]
  13. Godbout, S.; Lemay, S.P.; Duchaine, C.; Pelletier, F.; Larouche, J.-P.; Belzile, M.; Feddes, J.J.R. Swine production impact on residential ambient air quality. J. Agromed. 2009, 14, 291–298. [Google Scholar] [CrossRef]
  14. Liu, Z.; Powers, W.; Murphy, J.; Maghirang, R. Ammonia and hydrogen sulfide emissions from swine production facilities in North America: A meta-analysis. J. Anim. Sci. 2014, 92, 1656–1665. [Google Scholar] [CrossRef] [Green Version]
  15. Burkholder, J.; Libra, B.; Weyer, P.; Heathcote, S.; Kolpin, D.; Thorne, P.S.; Wichman, M. Impacts of waste from concentrated animal feeding operations on water quality. Environ. Health Perspect. 2007, 115, 308–312. [Google Scholar] [CrossRef] [Green Version]
  16. Riaño, B.; García-González, M.C. Greenhouse gas emissions of an on-farm swine manure treatment plant—Comparison with conventional storage in anaerobic tanks. J. Clean. Prod. 2015, 103, 542–548. [Google Scholar] [CrossRef]
  17. Pote, D.H.; Reed, B.A.; Daniel, T.C.; Nichols, D.J.; Moore, J.; Edwards, D.R.; Formica, S. Water-quality effects of infiltration rate and manure application rate for soils receiving swine manure. J. Soil Water Conserv. 2001, 56, 32–37. [Google Scholar]
  18. Xian, Q.; Hu, L.; Chen, H.; Chang, Z.; Zou, H. Removal of nutrients and veterinary antibiotics from swine wastewater by a constructed macrophyte floating bed system. J. Environ. Manag. 2010, 91, 2657–2661. [Google Scholar] [CrossRef] [PubMed]
  19. Daverede, I.C.; Kravchenko, A.N.; Hoeft, R.G.; Nafziger, E.D.; Bullock, D.G.; Warren, J.J.; Gonzini, L.C. Phosphorus runoff from incorporated and surface-applied liquid swine manure and phosphorus fertilizer. J. Environ. Qual. 2004, 33, 1535–1544. [Google Scholar] [CrossRef]
  20. Jacobson, L.D.; Guo, H.; Schmidt, D.R.; Nicolai, R.E.; Zhu, J.; Janni, K.A. Development of the offset model for determination of odor-annoyance-free setback distances from animal production sites: Part I. Review and experiment. Trans. ASAE 2005, 48, 2259–2268. [Google Scholar] [CrossRef]
  21. Guo, H.; Jacobson, L.D.; Schmidt, D.R.; Nicolai, R.E.; Zhu, J.; Janni, K.A. Development of the offset model for determination of odor-annoyance-free setback distances from animal production sites: Part II. Model development and evaluations. Trans. ASAE 2005, 48, 2269–2276. [Google Scholar] [CrossRef]
  22. DATCP. Livestock Facility Siting; DATCP: Madison, WI, USA, 2017; pp. 390:1–390:10.
  23. Shaughnessy, P.T.O.; Altmaier, R. Use of AERMOD to determine a hydrogen sul fi de emission factor for swine operations by inverse modeling. Atmos. Environ. 2011, 45, 4617–4625. [Google Scholar] [CrossRef] [Green Version]
  24. Sheridan, B.A.; Hayes, E.T.; Curran, T.P.; Dodd, V.A. A dispersion modelling approach to determining the odour impact of intensive pig production units in Ireland. Bioresour. Technol. 2004, 91, 145–152. [Google Scholar] [CrossRef]
  25. Tyndall, J.; Colletti, J. Mitigating swine odor with strategically designed shelterbelt systems: A review. Agroforest Syst. 2007, 69, 45–65. [Google Scholar] [CrossRef]
  26. Nimmermark, S.A.; Jacobson, L.D.; Schmidt, D.R.; Gay, S.W.; Nimmermark, S.A.; Jacobson, L.D.; Schmidt, D.R.; Gay, S.W.; Nimmermark, S.A.; Jacobson, L.D.; et al. Predictions by the Odor From Feedlots, Setback Estimation Tool (OFFSET) compared with observations by neighborhood monitors. J. Air Waste Manag. Assoc. ISSN 2005, 55, 1306–1314. [Google Scholar] [CrossRef]
  27. Yu, Z.; Guo, H.; Yu, Z.; Guo, H. Determination of setback distances for livestock operations using a new Livestock Odor Dispersion Model (LODM). J. Air Waste Manag. Assoc. ISSN 2011, 61, 1369–1381. [Google Scholar] [CrossRef] [PubMed]
  28. King, T.; Schoenau, J.; Elliott, J. Relationship between manure management application practices and phosphorus and nitrogen export in snowmelt run-off water from a black chernozem saskatchewan soil. Sustain. Agric. Res. 2017, 6, 93–114. [Google Scholar] [CrossRef] [Green Version]
  29. Ball Coelho, B.R.; Roy, R.C.; Topp, E.; Lapen, D.R. Tile water quality following liquid swine manure application into standing corn. J. Environ. Qual. 2007, 36, 580–587. [Google Scholar] [CrossRef] [PubMed] [Green Version]
  30. Tomer, M.D.; Moorman, T.B.; Kovar, J.L.; Cole, K.J.; Nichols, D.J. Eleven years of runoff and phosphorus losses from two fields with and without manure application, Iowa, USA. Agric. Water Manag. 2016, 168, 104–111. [Google Scholar] [CrossRef] [Green Version]
  31. Jokela, W.; Sherman, J.; Cavadini, J. Nutrient runoff losses from liquid dairy manure applied with low-disturbance methods. J. Environ. Qual. 2016, 45, 1672–1679. [Google Scholar] [CrossRef] [PubMed]
  32. Dell, C.J.; Kleinman, P.J.A.; Schmidt, J.P.; Beegle, D.B. Low-disturbance manure incorporation effects on ammonia and nitrate loss. J. Environ. Qual. 2012, 41, 928–937. [Google Scholar] [CrossRef]
  33. Vadas, P.A.; Good, L.W.; Jokela, W.E.; Karthikeyan, K.G.; Arriaga, F.J.; Stock, M. Quantifying the impact of seasonal and short-term manure application decisions on phosphorus loss in surface runoff. J. Environ. Qual. 2017, 46, 1395–1402. [Google Scholar] [CrossRef] [Green Version]
  34. Liu, J.; Veith, T.L.; Collick, A.S.; Kleinman, P.J.A.; Beegle, D.B.; Bryant, R.B. Seasonal manure application timing and storage effects on field- and watershed-level phosphorus losses. J. Environ. Qual. 2017, 46, 1403–1412. [Google Scholar] [CrossRef]
  35. USDA-NRCS. Conservation Practice Code 590—Nutrient Management; USDA-NRCS: Washington, DC, USA, 2015.
  36. USEPA. NPDES Permit Writers’ Manual for Concentrated Animal Feeding Operations; USEPA: Washington, DC, USA, 2012.
  37. Borin, M.; Passoni, M.; Thiene, M.; Tempesta, T. Multiple functions of buffer strips in farming areas. Eur. J. Agron. 2010, 32, 103–111. [Google Scholar] [CrossRef]
  38. Dunn, A.M.; Julien, G.; Ernst, W.R.; Cook, A.; Doe, K.G.; Jackman, P.M. Evaluation of buffer zone effectiveness in mitigating the risks associated with agricultural runoff in Prince Edward Island. Sci. Total Environ. 2011, 409, 868–882. [Google Scholar] [CrossRef]
  39. NRCS. Conservation Buffers; NRCS: Washington, DC, USA, 2003.
  40. Cibin, R.; Chaubey, I.; Helmers, M.J.; Sudheer, K.P.; White, M.J.; Arnold, J.G. An Improved representation of vegetative filter strips in SWAT. Trans. ASABE 2018, 61, 1017–1024. [Google Scholar] [CrossRef]
  41. Laboski, C.A.M.; Peters, J.B. Nutrient Application Guidelines for Field, Vegetable, and Fruit Crops in Wisconsin (A2809); Division of Cooperative Extension of the University of Wisconsin-Extension: Madison, WI, USA, 2012. [Google Scholar]
  42. Predicala, B.; Alvarado, A. Alternatives for animal drinking and barn cleaning to reduce water use in swine facilities. Can. Biosyst. Eng. 2014, 56, 5.7–5.15. [Google Scholar] [CrossRef]
  43. Muhlbauer, R.V.; Moody, L.B.; Burns, R.T.; Harmon, J.; Stalder, K. Water Consumption and Conservation Techniques Currently Available for Swine Production; National Pork Board: Des Moines, IA, USA, 2010.
  44. Christianson, S.; Lemay, S.; Lague, C.; Patience, J.; Gonyou, H. Water usage by grower-finisher pigs using dry and wet/dry feeders. In 2002 Prairie Swine Centre Annual Research Report; Prairie Swine Centre: Saskatoon, SK, Canada, 2002. [Google Scholar]
  45. Harmon, J.; Meyer, V.M. Nipple Waterers for Swine (PM-1493); Cooperative Extension Service, Iowa State University of Science and Technology: Ames, IA, USA, 2008. [Google Scholar]
  46. Li, Y.Z.; Chénard, L.; Lemay, S.P.; Gonyou, H.W. Water intake and wastage at nipple drinkers by growing-finishing pigs. J. Anim. Sci. 2005, 83, 1413–1422. [Google Scholar] [CrossRef] [PubMed] [Green Version]
  47. Deutsch, S. Ball-bite Drinkers Save Water. Available online: https://www.nationalhogfarmer.com/mag/farming_ballbite_drinkers_save (accessed on 6 November 2019).
  48. Tavares, J.M.R.; Filho, P.B.; Coldebella, A.; Oliveira, P.A.V. The water disappearance and manure production at commercial growing-finishing pig farms. Livest. Sci. 2014, 169, 146–154. [Google Scholar] [CrossRef]
  49. Magowan, E.; Connell, N.E.O.; Mccann, M.E.E. The Effect of Drinker Design on the Performance, Behaviour and Water Usage of Growing Pigs Report Prepared for: UFU and PPDC Committees; Agri-Food and Biosciences Institue: Hillsborough, UK, 2007. [Google Scholar]
  50. Brumm, M.; Dahlquist, J.; Heemstra, J. Impact of Feeders and Drinker Devices on Pig Performance, Water Use, and Manure Volume. Swine Health Prod. 2000, 8, 51–57. [Google Scholar]
  51. Guarrasi, J.; Trask, C.; Kirychuk, S. A systematic review of occupational exposure to hydrogen sulfide in livestock operations. J. Agromed. 2015, 20, 225–236. [Google Scholar] [CrossRef]
  52. Michigan Department of Environmental Quality. Concentrated Animal Feedlot Operations (CAFOs) Chemicals Associated with Air Emissions Chemicals Associated with CAFOs; Michigan Department of Environmental Quality: Lansing, MI, USA, 2006.
  53. Thorne, P.S.; Ansley, A.C.; Perry, S.S. Concentrations of bioaerosols, odors, and hydrogen sulfide inside and downwind from two types of swine livestock operations. J. Occup. Environ. Hyg. 2009, 6, 211–220. [Google Scholar] [CrossRef] [Green Version]
  54. Heber, A.; Jones, D.; Sutton, A. Indoor Quality: Controlling Ammonia Gas in Swine Buildings; The Purdue University Cooperative Extension Service: West Lafayette, IN, USA, 1996. [Google Scholar]
  55. Rotz, C.A.; Corson, M.S.; Chianese, D.S.; Hafner, S.D.; Jarvis, R.; Coiner, C.U. The Integrated Farm System Model—Reference Manual—Version 4.4; USDA: Universtiy Park, PA, USA, 2018; p. 250.
  56. Aguirre-Villegas, H.A.; Larson, R.; Reinemann, D.J. From waste-to-worth: Energy, emissions, and nutrient implications of manure processing pathways. Biofuels Bioprod. Biorefining 2014, 8, 770–793. [Google Scholar] [CrossRef]
  57. Carter, M.S.; Sørensen, P.; Petersen, S.O.; Ma, X.; Ambus, P. Effects of green manure storage and incorporation methods on nitrogen release and N2O emissions after soil application. Biol. Fertil. Soils 2014, 50, 1233–1246. [Google Scholar] [CrossRef]
  58. Bertora, C.; Alluvione, F.; Zavattaro, L.; van Groenigen, J.W.; Velthof, G.; Grignani, C. Pig slurry treatment modifies slurry composition, N2O, and CO2 emissions after soil incorporation. Soil Biol. Biochem. 2008, 40, 1999–2006. [Google Scholar] [CrossRef]
  59. Guo, S.; Pan, J.; Zhai, L.; Khoshnevisan, B.; Wu, S.; Wang, H.; Yang, B.; Liu, H.; Lei, B. The reactive nitrogen loss and GHG emissions from a maize system after a long-term livestock manure incorporation in the North China Plain. Sci. Total Environ. 2020, 720, 137558. [Google Scholar] [CrossRef] [PubMed]
  60. Harrigan, T. Time Is Money When Hauling Manure; Michigan State University Extension: Lansing, MI, USA, 2011. [Google Scholar]
  61. Harrigan, T. Manure Transport Rates and Land Application Costs for Tank Spreader Systems (E2767); Michigan State University Extension: Lansing, MI, USA, 2001. [Google Scholar]
  62. Massey, R.E.; Payne, J. Cost of Slurry Manure Application and Transprot. Available online: https://lpelc.org/costs-of-slurry-manure-application-and-transport/ (accessed on 2 March 2020).
  63. Sistkova, M.; Broucek, J.; Bartos, P. Influence of selected factors on sound levels inside and outside of pig barns. Appl. Eng. Agric. 2016, 32, 401–407. [Google Scholar]
  64. Sistkova, M.; Dolan, A.; Broucek, J.; Bartos, P. Time of day and season affect the level of noise made by pigs kept on slatted floors. Arch. Anim. Breed. 2015, 58, 185–191. [Google Scholar] [CrossRef] [Green Version]
  65. Alvarado, A.C.; Predicala, B.Z. Occupational exposure risk for swine workers in confined housing facilities. J. Agric. Saf. Health 2019, 25, 37–50. [Google Scholar] [CrossRef]
  66. Humann, M.J.; Donham, K.J.; Jones, M.L.; Achutan, C.; Smith, B.J. Occupational noise exposure assessmnt in intensive swine farrowing systems: Dosimetry, octave band, and specific task analysis. J. Agromed. 2005, 10, 23–37. [Google Scholar] [CrossRef]
Figure 1. Housing type based on farm size for (A) nursery [n = 43], (B) growing [n = 39], (C) finishing [n = 52], and (D) breeding [n = 40] facilities. Note: sample number [n=] of each animal stage does not equal values presented in Table S3, as not all facilities provided facility type information.
Sustainability 12 04536 g001
Figure 2. Ventilation and cooling system percentage by farm size. Note: combined sample number, n = 49, is below 69 as not all facilities responded to question.
Sustainability 12 04536 g002
Figure 3. Manure collection methods by farm size. Note: combined sample number, n = 68, is below 69 as not all facilities responded to question.
Sustainability 12 04536 g003
Figure 4. Manure storage type by farm size. Note: combined sample number, n = 45, is below 69 as not all facilities responded to question.
Sustainability 12 04536 g004
Figure 5. Manure application by farm size. Entire bar (solid plus light shading) represents fraction of facilities using the method to some extent where the solid bar represents the fraction of farms using that application method exclusively. Note: Combined sample number, n = 62, is below 69 as not all facilities responded to question.
Sustainability 12 04536 g005
Figure 6. Nutrient management practices. Note: combined sample number, n = 68, is below 69 as not all facilities responded to question.
Sustainability 12 04536 g006
Figure 7. Odor management practices by farm size. Note: combined sample number, n = 65, is below 69 as not all facilities responded to question.
Sustainability 12 04536 g007
Figure 8. Animal drinker management methods by farm size. Note: All facilities participated in question, n = 69.
Sustainability 12 04536 g008
Figure 9. Fraction of facilities transporting manure using tractor, trucking, or pumping by farm size. Note: Entire bar (solid plus light shading) represents fraction of facilities using the method to some extent where the solid bar represents the fraction of farms using that application method exclusively. Combined sample number, n = 57, is below 69 as not all facilities responded to question.
Sustainability 12 04536 g009
Table 1. Estimated odor scores * by farm size.
AllVery SmallSmallMediumLargeCAFO
Mean783633754923751910
Median694597713887658804
Min103548547103462236
Max2261756767226111061524
Responses391079106
* Multiple assumptions were made for the calculation of odor scores due to the survey not obtaining all required information (see the methods section). Note: combined sample number, n = 39, is below 69 as not all facilities responded to questions required for odor score estimation.

