A Geospatial Thinking Multiyear Study


Abstract
:1. Introduction
2. Previous Studies on Geospatial Thinking Development
2.1. Augmented Reality
2.2. Autodesk 123D Make
2.3. SketchUp Make 2017 with Sandbox Tools Plugin
2.4. Spatial Data Infrastructure Geospatial Technology
3. Materials and Methods
3.1. Materials
3.2. Methodology
3.3. Data Analysis
4. Results
5. Discussion
6. Conclusions
Author Contributions
Funding
Acknowledgments
Conflicts of Interest
References
- Ehrlich, P. The Population Bomb; Buccaneer Books: New York, NY, USA, 1968. [Google Scholar]
- Goldsmith, E. Blueprint for Survival; Houghton Mifflin: Boston, MA, USA, 1974; Volume 7830. [Google Scholar]
- Meadows, D.H.; Meadows, D.L.; Randers, J.; Behrens, W.W. The Limits to Growth; New American Library: New York, NY, USA, 1972. [Google Scholar]
- Kates, R.W.; Clark, W.C.; Corell, R.; Hall, J.M.; Jaeger, C.C.; Lowe, I.; Faucheux, S. Sustainability science. Science 2001, 292, 641–642. [Google Scholar] [CrossRef]
- Hwang, S. Placing GIS in sustainability education. J. Geogr. High. Educ. 2013, 37, 276–291. [Google Scholar] [CrossRef]
- Yarnal, B.; Neff, R. Whither parity? The need for a comprehensive curriculum in human-environment geography. Prof. Geogr. 2004, 56, 28–36. [Google Scholar]
- Scott, G.; Rajabifard, A. Sustainable development and geospatial information: A strategic framework for integrating a global policy agenda into national geospatial capabilities. Geo-Spat. Inf. Sci. 2017, 20, 59–76. [Google Scholar] [CrossRef] [Green Version]
- Martin, G.J. All Possible Worlds: A History of Geographical Ideas; OUP Catalogue: Oxford, UK, 2005. [Google Scholar]
- Association for Advancement of Sustainability in Higher Education (AASHE). Sustainability-Focused Academic Degree Programs. 2012. Available online: http://www.aashe.org/resources/academic-programs (accessed on 18 November 2012).
- Nielsen, C.P.; Oberle, A.; Sugumaran, R. Implementing a high school level geospatial technologies and spatial thinking course. J. Geogr. 2011, 110, 60–69. [Google Scholar] [CrossRef]
- Huynh, N.T.; Sharpe, B. An assessment instrument to measure geospatial thinking expertise. J. Geogr. 2013, 112, 3–17. [Google Scholar] [CrossRef]
- Ishikawa, T. Spatial thinking in geographic information science: Students’ geospatial conceptions, map-based reasoning, and spatial visualization ability. Ann. Am. Assoc. Geogr. 2016, 106, 76–95. [Google Scholar] [CrossRef]
- Carbonell-Carrera, C.; Hess-Medler, S. 3D Landform Modeling to Enhance Geospatial Thinking. Isprs Int. J. Geo-Inf. 2019, 8, 65. [Google Scholar] [CrossRef] [Green Version]
- Kainz, W. Cartography and the others—Aspects of a complicated relationship. Geo-Spat. Inf. Sci. 2020, 23, 52–60. [Google Scholar] [CrossRef]
- Bednarz, R.S.; Bednarz, S.W. The effect of explicit instruction in spatial thinking. In Proceedings of the 5th International Conference on Geographic Information Systems, Istanbul, Turkey, 2–5 July 2008; Fatih University Publications: Buyukcekmece, Istanbul, Turkey, 2008; pp. 649–655. [Google Scholar]
- Lobben, A.; Lawrence, M. Synthesized model of geospatial thinking. Prof. Geogr. 2015, 67, 307–318. [Google Scholar] [CrossRef]
- La Necesidad de Integrar el Pensamiento Espacial en Educación. GI Learner. Creando una Línea de Aprendizaje Basada en el Pensamiento Espacial. Available online: http://www.gilearner.ugent.be/wp-content/uploads/GI-Learner-O7_ES.pdf (accessed on 18 May 2020).
- NRC. National Research Council. Learning to Think Spatially; National Academy Press: Washington, DC, USA, 2006. [Google Scholar]
- Dold, J.; Groopman, J. The future of geospatial intelligence. Geo-Spat. Inf. Sci. 2017, 20, 151–162. [Google Scholar] [CrossRef]
- Chueca, M.; Salcedo, F.; Ferrer, J.; Galán, L.; Olivé, J. White Paper Title Engineer Degree in Geomatics and Surveying; National Agency for Quality Assessment and Accreditation (ANECA): Madrid, Spain, 2004; pp. 118–148.
- Lee, J.; Bednarz, R. Effect of GIS learning on spatial thinking. J. Geogr. High. Educ. 2009, 33, 183–198. [Google Scholar] [CrossRef]
- Lee, J.; Bednarz, R. Components of spatial thinking: Evidence from a spatial thinking ability test. J. Geogr. 2012, 111, 15–26. [Google Scholar] [CrossRef]
- Goodchild, M.F.; Janelle, D.G. Toward critical spatial thinking in the social sciences and humanities. GeoJournal 2010, 75, 3–13. [Google Scholar] [CrossRef] [PubMed] [Green Version]
- Hammond, T.C.; Bodzin, A.; Anastasio, D.; Holland, B.; Popejoy, K.; Sahagian, D.; Rutzmoseer, S.; Carrigan, J.; Farina, W. “You know you can do this, right?” developing geospatial technological pedagogical content knowledge and enhancing teachers’ cartographic practices with socio-environmental science investigations. Cartog. Geog. Inf. Sci. 2018, 45, 305–318. [Google Scholar] [CrossRef]
- Schlemper, M.B.; Athreya, B.; Czajkowski, K.; Stewart, V.C.; Shetty, S. Teaching Spatial Thinking and Geospatial Technologies Through Citizen Mapping and Problem-Based Inquiry in Grades 7–12. Cartog. Geog. Inf. Sci. 2018, 118, 21–34. [Google Scholar] [CrossRef]
- Carbonell-Carrera, C.; Hess-Medler, S. Interactive Visualization Software to Improve Relief Interpretation Skills: Spatial Data Infrastructure Geoportal versus Augmented Reality. Prof. Geogr. 2019, 71, 725–737. [Google Scholar] [CrossRef]
- Ishikawa, T.; Kastens, K. Why Some Students Have Trouble with Maps and Other Spatial Representations. J. Geosc. Educ. 2018, 53, 184–197. [Google Scholar] [CrossRef]
- Kastens, K.A.; Ishikawa, T. Spatial thinking in the geosciences and cognitive sciences: A cross-disciplinary look at the intersection of the two fi elds. In Earth and Mind: How Geologists Think and Learn about the Earth: Geological Society of America Special Paper 413; Manduca, C.A., Mogk, D.W., Eds.; Geological Society of America: Boulder, CO, USA, 2006; pp. 53–76. [Google Scholar] [CrossRef] [Green Version]
- Sındır, K.O.; Martinov, M.; Skaljic, S.; Djevic, M.; Oztekın, S.; Ros, V.; Kosutic, S. The role of agricultural engineering in sustainable rural development in SEE (South Eastern Europe) countries. J. Agric. Sci. 2008, 53, 151–158. [Google Scholar]
- Jacovina, M.; Ormand, C.; Shipley, T.F.; Weisberg, S. Topographic Map Assessment. 2014. Available online: http://www.spatiallearning.org/index.php/resources/testsainstruments (accessed on 12 March 2017).
- Golledge, R.G.; Marsh, M.; Battersby, S. Matching geospatial concepts with geographic educational needs. Geogr. Res. 2008, 46, 85–98. [Google Scholar] [CrossRef]
- Palmer, J.F. A Landscape Assessment Framework for Visual Impact Assessment in the USA. J. Digit. Landsc. Archit. 2016, 1, 10–17. [Google Scholar]
- Ayer, S.K.; Messner, J.I.; Anumba, C.J. Assessing the impact of using photographic images to influence building retrofit design education. In AEI 2013: Building Solutions for Architectural Engineering; American Society of Civil Engineers: Reston, VA, USA, 2013; pp. 34–43. [Google Scholar]
- Barrado-Timón, D.A.; Hidalgo-Giralt, C. The Historic City, Its Transmission and Perception via Augmented Reality and Virtual Reality and the Use of the Past as a Resource for the Present: A New Era for Urban Cultural Heritage and Tourism? Sustainability 2019, 11, 2835. [Google Scholar] [CrossRef] [Green Version]
- Meng, L. An IEEE value loop of human-technology collaboration in geospatial information science. Geo-Spat. Inf. Sci. 2020, 23, 61–67. [Google Scholar] [CrossRef]
- Gabajová, G.; Furmannová, B.; Medvecká, I.; Grznár, P.; Krajčovič, M.; Furmann, R. Virtual Training Application by Use of Augmented and Virtual Reality under University Technology Enhanced Learning in Slovakia. Sustainability 2019, 11, 6677. [Google Scholar] [CrossRef] [Green Version]
- Nakamae, E.; Qin, X.; Tadamura, K. Rendering of landscapes for environmental assessment. Landsc. Urban Plan. 2001, 54, 19–32. [Google Scholar] [CrossRef]
- Turan, Z.; Meral, E.; Sahin, I.F. The impact of mobile augmented reality in geography education: Achievements, cognitive loads and views of university students. J. Geogr. High. Educ. 2018, 3, 427–441. [Google Scholar] [CrossRef]
- Galin, E.; Guérin, E.; Peytavie, A.; Cordonnier, G.; Cani, M.P.; Benes, B.; Gain, J. A Review of Digital Terrain Modeling. Comput. Graph. Forum 2019, 38, 553–577. [Google Scholar] [CrossRef]
- Carbonell-Carrera, C.; Hess Medler, S. Spatial Orientation Skill Improvement with Geospatial Applications: Report of a Multi-Year Study. ISPRS Int. J. Geo-Inf. 2017, 6, 278. [Google Scholar] [CrossRef] [Green Version]
- Carbonell Carrera, C. Spatial-thinking knowledge acquisition from route-based learning and survey learning: Improvement of spatial orientation skill with geographic information science sources. J. Surv. Eng. 2017, 143, 05016009. [Google Scholar] [CrossRef]
- Álvarez-Otero, J.; De Lázaro y Torres, M.L. Spatial Data Infrastructures and Geography Learning. Eur. J. Geogr. 2017, 3, 19–29. [Google Scholar]
- Atit, K.; Weisberg, S.M.; Newcombe, N.S.; Shipley, T.F. Learning to interpret topographic maps: Understanding layered spatial information. Cogn. Res. Princ. Implic. 2016, 1, 2. [Google Scholar] [CrossRef] [PubMed] [Green Version]
- Newcombe, N.S.; Weisberg, S.M.; Atit, K.; Jacovina, M.E.; Ormand, C.J.; Shipley, T.F. The lay of the land: Sensing and representing topography. Balt. Int. Yearb. Cogn. Log. Commun. 2015, 10, 6. [Google Scholar] [CrossRef] [Green Version]
- Carbonell-Carrera, C.; Jaeger, A.J.; Shipley, T.F. 2D Cartography Training: Has the Time Come for a Paradigm Shift? Isprs Int. J. Geo-Inf. 2018, 7, 197. [Google Scholar] [CrossRef] [Green Version]
- Sorby, S.A. Educational research in developing 3-D spatial skills for engineering students. Int. J. Sci. Educ. 2009, 31, 459–480. [Google Scholar] [CrossRef]
- Liben, L.S.; Kastens, K.A.; Christensen, A.E. Spatial foundations of science education: The illustrative case of instruction on introductory geological concepts. Cogn. Instr. 2011, 29, 45–87. [Google Scholar] [CrossRef]
- Uttal, D.H.; Meadow, N.G.; Tipton, E.; Hand, L.L.; Alden, A.R.; Warren, C.; Newcombe, N.S. The malleability of spatial skills: A meta-analysis of training studies. Psychol. Bull. 2013, 139, 352. [Google Scholar] [CrossRef]
- Pak, R.; Czaja, S.J.; Sharit, J.; Rogers, W.A.; Fisk, A.D. The role of spatial abilities and age in performance in an auditory computer navigation task. Comput. Hum. Behav. 2006, 24, 3045–3051. [Google Scholar] [CrossRef] [Green Version]
- IBM Corp. IBM SPSS Statistics for Windows, version 21.0; Released 2012; IBM Corp: Armonk, NY, USA, 2012. [Google Scholar]
- Cinderby, S. How to reach the ‘hard-to-reach’: The development of Participatory Geographic Information Systems (P-GIS) for inclusive urban design in UK cities. Area 2010, 42, 239–251. [Google Scholar] [CrossRef]
- Lange, E. 99 volumes later: We can visualise. Now what? Landsc. Urban Plan. 2011, 100, 403–406. [Google Scholar] [CrossRef] [Green Version]
- Steiner, F.; Simmons, M.; Gallagher, M.; Ranganathan, J.; Robertson, C. The ecological imperative for environmental design and planning. Front. Ecol. Environ. 2013, 11, 355–361. [Google Scholar] [CrossRef]
- Díaz, D.M.; Carbonell Carrera, C.C.; Pérez, J.L.S.; De la Torre Cantero, J.; Dorta, N.M. Digital manufacturing of 3D DTM models to enhance cartographic interpretation & creative competence. Adv. Build. Educ. 2017, 1, 11–26. [Google Scholar] [CrossRef] [Green Version]
- Wang, X. Landscape based on three-dimensional SketchUp modelling to get visualization applications. Comput. Model. New Technol. 2014, 18, 142–146. [Google Scholar]
- Rojas-Fernández, J.; Galán-Marín, C.; Rivera-Gómez, C.; Fernández-Nieto, E.D. Exploring the Interplay between CAD and FreeFem++ as an Energy Decision-Making Tool for Architectural Design. Energies 2018, 11, 2665. [Google Scholar] [CrossRef] [Green Version]
- Guo, Y.; Bart, D. Optimization of Design Parameters for Office Buildings with Climatic Adaptability Based on Energy Demand and Thermal Comfort. Sustainability 2020, 12, 3540. [Google Scholar] [CrossRef]
- Ayanlade, A.; Orimoogunje, I.O.O.; Borisade, P.B. Geospatial data infrastructure for sustainable development in sub-Saharan countries. Int. J. Digit. Earth 2008, 1, 247–258. [Google Scholar] [CrossRef]
- Ray, N.; Lacroix, P.M.A.; Giuliani, G.; Upla, P.; Rajabifard, A.; Jensen, D. Open spatial data infrastructures for the sustainable development of the extractives sector: Promises and challenges. In Spatial Enablement in a Smart World; GSDI Association Press: Needham, MA, USA, 2016. [Google Scholar]
- Rigby, M.; Eagleson, S. Spatial data infrastructure challenges for addressing the Sustainable Development Goals in Australia. In Proceedings of the International Symposium on A Smart Sustainable Future for All: Enhancing Resilience in a Changing Landscape, Melbourne, Australia, 24–26 September 2018. [Google Scholar]
- Álvarez Otero, J.; De Lázaro y Torres, M.L. Education in Sustainable Development Goals Using the Spatial Data Infrastructures and the TPACK Model. Educ. Sci. 2018, 8, 171. [Google Scholar] [CrossRef] [Green Version]
- Pokojski, W.; Angiel, J.; Pokojska, P. Importance of digital spatial data in environmental education. Edukacja Biologiczna i Środowiskowa 2018, 1, 34–38. [Google Scholar] [CrossRef]


| Task | 1st Technology (Gain %, SD, p) | 2nd Technology (Gain %, SD, p) |
|---|---|---|
| I Path | Augmented Reality (AR) (17%, SD = 0.42, p = 0.003) | No significant gains with SketchUp 123, Autodesk 123D or SDI |
| II Stream/Water flow | Augmented Reality (AR) (37.5%, SD = 2.12, p = 0.000) | SketchUp Make 123 (12.5%, SD = 1.22, p = 0.001) |
| III Slope | SketchUp Make 123 (19.33%, SD = 0.88, p = 0.006) | Autodesk 123D Make (14.00%, SD = 1.06, p = 0.001) |
| IV Visibility | SketchUp Make 123 (11.29%, SD = 1.02, p = 0.002) | Autodesk 123D Make (10.71%, SD = 1.29, p = 0.000) |
| V Elevation Points | Augmented Reality (AR) (20.87%, SD = 0.61, p = 0.000) | Autodesk 123D Make (9.67%, SD = 0.69, p = 0.002) |
| VI Photo-interpretation relief | Spatial Data Infrastructure (SDI) (14.25%, SD = 1.29, p = 0.002) | Autodesk 123D Make (9.50%, SD = 1.10, p = 0.022) |
| VII Profile | Spatial Data Infrastructure (SDI) (36.00%, SD = 1.03, p = 0.000) | SketchUp Make 123 (31.5%, SD = 0.71, p = 0.000) |
| Task | Description | Item Number | |
|---|---|---|---|
| I | Path | Easy route between two points | 1 |
| II | Stream/water flow | Water flow between two points in different geographical settings | 2, 10, 11, 12 |
| III | Slope | Steeper slope between two points | 5, 9 |
| IV | Visibility | Questions about visibility between points | 3, 17 |
| V | Elevation points | Questions about elevation points in a contour interval scenario | 4, 6, 7 |
| VI | Photo interpretation relief | From a photograph/image of a land and a contour lines topographic map, different questions are asked | 8, 15, 16, 18 |
| VII | Profile | Questions about topographic profiles from a contour lines topographic map | 13, 14 |
| n = 106 | Task I | Task II | Task III | Task IV | Task V | Task VI | Task VII | TMA Total Score | |
|---|---|---|---|---|---|---|---|---|---|
| Course Mark | r | −0.01 | 0.32 | 0.28 | 0.38 | 0.22 | 0.26 | 0.20 | 0.50 |
| r2 | 0.00 | 0.10 | 0.08 | 0.14 | 0.05 | 0.07 | 0.04 | 0.25 | |
| (p) | (0.94) | (<0.01) | (0.01) | (<0.01) | (0.02) | (0.01) | (0.04) | (<0.01) | |
| B | Standard Error | Beta | t | p | |
|---|---|---|---|---|---|
| A (constant) | 0.99 | 0.64 | 1.54 | 0.13 | |
| Task II | 0.13 | 0.06 | 0.20 | 2.27 | 0.03 |
| Task III | 0.54 | 0.22 | 0.21 | 2.48 | 0.02 |
| Task IV | 0.49 | 0.12 | 0.34 | 4.04 | 0.00 |
| Task VI | 0.32 | 0.14 | 0.20 | 2.33 | 0.02 |
| n = 106 | Possible maximum | Min. | Max. | Mean | Standard Deviation |
|---|---|---|---|---|---|
| Task I | 1 | 0 | 1 | 0.8 | 0.4 |
| Task II | 8 | 0 | 8 | 4.3 | 2.4 |
| Task III | 3 | 1 | 3 | 2.2 | 0.6 |
| Task IV | 7 | 0 | 5 | 3.2 | 1.1 |
| Task V | 3 | 0 | 3 | 2.1 | 0.8 |
| Task VI | 4 | 0 | 4 | 1.4 | 1.0 |
| Task VII | 2 | 0 | 2 | 1.3 | 0.7 |
| TMA Total Score | 28 | 7 | 23 | 15.2 | 3.8 |
| Course Mark | 10 | 0.7 | 7.8 | 4.8 | 1.6 |
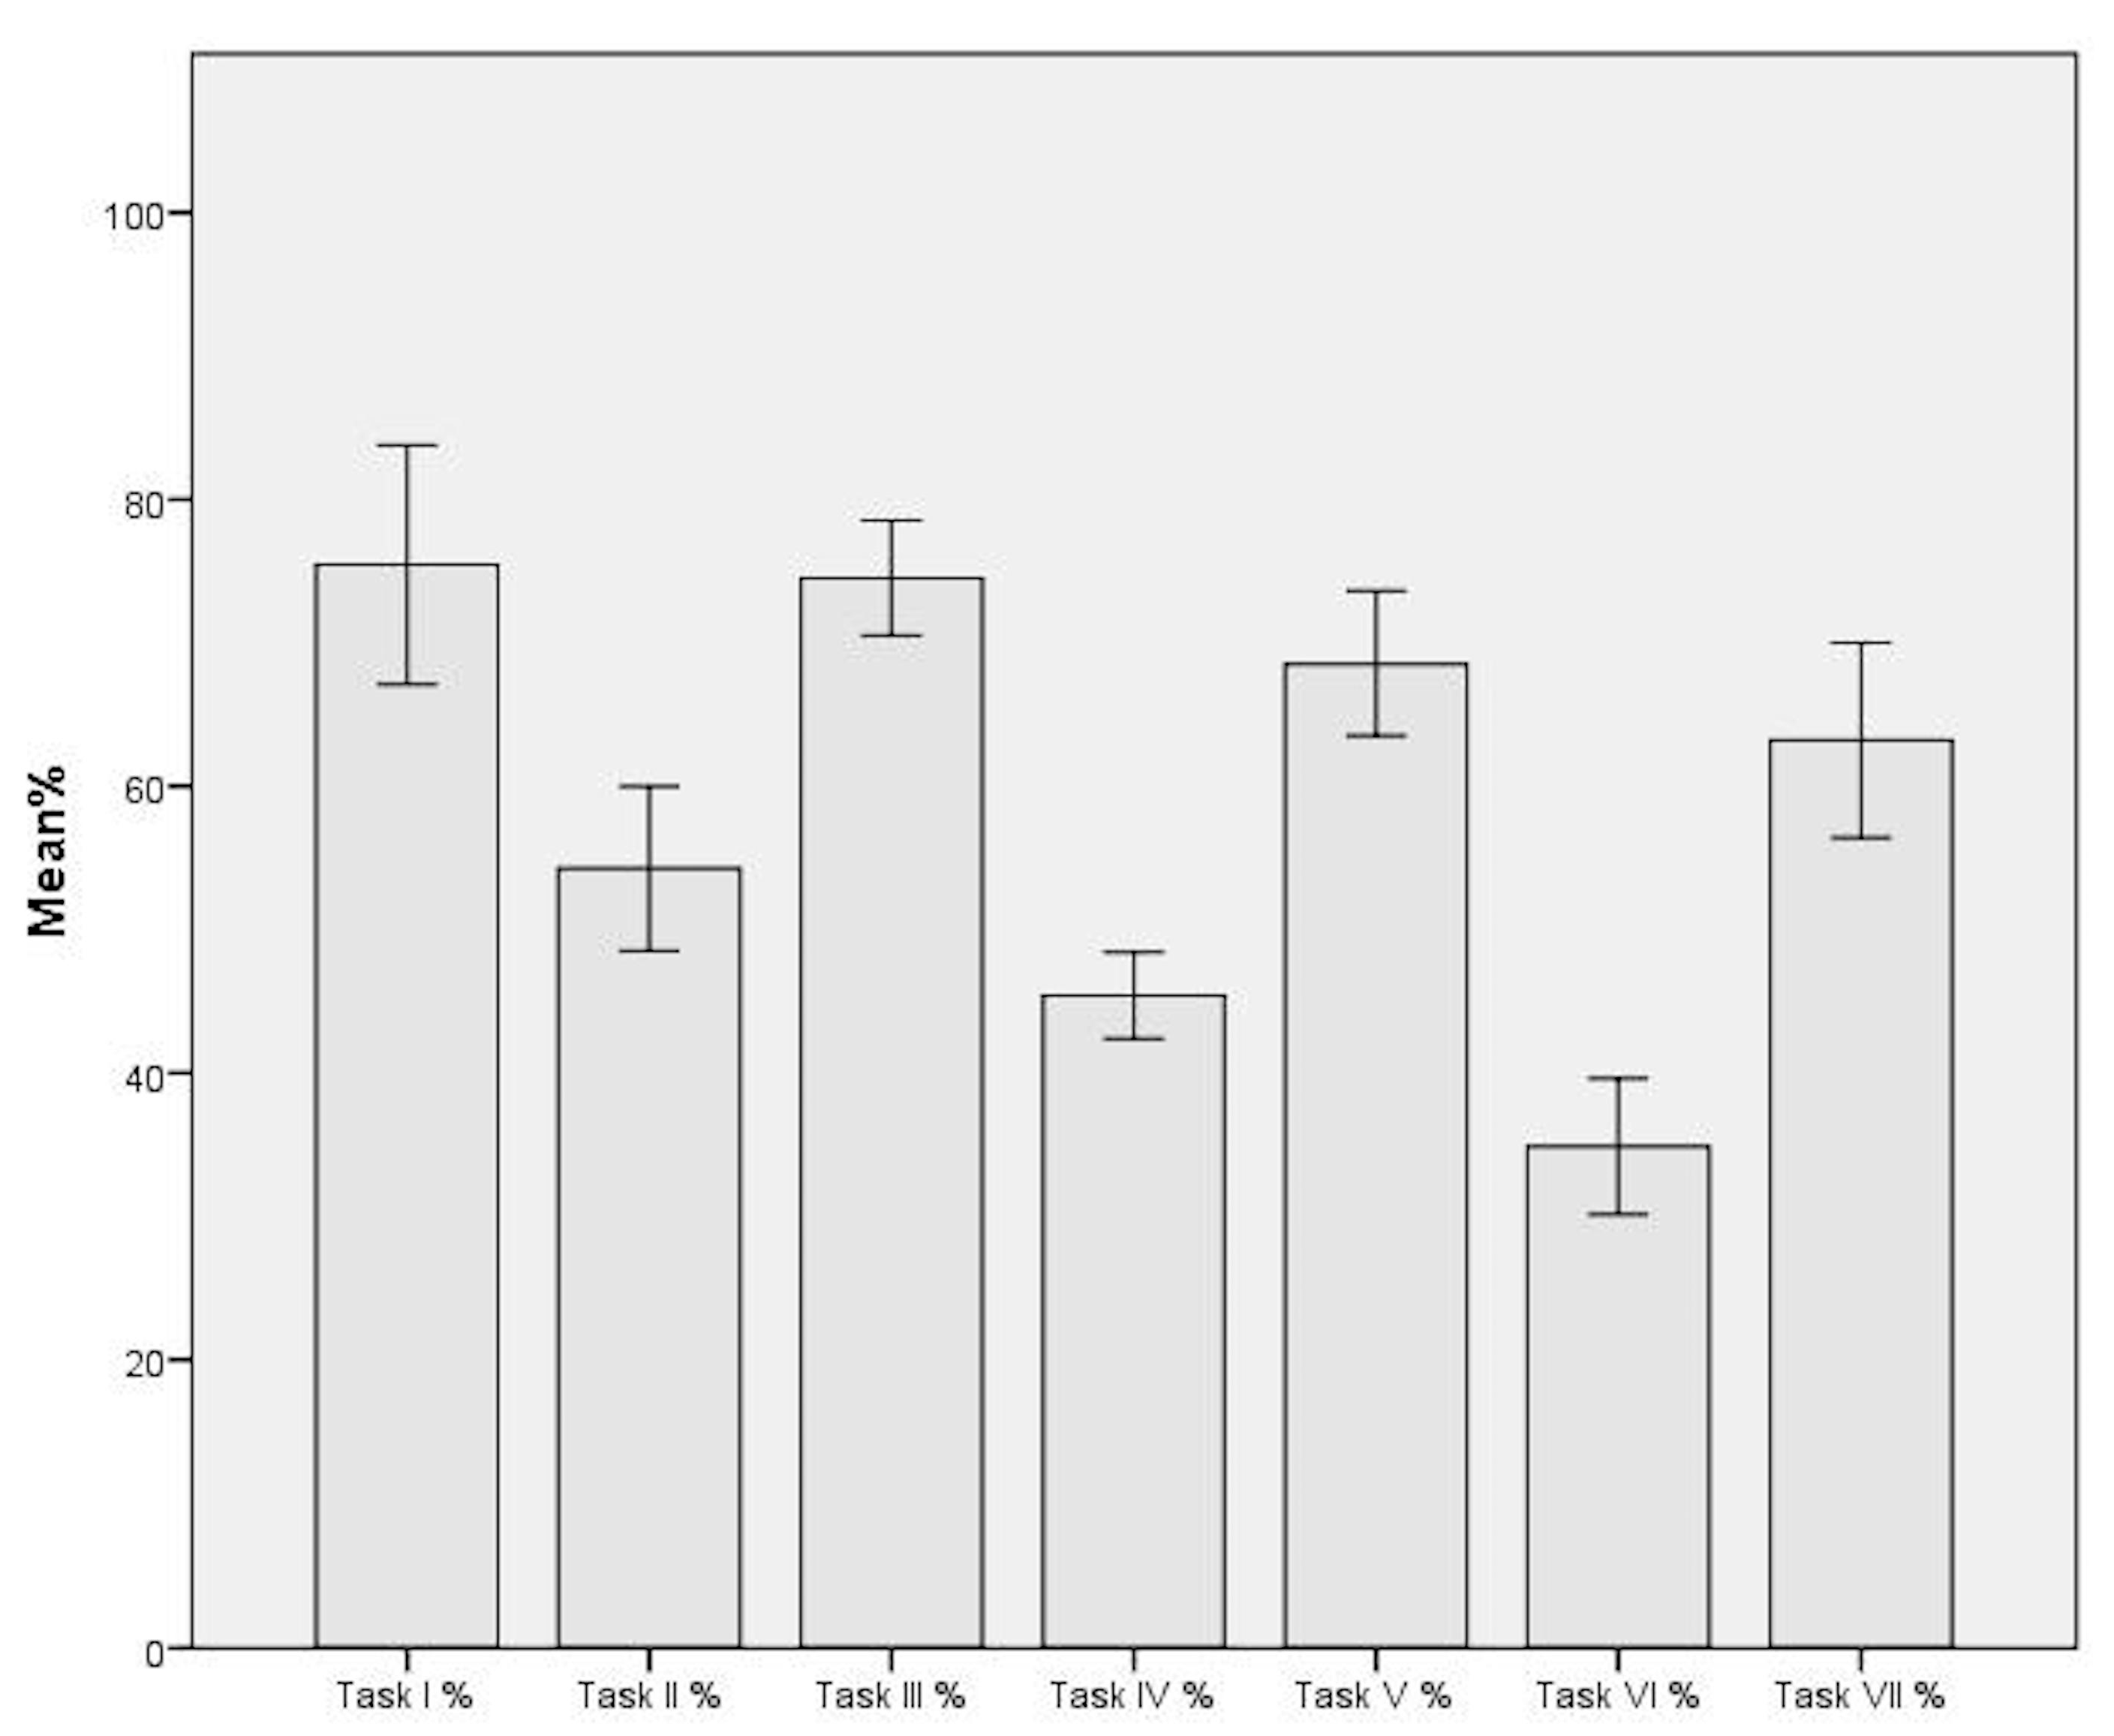
| n = 106 | Min. | Max. | Mean, % | Standard Deviation |
|---|---|---|---|---|
| Task I, % | 0 | 100 | 75.5 | 43.2 |
| Task II, % | 0 | 100 | 54.2 | 29.7 |
| Task III, % | 33.3 | 100 | 74.5 | 20.9 |
| Task IV, % | 0 | 71.4 | 45.4 | 15.7 |
| Task V, % | 0 | 100 | 68.6 | 26.4 |
| Task VI, % | 0 | 100 | 34.9 | 24.6 |
| Task VII, % | 0 | 100 | 63.2 | 35.4 |
| n = 106 | Task II, % | Task III, % | Task IV, % | Task V, % | Task VI, % | Task VII, % | |
|---|---|---|---|---|---|---|---|
| Task I, % | r | 0.00 | −0.21 | −0.03 | −0.04 | 0.05 | −0.22 |
| (p) | (0.99) | (0.03) | (0.79) | (0.67) | (0.60) | (0.02) | |
| Task II, % | r | 0.24 | 0.11 | 0.19 | 0.16 | 0.26 | |
| (p) | (0.01) | (0.26) | (0.05) | (0.10) | (0.01) | ||
| Task III, % | r | 0.03 | 0.32 | 0.00 | 0.33 | ||
| (p) | (0.73) | (0.00) | (0.99) | (0.00) | |||
| Task IV, % | r | −0.06 | 0.08 | 0.11 | |||
| (p) | (0.57) | (0.40) | (0.26) | ||||
| Task V, % | r | 0.17 | 0.25 | ||||
| (p) | (0.09) | (0.01) | |||||
| Task VI, % | r | 0.22 | |||||
| (p) | (0.03) | ||||||
© 2020 by the authors. Licensee MDPI, Basel, Switzerland. This article is an open access article distributed under the terms and conditions of the Creative Commons Attribution (CC BY) license (http://creativecommons.org/licenses/by/4.0/).
Share and Cite
Carbonell-Carrera, C.; Saorin, J.L.; Hess-Medler, S. A Geospatial Thinking Multiyear Study. Sustainability 2020, 12, 4586. https://doi.org/10.3390/su12114586
Carbonell-Carrera C, Saorin JL, Hess-Medler S. A Geospatial Thinking Multiyear Study. Sustainability. 2020; 12(11):4586. https://doi.org/10.3390/su12114586
Chicago/Turabian StyleCarbonell-Carrera, Carlos, Jose Luis Saorin, and Stephany Hess-Medler. 2020. "A Geospatial Thinking Multiyear Study" Sustainability 12, no. 11: 4586. https://doi.org/10.3390/su12114586