1. Introduction
Energy has a crucial role in the economic growth and development of countries due to its usage as the main input of production, consumption, and distribution for nearly all goods and services. In turn, more energy is required as a key factor in the production of goods and services for sharp economic growth. Therefore, defining the drivers of energy consumption is one of the well debated topics among researchers. A vast literature is devoted to exploring the relationships between energy consumption and its drivers. In addition, a number of empirical studies concluded that there is a presence of a direct link between carbon dioxide (CO
2) emissions and energy consumption. That is, excessive use of energy and other natural resources leads to environmental degradation. Thus, the greenhouse gas emissions from fossil fuel consumption results in higher levels of CO
2 emissions that are harmful to the environment as well as hitting irrevocable damages to the atmosphere. Due to the negative impact of conventional energy forms of production and consumption on environmental damage, and the limited yields of conventional energy sources, the necessity for renewable sources of energy usage is becoming urgent [
1]. Transition from conventional fossil fuel energy sources to renewable ones is an essential target of any country on the globe. International Renewable Energy Agency (IRENA) describes energy transition as a way for the transformation of the global energy sector from fossil-based energy to zero-carbon energy types. Energy transition, consequently, can enhance sustainable economic growth, energy security, and environmental quality. Particularly, environmental quality attracts a lot of consideration due to the urgency of the matter for the entire world. Thus, the International Energy Agency (IEA) considers environmental quality as the heart of energy transition and takes energy-related carbon emissions as the most relevant clean energy transition indicator.
All countries over the world have their own strategies to attain nationally or internationally designed energy transition objectives. Effective realization of these objectives necessitates prudent examination of the main drivers of energy transition, which helps making evidence-based policy recommendations. Considering the importance of the topic, a number of papers have studied the impact of different factors on energy transition [
2,
3]. Renewable energy can be generally defined as energy collected from solar, wave, geothermal, tide, wind, wood, waste, and plant materials (biomass). The renewable energy is safe, clean, and inexhaustible, the reverse of conventional energy. Hence, it is growing rapidly all over the world owing to expectations it will remove many conventional energy elements and occupy a leading position in energy consumption.
From the literature, renewable energy is widely considered to be a substitute for crude oil in both consumption and production of other energy sources. From this point of view, a positive relationship is expected between oil prices and the demand for renewable energy due to rising oil prices, encouraging businesses and households to reduce their consumption, purchase more energy-efficient products and to shift from conventional energy to renewables [
4]. In fact, high oil prices should give incentives to increase investment in alternative energy. By 2015, high oil prices required a cheaper alternative, while low oil prices were expected to reduce investment in alternative energy sources. This hypothesis was valid until the recent sharp decline in oil prices. It is argued that oil price volatility is one of the reasons for the growing attractiveness of renewable energy as a way to reduce oil dependence, which makes it vulnerable to oil price shocks. However, reducing this dependence has become a major problem, not only for oil importing countries, but also for oil exporting countries, particularly after oil prices plummeted around 2008 and 2014 [
5]. For example, Nguyen and Kakinaka [
6] found positive and statistically significant impact for low- and high-income countries. Moreover, Bamati and Roofi [
7] also concluded positive impact for developing and developed country cases. However, for oil-exporting countries it might be the case that when the oil price is higher they enjoy the availability of abundant resources and apply subsidies to domestic users which, in turn, results in an increase of conventional energy consumption and does not motivate producers and consumers to focus on alternative energy sources. However, it also might be a case to, during high oil price periods, invest oil revenues into renewable energy projects and increase renewable energy consumption. Alternatively, to take advantage of higher oil price regimes, oil-exporting countries can export oil products and promote the consumption of renewables domestically, consequently increasing the consumption of renewable energy. However, in oil importing country cases, higher oil prices discourage the use of oil products, and motivates focus on alternative sources, which in turn might increase consumption of renewable energy. As an example, Omri and Nguyen [
8] for a panel of middle-income countries, and Salim and Rafiq [
9] in the case of China and Indonesia, find a negative and statistically significant impact of oil price on renewable energy consumption. In addition, Salim and Rafiq [
9] for Brazil, India, Philippines, and Turkey, Nguyen and Kakinaka [
6] for the panel of middle-income countries where Azerbaijan is included, Omri and Nguyen [
8] for the panels of high- and low-income countries concluded insignificant impact of oil price on renewable energy consumption. Hence, to see the response of renewable energy consumption to oil prices, individual country-specific studies are needed. Considering all the above-mentioned facts, it is important to study if the volatility in oil prices affects economies to change their conventional energy consumption into renewables.
In addition, the recent COVID-19 crisis seems fundamentally to reshape local and global energy markets. Undeniably, the evolving economic slowdown is compounded by the unexpected volatile behavior of global oil prices and the destruction of worldwide energy demand. Moreover, the pandemic has already damaged global supply chains in the energy sector, including for renewables and other clean energy technologies. To surmount negative effects of COVID-19, many countries have already launched relevant measures to reduce energy consumption levels. One of the concerns the COVID-19 crisis prompted is each country’s access to renewable energy sources, and country-specific energy security in the similar crisis periods. Hence, the current crisis indicates the importance of transition toward renewable energy sources for crisis-period for all countries to assure energy security. This in its turn necessitates taking relevant measures to achieve energy transition integrated with technological advancements.
The reviewed literature shows no research has investigated the effect of economic growth, CO
2 emissions, and oil price on renewable energy consumption for the Azerbaijani case, employing country-specific time series data. As it is well known, if the country-specific parameters are not estimated then the estimated elasticities represent the average responses, which might not be a relevant representative for a country with specific features. Hence, the purpose of the current article is to fill in this gap by examining the main determinants of renewable energy consumption in the case of Azerbaijan, which is one of the oil-rich developing countries gifted also with plentiful renewable energy resources, making it a special case for this research, employing a structural time series modeling (STSM) approach by Harvey [
10]. The results of the study are important for economic policymakers to devise appropriate policies in favor of sustainable energy demand.
The structure of the paper is as follows:
Section 2 presents the background of renewable energy in Azerbaijan.
Section 3 presents the reviewed literature. The theoretical framework and some theory-related aspects are presented in
Section 4. Description of data and research methodology are given in
Section 5 and
Section 6. The discussion of the obtained results of the study are given in
Section 7.
Section 8 presents the conclusion and policy implications.
2. Background of the Renewable Energy Consumption in Azerbaijan
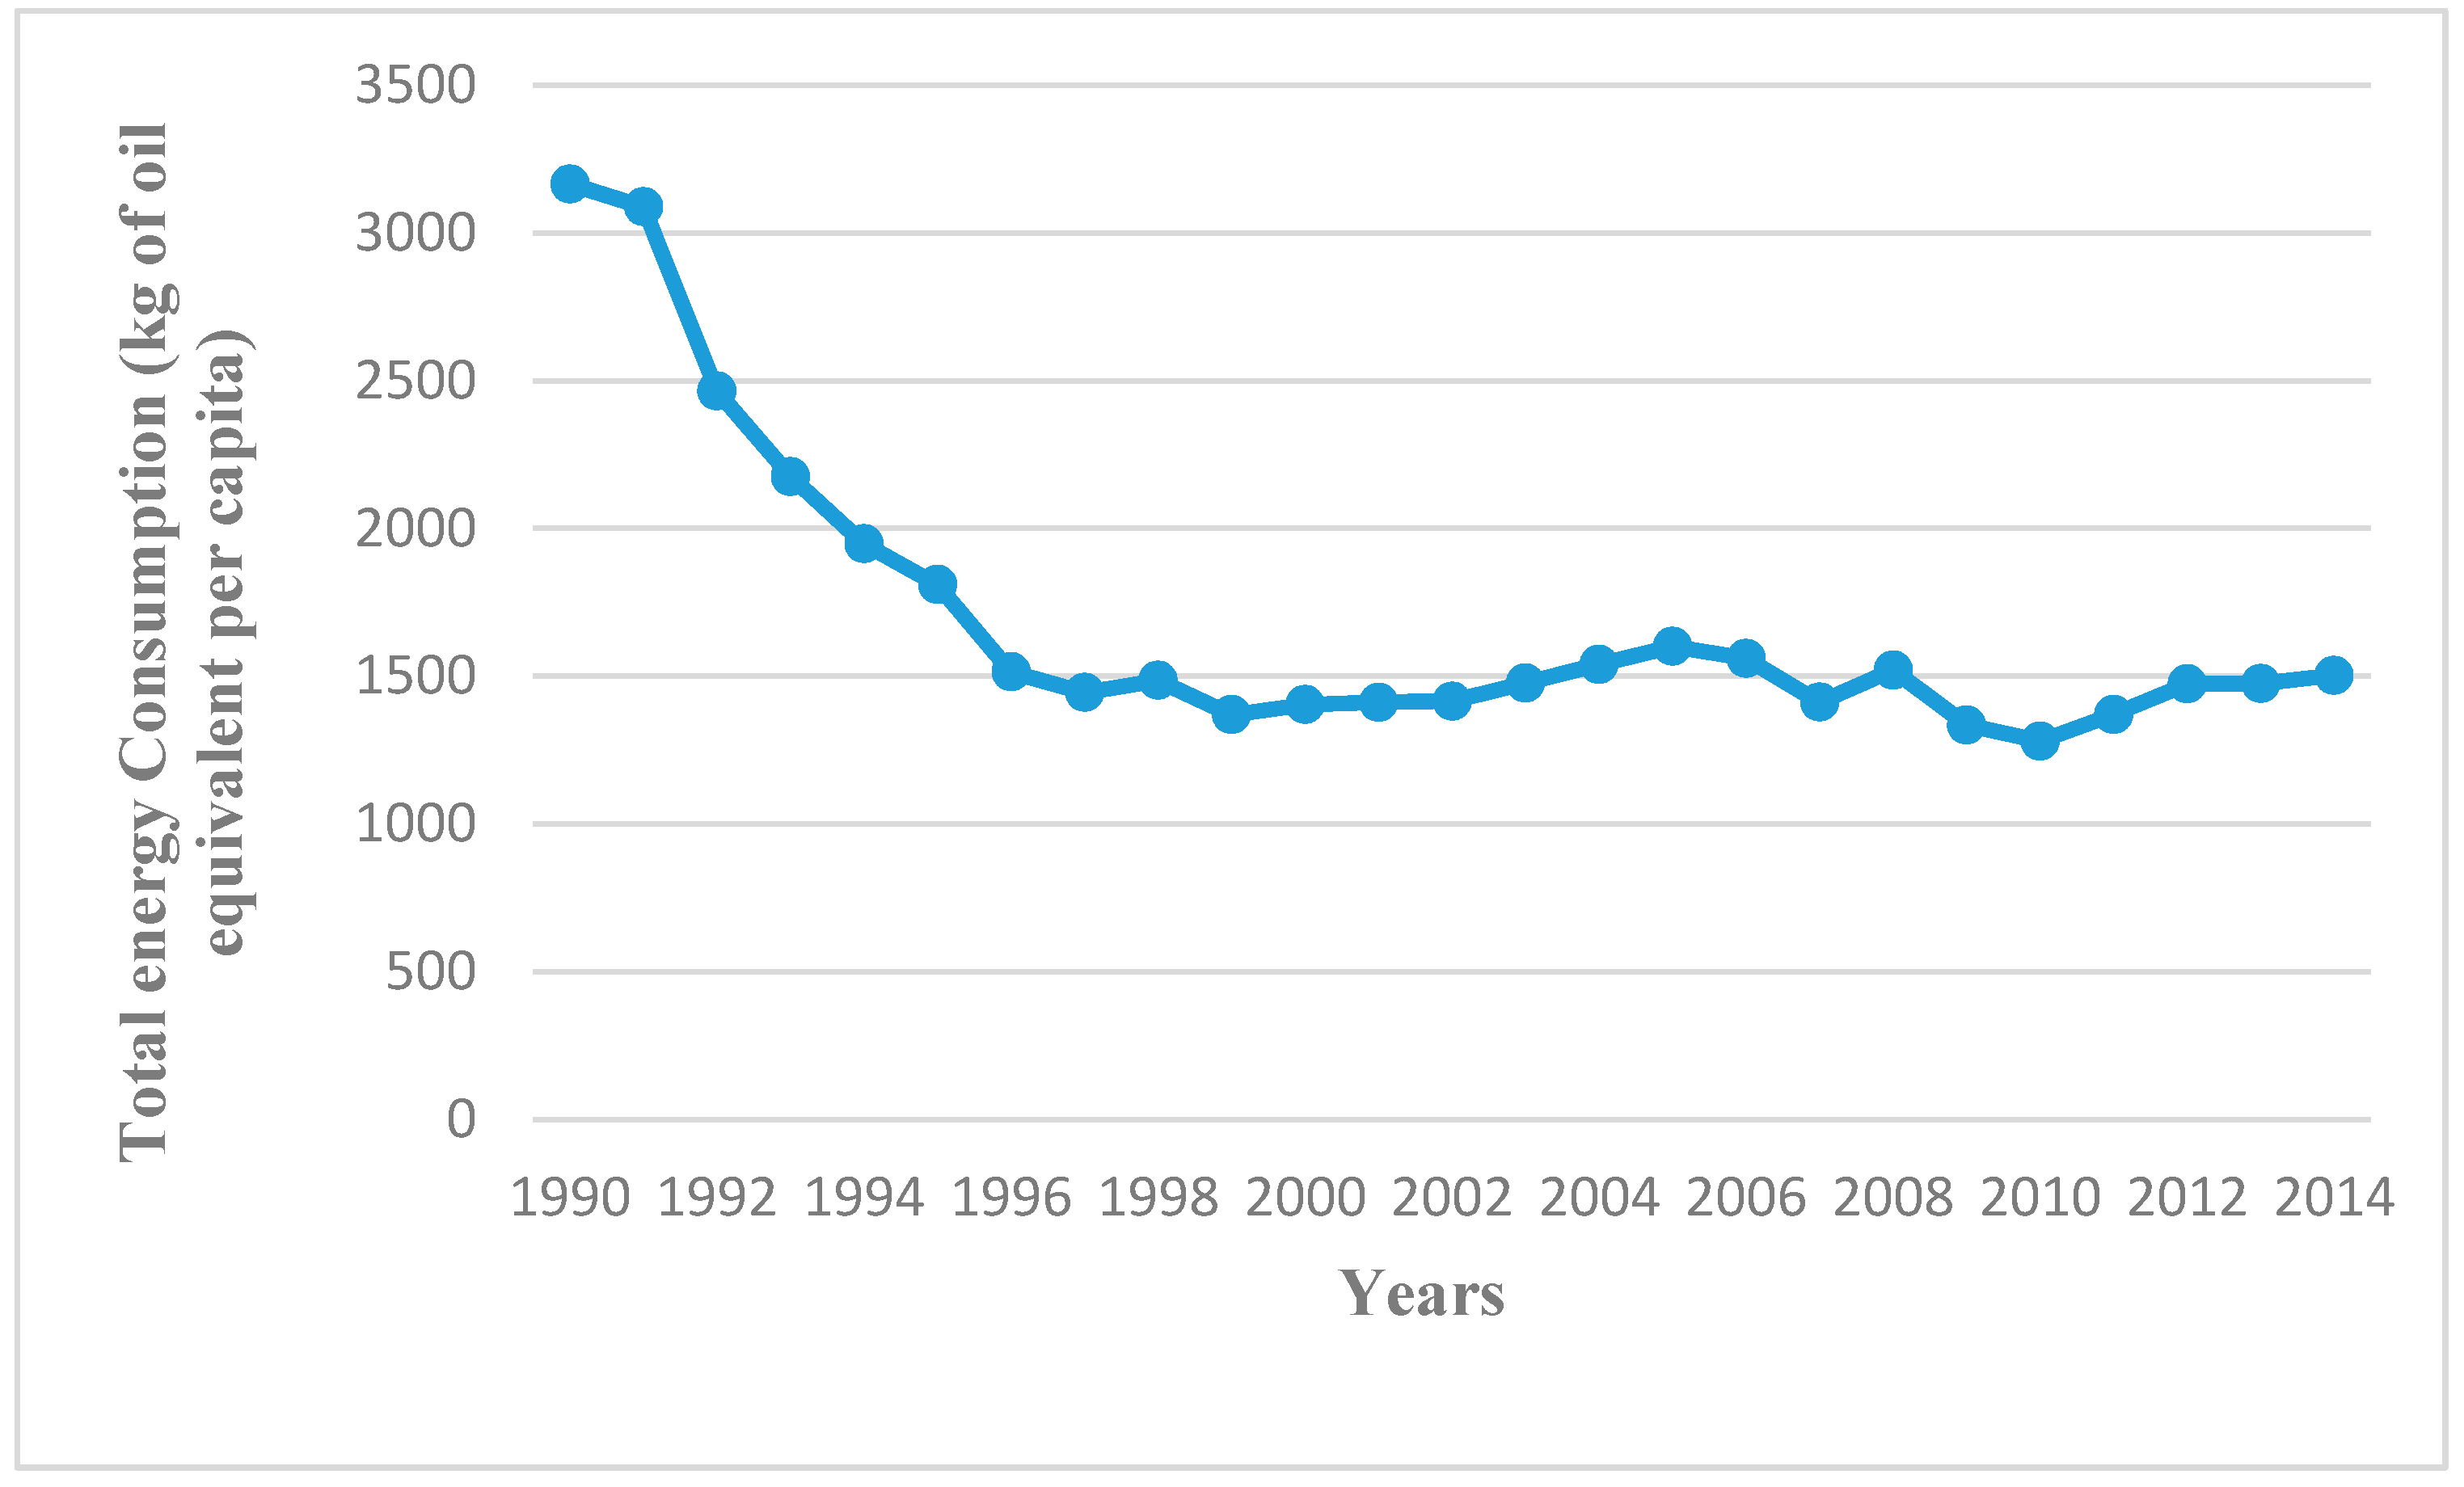
Azerbaijan is a country with a steadily growing economy and abundant energy resources. One of the factors reflecting sustainable economic development in the country is its energy production and consumption indicators. Thus, it is important to analyze the energy consumption firstly. To start with, the annual energy consumption data is presented in
Figure 1. As demonstrated in
Figure 1, the energy consumption sharply declined in Azerbaijan for the period of 1990–1996. This decline can be explained with different factors, such as the closedown or worsening of the industry sector after disintegration of the Soviet Union, as well as a war situation after the independence. For the period of 1996–2015 a relative increase, with some fluctuations, can be observed in energy consumption. The observed increasing trend, with some volatility, can be a result of the employed energy policies for the mentioned period.
Although the country is rich in crude oil and natural gas fields, it is developing alternative and renewable energy sources to attain the sustainable energy strategy. The “State Program on the Utilization of Alternative and Renewable Energy Sources in the Republic of Azerbaijan,” dated 21 October 2004, constitutes the legal basis for the development of the relevant projects. In accordance with the Decree of the President of the Republic of Azerbaijan dated 16 July 2009, the State Agency for Alternative and Renewable Energy was established, whose authorities were transferred to the Ministry of Energy since 14 January 2019.
The country has remarkable alternative energy sources such as wind and solar power, significant biomass and geothermal power. Beside these, it also has several small-scale hydropower resources. The estimated potential quantity of renewable energy sources is approximately 27,000 megawatts, of which 23,000 megawatts belong to solar energy [
12]. The wind potential is generally at the coastal region of the Caspian Sea, mainly in the Absheron Peninsula: The number of windy days is 250–365 days per year, which means that the country has about 800 MW of wind energy. This means saving about 1 million tons of conventional fuel per year. Sunny days are up to 2500 h per year [
13]. The Asian Development Bank has invested
$100,000–
$200,000 for the construction of a 300-kW solar floating solar power station on the Great Shore Lake near Baku [
12].
To have some idea on recent developments regarding the renewable energy-related results, the renewable energy supply for the period of 2007–2018 is given in
Table 1. As can be seen from
Table 1, the total energy supply decreased in the period of 2007–2009. For the period of 2010–2018, a relative decline with some fluctuations can be observed in renewable energy supply [
14].
By the end of 2020, the government aims to realize several activities with the purpose of increasing its wind, solar, and biomass energy production capacity and to raise energy portfolios to 420 megawatts (350 MW of wind, 50 MW of solar, and 20 MW of bio). To achieve the planned amount of energy, 1 billion 40 million manat investment is required. In addition, by the end of 2020 the government aims to develop a legislative framework to invest in renewable energy sources based on advanced world experience. At the same time, it considers auctions as a support mechanism and promotes them to attract business partners who can invest heavily in the industry. The problems of high climate volatility and issues related to investment and funding are assessed as expected risks [
15].
Azerbaijan also has hydropower and biomass energy potential. It is recommended to obtain hydropower from smaller rivers; this is because the construction of stations in large reservoirs affects fisheries negatively. Biomass energy is obtained mainly in agricultural production: Cotton and silk in the field of cotton and silk production, residual wastes in canning production, straw in the arable land can be utilized to acquire sufficient amounts of energy.
By implementing renewable energy production priorities which were thoroughly mentioned in the Strategic Road Map on the National Economy of Azerbaijan (adopted in 2016, 16 March, presidential decree No. 1897), it is projected to increase the real gross domestic product (GDP) by 70 million manat and create 270 new jobs. Apart from the creation of new work opportunities, other favorable factors such as economic development, energy security, energy diversification, and environmental protection are also remarkable advantages of alternative and renewable energy sources.
The development of these sources will have a positive impact on the implementation of Azerbaijan’s duties under the Kyoto Convention (joined in 1995) and the Paris Agreement (signed and ratified in 2016) in the context of global climate change and reducing greenhouse gas emissions. Under the Paris Agreement, 1990 has been accepted as a base year and the country has taken the commitment of reducing the greenhouse gas emissions by 35% by 2030.
In order to encourage use of alternative and renewable energy sources, the government exempted customs duties and taxes on the importation of wind power plants by the decree of the Cabinet of Ministers of 15 October 2005. In 2012, Azgintex LLC, which produces solar panels and LED lamps, began operating with a capacity of 30 MW solar panels per year [
13]. The production and consumption of this type of energy in the country can contribute to greater export of oil and natural gas.
Hence, it is crucial to examine the renewable energy consumption behavior. Annual renewable energy consumption (% total energy consumption) data is illustrated in
Figure 2.
Figure 2 presents the annual data of renewable energy consumption as a share of total energy consumption of Azerbaijan between 1990 and 2015. While considering the dynamics of alternative and renewable energy sources in Azerbaijan from the 1990s to 2014, it can be observed that rise in consumption dates back to 1990–1993, when the first period of independence was restored. However, in 1993–1994, when the Karabakh conflict was tense and our lands were occupied, there was a decline in this type of energy consumption. The next step is the implementation of various measures related to renewables between 1995 and 1999. This period is in the first phase of economic development. In December 1999, the “contract of the century” was introduced to world markets and a new era in the development of the oil industry started for Azerbaijan. This also led to an increase in conventional energy consumption and a reduction in renewable energy (1999–2000).
In addition to the accelerated implementation of the oil contracts, the state has also preferred the use of alternative energy sources. Therefore, in 2002–2010, hydropower plants were put into operation in the regions, wind turbines were installed, which led to an increase in renewable energy consumption. The decline in alternative energy consumption from that period to 2014 was due to the rapid development of the country’s economy and the need for its conventional energy sources to provide the demand related with development.
3. Literature Review
There are many studies in the literature to determine the factors affecting the demand for renewable energy consumption. In this section, the studies devoted to the determinants of renewable energy consumption in case of different countries are reviewed.
Sadorsky [
16] investigated the impact of real GDP per capita, CO
2, and oil prices on renewable energy consumption by employing different panel cointegration methods and using annual data over the period of 1980–2005 for G7 countries. He stated that real GDP per capita and CO
2 have a positive and statistically significant impact on renewable energy consumption while oil prices has a negative effect on renewable energy consumption. Salim and Rafiq [
9] explored the relationship between renewable energy consumption, real GDP, and oil price for six emerging economies using panel fully modified ordinary least squares (FMOLS), panel dynamic ordinary least squares (DOLS), and autoregressive distributed lag (ARDL) techniques. According to the ARDL results, oil price was found to have a negative and statistically significant effect on renewable energy consumption for China and Indonesia, and statistically insignificant for Brazil, India, Philippines, and Turkey. Also, the results of panel DOLS and FMOLS showed that the impact of oil price is statistically insignificant.
Apergis and Payne [
17] analyzed the oil price effect on renewable energy consumption for the period of 1980–2011 in the case of 25 Organization for Economic Co-operation and Development (OECD) countries. They used panel cointegration model and found that an increase in real oil prices leads to increase in the renewable energy consumption in the long run. Additionally, Apergis and Payne [
18] obtained a positive effect of oil price on energy consumption for seven Central American countries using panel vector error correction model (VECM) method. Tuzcu and Tuzcu [
19] evaluated the association between renewable energy consumption, real GDP, CO
2 emission, real oil prices, and the proven oil reserves in the case of sex Organization of the Petroleum Exporting Countries (OPEC) members. For estimation, they used panel data techniques. The results confirmed that real oil price does not have a statistically significant impact on renewable energy consumption.
Omri and Nguyen [
8] examined the impact of crude oil price on the renewable energy consumption for 64 countries employing a dynamic system-GMM (generalized method of moments) panel model to annual data spanning from 1990 to 2011. They found that crude oil price has a negative and statistically significant impact on renewable energy consumption. On the other hand, Omri et al. [
4] revealed a positive effect from oil price to renewable energy consumption for 64 countries employing static and dynamic panel data models to annual data over the period 1990–2011.
Brini et al. [
20] examined the relationship between renewable energy consumption as share of total final energy consumption, economic growth, international trade, and oil price in the case of Tunisia by utilizing Granger causality test and ARDL technique to annual data spanning from 1980 to 2011. The result of study indicated the existence of a bidirectional relationship between renewable energy consumption and international trade in the short run. Also, a unidirectional relationship from oil price to renewable energy consumption is found in the short run. In addition, they revealed that there is no cointegration relationship between renewable energy consumption, economic growth, international trade, and oil price when the renewable energy consumption is a dependent variable.
Alege [
21] investigated the link between renewable energy consumption, as percentage of total energy consumption, real GDP, CO2 emission, and crude oil prices by using panel cointegration and the pair-wise Granger causality tests for 40 countries in Sub-Saharan African countries over the period from 2001 to 2014. The panel co-integration test concluded the existence of co-integration relationship between variables. Also, the results of the study indicated an absence of causality between renewable energy and oil prices. Deniz [
5] found that oil price has a positive effect on renewable energy, as a share of total final energy consumption, for oil importing countries, and a negative effect for oil exporting countries employing GMM and panel vector auto regression (VAR) techniques to data over the period of 1995–2014. Nguyen and Kakinaka [
6] studied the drivers of renewable energy consumption for panels of countries depending on income levels, and found positive and statistically significant impact for low- and high-income countries and insignificant negative impact for middle-income countries, where Azerbaijan is included. However, since they used panel data, the results might not be relevant for each specific country, since the estimated parameters are average for used group, and country-specific parameters are not estimated/reported. Bamati and Roofi [
7], examining the same relationship, found positive impact of oil price on renewable energy consumption for both panels of developing and developed countries.
In the case of Azerbaijan, Mukhtarov et al. [
22] only studied the existence of causality between energy consumption and economic growth, while Mukhtarov et al. [
23] investigated the impact of financial development and economic growth on energy consumption and did not use renewable energy consumption.
In addition to the studies exploring the relationship between renewable energy consumption and its main drivers, there is a vast literature devoted to machine learning techniques to deal with modeling, forecasting, choosing optimal mix, etc., of different renewable energy types [
24,
25,
26]. However, since we are reviewing the papers employing time series econometric techniques and not investigating optimal mix nor working on forecasting renewable energy, we will not review such papers.
As can be seen from the literature, there is no research devoted to the determinants of renewable energy consumption in the case of Azerbaijan utilizing country-specific time series data. Considering all the above-mentioned facts, the main purpose of this paper is to fill in this gap by employing a structural time series modeling (STSM) approach by Harvey [
10] to observe the relationships between renewable energy consumption, economic growth, CO
2 emissions, and oil price. The contribution of the study is listed as follows: (a) It studied the renewable energy consumption–economic growth relationship in the case of Azerbaijan, which has not been investigated under an energy–income framework, and might be a good representative for the similar economies; (b) to the best of our knowledge it is the only individual time series study investigating the oil price impact on renewable energy consumption in case of oil-exporting developing country; (c) it uses the STSM approach, which takes into account different aspects of the examined data and features of existing relationships such as potential stochastic nature of parameters of interest.
4. Theoretical Framework and Functional Specification
To derive the functional specification, which theoretically relates renewable energy consumption to its drivers, we apply the Lagrange multiplier technique to optimization exercise, where the minimization of the cost function (1) is looked subject to the constraint (2). Expression (2) is a conventional Cobb-Douglas production function with four inputs.
Here
C is a cost function,
K is capital,
L is labor,
R is renewable energy consumption,
N is non-renewable energy consumption,
are respectively prices of capital, labor, renewable and non-renewable energy consumption;
A is a scaling factor and
are powers of respective production inputs.
Q is output,
K,
L,
R, and
N are as defined above. Following Senhadji [
27], Abbas and Foreman-Peck [
28], Verner and Chudarkova [
29], Barros [
30], inter alia, with respect to considering physical and human capital as two different inputs into production function, we also consider renewable and non-renewable energy types as two different energy inputs into production function. Applying the first order conditions for the minimization problem the following specification for renewable energy demand can be found:
where:
,
,
,
.
As can be seen from the definition of coefficients, since is positive number, the coefficient of price of renewable energy consumption is negative number, while all other coefficients in (3) are positive numbers.
Further, as in Nordhaus [
31], we assume that the economy’s overall demand function is given by the following demand equation:
where
are as defined above,
Y is overall income level.
. Then, assuming that the market is under equilibrium, one can solve (3) and (4) together. In other words, we can replace lnQ in (3) with its expression in (4). Then we get the following specification for renewable energy consumption:
where
Based on the signs of the coefficients in definitions, what is sure from (6) is that
. When it comes to other coefficients in (5), based on (6) one can conclude that mathematically their signs might be positive and negative, depending on the absolute magnitudes of the two terms in the formulas. From the theoretical standpoint, if renewable and non-renewable energy types are alternatives for each other,
is expected to be positive. While if they are not alternative goods the same coefficient might be positive. As discussed in the Literature Review section, empirical studies [
4,
6,
7,
8,
9] concluded different signs for different country cases.
Following the specification used by studies such as Sadorsky [
16], inter alia, we also include CO
2 emissions to our functional specification as one of the explanatory variables, to check if environmental issue is a concern for the chosen country case. The inclusion of CO
2 emissions to the modeling framework is also in line with general to specific (Gets) approach [
32], which suggests to add a variable (s), which a researcher thinks is relevant, and then decides whether to retain or exclude based on statistical tests. In addition, since the price of renewable energy is a composite indicator and there is not a well-developed renewable energy market in Azerbaijan, its price is dropped from the specification. Therefore, the functional specification is chosen based on the theory and country-specific features.
Considering the derived functional specification and mentioned points, in the current paper renewable energy consumption is modelled as a function of real per capita income, per capita CO
2 emissions, and oil price in real terms. Namely, the functional specification can be expressed as follows:
where
RECt is renewable energy consumption,
CO2,t is carbon dioxide emissions in per capita terms,
GDPt is gross domestic product in per capita terms, and
OPt is oil price,
εt is an error term.
are the renewable energy consumption elasticities with respect to income,
CO2,t emissions, and oil price, respectively.
6. Econometric Methodology
As a first step, the variables are tested for stationarity properties, and then the existence of the long-run co-movement between the variables is tested.
The widely used augmented Dickey–Fuller (ADF) [
34] and Zivot and Andrew (ZA) [
35] tests are employed for testing the stationarity features of variables, while for testing the cointegration relationship the trace test for cointegration by Johansen [
36] is utilized.
The reasons of motivating the usage of the STSM can briefly be summarized as follows: (1) Different structures of time series data such as stochastic trend, seasonal effects, cyclical effects can easily be handled; (2) it enables detection in sample interventions, which might result in misspecification, distortion of parameter estimations if one omits them [
37]; (3) it allows to treat and test whether the parameters vary over time or they are constant for the estimation period [
10]; (4) the cointegration relationships also can be modeled in this modeling framework [
10,
38,
39]; (5) it also enables to use and model the dynamic autoregressive distributed lagged specification (ARDL); (6) the found ARDL specification then can be articulated as a conventional error-correction model (ECM) [
10]; (7) the ECM form in its turn allows to have separate long- and short-run coefficients in addition to speed of adjustment coefficient [
10]; (8) it allows to model long-run and short-run relationships simultaneously. Following the
Gets approach, first the general unrestricted model (GUM) is estimated using two lags in ARDL specification, and then the final model is chosen based on the diagnostic tests. The STSM methodology can be briefly expressed as follows:
here:
is the dependent variable;
is a vector of slope, level, seasonal, and cycle components of
. These components might be stochastic.
is the vector of independent variables;
is error term;
and
are parameters to be estimated. These parameters also might vary over time.
T is the number of observations. The model (2) can be expressed in state-space form as follows:
Equation (9) is called observation or measurement equation, (10) is referred to as a state or transition equation. H is a matrix relating the parameters and lagged values of the components of the independent variable, I is a unit matrix. If , then the components of a dependent variable are deterministic. Similarly, if then it means the parameters of independent variable are constant over time.
More specifically, in the empirical estimations we used the following GUM with one lag:
where
are logarithmic expressions of renewable energy consumption, GDP, CO
2 emissions, and oil price, respectively.
are coefficients to be estimated,
is an error term. The long-run elasticities are calculated using the below formulas:
where
are long-run income, CO
2 emissions, and oil price elasticities of renewable energy consumption, respectively. The formulas (12) are used after choosing the final model, hence some of the coefficients in (11) and consequently in (12) might be zero in the final specification.
The STSM approach utilizes maximum likelihood estimator and Kalman filter algorithm [
40]. Harvey [
10], Commandeur and Koopman [
41], Dordonnat et al. [
42] are valuable references for detailed information on STSM approach.
7. Empirical Results and Discussion
The unit root features of variables are tested first, and the test outputs are presented in
Table 3. In unit root exercises we used both cases, namely the intercept only and intercept and trend case for the level variables, and intercept only case for differenced variables. In the former case the trend was found to be insignificant. Hence, for level and differenced variables we reported the intercept only case results. As can be seen from ADF and ZA tests results, the first differences of all variables are stationary. Hence, we can test the variables for sharing the common long-run trend.
As discussed in Juselius [
45] if the sample size is small, the asymptotic distributions of conventional cointegration tests, in general, poorly approximates to the actual distributions. There are a number of studies revealing the considerable size and power distortions when the asymptotic tables are used. As a solution, the use of bootstrapped tests or the small sample correction techniques, such as Johansen [
36], among others, are suggested [
45]. Acting on this suggestion we employed the trace test but used the bootstrapped critical values. The bootstrapping is performed in CATS-3.00 package. The cointegration test results are tabulated in
Table 4.
As can be seen from
Table 4, the cointegration test concludes one cointegration relationship among the variables. Therefore, concluding the existence of cointegration among the variables, we used the structural time series modeling (STSM) approach by Harvey [
10] to estimate coefficients of the long-run relationship. We estimated the ARDL specification as in Equation (11). Based on the
Gets approach, the final chosen ARDL specification is:
Hence, based on the (12) formulas, the long run estimation results of STSM are given in
Table 5.
In the outcomes of the residual diagnostics tests (bottom part of
Table 5), residuals are stable, the existence of serial correlation and heteroscedasticity problems, and non-normality of the residuals are not observed.
The estimation results concluded that
GDP has a statistically significant and positive impact on renewable energy consumption. The results reveal that a 1% increase in real GDP per capita results in a 0.12% increase in renewable energy consumption. The positive impact of income on renewable energy consumption indicates that as a country uses its increasing revenues toward transition to renewable sources, the impact is relatively smaller. Having a positive and significant impact of GDP, our finding is in line with the conventional expectation. We also find that oil price has a statistically significant decreasing impact. This indicates that renewable energy consumption responses by 0.55% decrease to a 1% increase in oil price. It means that an increase in oil prices decreases renewable energy consumption. The found negative impact of oil price result is in line with findings of Sadorsky [
16] for G7 countries, Salim and Rafiq [
9] for China and Indonesia, and Omri and Nguyen [
8] for 64 countries, while it is opposed to Tuzcu and Tuzcu’s [
19] results for oil-exporting country cases, and Nguyen and Kakinaka [
6] for middle-income country cases, who found it to be insignificant. The difference might be explained with the facts such as country-specific features which can be lost while using panel estimation techniques. In addition, the effect of CO
2 emissions on renewable energy consumption is found to be negative and statistically insignificant.
8. Conclusions and Policy Suggestions
The study examines the impact of economic growth, CO2 emissions, and oil prices on renewable energy consumption. The tests for unit root examination concluded that all the variables have the same integration order, being one. Therefore, one can test the existence of cointegration relationship among the variables. The bootstrapped trace cointegration test concluded existence of long-run co-movement. The STSM method is utilized in the estimations of long-run relationship. Empirical estimation results indicated that there is a positive impact of economic growth on renewable energy consumption, while the impact of oil prices on renewable energy consumption is found to be negative for the period of investigation. The relatively higher and negative impact of oil price on renewable energy consumption can be interpreted as follows. The country still enjoys the environment of higher oil prices, which delays the transition from conventional energy sources to renewable energy consumption. The results also reveal that the impact of CO2 emissions on renewable energy consumption is negative and statistically insignificant. The insignificance of the impact of CO2 emissions on renewable energy consumption also confirms the relative unwillingness toward renewable sources, i.e., increase in CO2 emissions and environmental degradation does not push country toward the environmentally friendly energy path. Although there have been, as discussed in the Background section, a number of policies and successful steps taken toward transition to renewable energy sources, as empirical research results revealed there is still a substantial way to go. As discussed in the Background section, Azerbaijan has implemented a number of policies to increase the generation of renewables, but since many of them took place after the study period we could not see their result. In addition, the period of investigation includes quite a long period of high oil price regime from 2004 to 2014. Hence, to see the impact of lower oil prices further data is needed. The employed econometric technique allows to see if there is asymmetric response to different price behaviors, however, for the studied period the response of renewable energy consumption did not reveal asymmetric response to oil price changes. The findings of the study allow to conclude that increasing the share of renewable energy in the energy consumption portfolio should be considered as one of the targets to diversify the economy and reach the sustainable economic development goals. In other words, considering that oil resources are limited, and second the use of fossil fuels has negative impacts on environment, the production and consumption of renewable energy consumption should be targeted in the long run. In parallel to providing better energy services to domestic consumers, with subsidized prices or different types of subsidies, producers and consumers should be motivated toward renewables establishing long-run policies and directing oil revenues and local and international financial resources to finance renewable projects. It is worth noting that, as a future research question, it would be interesting to investigate the impact of oil prices on renewable energy consumption after the oil price dropped in 2014, especially considering the recent substantial decline in oil prices. In addition, the current study investigated the oil price impact on renewables only for one oil-exporting country case for the chosen period, and to reveal the response for other oil-exporting country cases it requires separate research, taking into account the country-specific features. Although one might think of using the panel of oil-exporting countries to investigate the issue, since oil-exporting countries differ substantially according to their development stages and based on the ongoing policies in relevant economies, it would be better to conduct individual time series data based techniques to see the response in each country case and suggest country-specific insights.


